Article

Impact of Long Term Nutrient Management on Soil Quality Indices in Rice-Wheat System of Lower Indo-Gangetic Plain

1
Department of Agricultural Chemistry and Soil Science, Bidhan Chandra Krishi Viswavidyalaya, Mohanpur 741252, West Bengal, India
2
Division of Soil & Crop Management, ICAR—Central Soil Salinity Research Institute, Karnal 132001, Haryana, India
3
Division of Soil Science and Agricultural Chemistry, ICAR—Indian Agricultural Research Institute, New Delhi 110012, Delhi, India
4
Soil and Land Resources Assessment Division, Land Use Mapping and Monitoring Group, National Remote Sensing Centre, Hyderabad 500037, Telangana, India
5
Dr. Kalam Agricultural College, Bihar Agricultural University, Kishanganj 855107, Bihar, India
6
Soils Unit, Bangladesh Agricultural Research Council, Farmgate, Dhaka 1215, Bangladesh
7
Department of Agronomy, Sri Karan Narendra Agriculture University, Jobner 303329, Rajasthan, India
*
Authors to whom correspondence should be addressed.
Sustainability 2022, 14(11), 6533; https://doi.org/10.3390/su14116533
Submission received: 13 April 2022 / Revised: 11 May 2022 / Accepted: 23 May 2022 / Published: 26 May 2022

Abstract

:
Globally, soil degradation is an important issue for sustainable crop production. Soil quality indicators are the soil attributes that address the ecological functions of soil. Therefore, indicator-based soil quality assessment has been emphasized for quantifying the relative soil quality changes in different nutrient management systems. Soil quality underthe rice (Oryza sativa L.) and wheat (Triticum aestivam L.) cropping system was assessed using a modified “Soil Management Assessment Framework (SMAF)” model. Soil’s physical, chemical, nutritional, and biological indices were analyzed for different nutrient management strategies, viz., inorganic fertilizer (NPK), NPK + 7.5 Mg ha−1 farmyard manure (NPKF), NPK + 10.0 Mg ha−1 paddy straw (NPKP) and NPK + 8.0 Mg ha−1 Sesbania sesban L. green manure (NPKG). Nutrient management strategies significantly influenced soil quality indices. NPKF showed the highest SMAF score for soil physical quality index followed by NPKP > NPKG > NPK and control; whereas the score of soil chemical quality was greater in NPKP followed by NPKF/NPKG > NPK > control (p > 0.05). Overall, the soil nutritional quality index was greater in NPKF (0.96) followed by NPKG > NPKP > NPK, and the least was in control. The SMAF score of soil biological quality index was highest in NPKF compared to NPKG > NPKP > NPK > control. The wholesome index of SMAF (SQI) was developed withthehighest score in NPKF (0.94) followed by NPKG (0.90) > NPKP (0.89) > NPK (0.79) > control (0.71). The β-glucosidase activity, mineralizable C, KMnO4 oxidizable N, microbial biomass C, and total water-stable aggregates explained 82% variability in the dataset and represented a good agreement with system yield (R2 = 0.89, p < 0.05). This study concludes that the conjunctive application of NPK with manures restores the overall soil quality more than other management practices, and thatthe SQ indices can be utilized for screening the best management practices for rice-wheat and other similar cropping systems.

1. Introduction

Soil quality assessment is complex and difficult to represent simply because of the intricacies and versatility in the composition ofthesoil medium [1,2]. The climate, ecology, and anthropogenic perturbation also contribute to the spatio-temporal variability in soil properties [3,4]. Soil in the ecosystem has to perform multifarious everlasting ecological services to mankind viz. crop stand and support, filtering, buffering, and detoxifying nature, a habitation for the gene pool, and cultural richness and national heritage [5,6]. Maintaining soil health is an overarching issue of the day. Repeated attempts have been made to develop a conceptual understanding and know-how about soil quality [7,8]. Even then, developing quality indices for easy and common representation of soils from varied agro-ecosystems is still a researchable issue [3,9,10,11,12,13,14]. The extent of the relationships among soil attributes and their contribution in describing soil quality/and the ecological functions of soils are still needed. Several researchers [15,16,17] developed the “Soil Management Assessment Framework (SMAF)” for easy and common representation of soil quality for specific management practices to address the ecological functions of soils. The SMAF is very sensitive to ecosystem functions and accommodates several soil physical, chemical, and biological indicators [1,4,18]. In SMAF, ten soil attributes: macro-aggregate stability, bulk density as soil physical; pH, electrical conductivity as soil chemical; extractable P and K for soil nutritional attributes; soil organic C, microbial biomass C, potentially mineralizable N, and β-glucosidase activity for microbial or metabolic were used to develop a score [15,16,17,19]. Individually, these attributes are primary indicators for predicting the different ecological functions of soil. However, a comprehensive SMAF score is more effective in describing the ecological functions of soil under different agroecology, climate, and agricultural practices.
The rice-wheat system occupies about 18 million ha in Asia, of which 13.5 million ha reside in the Indo-Gangetic Plains (IGP) of Bangladesh, India, Nepal, and Pakistan, andthisfeeds about a billion people [20]. The continued rice-wheat cropping system has led to the decline in factor productivity and increasedthecost of cultivation [21]. The continued practice of puddled transplanting rice followed by wheat had negatively affected the soil quality because of structural degradation, subsurface compaction and nutrient imbalance [22,23,24]. Intheabsence of a proper soil health assessment framework, farmers usedmore fertilizers as part of a random blanket application approach [4]. These faulty practices promote nutritional imbalance in crops [25,26]. On the other hand, mono-cropping and fertilization imbalance, non–accommodation of legume crops, low organic supplement, and no return/burn/removal of crop residues makes the soil more compact, less fertile, and less lively [27]. It is well known that the return of organic amendments to the soil is difficult because of the diversion of manure and crop residue to meet the energy needs in developing countrieslike India [28]. However, therecent initiative of the Government of India to supply fuel to rural households has increased the possibility of returning farmyard manure (FYM) in cultivated soils. FYM, green manuring and paddy straw had shown the benefits of maintaining soil fertility, sequestration of organic C, and sustaining crop productivity [29,30,31,32]. Therefore, these limited available resources within the targeted ecosystem can play a stewardship role in sustaining soil health if management practices are based on the holistic soil quality and the goals of the soil ecological function. We hypothesize that the SMAF score-based indexing system can guide the achievement of the desired functional goals. Therefore, this study was undertaken to screen out the soil attributes for suitable and robust SMAF scoring. The objectives of the study were to (i) optimize the soil attributes for the SMAF based soil quality index to express the ecological functions of soils, and (ii) to assess the impact of management practices on each segment of SMAF.

2. Materials and Methods

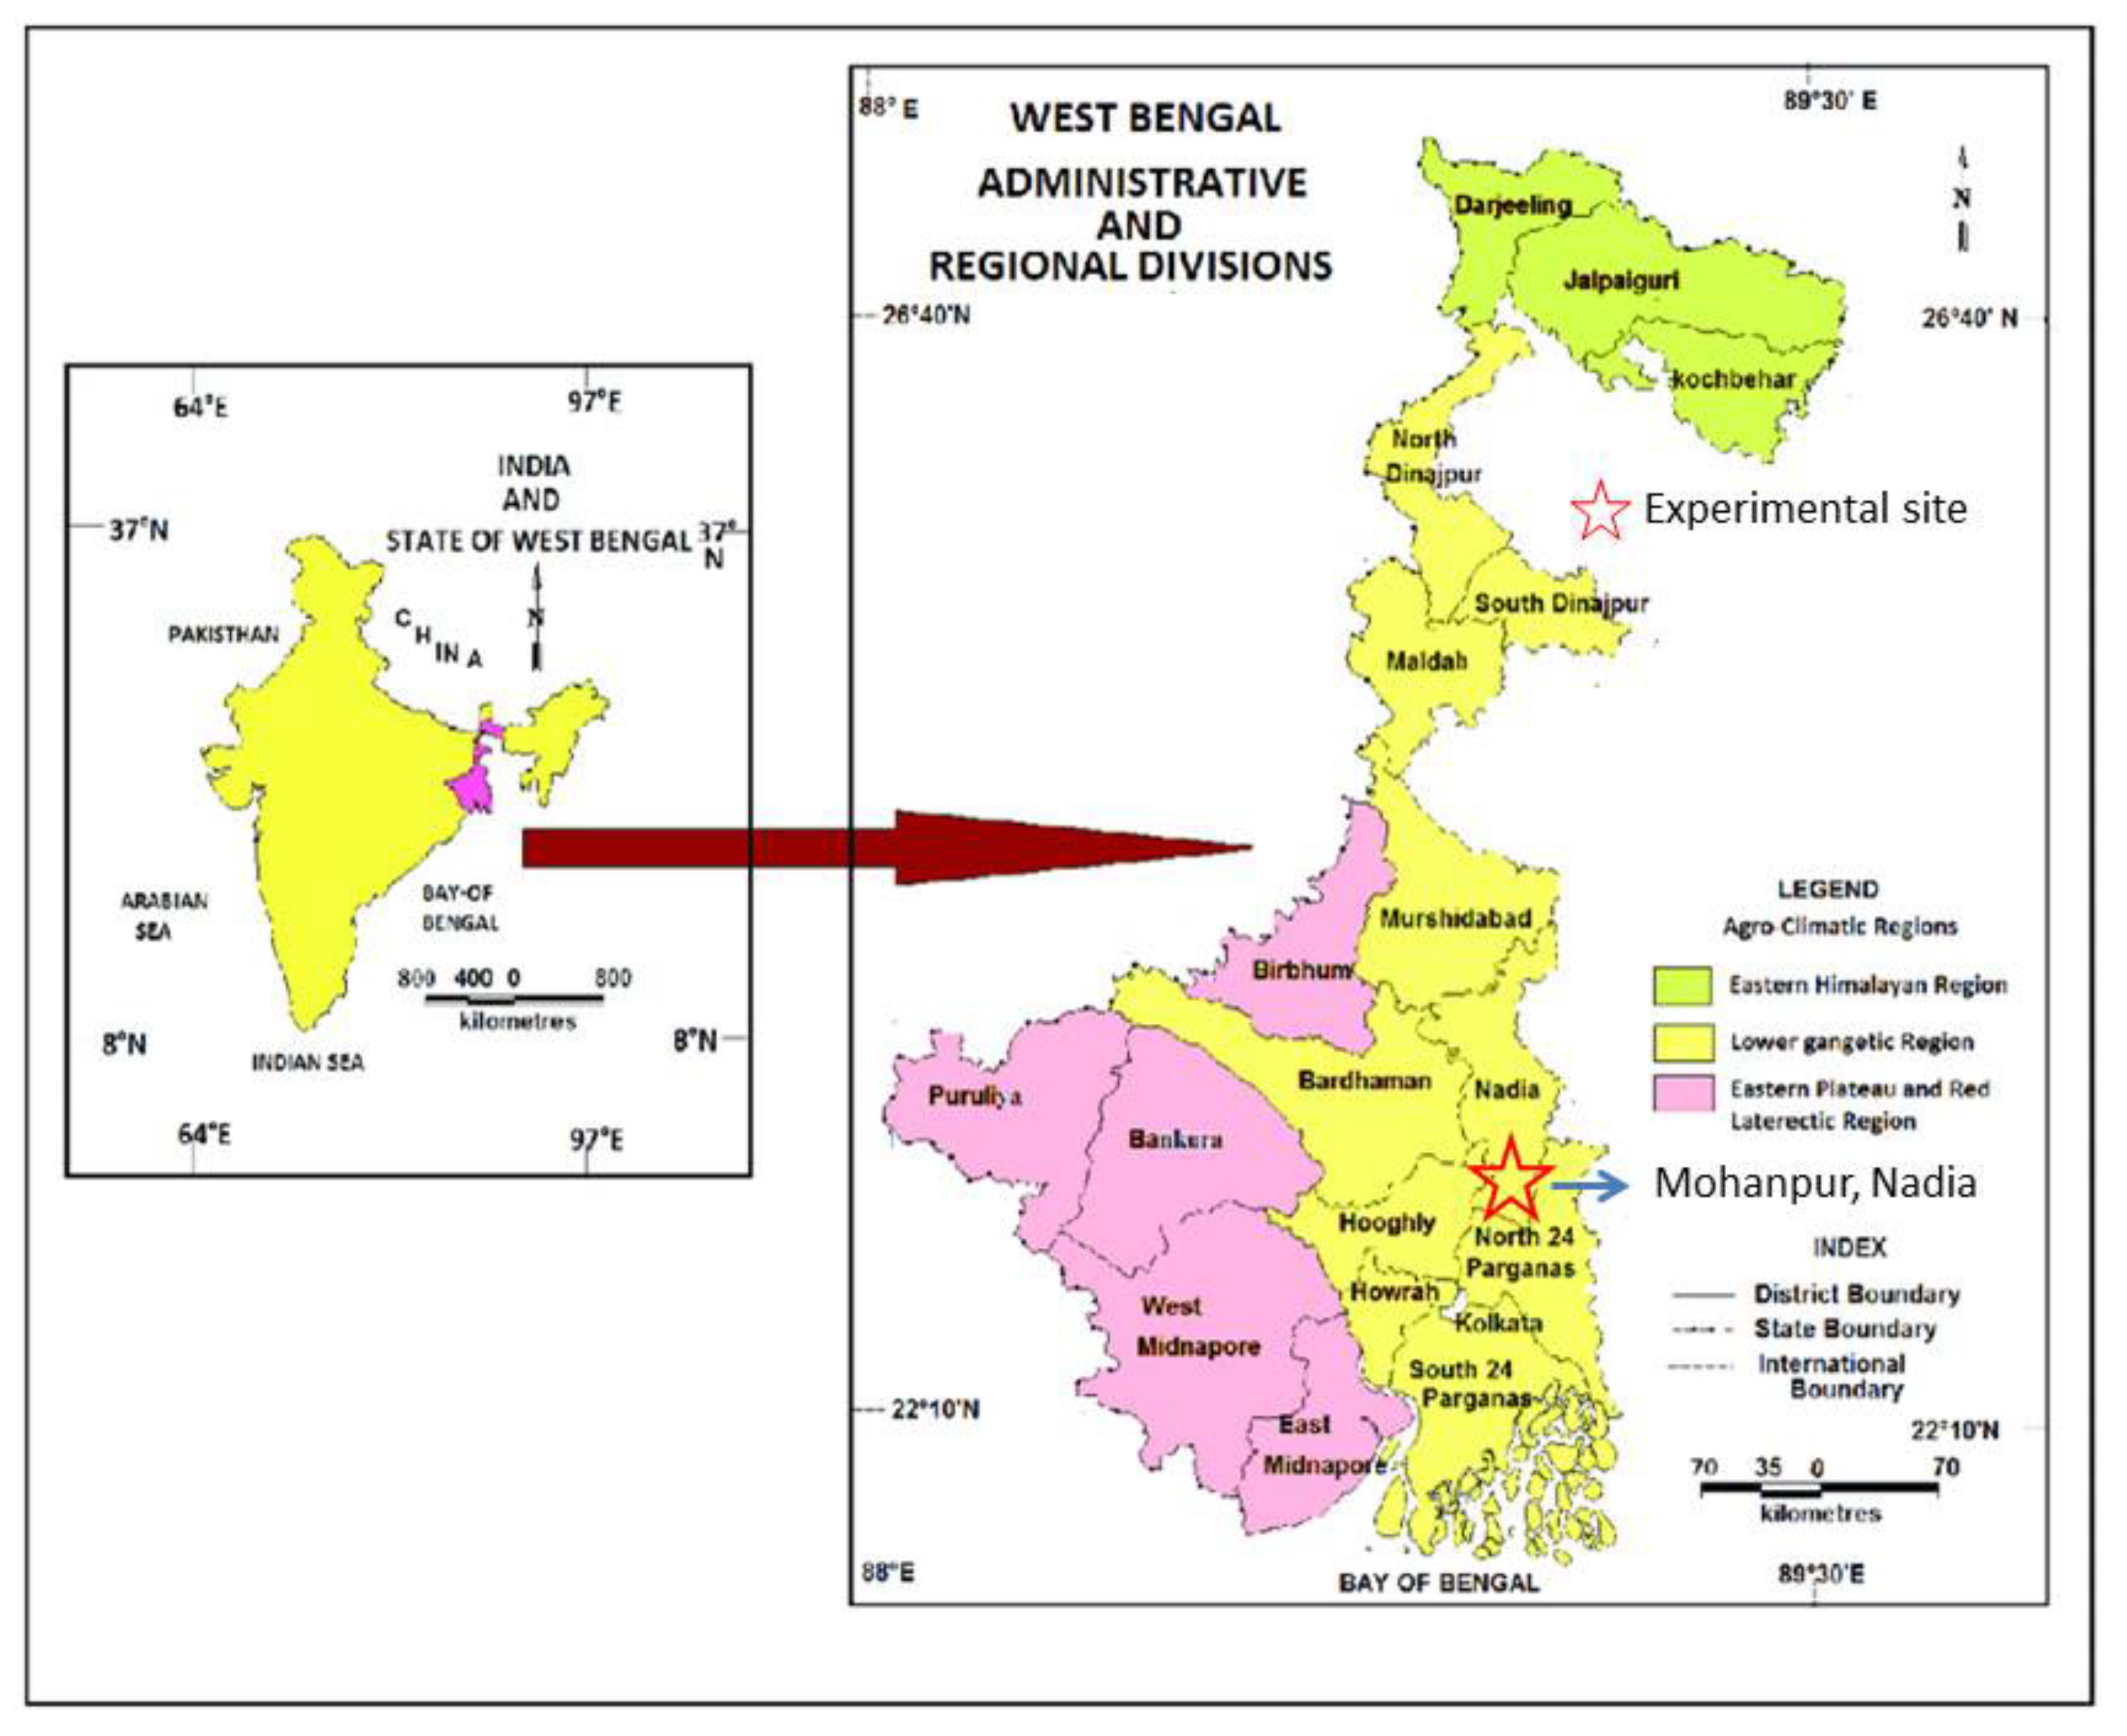
2.1. Sampling Location and Soil Properties

The field experiment with rice-wheat rotation was started in 1986 at the University Teaching Farm, Bidhan Chandra Krishi Viswavidyalaya, Mohanpur, West Bengal, India (Figure 1). The climate of the area is hot, humid and subtropical. Mohanpur usually receives an average annual rainfall of 1480 mm. The mean annual minimum and maximum air temperatures are 12.5 and 36.2 °C, respectively. The soil falls under Inceptisols order and is sandy loam in texture (hyperthermic Aeric Haplaquept according to U.S. Soil Taxonomy). The pH of the initial soil was 7.2 and contained 50, 29.5, and 20.5% of sand, silt, and clay, respectively. It had an oxidizable [33] organic C of 8.8 g kg1, a bulk density of 1.2 Mg m3, and a cation exchange capacity of 22.0 cmol(P+) kg1recorded in the soil at the beginningof the experiment.

2.2. Fertilizer Treatments and Agriculture Management

The experiment was laid out in a randomized block design with the following treatments: fallow [these are no-tilled plots and no intercultural operations (puddling and irrigation) except need-based hand weeding were carried out]; control (no N, P, and K fertilizers or organics); 100% recommended dose of inorganic fertilizer (NPK); NPK + farmyard manure (NPKF); NPK + paddy straw (NPKP); and NPK + green manure (Sesbania sesban L.) (NPKG). Each treatment was replicated four times. For treatment of NPK, the State Agriculture Departments’ recommended dose (Kg ha-1) of fertilizers for rice and wheat crops at 120-60-60 and 100-60-40 of N, P2O5, and K2O, respectively, were applied in the form of urea, single super phosphate, and muriate of potash. Well decomposed FYM (with total C and C/N ratio of 33.3% and 66.6) (7.5 Mg ha−1), green manure (with total C and C/N ratio of 41.4% and 24.3) (GM) (8.0 Mg ha−1), and paddy straw (with total C and C/N ratio of 42% and 97.9) (10.0 Mg ha−1) for treatment NPKF, NPKG, and NPKP, respectively, weremanually spread uniformly on the surface of the specified plots (size: 8 m × 8 m) on a fresh–weight basis. The amounts of the NPK in NPKF, NPKP and NPKG were adjusted for the nutrients supplied through organics. The mean nutrients content (in percent) on dry weight basis were as follows:moisture level 20% of FYM (N:P:K = 0.58:0.36:0.3), GM (N:P:K = 2.65:0.16:0.46) and PS (N:P:K = 0.81:0.22:0.52). The organics were mixed thoroughly into the soil twodays before puddling using a power tiller. Rice (O. sativa L., cv. IET 4094) and wheat (T. aestivum L., cv. UP 262) were grown annually following standard practices. Rice was harvested on the whole–plot basis at maturity from ground level. After the harvest of paddy, the field was plowed thoroughly with a tractor-drawn disc plough followed by harrowing and planking. The wheat crop was sown in the first fortnight of December at 20 cm distance between rows. The wheat crop was generally harvested in the last week of March. The yield data of individual crops for the last twenty–four years was also collected andtheequivalent rice yield (ERY) was calculated for each of the treatments for expressing the yield in a common unit [34].
ERY   R W = Grain   yield   of   wheat   × unit   price   of   wheat unit   price   of   rice +   rice   yield

2.3. Soil Sampling

Three representative field–moist soil samples were collected from each of the plots in each replication from 0 to 0.2 m depth with a bucket auger on the seventh day after the rice harvest in 2010. A part of the soil samples collected from each of the sites were processed and stored in refrigerated conditions at 4 °C for analysis of biological attributes. The other part was dried at room temperature, ground, and sieved (2.0 mm nylon sieve) for analysis of chemical attributes. The samples were taken separately for analysis of soil physical attributes.

2.4. Soil Physical Analysis

Bulk density was determined by a core sampler of 5.0 cm in length and 5.0 cm in diameter of the core with an average across the four depths of 0–5, 5–10, 10–15, and 15–20 cm [35]. Soil clay content was estimated by the International pipette method after treating the soil with hydrogen peroxide [36]. Water–stable aggregates were determined by the wet–sieving technique in aggregate size classes of >2000, 1000–2000, 500–1000, 250–500, 100–250 µm [37].

2.5. Soil Chemical and Nutritional Analysis

Soil pH was determined in a 1:2.5 ratio of soil: water suspension. As it was non–saline neutral soil, the cation exchange capacity (CEC) and exchangeable Ca2+, Mg2+was measured through leaching exchangeable cations (Ca2+, Mg2+, Na+ and K+) by neutral N NH4OAc and subsequent removal of excess salts by 60% alcohol [38]. The oxidizable organic C was determined following Walkley and Black’s [33] wet–oxidation method. An alkaline permanganate method [39] was followed to determine the KMNO4 oxidizable N. Olsen’s extractable P(soil pH > 6.0) which was determined by the ascorbic acid reductant method [40]. Potassium (K) was extracted by neutral N NH4OAc and detected by flame photometer [40]. S was extracted by 0.15% CaCl2 and determined turbidimetrically using barium chloride [41]. DTPA extractable Fe, Mn, Zn, and Cu were determined using an Atomic Absorption Spectrophotometer (PerkinElmer, PinAAcle 900F) [42] and available B was determined by spectrophotometrically following the azomethine-H method [43].

2.6. Soil Microbiological Analysis

Microbial biomass C and N (MBC, MBN) were determined bythefumigation extraction method [44]. MBC was computed form C-flush after fumigation using the relationship: MBC = {(1/0.38) × C-flush} [45]; and MBN was computed form N-flush after fumigation using conversion factor (KEC) 0.38 [46]. Mineralizable C (Cmin) was measured by capturing the CO2–C evolution method. The amount of CO2 evolved during the 23 days incubation period was absorbed in 10 mL 0.5 NNaOH. The amount of evolved CO2 was calculated by titrating the alkali in the traps with 0.5 NHCl to a phenolphthalein endpoint as outlined by Anderson (1982). Aerobic incubation was followed for determining mineralizable N (Nmin) [47]. Ammonium and nitrate–N were extracted using 2.0 MKCl. Net N mineralization was estimated by subtracting the initial from final NH4 and NO3 content. The dehydrogenase activity (DHA) was determined by the reduction of 2, 3, 5–triphenyl tetrazolium chloride (TTC) [48]. Fluorescein diacetate hydrolyzing activity (FDHA) was measured by determining fluorescein at 490 nm wavelength [48]. Urease activity (URE) was determined by measuring the NH4 released when 5.0 g of soil was incubated with 9 mL of 0.05 Mtris (hydroxymethyl) aminomethane (THAM buffer at pH 9.0) and 1 mL of urea solution of 0.2 M at 37 °C for 2 h [48]. The NH4–N released was determined by steam distillation of an aliquot of the resulting soil suspension with MgO for 4 min. β-glucosidase (β-glu) activity was estimated through enzymatic hydrolysis of β-glucopyranoside to p–nitrophenol and extracted by CaCl2–NaOH solution [48].

2.7. Developing Soil Management Assessment Framework (SMAF)

Eleven soil attributes were used to describe the soil quality index (SQI) using SMAF [15,16]. Among them, total macro–aggregate stability and bulk density are soil physical attributes; soil pH and cation exchange capacity are chemical attributes; KMnO4–N, DTPA–Zn, and hot water extractable B are soil nutritional attributes; Walkley and Black organic C (WBOC), microbial biomass C, mineralizable C, and β-glucosidase activity are microbial or metabolic activity. These attributes were selected to address various ecological functions of soil viz., the physical medium and to support plant growth (total macroaggregate stability and bulk density); energy-food web of the soil (microbial biomass C, mineralizable C, KMnO4–N, DTPA extractable Zn, and hot water extractable B limiting to the studied ecoregion) [26,49], cation exchange capacity and β-glucosidase); water availability and waste recycling (total macro-aggregate stability, bulk density, and WBOC); biodiversity and environmental protection and climate change abatement [bulk density, SOC, cation exchange capacity, (potentially mineralizable N is considered goal variable)]. Principal component analysis (PCA) of eleven soil attributes was performed [50]. The principal components having eigen values more than one were retained for screening of the minimum data set (MDS). In each PC, highly weighted factors, within ten percent of the highest weight, were taken for developing the minimum data set (MDS). The transformed MDS were integrated by linear scoring [7,10]. For all the MDS except bulk density (BD), a ‘more is better’ hypothesis was used to assign score, while for BD a ‘less is better’ approach was used. Attributes were ordered in descending or ascending order subject to whether a greater value was measured as “good” or “bad” in terms of soil function. In ‘more is better’ attributes, each observation was divided by the greatest calculated value such that this got a score of one. Oppositely, for ‘less is better’ attributes, the lowest calculated value was divided by each observation such that the lowest observed value obtains a score of one. Except for BD, attributes with the highest values were assigned a score of one. The overall SQI is the summing of score values of eleven soil quality attributes in one scale unit followed by dividing the score by the number of attributes considered. The physical, chemical, nutritional and biological soil quality indices were calculated following thesame procedure using physical (total macroaggregate stability and bulk density), chemical (pH and CEC), nutritional (KMnO4–N, DTPA–Zn and hot water extractable B), and biological (WBOC, microbial biomass C, mineralizable C, and β-glucosidase) properties, respectively. These indices developed for different management practices were compared with reference (control or fallow) soil with similar initial properties.

2.8. Statistical Analysis

Principal component analysis was performed to screen out the soil attributes [12]. Regression analysis was performed using equivalent rice yield (ERY) as dependent and the respective screened soil attributes as independent variables to investigate if the soil properties are related to the ecosystem function [11,51]. The treatment effect was tested using the analysis of variance (ANOVA) technique for a randomized block design using a SAS macro (http://stat.iasri.res.in/sscnarsportal; accessed on 7 April 2022). Pairwise comparison of the treatments were made using a Duncan’s multiple range test (p ≤ 0.05).

3. Results and Discussion

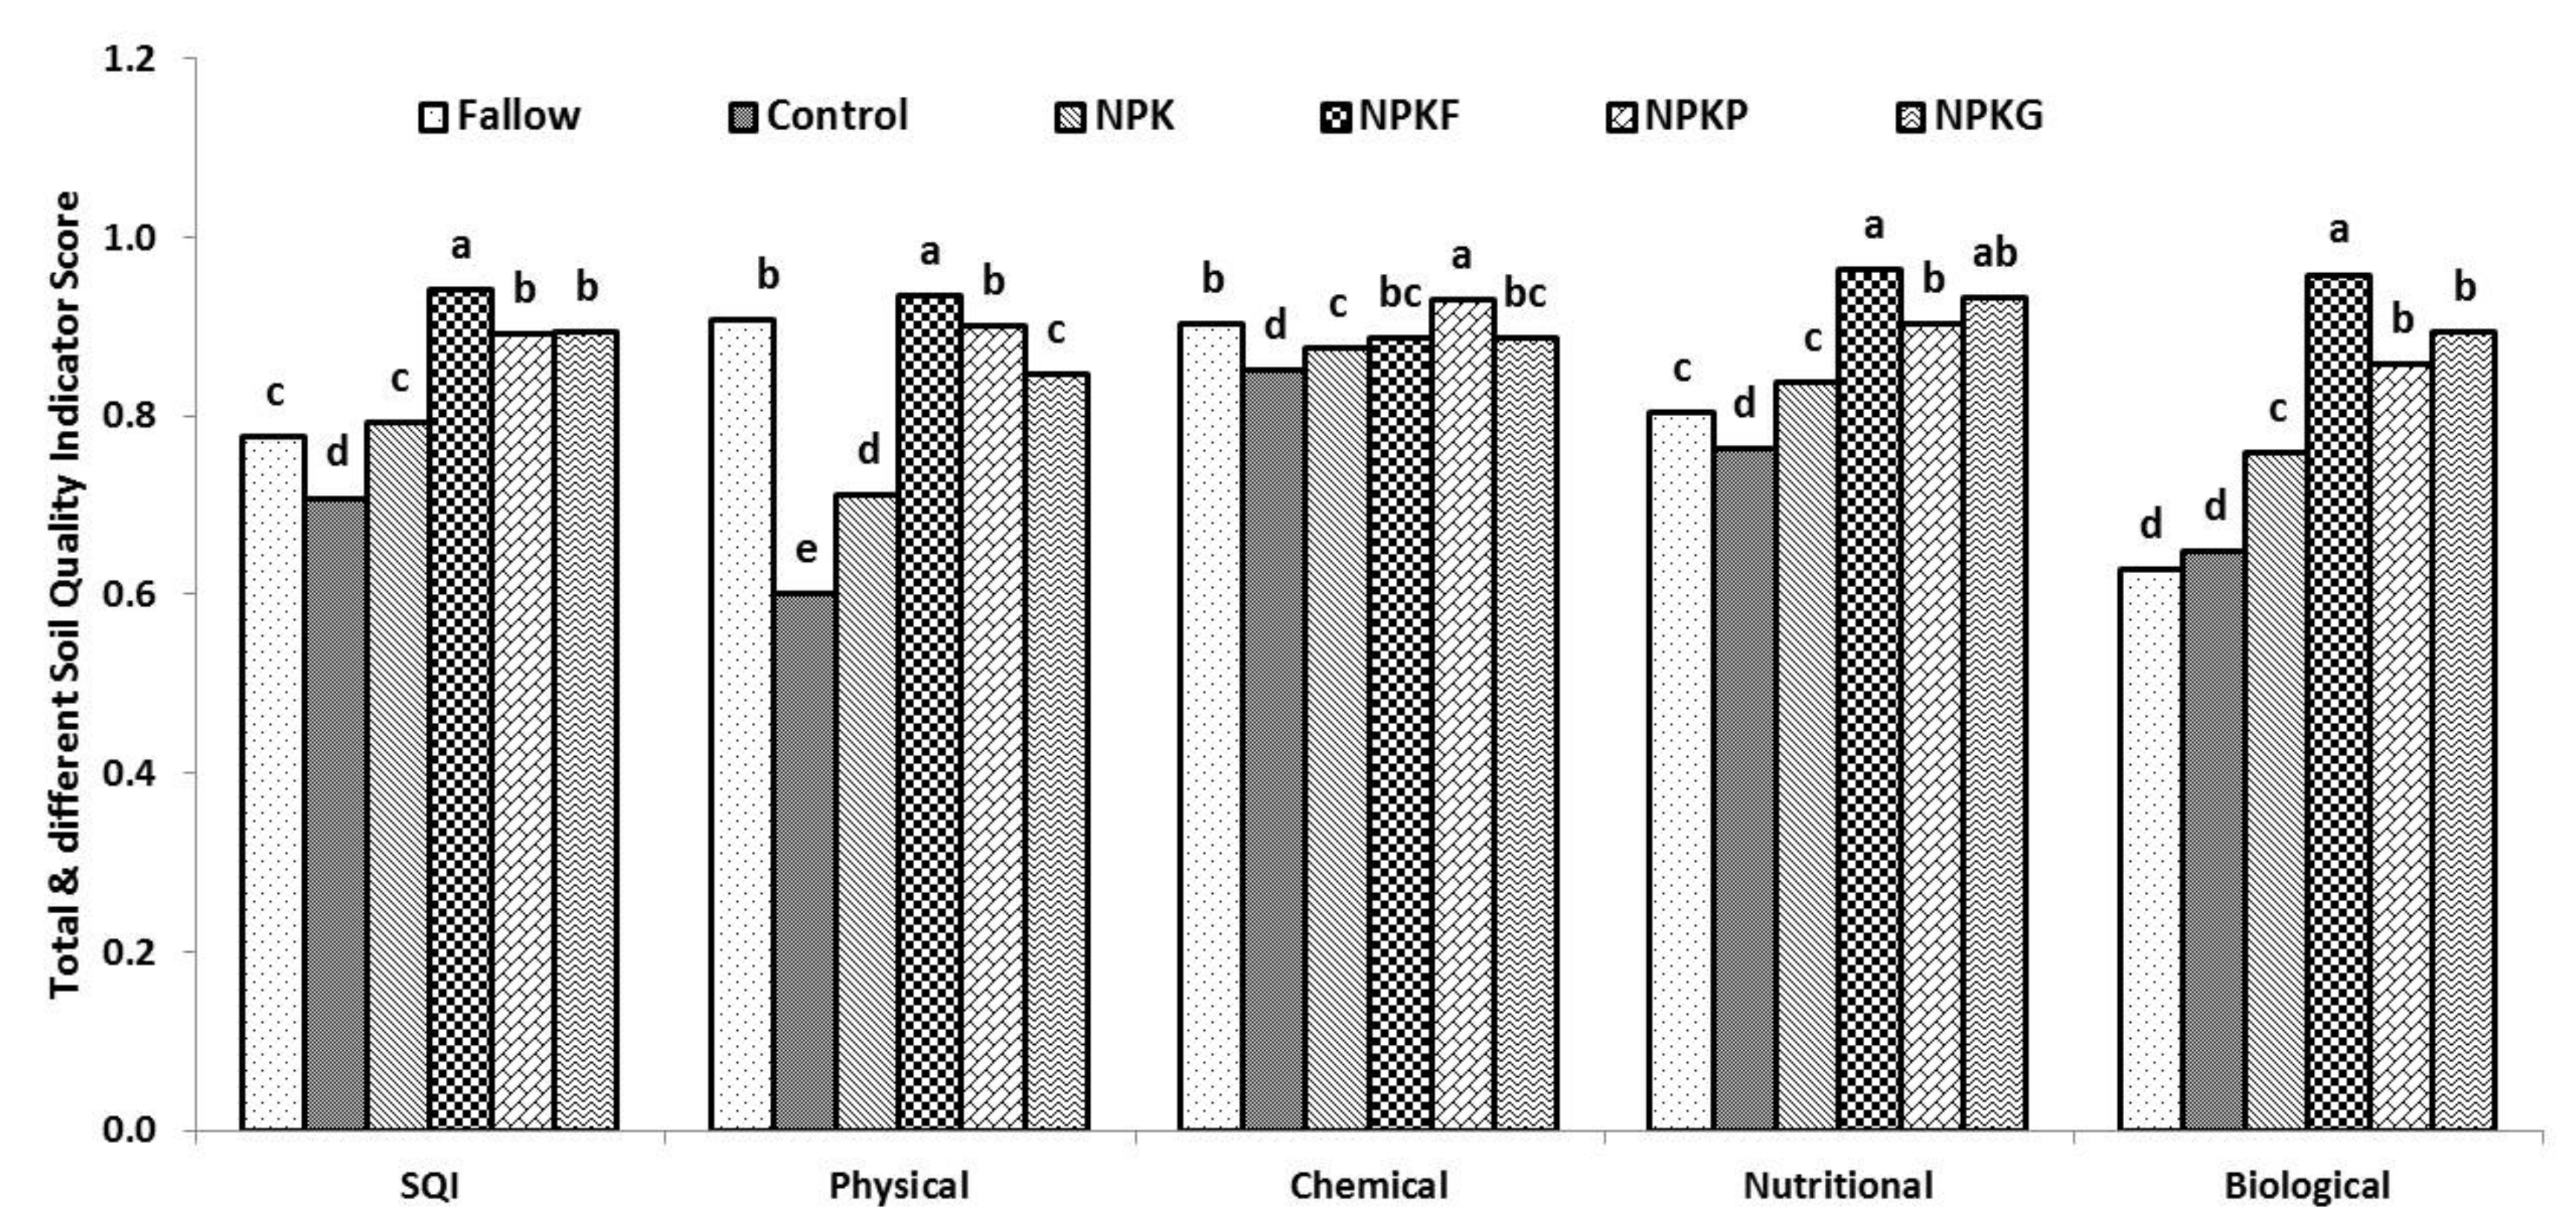
3.1. Physical Soil Quality Index

Total macroaggregate stability (TMacAS) is a general representation of soil aggregation, which was significantly affected by long–term cultivation as well as the application of NPK and NPK + organic amendments (p <0.05) (Table 1). The presence of only 21% TMacAS in the control was associated with destruction of the soil aggregates because of the periodic perturbation of the soil. Soil aggregation was improved with the additions of residue or manure with NPK even after perturbation. These organics contain an adequate amount of polymeric compounds viz., cellulose, hemicellulose, and lignin which can resist rapid decomposition and facilitate soil aggregation [52]. Among the organics, soil aggregation was poor in NPKG compared to NPKF and NPKP. Green manure had a narrower C:N ratio (13–20) than FYM (67) and PS (98) [34,53], and its succulent nature favored rapid decomposition which was mainly responsible for the low binding of soil separates and lower TMacAS. Bulk density was lower in NPKF, NPKP, and NPKG compared to fallow. High soil BD is a function of soil compaction. A significant negative correlation between BD and soil microbial properties showed the significance of lower bulk density in providing ideal hydrothermal conditions for the increased soil microbial activities [54]. The relative score value of BD was highest for NPKF (0.92) followed by NPKG (0.90) and NPKP (0.89). Mean values of TMacAS and BD constituted the physical soil quality index with NPKF (0.93) > NPKP (0.90) > NPKG (0.87) > NPK (0.72) and control (0.62) (p < 0.05) (Figure 2). Twenty–four years of nutrient management strategies significantly influenced this index (p > 0.05). NPKF showed the highest SMAF score of soil physical quality index with weighted values of 0.93, followed by fallow (0.91) and NPKP (0.90) and NPKG (0.85), NPK (0.71), and control (0.60). The nutrient management practices during the last two decades reduced ~35 and 23% of overall soil physical quality in control and inorganic NPK management compared to the NPKF, and a 21 and 34% decrement of the soil’s physical quality in control and inorganic NPK management compared to fallow. Furthermore, the deleterious impact of management practices was greater on soil aggregation compared to soil bulk density.

3.2. Chemical Soil Quality Index

Soil pH hadadirect effect on microbial activities, nutrient cycling, and crop growth. Soil pH was increased under different nutrient management practices by ~0.5 unit (Table 1). The SMAF score for pH was highest for fallow (0.94). Cation exchange capacity (CEC) was higher in fallow than control and NPK but less than NPKF and NPKP. Soil supplied with organics such as FYM, PS and GM carry functional groups which contributes to the variable charges in soil and thereby holding more soil exchangeable cations [55]. These observations are in conformity with earlier reports which showed a close relationship between effective CEC and SOC particularly inthesurface soil (0–30 cm depth) [56]. The chemical soil quality index was achieved by averaging the values of pH and CEC (Figure 2). In this index, the score values of NPKP (0.93) edged over fallow (0.9) and other integrated nutrient managements NPKF (0.89)/NPKG (0.89) compared to NPK (0.88) and control (0.85).

3.3. Nutritional Soil Quality Index

Total soil N was higher for integrated nutrient management compared to NPK (Table 2). The NPKP treatment showed similar values of total N compared to sole NPK treatment. Inorganic fertilization increased KMnO4–N status by ~11% compared to control. The integrated approaches viz., NPKG and NPKF increased ~16 and 18% of KMnO4–N over control treatment. An appreciable amount of Olsen’s P was detected when an external amount of P was added during the 24 years of nutrient management. NH4OAc–K and CaCl2–S were adequate (240 and 20 for K and S, respectively) in the studied soil [57,58]. Calcium was the dominant cation on exchange sites of soil followed by magnesium. Soils under all the treatments were sufficient for the availability of cationic micronutrients except DTPA–Zn. Contrarily, soils of all the treatments were deficient in hot water extractable B. The nutritional soil quality index was developed with score values of KMnO4–N, DTPA–Zn, and hot water extractable B. Overall, the soil nutritional quality index was greater in NPKF (0.96) followed by NPKG (0.93), NPKP (0.90), NPK (0.84), fallow (0.80), and control (0.76).

3.4. Biological Soil Quality Index

Depletion of soil organic C (SOC) is common in soils under cultivation without the addition of external organic inputs [21]. About a 17 and 6% decline in SOC was observed in control and NPK, respectively, compared to initial SOC (Table 3), while, NPKG and NPKF achieved 3 and 10% build-up of SOC, respectively. Soil microbial biomass C (MBC) was 1.7 to 1.8 times greater for integrated soil nutrient management compared to control. Application of NPK fertilizer in soil enhanced MBCup to 1.5 times compared to control. The supply of organic sources resulted inafriable soil structure, and improved hydrothermal conditions thereby facilitated higher soil microbial activity [54]. Soil respiration was 1.4, 1.5, and 1.6 times higher in NPKP, NPKG, and NPKF, respectively, compared to the control. The supply of decomposition resistant fiber fractions in PS showed slightly lower Cmin in NPKP than the NPKG and NPKF [59]. Sole inorganic and integrated treatment of PS, GM and FYM increased the Nmin soil up to 1.4–1.9 times compared to control. Fluorescein diacetate hydrolyzing activity (FDA) describes the overall soil microbial activity as FDA is the composite expression of protease, lipase, and esterase [60,61]. The application of FYM, PS, and GM had no effect on the β-glu and FDA activity of the soil compared to NPK. But, organics application caused 38–47% and 24.2–29.4% increase in FDA and β-glu activities, respectively when compared to control. The higher β-glu and FDA activity under the 24-years rotation were probably produced by the higher plant biomass (~11 Mg ha–1) and rhizodeposition [34]. The presence of DHA reflects the abundance of microbial activity. DHA activity was at par for both NPK and control. The integration of organics with NPK increased DHA activity. Urease (URE) activity was 14, 17, 18 and 43% higher for NPK, NPKP, NPKG and NPKF, respectively, when compared to control. Higher urease content in NPKF might be because of the upregulation of the enzyme production in microbes in the presence of an increased supply of decomposable substrate from FYM [34], whereas it declined in NPKG because of the reduced supply of substrate for URE in leguminous crops supplying biologically fixed N [62].
Score values of SOC, MBC, Cmin, and β-glu captured the biological soil quality index (Table 4; Figure 2). MBC measures the microbial abundance and liveliness of soil; and β-glu is the C–utilization/releasing potentiality of soil [63]. Furthermore, enzyme β-glu predicted DHA, FDA, and URE activities with a good agreement (R2 = 0.92). NPKF showed the greatest score value of SOC (0.99) compared to NPKP (0.90) and NPKG (0.93), respectively (Table 4). Biological soil quality indexes were ~9 and 6% lower for NPKP and NPKG treatments compared to NPKF. This score was further reduced for NPK. Keeping the soil fallow maintained SOC comparable to NPKP. Cultivation without any external input declined one-fourth of the score value of SOC. Integrated nutrient management indicated nearly at par improvement of soil microbial biomass C. FYM provided greater support for increasing the metabolic activity of soil. This may be because of the inherent composition of FYM [34]. Enzymes activities were greater in integrated nutrient management. However, a drastic reduction in values of soil enzymes was observed in NPK compared to integrated nutrient management NPK + organics (FYM, PS or GM). Furthermore, long-term cultivation of soils without addition of any external input reduced ~50% of soil metabolic activity. Nevertheless, soil data indicated that keeping the soil fallow is not a good practice and it caused about 50% decline in soil metabolic activity compared to NPKF. The soil biological and biochemical attributes indicated that NPKF is the best management practice (0.96) for achieving greater biological soil quality compared to NPKG (0.90), NPKP (0.86), NPK (0.76), control (0.65) and fallow (0.63).

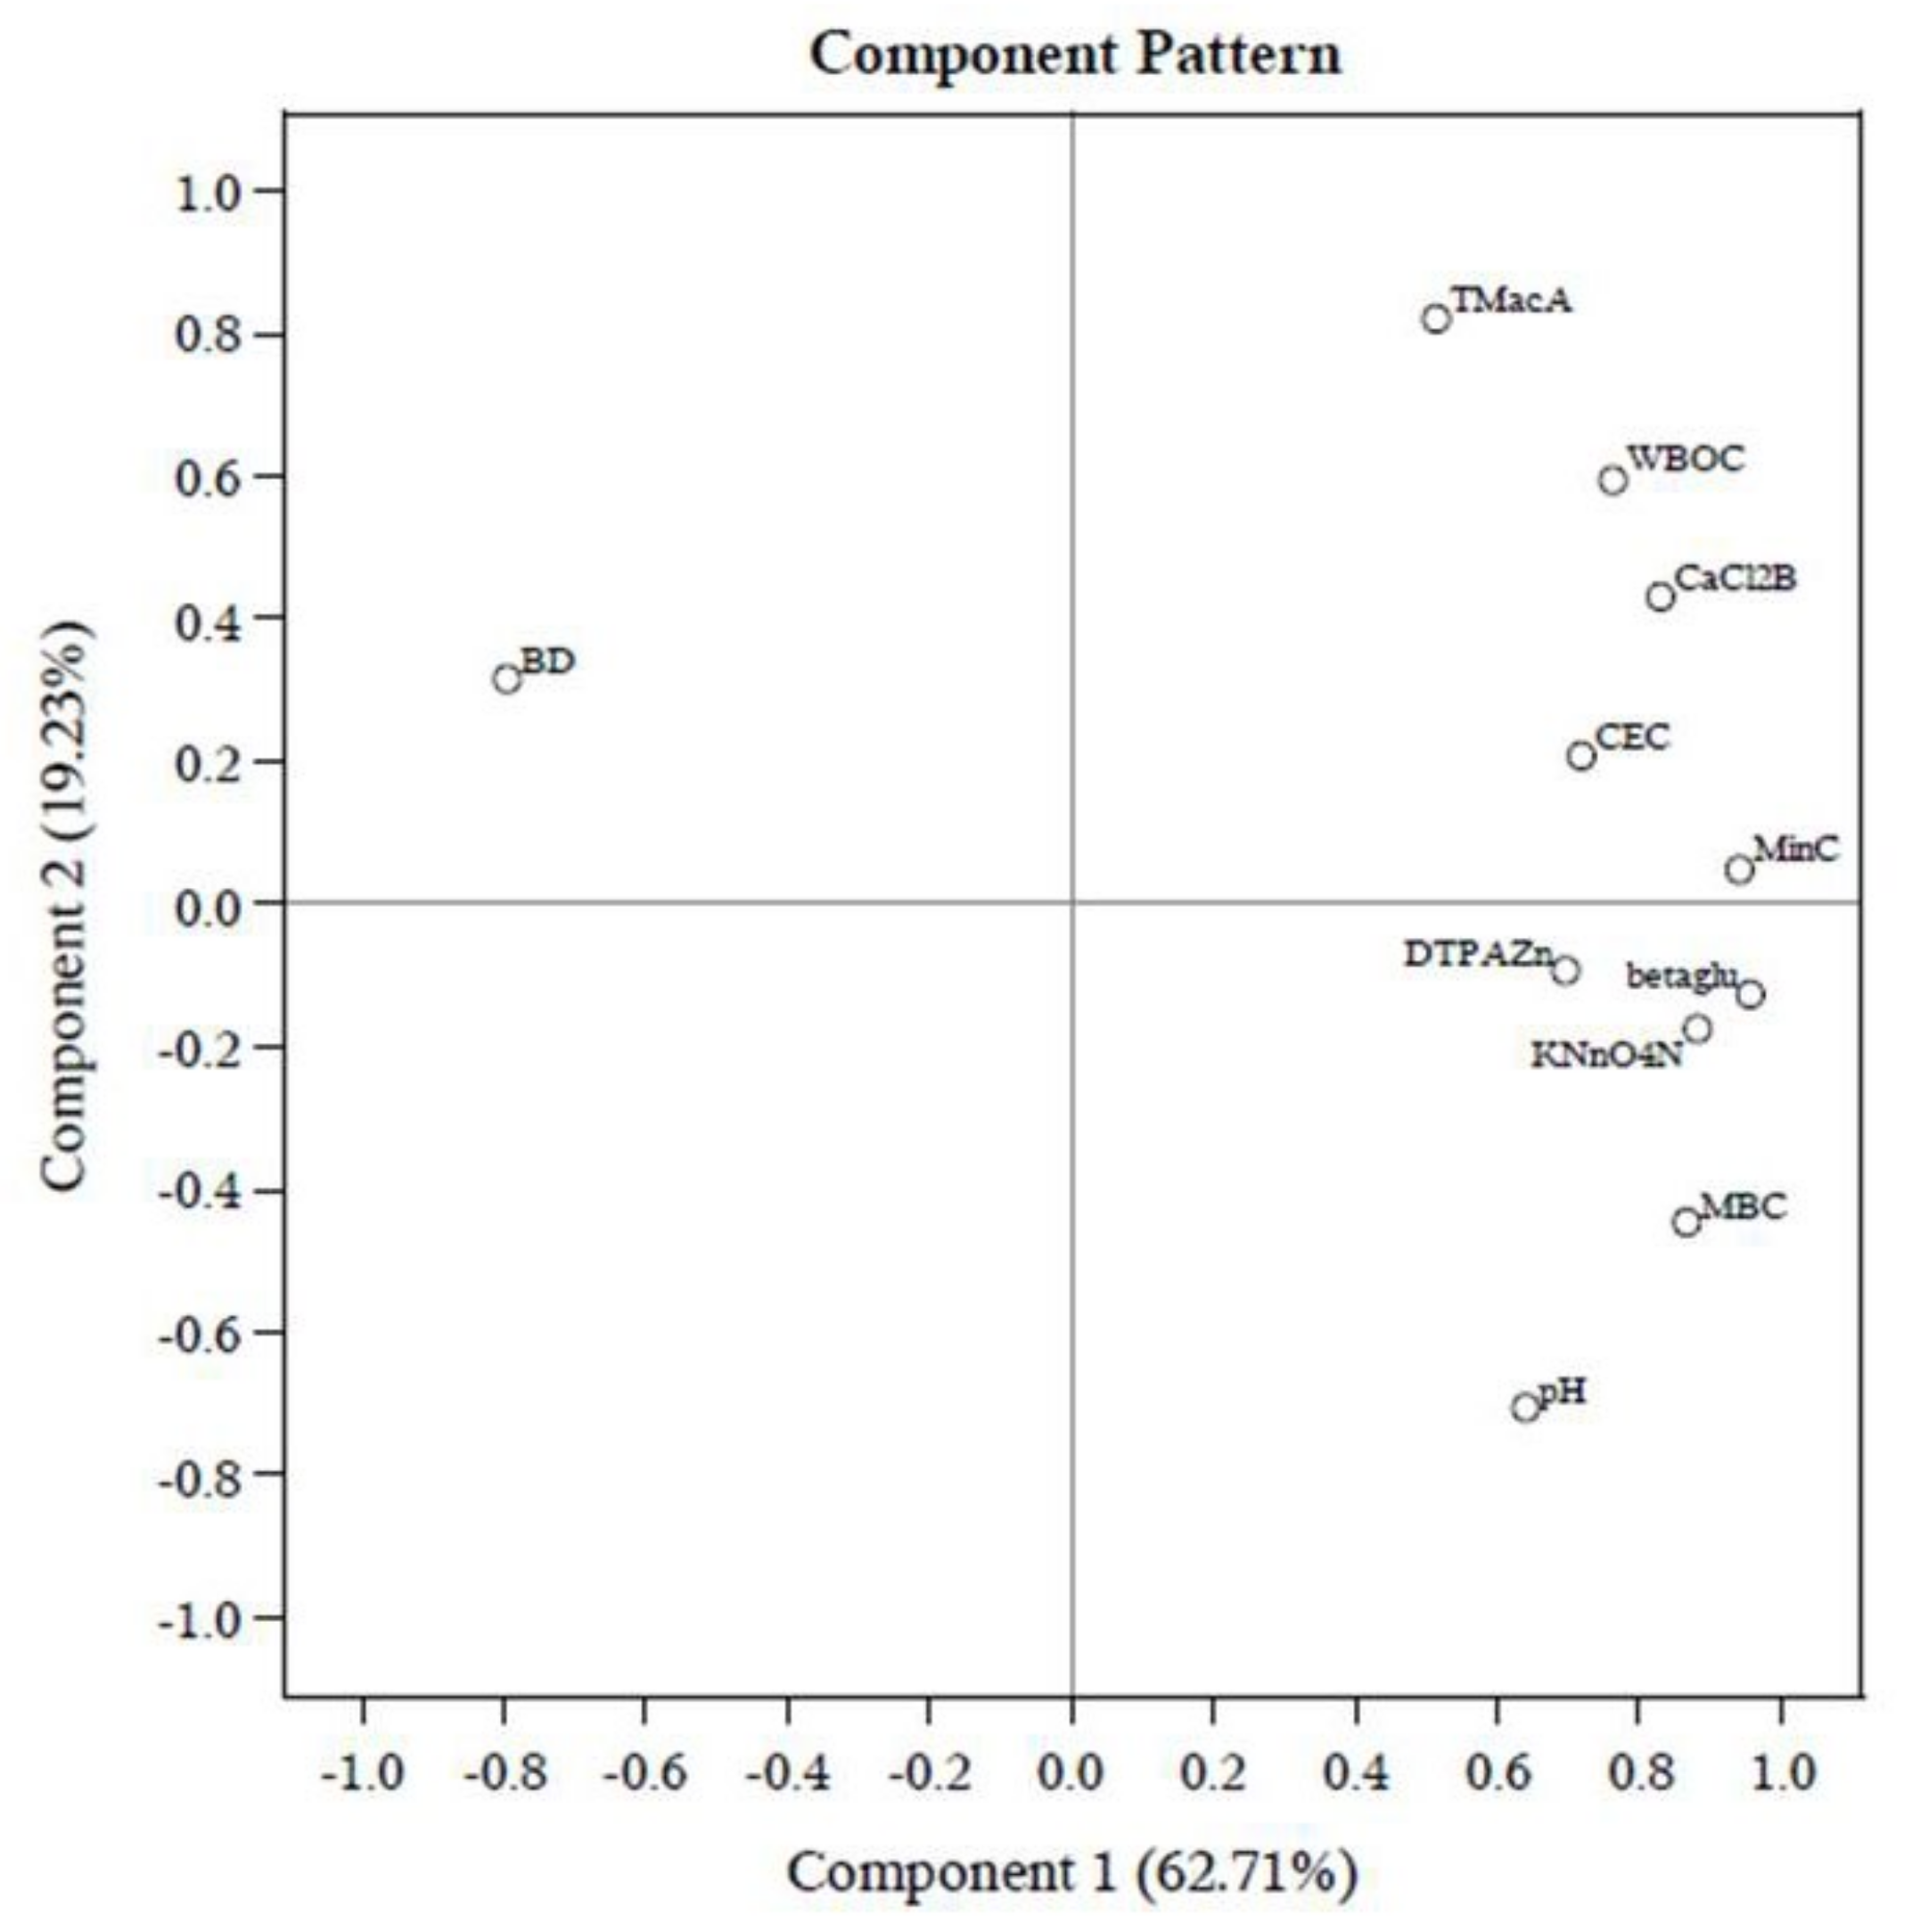
3.5. SMAF Validation

The relationship with different physicochemical properties varied in the magnitude and direction (Table 1Table 2Table 3). Therefore, for comparing the response of different treatments, a unitless score “Soil Management Assessment Framework (SMAF)” was developed considering the impact of attributes on soil function [64]. Application of organics (FYM, PS, and GM) in conjunction with NPK significantly improved the SMAF score for different attributes as compared to control and NPK alone. The mineralization and decomposition of organics amendments (FYM, PS, GM) release nutrients (N, P, K and micronutrients), and the prolonged submergence for paddy cultivation facilitated the reduction of insoluble ferric phosphate to soluble ferrous phosphate, thereby increasing the available P [59]. The production of organic acids and ligands upon decomposition of organics also facilitated the increased availability of nutrients in the soil. Scores for physical indicators (TMacAS, bulk density) were greater for NPKF followed by NPKP and NPKG. The incorporation of organic amendments in soil improved the SOC content and root vigor, led to the better soil aggregation, porosity, and lower BD [65]. The fungal hyphae, fibrous roots, and polysaccharides content are higher in organic amendment treated soils which promote the binding of soil microaggregates andtheformation of water-stable total macroaggregates [66]. The nutritional, biological, and biochemical indicators were similar in NPK alone or in conjunction with organics. The score for pH was greater in NPKG followed by NPKP and NPKF. The CEC score was greater in NPKP followed by NPKF and NPKG. The yearly addition of organic amendments increased the soil biological activity. An increase in MBC, soil microbial, and metabolic activity with the addition of FYM and GM in the alluvial soils of the Indo-Gangetic plains undertherice-based cropping system was also reported by earlier researchers [67,68]. The overall summarization of data highlighted the NPKF as the best management practice (0.94) for achieving greater soil quality indices compared to NPKG (0.90) > NPKP (0.89) > NPK (0.79) > fallow (0.78) > control (0.71) (p < 0.05).
Long–term cultivation with individual management practices discriminates the index values of soil quality. However, these findings are not enough to reach a valid conclusion. Therefore, a PCA was carried out with eleven–selected data sets of SMAF (Figure 3; Supplementary Table S1). In PCA, 82% of the total data set was described by soil enzyme β-glu, Cmin, KMNO4–N, MBC, and TMacA. The crop yield is the most visible outcome of the agricultural production system. The final regression models with rice equivalent yield were developed and showed good agreement (R2 = 0.89, p < 0.05) with screened soil quality attributes through PCA (Table 5). Among the soil attributes only KMnO4–N (p < 0.01) and MBC (p < 0.05) predicted ERY, whereas, the forward model predicted ERY (R2 = 0.77, p < 0.05) when KMNO4–N (p < 0.01) was the only contender for such representation. Here, SOC and mineralizable N (Nmin) also predicted system yield (R2 = 0.50) very well.
The full model for WBOC was dominated by metabolic (β-glu), microbial (Cmin and Cmic), and nutrient attributes (KMnO4–N), including soil physical attributes (total water-stable aggregate).The Nmin model depended on soil metabolic activities (β-glucosidase activities), soil microbial activities (soil microbial biomass C and soil mineralizable C), nutrient attributes (KMnO4–N), and soil aggregation. N mineralization, a microbial process [69], was far lower in studied soils compared to earlier studies [70].

4. Conclusions

This study concludes that SMAF-based soil quality indexing had better representation of variability in crop performance. This index was responsive to the different nutrient management strategies. Farmyard manure was the better supplement to fertilizer nutrients for increasing system yield and the soil quality index. The wholesome index of SMAF (SQI) was highest in NPKF followed by NPKG, NPKP, and NPK. Soil attributes β-glucosidase, mineralizable C, KMNO4–N, microbial biomass C, and total water-stable aggregates together described 82% variability in the SMAF score. Different organics varied in their response to physical, chemical, nutritional, and biological indexes. This is mainly associated with varying proportions of the decomposable and recalcitrant compounds present in different organics. These findings have agronomic importance for managing natural resources for sustained productivity and improved soil quality. This study also highlights the importance of integrating organic input to mask the deleterious impact of different perturbations associated with cultivation practices.

Supplementary Materials

The following supporting information can be downloaded at: https://www.mdpi.com/article/10.3390/su14116533/s1, Table S1: Principal component analysis.

Author Contributions

Conceptualization; B.M. and N.B.; methodology; N.B.; S.B. and A.D.; writing—original draft preparation; N.B. and A.K.R.; writing—review and editing; P.B.; T.M.; B.S.; M.K.A.; A.K.Y. and A.D.; supervision; B.M.; funding acquisition; B.M. All authors have read and agreed to the published version of the manuscript.

Funding

The authors are extremely thankful to the Indian Council of Agricultural Research (ICAR); New Delhi for funding the work through the World Bank assisted multi-institutional collaborative National Agricultural Innovation Project (NAIP: Sub-project C-2060) entitled “Assessment of quality and resilience of soils under diverse Agro-ecosystems”.

Institutional Review Board Statement

Not applicable.

Informed Consent Statement

Not applicable.

Data Availability Statement

The data supporting the findings of this study are available from the corresponding author, N.B. and A.D. upon reasonable request.

Acknowledgments

The authors are extremely thankful to Bidhan Chandra Krishi Viswavidyalaya, Mohanpur 741 2525, West Bengal, India for technical and associated help in conducting the research work. The services of the SSCNARS portal of ICAR-IASRI, New Delhi are also acknowledged for statistical data analysis.

Conflicts of Interest

The authors declare no conflict of interest.

References

  1. Mandal, B.; Basak, N.; Singha Roy, S.; Biswas, S. Soil Health Measurement Techniques. In Soil Health: Concept, Status and Monitoring. Bulletin of the Indian Society of Soil Science 30; Katyal, J.C., Chaudhari, S.K., Dwivedi, B.S., Biswas, D.R., Rattan, R.K., Majumdar, K., Eds.; Indian Society of Soil Science: New Delhi, India, 2016; pp. 1–98. [Google Scholar]
  2. Wingeyer, A.B.; Amado, T.J.C.; Pérez-Bidegain, M.; Studdert, G.A.; Varela, C.H.P.; Garcia, F.O.; Karlen, D.L. Soil Quality Impacts of Current South American Agricultural Practices. Sustainability 2015, 7, 2213–2242. [Google Scholar] [CrossRef] [Green Version]
  3. Basak, N.; Mandal, B.; Rai, A.K.; Basak, P. Soil Quality and Productivity Improvement: Indian Story. Proc. Indian Natl. Sci. Acad. 2021, 87, 2–10. [Google Scholar] [CrossRef]
  4. Purakayastha, T.J.; Pathak, H.; Kumari, S.; Biswas, S.; Chakrabarty, B.; Padaria, R.N.; Kamble, K.; Pandey, M.; Sasmal, S.; Singh, A. Soil Health Card Development for Efficient Soil Management in Haryana, India. Soil Tillage Res. 2019, 191, 294–305. [Google Scholar] [CrossRef]
  5. Lal, R. The Soil–Peace Nexus: Our Common Future. Soil Sci. Plant Nutr. 2015, 61, 566–578. [Google Scholar] [CrossRef] [Green Version]
  6. Bouma, J. Reaching out from the Soil-Box in Pursuit of Soil Security. Soil Sci. Plant Nutr. 2015, 61, 556–565. [Google Scholar] [CrossRef] [Green Version]
  7. Andrews, S.S.; Carroll, C.R. Designing a Soil Quality Assessment Tool for Sustainable Agroecosystem Management. Ecol. Appl. 2001, 11, 1573–1585. [Google Scholar] [CrossRef]
  8. Karlen, D.L.; Andrews, S.S.; Doran, J.W. Soil Quality: Current Concepts and Applications; Advances in Agronomy; Academic Press: Cambridge, MA, USA, 2001; Volume 74, pp. 1–40. [Google Scholar]
  9. Masto, R.E.; Chhonkar, P.K.; Singh, D.; Patra, A.K. Soil Quality Response to Long-Term Nutrient and Crop Management on a Semi-Arid Inceptisol. Agric. Ecosyst. Environ. 2007, 118, 130–142. [Google Scholar] [CrossRef]
  10. Sharma, K.L.; Lal, M.; Chary, G.R.; Reddy, K.S.; Indoria, A.K.; Srinivas, K.; Singh, V.K.; Chandra Sekhar, C.; Singh, A.P.; Abrol, V.; et al. Long Term Effects of Conjunctive Nutrient Management Practices on Soil Quality in Maize (Zea Mays)—Mustard (Brassica Compestris Var. Sarson) Rotation under Rainfed Hill Inceptisol Soils. Commun. Soil Sci. Plant Anal. 2022, 53, 439–452. [Google Scholar] [CrossRef]
  11. De Lima, A.C.R.; Hoogmoed, W.; Brussaard, L. Soil Quality Assessment in Rice Production Systems: Establishing a Minimum Data Set. J. Environ. Qual. 2008, 37, 623–630. [Google Scholar] [CrossRef]
  12. Armenise, E.; Redmile-Gordon, M.A.; Stellacci, A.M.; Ciccarese, A.; Rubino, P. Developing a Soil Quality Index to Compare Soil Fitness for Agricultural Use under Different Managements in the Mediterranean Environment. Soil Tillage Res. 2013, 130, 91–98. [Google Scholar] [CrossRef]
  13. Soni, P.G.; Basak, N.; Rai, A.K.; Sundha, P.; Narjary, B.; Kumar, P.; Yadav, G.; Kumar, S.; Yadav, R.K. Deficit Saline Water Irrigation under Reduced Tillage and Residue Mulch Improves Soil Health in Sorghum-Wheat Cropping System in Semi-Arid Region. Sci. Rep. 2021, 11, 1880. [Google Scholar] [CrossRef] [PubMed]
  14. Biswas, S.; Hazra, G.C.; Purakayastha, T.J.; Saha, N.; Mitran, T.; Singha Roy, S.; Basak, N.; Mandal, B. Establishment of Critical Limits of Indicators and Indices of Soil Quality in Rice-Rice Cropping Systems under Different Soil Orders. Geoderma 2017, 292, 34–48. [Google Scholar] [CrossRef]
  15. Andrews, S.S.; Karlen, D.L.; Cambardella, C.A. The Soil Management Assessment Framework. Soil Sci. Soc. Am. J. 2004, 68, 1945–1962. [Google Scholar] [CrossRef]
  16. Stott, D.E.; Karlen, D.L.; Cambardella, C.A.; Harmel, R.D. A Soil Quality and Metabolic Activity Assessment after Fifty-Seven Years of Agricultural Management. Soil Sci. Soc. Am. J. 2013, 77, 903–913. [Google Scholar] [CrossRef]
  17. Jimenez, L.C.; Queiroz, H.M.; Cherubin, M.R.; Ferreira, T.O. Applying the Soil Management Assessment Framework (SMAF) to Assess Mangrove Soil Quality. Sustainability 2022, 14, 3085. [Google Scholar] [CrossRef]
  18. Bhaduri, D.; Purakayastha, T.J. Long-Term Tillage, Water and Nutrient Management in Rice–Wheat Cropping System: Assessment and Response of Soil Quality. Soil Tillage Res. 2014, 144, 83–95. [Google Scholar] [CrossRef]
  19. Cherubin, M.R.; Karlen, D.L.; Franco, A.L.C.; Cerri, C.E.P.; Tormena, C.A.; Cerri, C.C. A Soil Management Assessment Framework (SMAF) Evaluation of Brazilian Sugarcane Expansion on Soil Quality. Soil Sci. Soc. Am. J. 2016, 80, 215–226. [Google Scholar] [CrossRef]
  20. Saharawat, Y.S.; Singh, B.; Malik, R.K.; Ladha, J.K.; Gathala, M.; Jat, M.L.; Kumar, V. Evaluation of Alternative Tillage and Crop Establishment Methods in a Rice–Wheat Rotation in North Western IGP. Field Crops Res. 2010, 116, 260–267. [Google Scholar] [CrossRef]
  21. Singh, V.K.; Dwivedi, B.S.; Mishra, R.P.; Shukla, A.K.; Timsina, J.; Upadhyay, P.K.; Shekhawat, K.; Majumdar, K.; Panwar, A.S. Yields, Soil Health and Farm Profits under a Rice-Wheat System: Long-Term Effect of Fertilizers and Organic Manures Applied Alone and in Combination. Agronomy 2019, 9, 1. [Google Scholar] [CrossRef] [Green Version]
  22. Bhatt, R.; Kukal, S.S.; Busari, M.A.; Arora, S.; Yadav, M. Sustainability Issues on Rice–Wheat Cropping System. Int. Soil Water Conserv. Res. 2016, 4, 64–74. [Google Scholar] [CrossRef] [Green Version]
  23. Kukal, S.S.; Aggarwal, G.C. Puddling Depth and Intensity Effects in Rice–Wheat System on a Sandy Loam Soil: I. Development of Subsurface Compaction. Soil Tillage Res. 2003, 72, 1–8. [Google Scholar] [CrossRef]
  24. Bhaduri, D.; Purakayastha, T.J.; Chakraborty, D.; Chakraborty, K.; Singh, M. Integrated Tillage-Water-Nutrient Management Effects on Selected Soil Physical Properties in a Rice-Wheat System in the Indian Subcontinent. Arch. Agron. Soil Sci. 2018, 64, 132–145. [Google Scholar] [CrossRef]
  25. Bhandari, A.L.; Ladha, J.K.; Pathak, H.; Padre, A.T.; Dawe, D.; Gupta, R.K. Yield and Soil Nutrient Changes in a Long-Term Rice-Wheat Rotation in India. Soil Sci. Soc. Am. J. 2002, 66, 162–170. [Google Scholar] [CrossRef]
  26. Basak, N.; Datta, A.; Mitran, T.; Roy, S.S.; Saha, B.; Biswas, S.; Mandal, B. Assessing Soil-Quality Indices for Subtropical Rice-Based Cropping Systems in India. Soil Res. 2016, 54, 20–29. [Google Scholar] [CrossRef]
  27. Venkatramanan, V.; Shah, S.; Rai, A.K.; Prasad, R. Nexus Between Crop Residue Burning, Bioeconomy and Sustainable Development Goals Over North-Western India. Front. Energy Res. 2021, 8, 614212. [Google Scholar] [CrossRef]
  28. Srinivasarao, C.; Venkateswarlu, B.; Lal, R.; Singh, A.K.; Kundu, S. Sustainable Management of Soils of Dryland Ecosystems of India for Enhancing Agronomic Productivity and Sequestering Carbon, 1st ed.; Elsevier Inc.: Amsterdam, The Netherlands, 2013; Volume 121, ISBN 9780124076853. [Google Scholar]
  29. Lal, R. Soil Quality Impacts of Residue Removal for Bioethanol Production. Soil Tillage Res. 2009, 102, 233–241. [Google Scholar] [CrossRef]
  30. Zhang, B.; Pang, C.; Qin, J.; Liu, K.; Xu, H.; Li, H. Rice Straw Incorporation in Winter with Fertilizer-N Application Improves Soil Fertility and Reduces Global Warming Potential from a Double Rice Paddy Field. Biol. Fertil. Soils 2013, 49, 1039–1052. [Google Scholar] [CrossRef]
  31. Wang, J.; Wang, X.; Xu, M.; Feng, G.; Zhang, W.; Lu, C. Crop Yield and Soil Organic Matter after Long-Term Straw Return to Soil in China. Nutr. Cycl. Agroecosyst. 2015, 102, 371–381. [Google Scholar] [CrossRef]
  32. Turmel, M.-S.; Speratti, A.; Baudron, F.; Verhulst, N.; Govaerts, B. Crop Residue Management and Soil Health: A Systems Analysis. Agric. Syst. 2015, 134, 6–16. [Google Scholar] [CrossRef]
  33. Walkley, A.; Black, I.A. An Examination of the Degtjareff Method for Determining Soil Organic Matter, and a Proposed Modification of the Chromic Acid Titration Method. Soil Sci. 1934, 37, 29–38. [Google Scholar] [CrossRef]
  34. Majumder, B.; Mandal, B.; Bandyopadhyay, P.K.; Gangopadhyay, A.; Mani, P.K.; Kundu, A.L.; Mazumdar, D. Organic Amendments Influence Soil Organic Carbon Pools and Rice-Wheat Productivity. Soil Sci. Soc. Am. J. 2008, 72, 775–785. [Google Scholar] [CrossRef]
  35. Blake, G.R.; Hartage, K.H. Bulk Density. In Method of Soil Analysis, Part, I. Physical and Mineralogical Methods, Klute, A., Ed.; American Society of Agronomy: Madison, WI, USA, 1986; pp. 363–375. [Google Scholar]
  36. Piper, C.S. Soil and Plant Analysis; Hans Publisher: Bombay, India, 1996. [Google Scholar]
  37. Yoder, R.E. A Direct Method of Aggregate Analysis of Soils and A Study of the Physical Nature of Erosion Losses(1). Soil Sci. Soc. Am. J. 1936, B17, 165. [Google Scholar] [CrossRef] [Green Version]
  38. Hesse, P.R. A Twxtbook of Soil Chemical Analysis, 1st ed.; CBS Publisers & Distributors: New Delhi, India, 1994. [Google Scholar]
  39. Subbiah, B.V.; Asija, G.L. A Rapid Procedure for Assessment of Available Nitrogen in Rice Soils. Curr. Sci. 1956, 25, 259–260. [Google Scholar]
  40. Jackson, M.L. Soil Chemical Analysis; Printice Hall of India Pvt. Ltd.: New Delhi, India, 1967; p. 498. [Google Scholar]
  41. Chesnin, L.; Yien, C.H. Turbidimetric Determination of Available Sulphates. Soil Sci. Soc. Am. Proc. 1951, 15, 149–151. [Google Scholar] [CrossRef]
  42. Lindsay, W.L.; Norvell, W.A. Development of a DTPA Soil Test for Zinc, Iron, Manganese, and Copper. Soil Sci. Soc. Am. J. 1978, 42, 421–428. [Google Scholar] [CrossRef]
  43. Parker, D.R.; Gardner, E.H. The Determination of Hot-water-soluble Boron in Some Acid Oregon Soils Using a Modified Azomethine-H Procedure. Commun. Soil Sci. Plant Anal. 1981, 12, 1311–1322. [Google Scholar] [CrossRef]
  44. Vance, E.D.; Brookes, P.C.; Jenkinson, D.S. An Extraction Method for Measuring Soil Microbial Biomass, C. Soil Biol. Biochem. 1987, 19, 703–707. [Google Scholar] [CrossRef]
  45. Voroney, R.P.; Paul, E.A. Determination of KC and KNin Situ for Calibration of the Chloroform Fumigation-Incubation Method. Soil Biol. Biochem. 1984, 16, 9–14. [Google Scholar] [CrossRef]
  46. Brookes, P.C.; Landman, A.; Pruden, G.; Jenkinson, D.S. Chloroform Fumigation and the Release of Soil Nitrogen: A Rapid Direct Extraction Method to Measure Microbial Biomass Nitrogen in Soil. Soil Biol. Biochem. 1985, 17, 837–842. [Google Scholar] [CrossRef]
  47. Bremner, J.M.; Keeney, D.R. Steam Distillation Methods for Determination of Ammonium, Nitrate and Nitrite. Anal. Chim. Acta 1965, 32, 485–495. [Google Scholar] [CrossRef]
  48. Dick, R.P.; Breakwell, D.P.; Turco, R.F. Soil Enzyme Activities and Biodiversity Measurements as Integrative Microbiological Indicators. In Methods for Assessing Soil Quality; Doran, J.W., Jones, A.J., Eds.; John Wiley & Sons, Inc.: Hoboken, NJ, USA, 1997; pp. 247–271. [Google Scholar] [CrossRef]
  49. Das, R.; Mandal, B.; Sarkar, D.; Pradhan, A.K.; Datta, A.; Padhan, D.; Seth, A.; Kumar, R.; De, N.; Mishra, V.N.; et al. Boron Availability in Soils and Its Nutrition of Crops under Long-Term Fertility Experiments in India. Geoderma 2019, 351, 116–129. [Google Scholar] [CrossRef]
  50. Andrews, S.S.; Karlen, D.L.; Mitchell, J.P. A Comparison of Soil Quality Indexing Methods for Vegetable Production Systems in Northern California. Agric. Ecosyst. Environ. 2002, 90, 25–45. [Google Scholar] [CrossRef]
  51. Yao, R.; Yang, J.; Gao, P.; Zhang, J.; Jin, W. Determining Minimum Data Set for Soil Quality Assessment of Typical Salt-Affected Farmland in the Coastal Reclamation Area. Soil Tillage Res. 2013, 128, 137–148. [Google Scholar] [CrossRef]
  52. Bandyopadhyay, P.K.; Saha, S.; Mani, P.K.; Mandal, B. Effect of Organic Inputs on Aggregate Associated Organic Carbon Concentration under Long-Term Rice–Wheat Cropping System. Geoderma 2010, 154, 379–386. [Google Scholar] [CrossRef]
  53. Sainju, U.M.; Whitehead, W.F.; Singh, B.P. Cover Crops and Nitrogen Fertilization Effects on Soil Aggregation and Carbon and Nitrogen Pools. Can. J. Soil Sci. 2003, 83, 155–165. [Google Scholar] [CrossRef]
  54. Zhang, D.; Yao, P.; Zhao, N.; Cao, W.; Zhang, S.; Li, Y.; Huang, D.; Zhai, B.; Wang, Z.; Gao, Y. Building up the Soil Carbon Pool via the Cultivation of Green Manure Crops in the Loess Plateau of China. Geoderma 2019, 337, 425–433. [Google Scholar] [CrossRef]
  55. Thompson, M.L.; Zhang, H.; Kazemi, M.; Sandor, J.A. Contribution of Organic Matter to Cation Exchange Capacity and Specific Surface Area of Fractionated Soil Materials. Soil Sci. 1989, 148, 250–257. [Google Scholar] [CrossRef]
  56. Solly, E.F.; Weber, V.; Zimmermann, S.; Walthert, L.; Hagedorn, F.; Schmidt, M.W.I. Is the Content and Potential Preservation of Soil Organic Carbon Reflected by Cation Exchange Capacity? A Case Study in Swiss Forest Soils. Biogeosci. Discuss. 2019, 2019, 1–32. [Google Scholar] [CrossRef] [Green Version]
  57. Sekhon, G.S.; Velayutham, M.; Benbi, D.K. Soil Fertility Evaluation. In Fundamentals of Soil Science; Goswami, N.N., Rattan, R.K., Dev, G., Narayanasamy, G., Das, D.K., Sanyal, S.K., Pal, D.K., Eds.; Indian Society of Soil Science: New Delhi, India, 2012; pp. 511–529. [Google Scholar]
  58. Gourav, N.K.S.; Kumar, P.; Sharma, G.D.; Sharma, N. Critical Limits of Sulfur in Relation to the Growth and Development of French-Bean and Cauliflower in Acidic Soils of Northwestern Himalayas. Commun. Soil Sci. Plant Anal. 2021, 52, 2280–2288. [Google Scholar] [CrossRef]
  59. Ghosh, S.; Wilson, B.; Ghoshal, S.; Senapati, N.; Mandal, B. Organic Amendments Influence Soil Quality and Carbon Sequestration in the Indo-Gangetic Plains of India. Agric. Ecosyst. Environ. 2012, 156, 134–141. [Google Scholar] [CrossRef]
  60. Green, V.S.; Stott, D.E.; Cruz, J.C.; Curi, N. Tillage Impacts on Soil Biological Activity and Aggregation in a Brazilian Cerrado Oxisol. Soil Tillage Res. 2007, 92, 114–121. [Google Scholar] [CrossRef]
  61. Ghosh, A.; Kumar, S.; Manna, M.C.; Singh, A.K.; Sharma, P.; Sarkar, A.; Saha, M.; Bhattacharyya, R.; Misra, S.; Biswas, S.S.; et al. Long-Term in Situ Moisture Conservation in Horti-Pasture System Improves Biological Health of Degraded Land. J. Environ. Manag. 2019, 248, 109339. [Google Scholar] [CrossRef] [PubMed]
  62. Mohammadi, K.; Heideri, G.; Khalesro, S.; Sohrabi, Y. Soil Management, Microorganisms and Organic Matter Interactions: A Review. Afr. J. Biotechnol. 2011, 10, 19840–19849. [Google Scholar] [CrossRef] [Green Version]
  63. Acosta-Martínez, V.; Pérez-Guzmán, L.; Johnson, J.M.F. Simultaneous Determination of β-Glucosidase, β-Glucosaminidase, Acid Phosphomonoesterase, and Arylsulfatase Activities in a Soil Sample for a Biogeochemical Cycling Index. Appl. Soil Ecol. 2019, 142, 72–80. [Google Scholar] [CrossRef]
  64. Stott, D.E.; Andrews, S.S.; Liebig, M.A.; Wienhold, B.J.; Karlen, D.L. Evaluation of β-Glucosidase Activity as a Soil Quality Indicator for the Soil Management Assessment Framework. Soil Sci. Soc. Am. J. 2010, 74, 107–119. [Google Scholar] [CrossRef] [Green Version]
  65. Schjønning, P.; Christensen, B.T.; Carstensen, B. Physical and Chemical Properties of a Sandy Loam Receiving Animal Manure, Mineral Fertilizer or No Fertilizer for 90 Years. Eur. J. Soil Sci. 1994, 45, 257–268. [Google Scholar] [CrossRef]
  66. Tisdall, J.M.; Oades, J.M. Organic Matter and Water-Stable Aggregates in Soils. J. Soil Sci. 1982, 33, 141–163. [Google Scholar] [CrossRef]
  67. Kumar, M.; Mitra, S.; Mazumdar, S.P.; Majumdar, B.; Saha, A.R.; Singh, S.R.; Pramanick, B.; Gaber, A.; Alsanie, W.F.; Hossain, A. Improvement of Soil Health and System Productivity through Crop Diversification and Residue Incorporation under Jute-Based Different Cropping Systems. Agronomy 2021, 11, 1622. [Google Scholar] [CrossRef]
  68. Kaur, J.; Choudhary, O.P.; Bijay-Singh, B. Microbial Biomass Carbon and Some Soil Properties as Influenced by Long-Term Sodic-Water Irrigation, Gypsum, and Organic Amendments. Soil Res. 2008, 46, 141–151. [Google Scholar] [CrossRef]
  69. Brady, N.C.; Weil, R.R. The Nature and Properties of Soils, 14th ed.; Pearson Education Inc.: New Delhi, India, 2014. [Google Scholar]
  70. Sahrawat, K.L. Nitrogen Availability Indexes for Submerged Rice Soils. In Advances in Agronomy; Brady, N.C., Ed.; Academic Press: Cambridge, MA, USA, 1983; Volume 36, pp. 415–451. ISBN 0065-2113. [Google Scholar]
Figure 1. Location of the study area.
Sustainability 14 06533 g001
Figure 2. Soil quality indices (SQI); fallow, control (no N-P-K fertilizers or organics); 100% recommended dose of inorganic fertilizer (NPK); NPK + farmyard manure (NPKF); NPK + paddy straw (NPKP); and NPK + green manure (Sesbania sesban L.) (NPKG). Different letters in each category (Y- axis) are statistically different at p ≤ 0.05 by Duncan’s multiple-range test.
Sustainability 14 06533 g002
Figure 3. Biplot showing variable loadings on first two principal components for different soil attributes. BD: bulk density; TMacAS: macro-aggregate stability; WBOC: Walkley and Black organic C; CEC: cation exchange capacity; MBC: microbial biomass C; Cmin: mineralizable C; DHA: dehydrogenase; FDHA: fluorescein diacetate hydrolyzing activity; URE: urease activity; betaglu: β-glucosidase.
Sustainability 14 06533 g003
Table 1. Soil physical and chemical attributes and significant correlations with measured soil microbial and metabolic activities.
TreatmentsClayTMacASBDpHCECERY
%Mg m−3 c mol(P+) kg−1Mg ha−1
Fallow44.9 e60.2 a1.45 a7.1 d17.1 c-
Control46.1 d21.0 e1.41 ab7.6 bc16.3 d41.9 c
NPK46.9 b33.7 d1.39 ab7.5 bc17.2 c61.2 b
NPKF47.4 a58.3 ab1.32 c7.7 a18.0 b70.2 a
NPKP46.9 b56.2 b1.37 bc7.6 ab19.6 a60.5 b
NPKG46.5 c49.1 c1.36 bc7.5 c17.6 bc65.1 ab
LSD0.050.222.510.070.110.5711.52
Significant correlations between soil organic C and soil microbial activities
WBOCns**nsns*ns
MBC***-ve **ns****
Cmin***-ve ****ns
Nmin***-ve **ns*ns
β-glu**ns-ve ******ns
DHA***-ve *****ns
FDHA***-ve ****ns
URE**ns-ve ****nsns
Fallow, control (no N-P-K fertilizers or organics); 100% recommended dose of inorganic fertilizer (NPK); NPK + farmyard manure (NPKF); NPK + paddy straw (NPKP); and NPK + green manure (Sesbania sesban L.) (NPKG); WBOC: Walkley and Black organic C;TMacAS: total macro-aggregate stability; AS: aggregate stability; CEC, cation exchange capacity; ERY, equivalent rice yield; Cmic: microbial biomass C; Cmin: mineralizable C; Nmin: mineralizable N;β-glu: β-glucosidase; DHA: dehydrogenase; FDHA: fluorescein diacetate hydrolyzing activity; URE: urease activity; ns: non-significant; numbers followed by different letters are significantly different at p ≤ 0.05 by Duncan’s multiple-range test; * indicates significance at p ≤ 0.05; ** indicates significance at p ≤ 0.01.
Table 2. Soil nutrient attributes and significant correlations with soil microbial and metabolic activities.
TreatmentTotal NKMnO4–NOlsen’s PNH4OAc–KCaCl2–SNH4OAc–CaNH4OAc–MgDTPA FeDTPA MnDTPA ZnDTPA CuAvail B
%kg ha−1c mol(P+) kg−1mg kg−1
Fallow0.71 c133.2 c38.5 d216.0 c22.4 c12.0 cd3.7 c48.3 c30.3 a1.063.2 d0.51 bc
Control0.75 c136.4 c34.3 d247.0 ab21.5 c10.0 d4.4 b118.0 b23.0 b1.086.3 c0.40 d
NPK0.81 b151.8 b72.5 a245.0 b22.1 c11.9 ab5.0 b137.5 a22.6 b1.127.3 ab0.47 c
NPKF0.91 a162.0 a61.5 bc253.6 ab51.8 a12.6 ab5.8 a137.2 a22.8 b1.217.0 abc0.63 a
NPKP0.79 b153.9 ab55.4 c257.0 ab47.9 ab13.7 a4.5 b136.4 a21.8 bc1.26.6 bc0.55 b
NPKG0.83 b157.9 ab45.7 d252.3 ab44.4 b11.7 bc4.7 b130.5 ab17.3 c1.147.7 a0.62 a
LSD0.050.049.27.3126.63.90.613.65.2ns0.80.05
Significant correlations between soil organic C and soil microbial activities
WBOC***nsns**nsnsnsns*ns**
MBC*****ns**nsnsnsns**ns**
Cmin*********ns********
Nmin******ns**ns***ns*****
β–glu**********ns***********
DHA**********ns**ns*ns**
FDHA*********ns**********
URE********ns****ns*****
Fallow, control (no N-P-K fertilizers or organics); 100% recommended dose of inorganic fertilizer (NPK); NPK + farmyard manure (NPKF); NPK + paddy straw (NPKP); and NPK + green manure (Sesbania sesban L.) (NPKG); WBOC: WBOC: Walkley and Blackorganic C; MBC: microbial biomass C; Cmin:mineralizable C; Nmin: mineralizable N; β-glu: β-glucosidase; DHA: dehydrogenase; FDHA: fluorescein diacetatehydrolyzing activity; URE: urease activity; ns: non-significant; numbers followed by different letters are significantly different at p ≤ 0.05 by Duncan’s multiple-range test; * indicates significance at p ≤ 0.05; ** indicates significance at p ≤ 0.01.
Table 3. Soil microbial activities attributes and significant correlations among soil microbial and metabolic activities.
TreatmentWBOCMBCCminNminβ-gluDHAFDHAURE
Fallow9.9 b583.0 d6.99 c1.63 bc64.0 c58.0 c72.7 c45.0 c
Control8.2 d417.3 e7.28 c1.38 c72.1 bc57.9 c71.5 c54.8 bc
NPK9.3 c637.4 c7.43 c1.94 bc80.4 b58.7 c81.7 b62.6 b
NPKF10.9 a759.3 a11.63 a2.59 a106.1 a96.7 a101.3 a78.6 a
NPKP9.9 b763.5 a9.84 b2.05 ab100.0 a83.4 b94.3 a63.9 b
NPKG10.2 b711.9 b10.75 ab2.19 ab99.7 a82.3 b97.5 a64.5 b
LSD0.050.3814.51.040.6110.19.77.911.2
Significant correlations between soil organic C and soil microbial activities
WBOC1.00*************
MBC**1.00************
Cmin****1.00**********
Nmin******1.00********
β-glu********1.00******
DHA**********1.00****
FDHA************1.00**
URE*************1.00
Fallow, control (no N-P-K fertilizers or organics); 100% recommended dose of inorganic fertilizer (NPK); NPK + farmyard manure (NPKF); NPK + paddy straw (NPKP); and NPK + green manure (Sesbania sesban L.) (NPKG); WBOC: Walkley and Black organic C in g kg−1; MBC: microbial biomass C in µg C g1; Cmin: mineralizable C in C in µg C g1 d1; Nmin: mineralizable N in µg NH4-N g1 d1; β-glu: β-glucosidase; DHA: dehydrogenase in µg TPF g1soil 24 h1; FDHA: fluorescein diacetate hydrolyzing activity in µg fluorescein g1 soil h1; URE: urease activity in µg NH4-N g−1 soil 2 h1; AcP, AlP, and ArS are acid phosphatase, alkaline phosphatase and aryl sulphatase in µg p-nitrophenol g1 soil h1; Numbers followed by different letters are significantly different at p ≤ 0.05 by Duncan’s multiple-range test; * indicates significance at p ≤ 0.05; ** indicates significance at p ≤ 0.01.
Table 4. Soil quality assessment using the Soil Management Assessment Framework (SMAF).
TreatmentFallowControlNPKNPKFNPKPNPKGLSD0.05
Physical indicators
TMacAS0.98 a0.34 e0.55 d0.94 ab0.91 b0.79 c0.04
Bulk density0.84 c0.87 bc0.88 bc0.92 a0.89 ab0.90 ab0.04
Chemical indicators
pH0.94 a0.87 bc0.88 bc0.86 d0.87 cd0.88 b0.01
Cation exchange capacity0.87 c0.83 d0.88 c0.92 b1.00 a0.90 bc0.03
Nutritional indicators
KMnO4–N0.80 c0.82 c0.91 b0.98 a0.9 ab0.95 ab0.06
DTPA–Zn0.83 b0.84 ab0.87 ab0.94 a0.94 a0.89 ab0.10
Hot water extractable B0.78 bc0.63 d0.73 c0.97 a0.84 b0.96 a0.10
Biological and biochemical indicators
WBOC0.90 b0.75 d0.85 c0.99 a0.90 b0.93 b0.03
MBC0.49 d0.75 c0.82 b0.97 a0.98 a0.96 a0.03
Cmin0.59 bc0.50 c0.70 bc0.94 a0.74 ab0.79 ab0.23
β-glu0.53 d0.60 cd0.67 c0.93 a0.87 ab0.89 a0.08
Fallow, control (no N-P-K fertilizers or organics); 100% recommended dose of inorganic fertilizer (NPK); NPK + farmyard manure (NPKF); NPK + paddy straw (NPKP); and NPK + green manure (Sesbania sesban L.) (NPKG); TMacAS: Macro-aggregate stability; WBOC: Walkley and Black organic C; MBC: dehydrogenase; FDHA: fluorescein diacetate hydrolyzing activity; URE: urease activity; numbers followed by different letters are significantly different at p ≤ 0.05 by Duncan’s multiple-range test.
Table 5. Results of the regression analysis.
Method/ModelRegression EquationsR2Adj. R2SE #
FullERY = 40.14 − 167 β-glu – 2.94 Cmin + 0.004 KMnO4–Nb + 0.067 Cmica + 0.379 TMacA0.890.834.25
ForwardERY = −81.71 + 0.929KMnO4–Nb0.770.755.16
FullERY= 121.56 – 10.78 WBOCb + 21.9 Nminb0.500.417.93
FullSOC = 6.07 + 0.04 β-glu + 0.44 Cmina+ 0.007 KMnO4–N – 0.009 Cmica + 0.024 TMacA0.830.740.47
ForwardSOC = 7.08 + 0.58Cminb -0.004 Cmica0.690.640.56
FullNmin = −1.80 + 0.012 β-glu + 0.19 Cmin + 0.016 KMnO4–N– 0.003 Cmic + 0.014 TMacA0.710.540.33
ForwardNmin = 0.22 + 0.02β-glub0.560.530.33
# Standard error of estimate; a Significant: p < 0.05. b Significant: p < 0.01. bold and italic figures indicate highly weighted variables among the respective regression equations.
Publisher’s Note: MDPI stays neutral with regard to jurisdictional claims in published maps and institutional affiliations.

