Article

Climate Change and Seed System Interventions Impact on Food Security and Incomes in East Africa

1
Alliance of Bioversity International and CIAT, via Katalima Road, Naguru, Kampala P.O. Box 24384, Uganda
2
Alliance of Bioversity International and CIAT, KIRDI Office, Kisumu P.O. Box 6017, Kenya
3
Mekelle University, Makelle-Tigray P.O. Box 231, Ethiopia
4
Alliance of Bioversity International and CIAT-Africa Hub, Kenya Regional Office, Duduville Campus, Nairobi P.O. Box 823-00621, Kenya
*
Author to whom correspondence should be addressed.
Sustainability 2022, 14(11), 6519; https://doi.org/10.3390/su14116519
Submission received: 6 May 2022 / Revised: 18 May 2022 / Accepted: 23 May 2022 / Published: 26 May 2022
(This article belongs to the Topic Climate Change and Environmental Sustainability)

Abstract

:
Climate change is challenging agricultural productivity, especially in Africa. Adoption of improved or diverse seed varieties is a promising strategy to achieve increased yields, support food security and reduce poverty under climate change in East Africa. However, rigorous impact evaluations linking the contributions of improved seeds to the welfare of households have been limited. This paper evaluates the impact of diversified seed systems on farm household production, sales, income, consumption and seed storage in Kenya and Uganda. It applies four-cell analysis to explore the intra-specific diversity of crops within farming systems, using primary data obtained from a random sampling of 207 treatment households and 87 control households. Propensity score matching was used to investigate the relationship between adoption of improved seeds and changes in production, sales, income, consumption, seed storage and food security. Econometric results indicate that treatment households using improved seeds saw a significant positive impact on income from bean seed sales, sorghum and millet consumption, bean livestock feed and maize and millet seed stored. We conclude that increasing seed diversity helps farmers cope with climate change and increases productivity, food availability, incomes and food security. Partnerships among seed improvement stakeholders need to be enhanced to ensure a continued supply of appropriate seeds to farmers.

1. Introduction

The world population stands at about 7.9 billion and is expected to reach 8.6 billion by 2030 and 9.8 billion in 2050, with the majority of this growth in Africa [1,2]. Climate change poses a serious and exponential threat to the food and nutrition security of resource-poor smallholder farmers globally [3,4]. In Africa, climate change effects have led to a low crop production that has exposed about 286 million people to hunger and malnutrition as a result of food insecurity [5,6]. Sub-Saharan Africa (SSA) is the region with the highest prevalence of food insecurity and micronutrient malnutrition [6,7,8]. This is due to an over-reliance on rainfed agriculture, food with low nutritional value and high antinutritional components, conflict, climate shocks, economic down-turns due to COVID-19, widespread poverty and inequalities, and the high prevalence of crop pests and diseases [6]. In East Africa, beans, maize, millet and sorghum are key staple food crops, mostly grown by, and consumed within, poor rural households [9]. These cereals and legumes are resilient to drought—making them suitable to be grown in different, often harsh climates—and are therefore reliable food crops [10,11].
In East Africa, climate change has been the driver of, or has driven, a general loss of genetic diversity, resulting in increased food insecurity that has affected over 18 million people [12]. Moreover, genetic resources in this region are also highly threatened by demographic pressure, invasive species, structural changes in the agricultural sector and land-use intensification, among other factors [13]. As a result of continued genetic diversity loss, farmers have a very narrow gene pool on which to depend for food, nutrition and income. The effects of this threat have prompted widespread concern, leading researchers to investigate and identify strategies to increase the diversity of staple crops that contain farmers’ preferred characteristics/traits. There has subsequently been introductions of newer and improved varieties with useful traits for climate change adaptation such as heat and drought tolerance, pest and disease resistance, early maturity, yields and richer nutritional value [4,14]. Adapted varieties have the potential to reduce the risk of food insecurity and malnutrition by enhancing the resilience of agricultural systems, based on current and predicted future needs [15,16]. Improving seed systems [17] can assist in increasing the adaptive capacity of smallholder farmers to climate change and in meeting sustainable development goals (SDGs) such as SDGs one (poverty), two (zero hunger) and three (good health and wellbeing) through enhanced productivity and income generation. However, the main challenges hindering farmers’ accessibility to these improved varieties are the high costs of seeds, lack of knowledge of the existence of the varieties or where to obtain them, acceptance of non-local seeds by the farmers, storage characteristics, taste, stability in seed supply, relationship with local seed traders and the low priority of investment in farm inputs such as seed [18,19,20].
To address these challenges, the Seeds for Needs (S4N) initiative [21] has been working with farmers across Asia and Africa to understand how crop genetic diversity can help minimize agricultural production risks related to climate change. Through this initiative, bean, finger millet and sorghum varieties from the national gene banks of Uganda, Kenya and Tanzania were introduced to farmers at two project sites in Uganda and Kenya. The farmers tested these varieties through participatory methods to select the best-performing varieties. In the two S4N sites, community seed banks were also established to improve farmers’ access to seeds, and to conserve and preserve the genetic diversity that was introduced. Our main research was driven by questions on whether the introduction of new diversity led to (i) the adoption of new varieties by farmers and, (ii) an improvement in household food consumption, agricultural productivity and livelihoods.
The study presented in this paper used two types of data—qualitative data collected through focus group discussions (FGDs) to understand the dynamics related to the adoption of new varieties within farming systems and household data derived from socio-economic and demographic characteristics—to analyse the impact of the S4N interventions on households’ crop production, sales, income and food security among respondents from Nyando in Kenya and Hoima in Uganda.

1.1. Genetic Diversity in Seed Systems and Its Link to Food Security

Seed systems comprise the activities and means through which farmers obtain seeds of the varieties that have the traits they desire. Seed systems can either be formal, semi-formal, or informal. A formal seed system is regulated and has an organized set of activities, from breeding to delivering certified seed of known and registered varieties to farmers [22]. An informal seed system, on the other hand, consists of a traditional or local seed system with farmer-saved seeds exchanging hands through various channels such as neighbours, local markets, community seedbanks and local cooperatives, often without the control of the government [6]. A semi-formal system—also known as “community based”—comprises local community-based seed production initiatives with quality control mechanisms that are less stringent, i.e., where only a small amount of the production fields are controlled by quality control agencies and the remainder are left to the producers themselves to certify seed quality. These are the main sources of quality declared seeds (QDS) [6,23].
In developing countries—where issues such as poor soil quality, water availability, pests, diseases and other biological and social factors such as poverty and land holding are prevalent and predominant—climate change is causing farmers to face even greater, unprecedented agricultural production challenges. Many seed varieties exchanged in the existing seed systems do not fare well under changing climatic and local conditions—many of which are therefore no longer planted, indirectly causing genetic diversity loss. Hence, the seed systems do not adequately serve local farmers’ needs by providing the seed diversity and traits needed to respond to climate-related stresses or provide crop resilience [15,16,24,25]. Smallholder farmers in East Africa’s rural areas are particularly vulnerable to climate change and could benefit from access to and exchange of appropriate genetic resources, such as drought-resistant, climate-adapted seed, as well as the knowledge needed to make the best use of those resources [19].
Crop genetic diversity is not only the basis of food and agricultural systems, but also a reservoir of useful genes to cope with biotic and abiotic stresses that result from climate change [26,27]. Furthermore, crop inter- and intra-specific variation provides the basis for more productive and resilient production systems, making these resources better able to cope with stresses such as drought [28]. Introducing improved crop diversity or landraces with adaptive potential from other geographic areas into farmers’ seed systems not only improves crop productivity but also food security, while offering dietary and nutritional diversity. Seeds perform many functions in agriculture. They are not only carriers of the genetic information that underpins all food and agriculture, but also the primary input in crop production, and thus a key element of food security and rural development. One frequently mentioned strategy for adapting agriculture to climatic changes is to utilize crop genetic diversity that has been identified as resistant to climate-related abiotic and biotic stresses [29]. Genetic diversity is used by plant breeders to develop new and improved cultivars with desirable characteristics, which include both farmer-preferred traits (e.g., yield potential, early maturity and large seed, among others) and breeders’ preferred traits (e.g., pest and disease resistance). Natural genetic variability has therefore been exploited to increase yields and improve productivity to meet both subsistence food requirements and also generate a surplus, which can then be sold to generate incomes and livelihoods [30].

1.2. Seed Systems for Food Security

Seed security is a prerequisite for smallholder farmers’ food security. Seed security depends on the types of seed systems farmers use and the way they function. Farmers, particularly smallholders, are involved in all three seed systems—formal, informal and semi-formal/community-based types—for the production and access to the seeds they need and prefer [31]. However, in most countries in Africa, seed systems are still largely informal, consisting of seed sourced from farmers’ neighbour exchanges, their own saved seed, or seed obtained from local marketplaces, which can supply up to 80% of seed for some crops and geographies [29]. Smallholder farmers frequently use these informal seed networks to obtain desired local varieties, which may or may not be accessible in the desired quantity or price through formal channels within the communal network [32].
Seed systems can deliver multiple benefits to smallholders such as enhanced food security and income, better nutrition and greater resilience to climate stresses [33]. “Food security” in this context is defined as availability, accessibility and stability of the food supply chain. Genetic diversity is essential for maintaining and improving food security for both farmers and breeders and is also the repository of traits that can be used in crop improvement. Seed systems function optimally when the interaction between seed system actors and activities, and environmental and socio-economic drivers work efficiently to provide seed security and ultimately food security. Seed systems thus need to offer a ready supply of crop and varietal diversity, adapted to local conditions, of acceptable quality that reaches farmers in time for the planting season. Evidence from past studies indicates that increasing both inter- and intra-specific diversity in seed systems provides farming households with increased dietary and nutritional diversity and a wider range of food choices that can improve food security outcomes [34].
Interventions aimed at increasing diversity in local seed systems could therefore be critical in supporting climate change adaptation, creating resilience on farm and improving food security and livelihoods [24]. Interventions applied to seed systems often include participatory varietal testing and selection [35,36] and community seed banking [37,38]. Some studies have shown that introducing a broader range of genetically diverse crops and seeds through farmer-led field trials has improved crop response to pests and diseases on farms [35] and improved farmers’ awareness and ability to utilize genetic sources of resistance to climate-related challenges [29,37]. Community seed banks are repositories of local genetic diversity that are often adapted to prevailing climate conditions, including biotic stresses. They play an important role in supporting community-based strategies for adaptation to climate change and improvement of crop production [37]. Community seed banks improve farmers’ access to seeds, not through seed purchases but through a system of seed loans, whereby farmers borrow a quantity of seed that they return with interest (in the form of extra seed) [38]. This helps to maintain and extend the range of diversity within the seed bank at a very low cost to farmers and provides easy access to the seed because it is housed within their localities.

2. Materials and Methods

Seven hundred and thirty-nine accessions of bean, finger millet and sorghum germplasm maintained in the three countries’ national gene banks were identified based on their potential suitability to grow in similar climates across the three countries. Four hundred of these accessions were then exchanged among the three national gene banks—using Standard Material Transfer Agreements (SMTAs)—for further multiplication. After a series of multiplications, a total of 188 accessions of beans, finger millet and sorghum were tested and evaluated using participatory methods such as crowdsourcing trials by 1000 farmers against parameters such as fast maturity, pest and disease resistance, drought tolerance and yield. Crowdsourcing is an approach that helps to break down a large task, such as testing, into microtasks that can be carried out by individuals in a space of time, while also helping to easily retrieve and combine the results needed to accomplish the original large task [39]. Using this approach, batches of three “blind varieties” were distributed to farmers for their evaluation. Out of the 188 tested accessions, farmers selected 44 accessions of bean, finger millet and sorghum based on their desirable attributes. After this process, data were collected to measure the impact of the intervention on food security and incomes. This study relied on both ex-ante and ex-post data collected in October 2016 and again in October 2019 from a sample of farmers at the intervention sites of Hoima in Uganda and Nyando in Kenya (S4N farmers), as well as control group farmers—composed of individuals who were not beneficiaries of the S4N study.
To identify farmers for the initial baseline survey conducted in 2016, the research team utilized a snowball sampling or chain-referral methodology, which is a common method for determining the sample size for a network survey. During FGDs, we initially picked two nodal farmers, a woman and a man, from each village for first interviews. These farmers submitted the names of several other farmers from whom they acquired seed and/or information on seeds as part of the network survey. The farmers mentioned by the first two responses were then surveyed. This cycle of farmers inside the community network was completed when the interviewed farmers started mentioning the same names again. A total of 654 farmers were interviewed. A list of seeds used by the farmers in the selected communities in Kenya and Uganda was drawn up and included beans, maize, millet and sorghum. Of the total number of households using a diversity of seeds, a total of 294 were randomly selected. Following the probability proportional size sampling procedure, this resulted in a random selection of 207 S4N (treatment) and 87 non-S4N (control) households from both Kenya and Uganda in the 2019 survey. To determine the impact of the study, we compared the outcomes of the study households to what they would have produced and/or earned had they not participated in the study. A control group was used to distinguish the effect of the interventions from other factors that would necessarily affect the outcomes. It was also important that the control group resembled the treatment group to enable meaningful comparison.
For the data collection process, we selected and trained enumerators who were conversant in English and local dialects in the study regions. Moreover, three supervisors were employed to closely supervise the data collection and provide real-time feedback when needed. A pre-test of the questionnaire developed by the research team was conducted among 20 non-sampled households and questions were adjusted based on feedback from the pre-test exercise. Both qualitative and quantitative data were collected through onsite, face-to-face interviews with the farmers and captured on the Open Data Kit (ODK) platform using tablets. Farm-level data such as socio-economic, institutional and demographic data of the study and control respondents (household head) were gathered. A description of dependent and independent variables is presented in Table 1. The study also produced an inventory of farmers’ seed sources, and the extension services farmers receive.
In addition to the survey data collection, we conducted a four-cell analysis—a rapid assessment technique used to assess the extent and distribution of crop diversity within farming communities, including inter- and intra-specific diversity—in 2016 and again in 2021 for comparison in the two sites to complement the survey data gathered in 2016 at baseline and in 2019 for comparison. Four-cell analysis helps to understand and document the dynamic status of diversity within the communities (Table 2). A comparison of the data first collected in 2016 and again in 2021 illustrates the differences in the level of diversity present within the communities over time and whether the intervention varieties tested continued to be grown by the recipient farmers. We used this participatory tool to map bean, finger millet and sorghum diversity in the project sites, as illustrated in Table 1. The FGDs used to gather the data were gender disaggregated and consisted of 30 farmers in 2016 (17 women and 13 men) interviewed separately, and about 32 farmers in 2021 (17 women and 15 men).

2.1. Definition of Measurement Variables

To determine the project’s impact, we needed to determine the outcomes of the household compared with what they would have produced and/or earned had they not participated in the project. To estimate the counterfactual, a control group, composed of individuals who are not beneficiaries of the project, was used to distinguish the effect of the interventions from other factors that would necessarily affect the outcomes. The control group resembled the treatment group to enable meaningful comparison. To match households in the project and those in the control group, we estimated the propensity score, which is the likelihood of participating in the project. Participating households were matched to households in the control group if they had similar propensity scores. The propensity scores were estimated using a logit regression model, with the covariates (summary of the key household characteristics) as defined in Table 2.

2.2. Data Analysis

The study employed inferential, descriptive statistics and a propensity score matching (PSM) method to analyse the data. Descriptive statistics such as mean and standard errors were used to present statistical summaries of quantitative data pertaining to socio-economic, demographic and institutional household characteristics. The inferential statistics such as t-test and z-test were used to assess the existence of statistically significant differences in observations between the study and control respondents. Household income and outgoings (sales) variables were considered to calculate the annual income (in US$) obtained from crops and other income-generating household activities.

2.3. Theoretical Framework for Propensity Score Matching

A PSM approach was used to examine the impact of improved seed systems on farm household production, sales, income, consumption and seed storage in East Africa. Accordingly, while estimating the impact(s) of adopting a given technology, it remains appropriate to use a logit model to derive propensity scores [40]. Based on observable characteristics, the method compares the S4N households using improved seeds with that of the control group that did not adopt new, diverse seeds. This study used a binary treatment measure where Di = 1 if individual i used improved seeds and 0 otherwise. The potential outcomes are then specified as Yi for each individual i, where i = 1…N and N denotes the total sample size. Before the introduction of new diversity, each individual farmer would have to have had an outcome, Yi. After the new diversity was introduced, each individual had two hypothetical outcomes; Y1i if the individual i is in the intervention area and Y0i if the individual is not in the intervention area; then, there exists a causal effect (T1i):
T i = Y 1 i Y 0 i
The fundamental evaluation problem arises because only one of the potential outcomes can be observed for each individual i afterwards. The missing outcome, called the counterfactual outcome, answers the question ‘What is the quantity of output and income that an intervention farmer i would have obtained (i.e., the outcome) if he/she had not obtained new seed diversity?’. Therefore, it is not possible to estimate the individual treatment effect Ti.
The average treatment effect (ATE) for the S4N and control was calculated by averaging over the population (Y1iY0i) [41], indicating that using a PSM technique has gained popularity for the estimation of ATEs. The ATE is defined as E (Y1iY0i), and is the ATE for a person randomly selected from the population. The purpose of the PSM analysis, on the other hand, is to estimate the average treatment effect on the treated (ATT) subgroup [42]. Employing the ATT estimator on matched S4N and control farmers who are closest in terms of their propensity scores, we estimate the effect of using introduced seed diversity on farm output and income earned by the farmer. The following formula calculates the average treatment effect on the treated population:
T A T T = E [ Y 1 i Y 0 i | d = 1 ]
T A T T = E [ T | d = 1 ] E [ Y 1 i | d ] E [ Y 0 i | d = 1 ]
When the treated population is not treated, E[Y0i|d = 1] is the missing outcome and must be properly replaced when estimating the ATT. However, replacing the untreated individuals’ mean outcome, E[Y0i|d = 0], is not acceptable since self-selection bias may exist. This bias occurs when the same components that also affect the decision to receive treatment affect the outcomes [43].
In such cases, the individuals in the treatment and comparison groups would have different outcomes even in the absence of treatment. In the presence of bias, the following holds:
A T T b i a s = E Y 1 i d = 1 E Y 0 i d = 0 T A T T + E Y 1 i | d = 1 E [ Y 0 i | d = 0 ]
The difference between the left-hand side of Equation (3) and ATT is self-selection bias. The true parameter without bias, ATT, is only attained naturally when treatments are given at random, so that untreated households would have the same outcome as treated households if the improved thresher was not there. Then, we have:
= E Y i | d = 1 E Y 0 | d = 0 = 0
In observational data, propensity score approaches are extensively used to match S4N and non-treatment farmers as in the case of this paper to remove selection bias, based on observed features.
To ascertain the absence of multicollinearity between the explanatory variables used in the impact assessment, variance inflation factors (VIF) were computed for each of the variables. The VIF was calculated as:
V I F i = 1 1 R i 2
where V I F i is the variance inflation factor for the i t h explanatory variables and R i 2 denotes the R 2 of the regression i t h independent variable as a dependent variable. The VIF results are shown in Appendix A Table A8 with a mean VIF of 1.12. According to [44], variables that have V I F < 5 are considered to have no multicollinearity.

3. Results

3.1. Descriptive Statistics of the Respondents

Table 3 shows the combined results of households’ socio-economic and demographic characteristics in Nyando, Kenya and Hoima, Uganda. From the results, we note that there were no significant differences between S4N and non-treatment respondents. However, farmers who benefited from the project had more male-headed households who had a lower level of education, fewer households earned income from business and the households were closer to the market compared with non-treatment households. Moreover, the t-test shows that there were significant differences in the age of the household head of S4N and non-treatment respondents at 10% significance level. The mean age of S4N respondents was 50.71 years and the mean age of non-treatment respondents was 47.56 years, indicating that the S4N household heads were significantly older, implying that they likely participated more (87.4%) in farmers’ groups than the (73.3%) non-treatment household respondents.
Several economic variables in relation to land size, land ownership, number of plots, employment income, business income and source of labour were included among the categories of economic factors. According to the results, there were minimal differences between S4N and non-S4N in terms of household size, land size, land ownership and income from employment. The results further show that S4N household respondents relied more on unpaid family labour, even though the difference observed was not statistically significant between the groups in all the economic variables.
Among the two institutional variables studied, only one variable, “farmers’ group” was found to be statistically different at 1% significance level between the S4N and non-S4N household respondents. Among the reasons given for participating in farmers’ groups (Figure 1a,b), about 35% and 30% of the households in Kenya and Uganda, respectively, indicated that they joined because they are common in the community. About 17.5% (Kenya) and 28% (Uganda) indicated that farmers’ groups support them during farming, while 5% (Kenya) and 27% (Uganda) indicated that they joined because the groups provide farming advice. Less than 1% (Kenya) and 10% (Uganda) of the respondents indicated that farmers’ groups provided them with support in times of need. About 95% of the respondents indicated that the farmers’ groups benefitted them in terms of enhancing their income and boosting crop harvest and production.

3.2. Interventions on Crop Production

Figure 2a provides a summary of the differences in production of the main crops—beans, maize, millet and sorghum—between 2016 and 2019. Generally, crop production for beans, maize and millet was higher in 2019 compared with 2016. Secondly, S4N households had higher production levels both in 2016 and 2019 except for sorghum and millet (Figure 2b). See tabulated results in Appendix A Table A1.

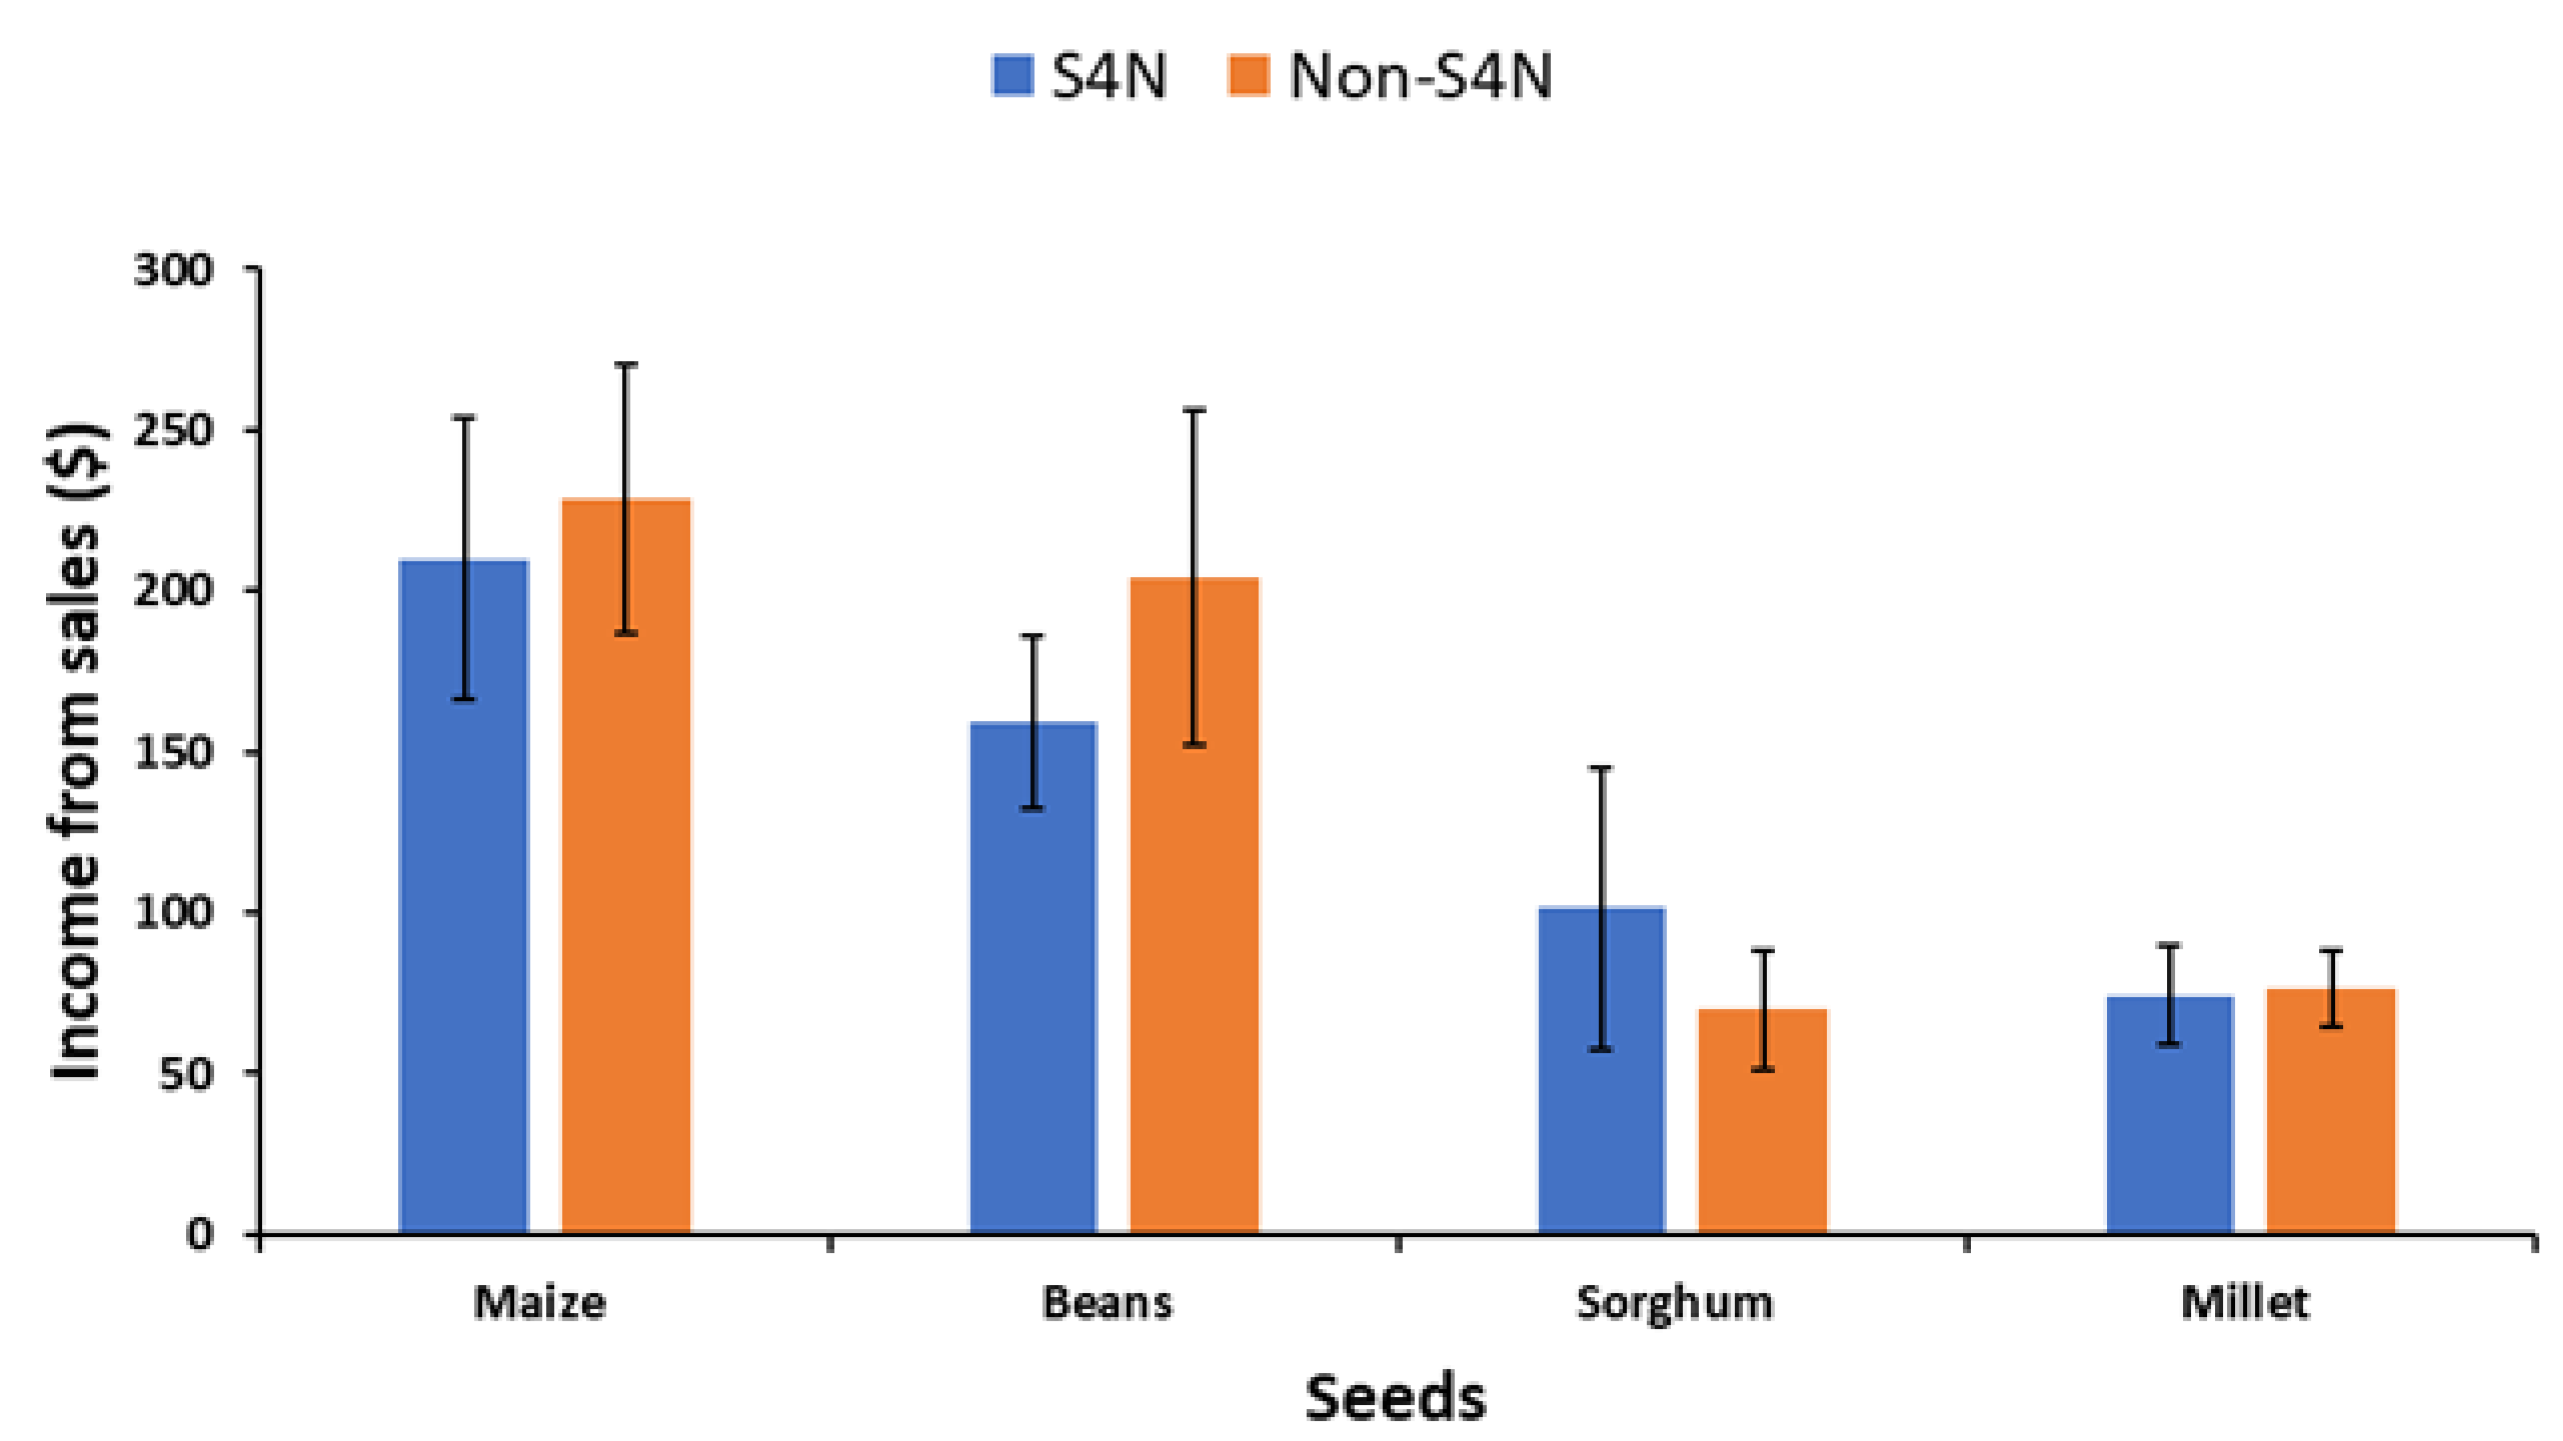
3.3. Impact of the Intervention on Income from Seed Sales

Figure 3 shows the differences in mean income from the sale of bean, maize, millet and sorghum seeds. Generally, the S4N households earned a lower income from crop sales, except for sorghum, compared with non-S4N households.

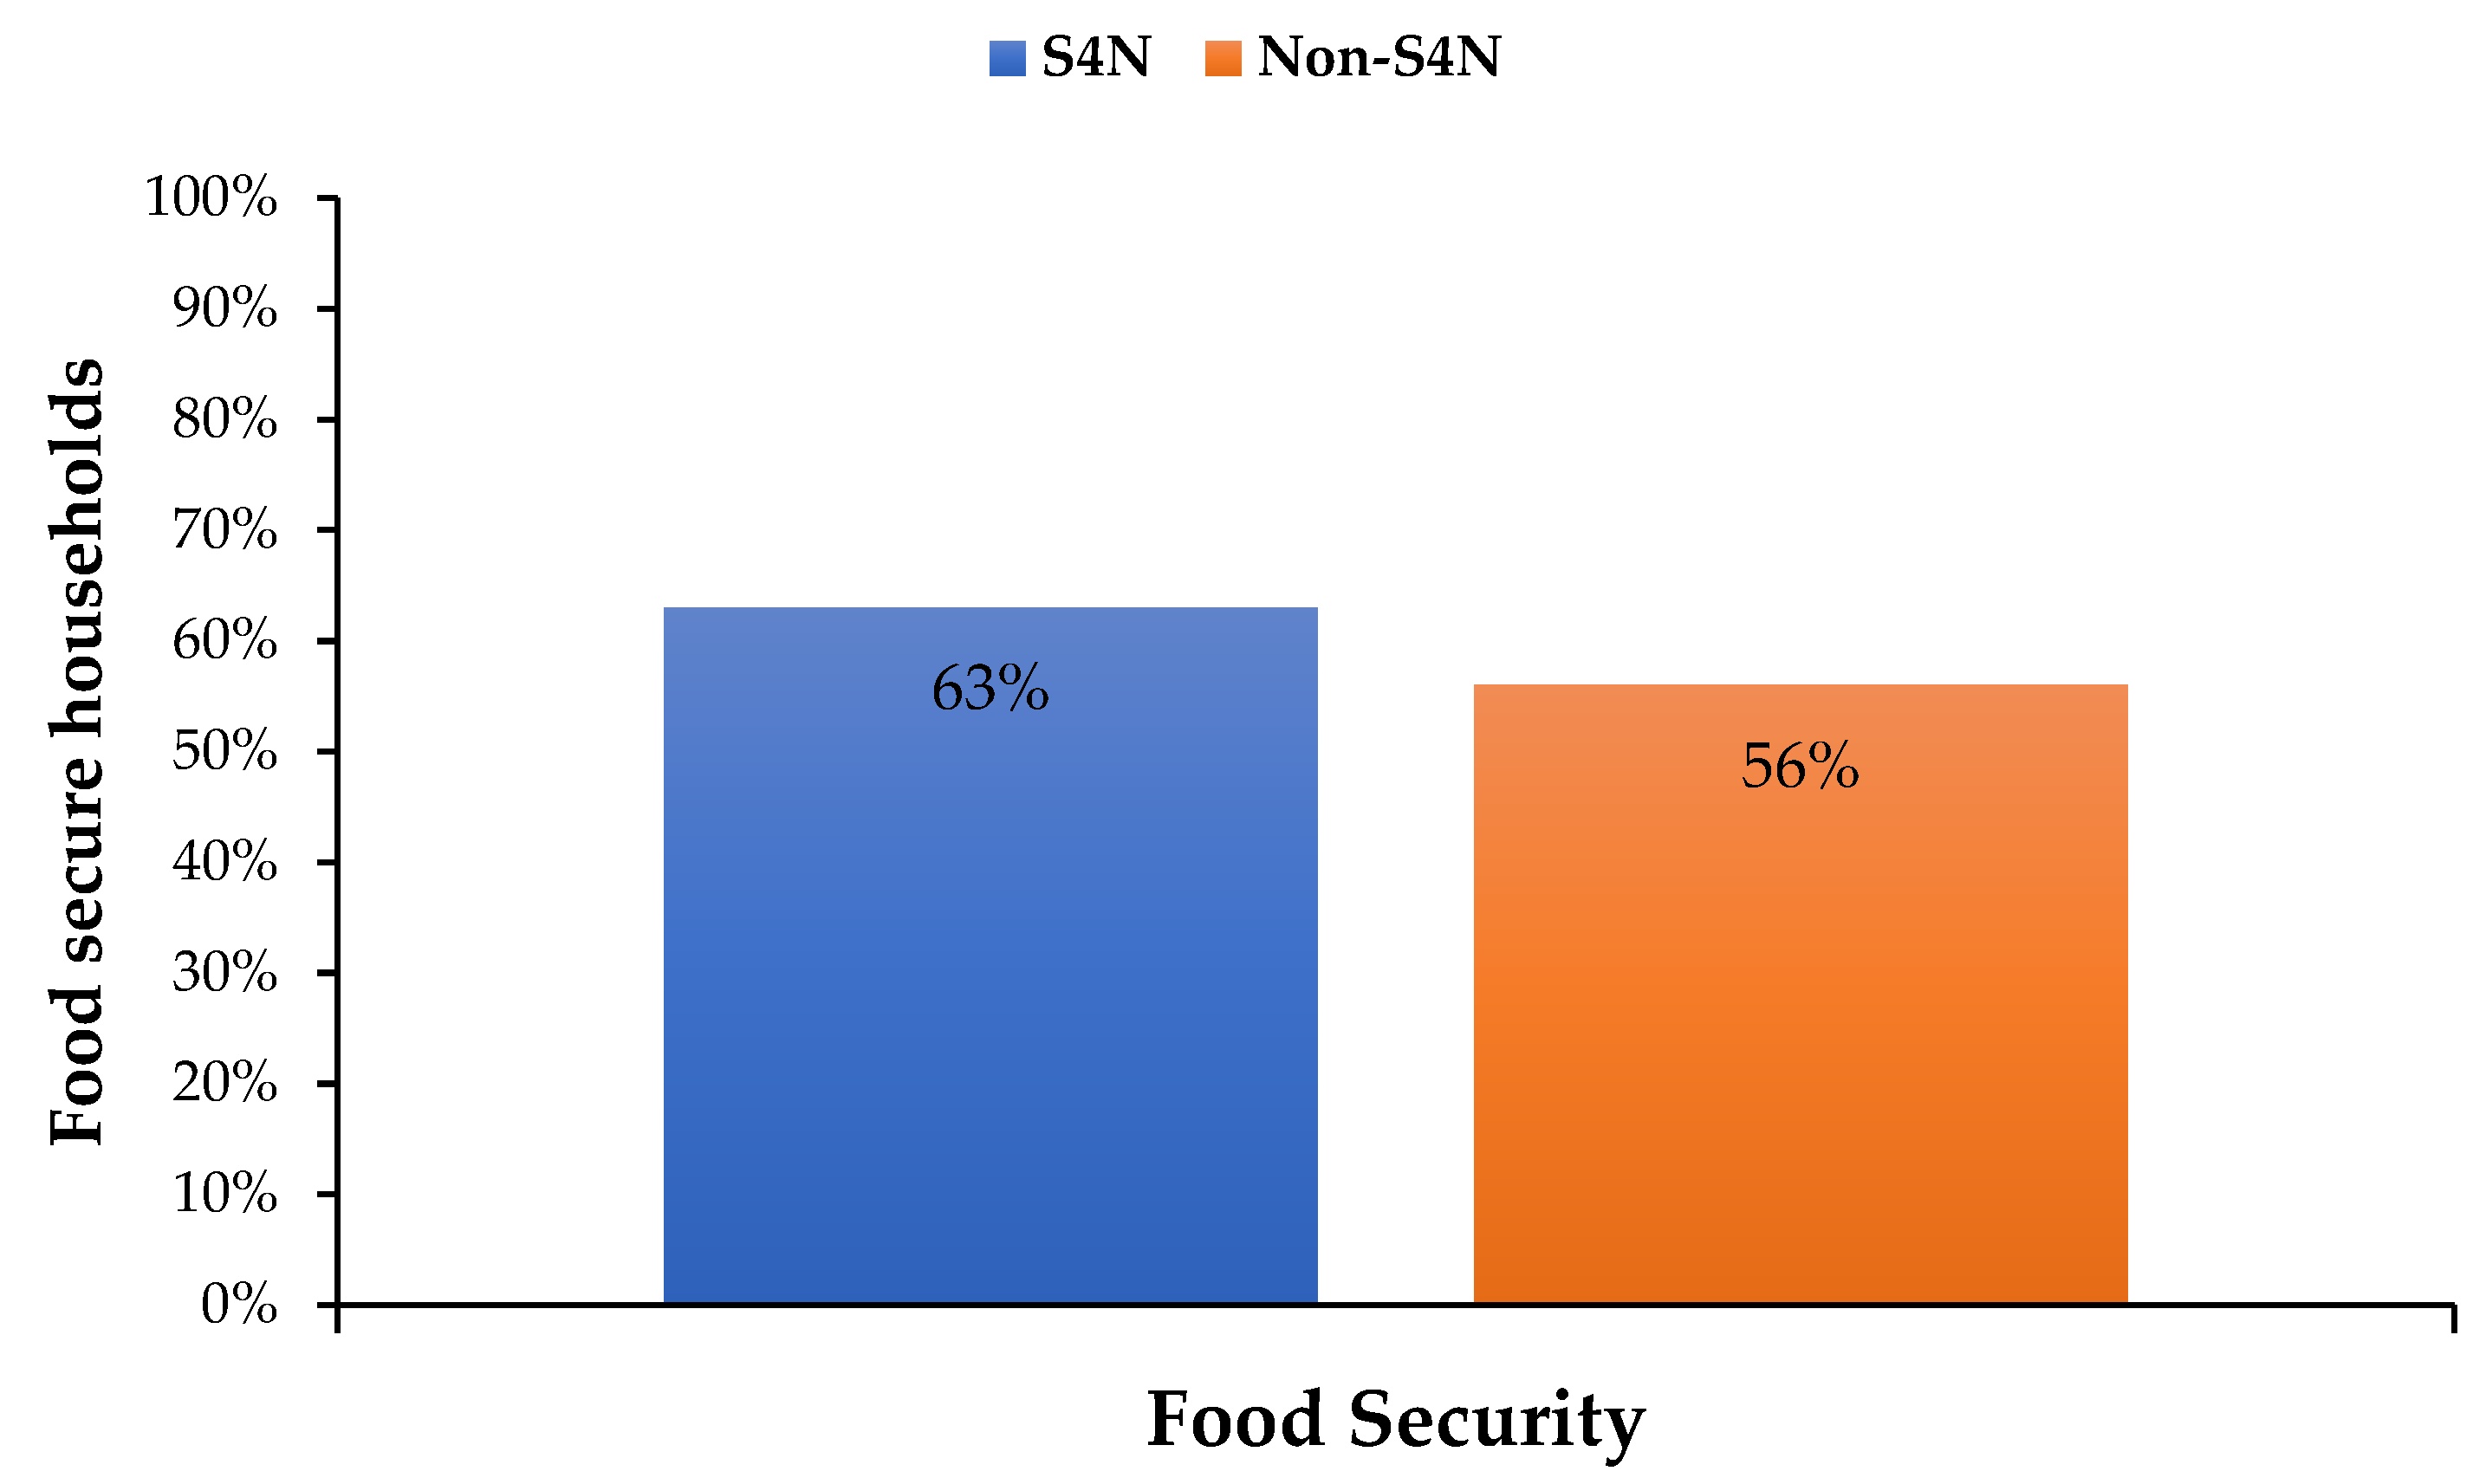
3.4. Impact of the S4N Intervention on Food Security, Household Consumption, Livestock Feeding and Seed Storage

Figure 4 shows the differences in means between the S4N households and non-S4N in terms of household consumption, livestock feeding and seed storage. S4N participating households consumed fewer of the crops compared with non-S4N households, with the exception of bean. The quantity of crops used for livestock feed was also higher in the non-S4N households compared with S4N households, even though these differences were not statistically significant. Regarding seed storage, non-S4N households stored more seeds compared with participating households, with a 5% statistical significance on the amount of maize stored, with the exception of millet. Overall, the results show that, on average, 63% of the S4N households are more food secure compared with 56% of non-S4N households, even though the differences were not statistically significant (Figure 5). This is attributed to the fact that the S4N households consume less, and feed less produce to livestock, contributing to storing more seeds compared with non-S4N households. See tabulated results in Appendix A Table A1, Table A2 and Table A3.

3.5. Econometric Model Estimated Result

Estimated Overall Impact Results of PSM

The causal effect impact of improved seed systems interventions was estimated using PSM. Pmatch2 command was implemented on STATA 16.0 platform to analyse the data. We estimated the impact of the S4N project based on the results of the estimation of propensity scores and average treatment effect (ATE), as presented in Table 4. From the estimations, the probability of households’ participation in the study was estimated using a logit regression model. All the observable covariates and outcome indicators that affect the participation, crop production, crop sales, human consumption, livestock feeding, seed storage and food security—for which the observational data were available—were considered in the model. Overall, the model was statistically significant, particularly for income and seed storage of crops. Based on our findings, we note the existence of statistically significant differences between the S4N (treated) and non-S4N (control) households regarding the distribution of income from the sale of beans, sorghum and millet for human consumption, bean livestock feeding, as well as maize and millet seed stored (Table 4, column 2). As presented, these variables were responsible for the differential participation in the S4N project impact study. The study did not look into how and why each of the covariates affected the household participation in the intervention.

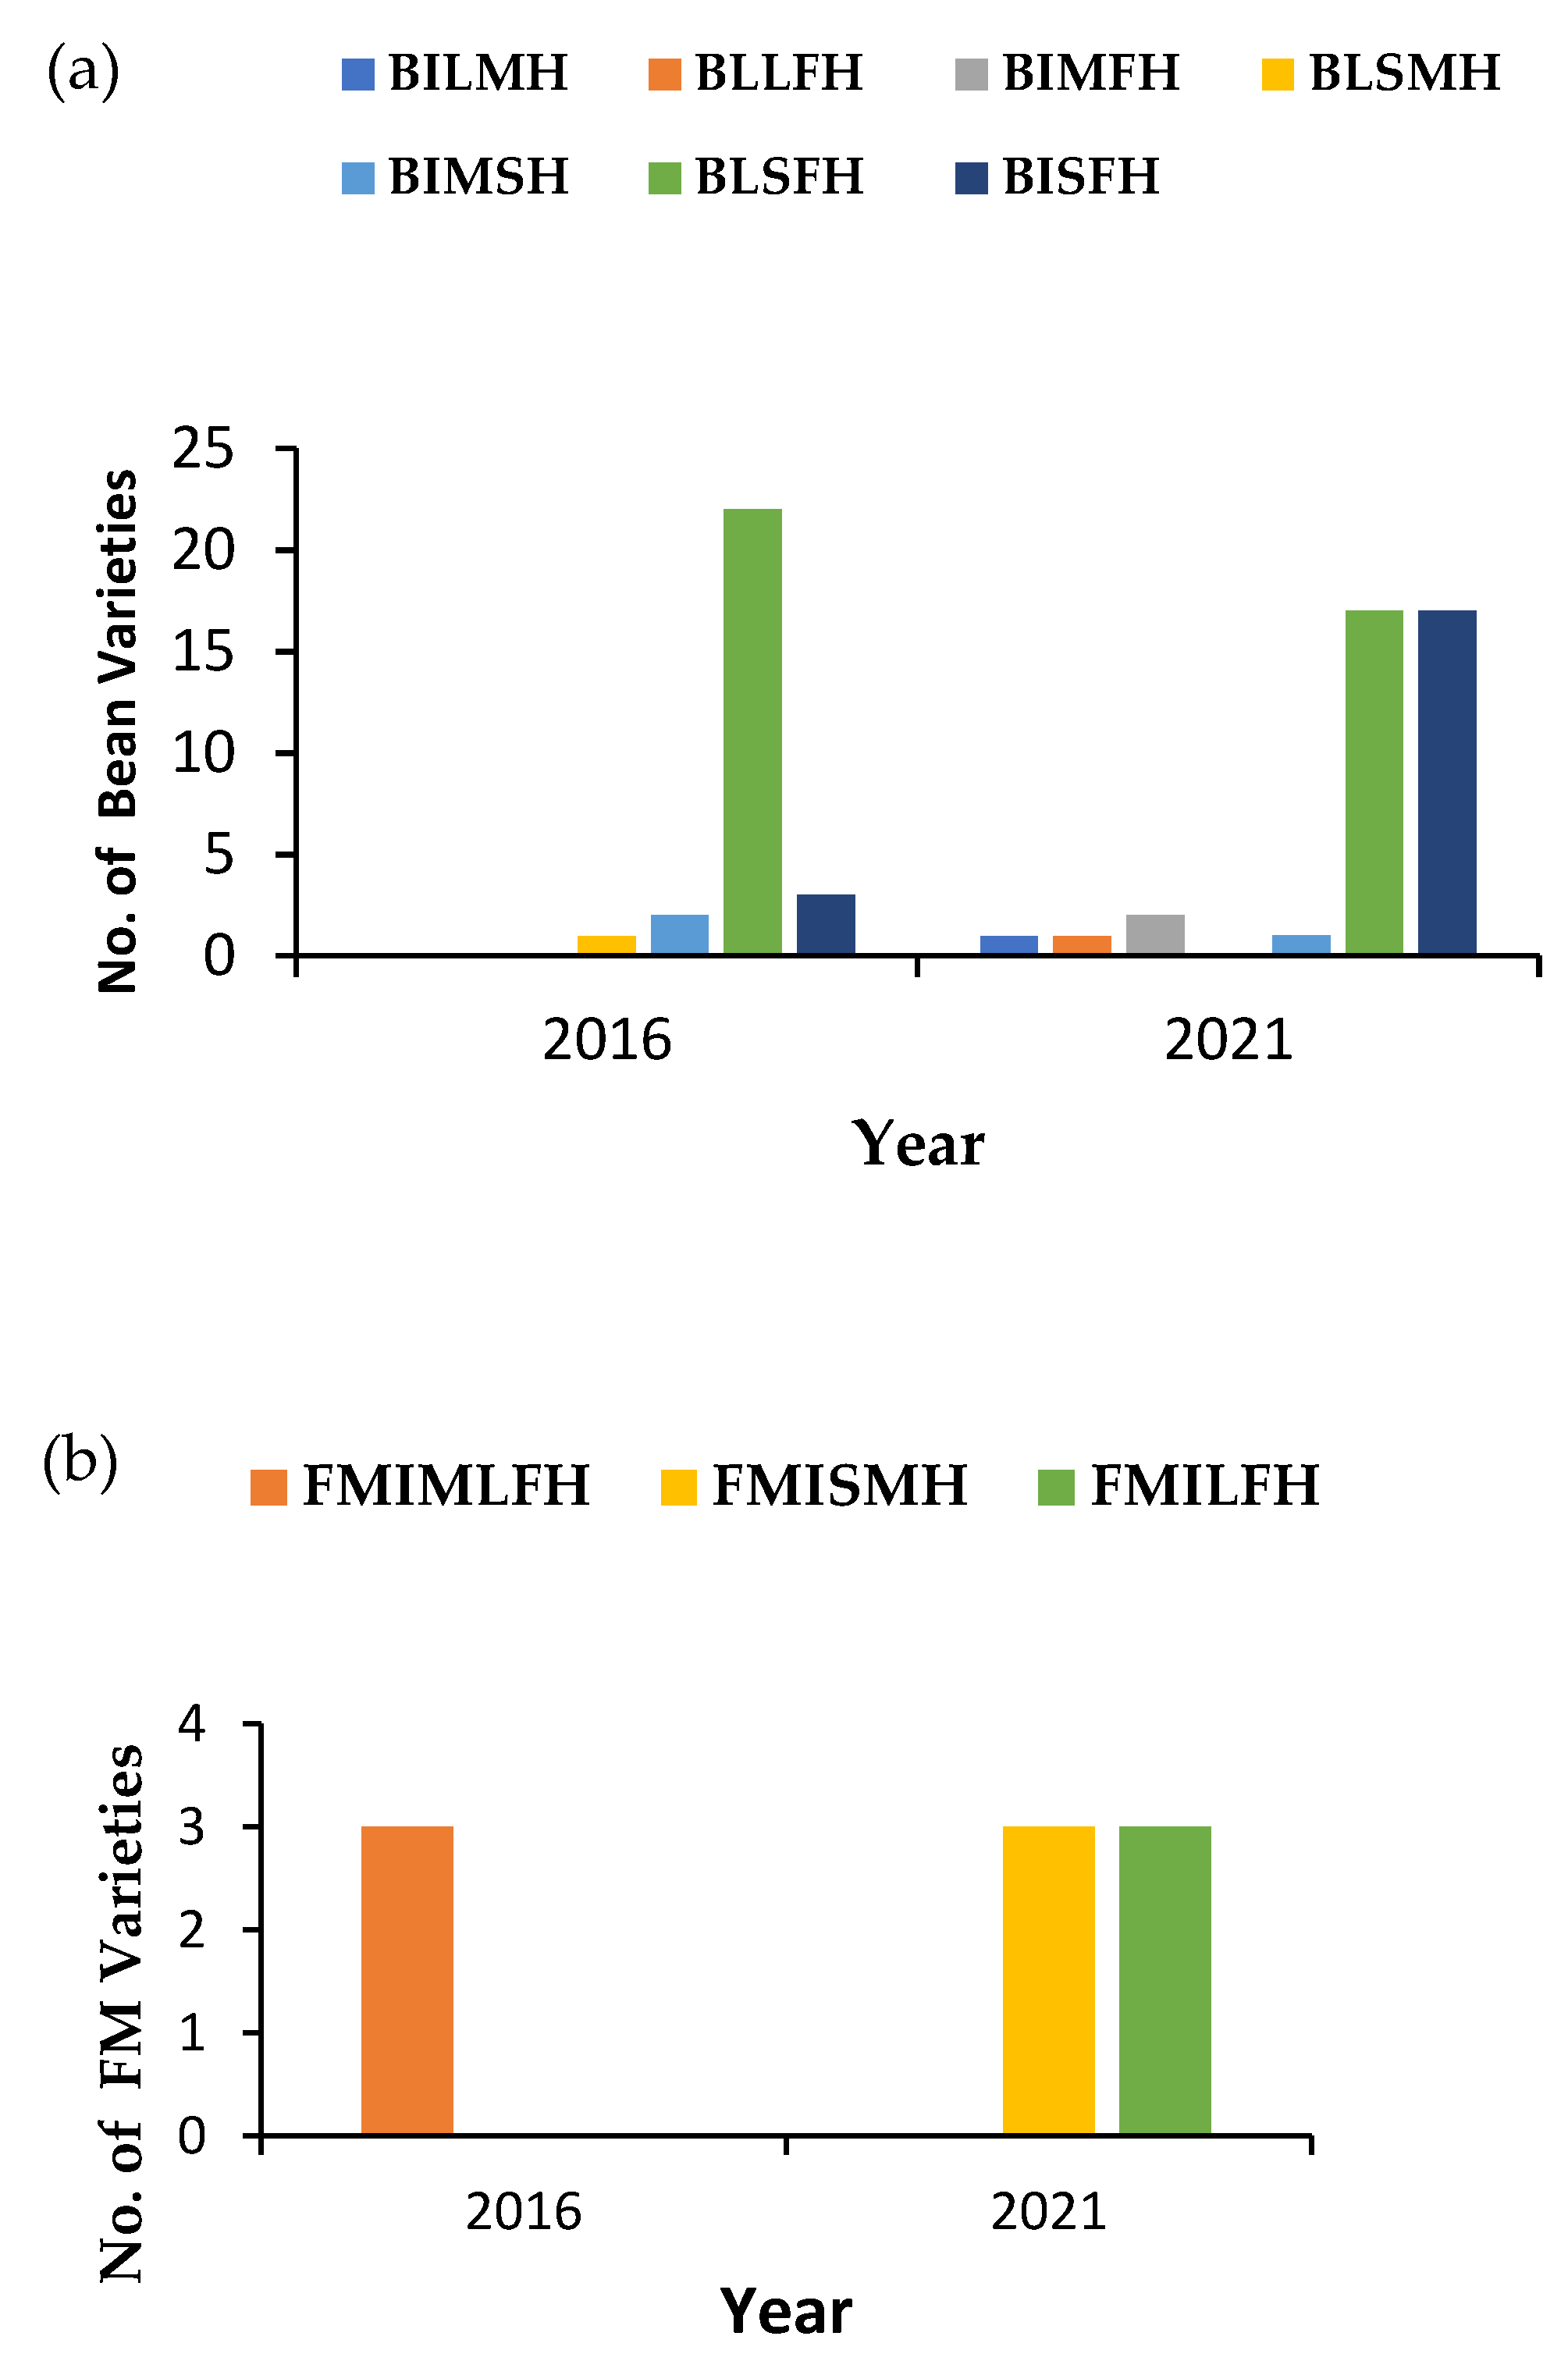
3.6. Summary of Results from the Four-Cell Analysis, Indicating Increased Use of Seed Crop Varieties

Figure 6 presents the variety adoption trends measured using four-cell analysis for bean and finger millet in 2016 and 2021 among treatment households with different sized land holdings in Hoima, Uganda. Between 2016 and 2021, we see that bean local varieties in few farming households with small areas of land (BLSFH)—that are by far the preferred varieties—and bean improved varieties planted in many farming households with small areas of land (BIMSH), decrease slightly in 2021, while BISFH (beans improved varieties in few households with small area of land) emerged between 2016 and 2021. Some varieties introduced into the households in 2016 were retained in their respective intervention areas and among households in 2021. For bean, we see two trends. The first trend—among the few farming households with small areas of land in Hoima (BLSFH)—represents a decrease in the number of bean varieties from 22 to 17, and the second trend represents a steep increase in the adoption of bean seed crop intervention varieties (BISFH) from 3 to 17 introduced from among the four-cell category of few farming households in Hoima with small areas of land. From our analysis, we observe a shift in varieties from many farming households with small areas of land to few farming households with large areas of land. Moreover, this shift also causes a loss of the local and improved varieties, which decreased from 1 to 0 for bean local varieties in many households with small area of land (BLSMH) and 2 to 1 for bean improved varieties in many households with large area of land (BILMH), respectively. For finger millet, there was a no change in adoption levels of improved varieties in few households with large area of land (FMIMLFH) and finger millet improved varieties in large areas few households (FMILFH). However, there was a notable adoption of improved finger millet introduced among many households with small area of land (FMISMH) during the intervention period.
The results presented in Figure 7 show adoption rates of improved finger millet improved varieties among few farming households with large area of land (FMILMH) in Nyando, Kenya in 2021. Moreover, the introduction of three finger millet varieties among many farming households with small area of land (FMLSMH) and finger millet in few farming households with large area (FMLFH). For sorghum varieties, we see the adoption of an introduced improved varieties among many farming households with small area (SIMSMH) in 2016. By 2021 three more sorghum intervention varieties had been introduced and retained among sorghum improved varieties in few farming households with large areas of land (SILFH) and four sorghum improved varieties among many farming households with small areas of land (SIMSMH).

4. Discussion

Seed is a key input for agricultural production systems. Seed provides two joint benefits to agricultural producers and society: it is a both consumable input and a source of genetic material. As a consumable input, it enters directly into the production stream [45] and therefore has a direct impact on food security and poverty-related outcomes. Seed system interventions that increase diversity in farming systems assist in building agricultural resilience to climate change and related challenges. One such seed system intervention is the establishment of community seed banks (CSBs), which serve multiple functions such as supporting seed conservation, crop improvement, seed exchange, seed production and marketing. CSBs are important instruments for sharing the benefits derived from the use of seed and are instrumental in safeguarding agricultural biodiversity [36,38]. In this study, we found that increasing the diversity of resilient crops in farming households results in an increase in the production of beans (+63.96 kg), sorghum (+253 kg) and millet (+495 kg) per acre. Similar to our study, sorghum and finger millet production increases are confirmed by a study carried out across sub-Saharan Africa [46], which underscores the importance of adopting crop genetic diversity for climate-change adaptation. We also found that storage of millet seed increased somewhat while that of maize significantly decreased, mainly due to increased production (and surplus) of millet between 2016 and 2019. In terms of sales, maize and sorghum seed sales increased, while bean and millet sales decreased, even though these impacts were also not statistically significant. The steep increases in the sale of maize and sorghum seeds are influenced by the fact that maize is a staple crop while sorghum is mainly used as a raw material for beer production [47,48]. Income only increased from sorghum sales while it declined for maize, beans and finger millet, though this is statistically insignificant (except for beans, which were statistically significant at 10%). Generally, the introduction of new seed diversity has been found to increase both crop productivity and household income among poor smallholder farming systems, with a significant increase of up to 47% and a significant reduction in poverty in sub-Saharan economies [49,50].
Our study results show a significant increase in households’ consumption of sorghum and a significant reduction in the consumption of millet. This can be further explained by the increase in sales of both sorghum and millet, which fetch a premium price at market, hence farmers prefer to sell them for income. Additionally, there was an increase in the cereal outputs being used for animal feed. In East and Southern Africa, North America, Asia and Africa’s Sahel, as a result of climate change, many households with animals are unable to grow proper livestock feed and are thus resorting to using high quantities of produce or harvested crops to feed farm animals [51,52]. Our study also confirms the use of these crops for animal feed to provide energy and nutrition to livestock reared by smallholder farmers.
Our study confirms gender disparity and gaps highlighted in previous studies on constraints to adoption and scaling up of various technologies among female smallholder farmers [39,53]. Male-headed households appear to have been more involved in scaling interventions towards improving diversity in seed systems. Older household heads with an average of 50.71 years were found to participate more in the S4N study than the non-S4N who had an average age of 47.5 years. The age of the household head was also found in previous studies to play a significant role in relation to smallholder farmers’ participation in agricultural and economic platforms [54,55]. Such biases against younger and less-experienced female household heads (who may also have lower education levels than their male counterparts) are a long-standing bottleneck in the scaling-up and dissemination of agricultural practices and technologies in many communities in East Africa.
The results of our study show that farmers who belong to producer groups or farmer organizations have better access to introduced seed diversity and related information than non-S4N farmers. Farmer groups play a critical role in providing access to different technologies, agricultural inputs and management practices, as well as improving household participation in agricultural activities within the communities. Our results confirm previous studies that have highlighted the reasons why smallholder farmers use the farmer group strategy to remain competitive and the significant level of farmers who participated in different agricultural projects [56,57,58]. The Food and Agriculture Organization of the United Nations (FAO) defines food security as existing when “all people, at all times, have physical and economic access to sufficient, safe and nutritious food to meet dietary needs and food preferences [59]. Overall, our study confirms higher household food security among study respondents compared to the control respondents (Figure 5). Similarly, previous studies [60,61,62,63,64] have found a positive link between improving seed system genetic diversity and food security [51,52,65].
The four-cell analysis we conducted indicates that the intra-specific diversity of beans, finger millet and sorghum has increased within the treatment farming systems. Most of the intervention’s varieties introduced by the project in 2016 are still found in 2021 in the cells with few farmers in small areas or many farmers in small areas, pointing to the possibility that they have unique characteristics that farmers appreciate or that they are still in the process of being disseminated within the farmers’ seed systems. This increase in diversity is critical to supporting climate-change adaptation and building resilient seed systems [66,67]. Moreover, seed multiplication and/or regeneration and dissemination are practices that have been proven by previous studies to improve production stability and resilience in farmers’ seed systems [36,68,69,70,71,72]. Adding more intra-specific diversity to farmers’ fields has been reported as a strategy employed by farmers to enhance agroecosystem functioning and avoid risks related to climate change and disease insurgence [73,74].

5. Conclusions

This study evaluated the combined performance and impact of increasing bean, finger millet and sorghum varietal diversity on households’ crop production, sales, income, consumption, seed storage and food security in Nyando, Kenya and Hoima, Uganda. Two descriptive variables found to be statistically significant were age and farmer group membership, both of which have an influence on farmer participation and decision making in the adoption of new varieties. We also found that household incomes in the project intervention sites significantly increased from the sale of beans and sorghum, added to increased consumption of finger millet. The quantity of seeds stored was also higher among participating farmers than among control group farmers. This shows that increasing seed diversity among farmers helps them to manage the risks related to climate change and increases farm productivity and incomes. Furthermore, increasing intra-specific genetic diversity among households has shown to increase household food security among participating households. Partnerships among seed improvement stakeholders need to be enhanced to ensure a continued supply of appropriate seeds to farmers to help them adapt to climate change and ensure their food security. One such seed system partnership tool is the establishment of community seed banks that support seed conservation, loan and exchange, crop improvement, seed production and marketing. They are important instruments for sharing the benefits derived from the use of seed and are instrumental in safeguarding agricultural biodiversity [38]. We conclude that increasing genetic diversity in farming systems is an important strategy for mitigating the risks related to climate change and associated losses of genetic diversity and is also important in supporting food security.

Author Contributions

Conceptualization, G.O. and T.R.; methodology, G.O. and R.J.O.O.; validation and formal analysis, R.J.O.O., G.O. and J.N.M.; investigation, R.J.O.O. and G.O.; resources G.O. and T.R.; data curation, C.F., J.N.M. and G.O. writing—original draft preparation, R.J.O.O. and G.O.; writing—review and editing C.F., G.O. and T.R.; visualization, G.O. and R.J.O.O.; supervision, T.R. and J.N.M.; project administration, G.O. and T.R. All authors have read and agreed to the published version of the manuscript.

Funding

This research was implemented as part of the CGIAR Research Program on Climate Change, Agriculture and Food Security (CCAFS), Funding Number P1589, which is carried out with support from the CGIAR Trust Fund and through bilateral funding agreements (https://ccafs.cgiar.org/donors, accessed on 22 March 2022). The views expressed in this document cannot be taken to reflect the official opinions of these organisations. This research was also undertaken as part of, and funded by the CGIAR Research Program on Grain Legumes and Dryland Cereals (GLDC) under funding number A1427 (http://gldc.cgiar.org/, accessed on 22 March 2022) and supported by CGIAR Fund Donors (www.cgiar.org/funders/, accessed on 22 March 2022). Lastly we recognize research funding from the FAO Benefit Sharing Fund Project, under the funding Number W2B-PR-26-Kenya.

Institutional Review Board Statement

Ethical review and approval were waived for this study, due to the fact that prior informed consent was obtained from the study subjects. The research team observed basic procedures for guaranteeing participant’s free participation and privacy. The consent statement was read aloud to each participant and interviews commenced only after the participants gave their consent.

Informed Consent Statement

Informed consent was obtained from all subjects involved in the study. Before the study was conducted, the statement was read and clarified to the interviewee for his/her consent, which only proceeded on their agreement to continue.

Data Availability Statement

Data can be found in the references cited in the manuscript.

Acknowledgments

The authors thank researchers from the National Agricultural Research Organization (NARO) Bulindi; NARO’s Plant Genetic Resources Center (PGRC) in Uganda; and the Kenya Agricultural Research Organization. We thank the OneCGIAR Nature-Positive Solutions for Shifting Agrifood Systems to More Resilient and Sustainable Pathways for funding the publication of the paper. Additionally, we thank Olga Spellman (Alliance of Bioversity and CIAT Science Writing Service) for her technical inputs to this paper.

Conflicts of Interest

The authors declare no conflict of interest.

Appendix A

Table A1. Summary of Mean ± SE between S4N and Non-S4N Households for Crop Production.
VariablesTotal Observation
N = 294
1 S4N
N = 207
2 Non-S4N
N = 87
t-Value
MeanSEMeanSEMeanSE1 vs. 2
Maize production 20191686.97787.532200.391186.41679.88111.10−0.91
Bean production 2019313.4456.25327.5079.51282.6043.83−0.37
Sorghum production 2019129.4621.72111.7220.50172.1755.111.27
Millet production 2019270.4190.51195.9291.27512.50227.651.55
Maize production 20162425.641589.023055.812195.83777.52112.53−0.64
Bean production 2016398.63100.82416.23138.39353.0954.39−0.28
Sorghum production 2016154.6623.37136.4027.63200.3242.881.24
Millet production 2016173.8726.55188.5036.69147.2734.59−0.74
Table A2. Mean ± SE between S4N and Non-S4N Households for Crop Sales and Income.
VariablesTotal Observations
N = 294
1 S4N
N = 207
2 Non-S4N
N = 87
t-Value
MeanSEMeanSEMeanSE1 vs. 2
Maize sales1898.92779.562378.021100.82752.50145.72−0.95
Bean sales3195.572883.88331.0893.809712.289443.391.51
Sorghum sales166.5129.55165.0435.31168.8153.370.06
Millet sales129.3918.02124.3524.90141.0017.410.42
Maize income21532.8209.843.6228.442.020.26
Bean income173.0424.49159.326.97204.351.90.846
Sorghum income89.0227.4101.3943.669.6918.7−0.5591
Millet income75.010.974.415.176.411.810.085
Table A3. Mean ± SE between S4N and Non-S4N Households for Food Security, Household Consumption, Livestock Feeding and Seed Storage.
VariablesTotal Observations
N = 294
1 S4N
N = 207
2 Non S4N
N = 87
t-Value
MeanSEMeanSEMeanSE1 vs. 2
Food security0.610.030.630.040.560.07−1.00
Maize for human consumption187.4120.05180.5826.77200.8127.960.48
Beans for human consumption83.4912.4485.3017.4979.5811.21−0.21
Sorghum for human consumption48.305.2845.805.7954.2011.420.73
Millet for human consumption40.105.3138.977.1042.866.150.33
Maize for livestock feeding808.77108.74660.89117.341043.65202.731.75 **
Beans for livestock feeding376.9453.56357.3565.95422.0094.200.55
Sorghum for livestock feeding352.3466.86336.1786.44383.33107.370.33
Millet for livestock feeding280.0033.35270.7143.38294.4454.930.34
Maize seed stored98.0017.7772.7614.13148.4844.012.06 *
Bean seed stored43.213.8342.133.7945.498.880.41
Sorghum seed stored13.762.8511.522.1119.298.431.24
Millet seed stored16.612.8818.113.8812.912.85−0.82
Note: * and ** denote 5% and 10% significance levels.
Table A4. Four-Cell Analysis of Adoption of Finger Millet Varieties in Hoima, Uganda.
2016 Four-Cell Analysis in Hoima for Finger Millet 2021 Four-Cell Analysis in Hoima for Finger Millet
Many Farming
Households
Few Farming
Households
Many Farming
Households
Few Farming
Households
Large AreaA.C.Large AreaA.C.
Local = 1Local = 0Local = 1Local = 0
improved = 0improved = 3improved = 0Improved = 0
Intervention-0Intervention-0Intervention-0Intervention-0
Small AreaB.D.Small AreaB.D.
Local = 3Local varieties = 1Local = 3Local = 1
Improved = 0Improved = 3Improved = 0Improved = 3
Intervention-0Intervention-0Intervention-3Intervention-3
Table A5. Four-Cell Analysis of Adoption of Finger Millet Varieties in Nyando, Kenya.
2016 Four-Cell Analysis in Nyando for Finger Millet 2021 Four-Cell Analysis in Nyando for Finger Millet
Many Farming
Households
Few Farming
Households
Many Farming
Households
Few Farming
Households
Large AreaA.C.Large AreaA.C.
Local varieties = 3Local varieties = 0Local varieties = 3Local varieties = 0
improved = 0improved =0Improved = 0Improved = 0
Intervention-0Intervention-0Intervention-4Intervention-0
Small AreaB.D.Small AreaB.D.
Local = 0Local = 2Local = 3Local = 2
Improved = 0Improve = 1Improve =0Improved =1
Intervention-0Intervention-0Intervention-0Intervention-4
Table A6. Four-Cell Analysis of Adoption of Sorghum Varieties in Nyando, Kenya.
2016 Four-Cell Analysis in Nyando for Sorghum Adoption 2021 Four-Cell Analysis in Nyando for Sorghum Adoption
Many Farming
Households
Few Farming
Households
Many Farming
Households
Few Farming
Households
Large AreaA.C.Large AreaA.C.
Local = 3Local = 0Local = 3Local = 0
improved = 0improved = 1improved = 0improved = 1
Intervention-0Intervention-0Intervention-0Intervention-3
Small AreaB.D.Small AreaB.D.
Local = 0Local = 11Local = 0Local = 11
improved = 1improved = 5improved = 0Improve = 5
Intervention-0Intervention-0Intervention-4Intervention-0
Table A7. Four-Cell Analysis of Adoption of Bean Varieties in Hoima, Uganda.
2016 Four-Cell Analysis in Hoima for Bean Adoption 2021 Four-Cell Analysis in Hoima for Bean Adoption
Many Farming
Households
Few Farming
Households
Many Farming
Households
Few Farming
Households
Large AreaA.C.Large AreaA.C.
Local = 3Local varieties = 0Local = 2Local varieties = 1
improved = 2Improved = 0improved = 2improved = 2
Intervention-0Intervention-0Intervention-1Intervention-0
Small AreaB.D.Small AreaB.D.
Local varieties = 1Local varieties = 22Local = 0Local = 17
improved = 2Improved = 7improved = 1Improved = 7
Intervention-0Intervention-3Intervention-0Intervention-17
new varieties introduced
Table A8. Variance Inflation Factors for Multicollinearity Tests.
VariableVIF1/VIF
Household size1.260.7965
Household sex1.250.8007
Land size1.170.8537
Farmer group1.130.8812
Distance to market1.130.8848
Land ownership1.130.8855
Plots_count1.090.9175
Household head age1.080.9250
Household education level1.060.9390
Employment income1.050.9544
Source of labour1.040.9626
Business income1.010.9864
Mean VIF1.12

References

  1. UNFPA. United Nations Population Fund. 2021. Available online: https://www.unfpa.org/data/world-population-dashboard (accessed on 24 March 2022).
  2. UNDPI. United Nations Department of Public Information 405 East 42. World Population Projected to Reach 9.8 Billion in 2050, and 11.2 Billion in 2100—Says UN. 2017, pp. 1–4. Available online: https://www.un.org/en/development/desa/population/events/pdf/other/21/21June_FINAL%20PRESS%20RELEASE_WPP17.pdf (accessed on 22 May 2022).
  3. Mbow, Y.X.; Rosenzweig, C.C.; Barioni, L.G.; Benton, T.G.; Herrero, M.; Krishnapillai, M.; Liwenga, E.; Pradhan, P.; Rivera-Ferre, M.G.; Sapkota, T.; et al. Food Security. In Climate Change and Land: An IPCC Special Report on Climate Change, Desertification, Land Degradation, Sustainable Land Management, Food Security, and Greenhouse Gas Fluxes in Terrestrial Ecosystem; IPCC: Geneva, Switzerland, 2019; pp. 437–550. Available online: https://www.ipcc.ch/site/assets/uploads/2019/11/08_Chapter-5.pdf (accessed on 22 May 2022).
  4. Otieno, G.; Westphal, I. Building Resilience through “Open Source Seed Systems” for Climate Change Adaptation in Kenya, Uganda, and Tanzania: What Are the Options for Policy? CGIAR: Montpellier, France, 2018; pp. 1–8. Available online: https://hdl.handle.net/10568/100157 (accessed on 22 May 2022).
  5. Global Panel on Agriculture and Food Systems for Nutrition. Food Systems and Diets: Facing the Challenges of the 21st Century; Global Panel on Agriculture and Food Systems for Nutrition: London, UK, 2016; pp. 1–133. Available online: https://glopan.org/sites/default/files/ForesightReport.pdf (accessed on 14 January 2022).
  6. FAO; IFAD; UNICEF; WFP. The State of Food Security and Nutrition in the World 2021. Transforming Food Systems for Food Security, Improved Nutrition and Affordable Healthy Diets for All; FAO: Rome, Italy, 2021; pp. 1–240. Available online: https://www.fao.org/3/cb4474en/cb4474en.pdf (accessed on 12 March 2022).
  7. Fraval, S.; Hammond, J.; Bogard, J.R.; Kanui, M.N. Food Access Deficiencies in Sub-saharan Africa: Prevalence and Implications for Agricultural Interventions. Front. Sustain. Food Syst. 2019, 3, 104. [Google Scholar] [CrossRef] [Green Version]
  8. FAO. COVID-19 and malnutrition: Situation analysis and options in Africa. COVID-19 Malnutrition Situat. Anal. Options Africa 2020, 2, 1–6. [Google Scholar] [CrossRef]
  9. Adhikari, U.; Nejadhashemi, A.P.; Woznicki, S. Climate change and eastern Africa: A review of impact on major crops. Food Energy Secur. 2015, 4, 110–132. [Google Scholar] [CrossRef]
  10. Mastenbroek, A. Research Report on Climate Resilient Local Seed Businesses: Integrated Seed Sector Development Programme in Uganda; Centre for Development Innovation: Wageningen, The Netherlands, 2015; pp. 1–84. Available online: https://edepot.wur.nl/407778 (accessed on 15 March 2022).
  11. Kimenye, L. (Ed.) Best-Bet Technologies for Addressing Climate Change and Variability in Eastern and Central Africa; ASARECA (Association for Strengthening Agricultural Research in Eastern and Central Africa): Entebbe, Uganda, 2014; pp. 1–234. Available online: https://www.asareca.org/sites/default/files/publications/ASARECA%20Best%20Bet%20Technologies%204%20Climate%20change%20and%20variability.pdf (accessed on 22 May 2022).
  12. WFP. East Africa Regional Food Security & Nutrition Update. WFP Report. 2019. Available online: https://reliefweb.int/report/ethiopia/east-africa-regional-food-security-nutrition-update-november-2019 (accessed on 22 May 2022).
  13. Engels, J.; Diulgheroff, S.; Alvarez, S.J. Management of Crop Diversity; FAO: Rome, Italy, 2014; pp. 1–48. Available online: https://www.fao.org/3/i3767e/i3767e.pdf (accessed on 22 May 2022).
  14. Atlin, G.N.; Cairns, J.E.; Das, B. Rapid breeding and varietal replacement are critical to adaptation of cropping systems in the developing world to climate change. Glob. Food Secur. 2017, 12, 31–37. [Google Scholar] [CrossRef]
  15. Lipper, L.; Thornton, P.; Campbell, B.M.; Baedeker, T.; Braimoh, A.; Bwalya, M.; Caron, P.; Cattaneo, A.; Garrity, D.; Henry, K.; et al. Climate-smart agriculture for food security. Nat. Clim. Change 2014, 4, 1068–1072. [Google Scholar] [CrossRef]
  16. Zhang, W.; Cao, G.; Li, X.; Zhang, H.; Wang, C.; Liu, Q.; Chen, X. Closing yield gaps in China by empowering smallholder farmers. Nature 2016, 537, 671–674. [Google Scholar] [CrossRef]
  17. Seed Availability and Access. Available online: https://ciat.cgiar.org/what-we-do/seed-availability-and-access/ (accessed on 24 March 2022).
  18. Quarshie, P.T.; Abdulai, A.-R.; Fraser, E.D.G. Africa′s “Seed” Revolution and Value Chain Constraints to Early Generation Seeds Commercialization and Adoption in Ghana. Front. Sustain. Food Syst. 2021, 5, 665297. [Google Scholar] [CrossRef]
  19. FAO. The Future of Food and Agriculture: Trends and Challenges; FAO: Rome, Italy, 2017; p. 4. Available online: https://www.fao.org/3/i6583e/i6583e.pdf (accessed on 22 May 2022).
  20. Macauley, H. Cereal Crops: Rice, Maize, Millet, Sorghum, Wheat. Chem. Eng. News 2015, 86, 74. [Google Scholar] [CrossRef]
  21. Seeds for Needs’ Is a Bioversity International Participatory Research–Farmer/Citizen Scientist Initiative. Available online: https://www.bioversityinternational.org/seeds-for-needs/ (accessed on 24 March 2022).
  22. Louwaars, N.P. Policies and strategies for seed system development. In Proceedings of the Conclusions of the International Workshop on Integrated Seed Systems for Low-Input Agriculture, RILET, Malang, Indonesia, 24–27 October 1995; pp. 5–15. Available online: https://repository.unescap.org/bitstream/handle/20.500.12870/4059/ESCAP-1996-RP-CGPRT-Monograph-No32.pdf?sequence=1#page=24 (accessed on 14 May 2022).
  23. Jones, S.K. Quality Declared Seed System: FAO Plant Production and Protection Paper 185; Anonymous. Rome: Food and Agriculture Organization of the United Nations (2006), pp. 243, $40.00. ISBN 92-5-105510-6. Exp. Agric. 2007, 43, 261. [Google Scholar] [CrossRef]
  24. Otieno, G. Accessing genetic diversity for food security and climate change adaptation in select communities in Africa. In Food Security and Climate Change; Yadav, S.S., Ed.; John Wiley: Hoboken, NJ, USA, 2019; pp. 499–522. ISBN 9781119180647. [Google Scholar] [CrossRef]
  25. Kidane, Y.G.; Gesesse, C.A.; Hailemariam, B.N.; Desta, E.A.; Mengistu, D.K.; Fadda, C.; Pè, M.E.; Dell’Acqua, M. A large nested association mapping population for breeding and quantitative trait locus mapping in Ethiopian durum wheat. Plant Biotechnol. J. 2019, 17, 1380–1393. [Google Scholar] [CrossRef] [PubMed]
  26. IPCC. Climate Change 2014: Synthesis Report. Contribution of Working Groups I, II and III to the Fifth Assessment Report of the Intergovernmental Panel on Climate Change; Core Writing Team, Pachauri, R.K., Meyer, L.A., Eds.; IPCC: Geneva, Switzerland, 2014; p. 151. Available online: https://www.ipcc.ch/report/ar5/syr/ (accessed on 22 May 2022).
  27. Rao, V.R.; Hodgkin, T. Genetic diversity and conservation and utilization of plant genetic resources. Plant Cell Tissue Organ Cult. (PCTOC) 2002, 68, 1–19. [Google Scholar] [CrossRef]
  28. Li, X.; Siddique, K.H.M. Future Smart Food. Rediscovering Hidden Treasures of Neglected and Underutilized Species for Zero Hunger in Asia; FAO: Bangkok, Thailand, 2018; pp. 1–40. Available online: https://www.fao.org/3/I8907EN/i8907en.pdf (accessed on 22 May 2022).
  29. Otieno, G.; Zebrowski, W.; Recha, J.; Reynolds, T. Gender and Social Seed Networks for Climate Change Adaptation: Evidence from Bean, Finger Millet, and Sorghum Seed Systems in East Africa. Sustainability 2021, 13, 2074. [Google Scholar] [CrossRef]
  30. Govindaraj, M.; Vetriventhan, M.; Srinivasan, M. Importance of Genetic Diversity Assessment in Crop Plants and Its Recent Advances: An Overview of Its Analytical Perspectives. Genet. Res. Int. 2015, 2015, 1–14. [Google Scholar] [CrossRef] [PubMed] [Green Version]
  31. Sperling, L.; Mcguire, S. Understanding and Strengthening Informal Seed Markets. Exp. Agric. 2010, 46, 119–136. [Google Scholar] [CrossRef] [Green Version]
  32. Otieno, G.; Lacasse, H.; Fadda, C.; Reynolds, T.W.; Recha, J.W. Social Seed Networks for Climate Change Adaptation in Western Kenya Results from a Study to Better Understand Farmers’ Primary Sources of Seed Information in the Nyando Climate-Smart Villages; CCAFS Info note; CGIAR Research Program on Climate Change, Agriculture and Food Security (CCAFS): Wageningen, The Netherlands, 2018; pp. 1–4. Available online: https://hdl.handle.net/10568/93210 (accessed on 22 May 2022).
  33. FAO. Coping with Climate Change—The Roles of Genetic Resources for Food and Agriculture; FAO: Rome, Italy, 2015; pp. 1–130. Available online: https://reliefweb.int/sites/reliefweb.int/files/resources/a-i3866e.pdf (accessed on 22 May 2022).
  34. FAO; IFAD; UNICEF. The State of Food Security and Nutrition in the World 2018. Building Climate Resilience for Food Security and Nutrition; FAO: Rome, Italy, 2018; pp. 1–202. Available online: https://docs.wfp.org/api/documents/WFP-0000074343/download/?_ga=2.249465860.2088145878.1647943563-1543092150.1647943563 (accessed on 22 May 2022).
  35. Jarvis, D.I.; Fadda, C.; De Santis, P.; Thompson, J. Damage, Diversity and Genetic Vulnerability: The Role of Crop Genetic Diversity in the Agricultural Production System to Reduce Pest and Disease Damage. In Proceedings of the International Symposium, Rabat, Morocco, 15–17 February 2011; Jarvis, D.I., Fadda, C., De Santis, P., Thompson, J., Eds.; Bioversity International: Rome, Italy, 2011. [Google Scholar]
  36. McGuire, S.; Sperling, L. Making seed systems more resilient to stress. Glob. Environ. Change 2013, 23, 644–653. [Google Scholar] [CrossRef]
  37. Vernooy, R.; Sthapit, B.; Otieno, G.; Shrestha, P.; Gupta, A. The roles of community seed banks in climate change adaption. Dev. Pr. 2017, 27, 316–327. [Google Scholar] [CrossRef] [Green Version]
  38. Vernooy, R.; Jai, R.; Ahlawat, S.P.; Malik, S.K.; Mbozie, H.; Mugisha, J.; Nyabasha, S.; Otieno, G.; Patil, S.; Roy, S.; et al. Community Seed Banks as Seed Producers: Cases from India, Nepal, Uganda and Zimbabwe; Working Paper Series No. 2; CGIAR Research Program on Grain Legumes and Dryland Cereals: Hyderabad, India, 2020; p. 55. ISBN 978-93-86527-05-9. Available online: https://hdl.handle.net/10568/111420 (accessed on 22 May 2022).
  39. Van Eerdewijk, A.; Danielsen, K. Gender Matters in Farm Power. 2015, pp. 1–73. Available online: https://www.kit.nl/wp-content/uploads/2018/08/551bcea41f1f2_Gender-Matters-in-Farm-Power-final-150227-AE-KD.pdf (accessed on 22 May 2022).
  40. Mendola, M. Agricultural technology adoption and poverty reduction: A propensity-score matching analysis for rural Bangladesh. Food Policy 2006, 32, 372–393. [Google Scholar] [CrossRef]
  41. Becker, S.O.; Caliendo, M. Sensitivity Analysis for Average Treatment Effects. Stata J. Promot. Commun. Stat. Stata 2007, 7, 71–83. [Google Scholar] [CrossRef] [Green Version]
  42. Becker, S.O.; Ichino, A. Estimation of Average Treatment Effects Based on Propensity Scores. Stata J. Promot. Commun. Stat. Stata 2002, 2, 358–377. [Google Scholar] [CrossRef] [Green Version]
  43. Caliendo, M.; Kopeinig, S. Some Practical Guidance for the Implementation of Propensity Score Matching. J. Econ. Surv. 2008, 22, 31–72. [Google Scholar] [CrossRef] [Green Version]
  44. Maddala, G.S. Introduction to Econometrics, 2nd ed. 2000. Available online: https://jigjids.files.wordpress.com/2011/05/introduction-to-econometric-2nd.pdf (accessed on 24 March 2022).
  45. Jarvis, D.I.; Sevilla-Panizo, R.; Chavez-Servia, J.-L.; Hodgkin, T. (Eds.) Seed Systems and Crop Genetic Diversity On-Farm. In Proceedings of the a Workshop, Pucallpa, Peru, 16–20 September 2003; International Plant Genetic Resources Institute: Rome, Italy, 2004. [Google Scholar]
  46. Symposium on “Food Technology for Better Nutrition”. Compr. Rev. Food Sci. Food Saf. 2008, 7, 320–396. [CrossRef] [Green Version]
  47. Dabija, A.; Ciocan, M.; Chetrariu, A.; Codină, G. Maize and Sorghum as Raw Materials for Brewing, A Review. Appl. Sci. 2021, 11, 3139. [Google Scholar] [CrossRef]
  48. Orr, A.; Mwema, C.; Mulinge, W. The Value Chain for Sorghum Beer in Kenya; Socioeconomics Discussion Paper Series 16; ICRISAT: Nairobi, Kenya, 2014; Available online: https://www.researchgate.net/publication/285512393_A_Orr_C_Mwema_W_Mulinge_The_value_chain_for_sorghum_beer_in_Kenya_Socioeconomics_Discussion_Paper_Series_Number_16_International_Crops_Research_Institute_for_the_Semi-Arid_Tropics (accessed on 22 May 2022).
  49. Walker, T.S.; Alwang, J. Crop Improvement, Adoption, and Impact of Improved Varieties in Food Crops in Sub-Saharan Africa. CABI, 2015. Available online: https://scholar.google.com/scholar?hl=en&as_sdt=0%2C5&q=T.+S.+Walker+and+J.+Alwang%2C+Crop+improvement%2C+adoption%2C+and+impact+of+improved+varieties+in+food+crops+in+sub-Saharan+Africa&btnG= (accessed on 22 May 2022).
  50. Cacho, O.J.; Moss, J.; Thornton, P.K.; Herrero, M.; Henderson, B.; Bodirsky, B.L.; Humpenöder, F.; Popp, A.; Lipper, L. The value of climate-resilient seeds for smallholder adaptation in sub-Saharan Africa. Clim. Change 2020, 162, 1–17. [Google Scholar] [CrossRef]
  51. Nasidi, M.; Agu, R.; Walker, G.; Deeni, Y. Sweet sorghum: Agronomic practice for food, animal feed and fuel production in Sub-Saharan Africa. In Sweet Sorghum: Characteristics, Cultivation and Uses; Agriculture Issues and Policies; Rogers, L., Willis, M., Eds.; Nova Science Publishers, Inc.: Hauppauge, NY, USA, 2019; pp. 1–67. Available online: https://novapublishers.com/shop/sweet-sorghum-characteristics-cultivation-and-uses/ (accessed on 22 May 2022).
  52. Orr, A.; Mwema, C.; Gierend, A.; Nedumaran, S. Sorghum and Millets in Eastern and Southern Africa: Facts, Trends and Outlook; Working Paper. no. 62; ICRISAT: Patancheru, India, 2016; Available online: http://oar.icrisat.org/9441/1/2016-062%20WPS%2062%20S%26M%20ESA.pdf (accessed on 22 May 2022).
  53. FAO. Youth and Agriculture; FAO: Rome, Italy, 2014. [Google Scholar]
  54. Martey, E.; Etwire, P.M.; Wiredu, A.N.; Dogbe, W. Factors influencing willingness to participate in multi-stakeholder platform by smallholder farmers in Northern Ghana: Implication for research and development. Agric. Food Econ. 2014, 2, 11. [Google Scholar] [CrossRef] [Green Version]
  55. Hlatshwayo, S.; Ngidi, M.; Ojo, T.; Modi, A.; Mabhaudhi, T.; Slotow, R. A Typology of the Level of Market Participation among Smallholder Farmers in South Africa: Limpopo and Mpumalanga Provinces. Sustainability 2021, 13, 7699. [Google Scholar] [CrossRef]
  56. Fischer, E.; Qaim, M. Smallholder Farmers and Collective Action: What Determines the Intensity of Participation? J. Agric. Econ. 2014, 65, 683–702. [Google Scholar] [CrossRef]
  57. Wang, X.; Sarkar, A.; Wang, H.; Zhang, F. Does Participation in Agricultural Value Chain Activities Influence Smallholder Fruit Grower Production Performance? A Cross-Sectional Study of Apple Farmers in Shandong, China. Horticulturae 2021, 7, 153. [Google Scholar] [CrossRef]
  58. Snel, H. Income Intervention Quick Scan: Productivity Enhancement; Report WCDI-18-036; WCDI: Wageningen, The Netherlands, 2018; pp. 1–24. Available online: https://edepot.wur.nl/460687 (accessed on 22 March 2022).
  59. Food and Agriculture Organization of the United Nations (FAO). An Introduction to the Basic Concepts of Food Security. EC—FAO Food Security Programme. 2008, pp. 1–3. Available online: https://www.fao.org/3/al936e/al936e.pdf (accessed on 22 May 2022).
  60. Mujeeb-Kazi, A.; Dundas, I.; Rasheed, A.; Ogbonnaya, F.; Kishii, M.; Bonnett, D.; Wang, R.R.-C.; Xu, S.; Chen, P.; Mahmood, T.; et al. Genetic Diversity for Wheat Improvement as a Conduit to Food Security. Adv. Agron. 2013, 122, 179–257. [Google Scholar] [CrossRef]
  61. Muñoz-Amatriaín, M.; Mirebrahim, H.; Xu, P.; Wanamaker, S.I.; Luo, M.; AlHakami, H.; Alpert, M.; Atokple, I.; Batieno, B.J.; Boukar, O.; et al. Genome resources for climate-resilient cowpea, an essential crop for food security. Plant J. 2017, 89, 1042–1054. [Google Scholar] [CrossRef] [Green Version]
  62. Kallow, S.; Mertens, A.; Janssens, S.B.; Vandelook, F.; Dickie, J.; Swennen, R.; Panis, B. Banana seed genetic resources for food security: Status, constraints, and future priorities. Food Energy Secur. 2021, 11, e345. [Google Scholar] [CrossRef]
  63. Khadka, R.; Gartaula, K.; Shrestha, H.; Upadhay, A.; Chaudhary, D.; Patel, P.; Devkota, K. Farmers’ Seed Networks and Agrobiodiversity Conservation for Sustainable Food Security: A Case from the Mid-Hills of Nepal. 2018, pp. 1–32. Available online: https://idl-bnc-idrc.dspacedirect.org/bitstream/handle/10625/57417/IDL-57417.pdf?sequence=2&isAllowed=y (accessed on 22 May 2022).
  64. Ma, X.; Mau, M.; Sharbel, T.F. Genome Editing for Global Food Security. Trends Biotechnol. 2018, 36, 123–127. [Google Scholar] [CrossRef]
  65. Mundia, C.W.; Secchi, S.; Akamani, K.; Wang, G. A Regional Comparison of Factors Affecting Global Sorghum Production: The Case of North America, Asia and Africa’s Sahel. Sustainability 2019, 11, 2135. [Google Scholar] [CrossRef] [Green Version]
  66. Mijatović, D.; Van Oudenhoven, F.; Eyzaguirre, P.; Hodgkin, T. The role of agricultural biodiversity in strengthening resilience to climate change: Towards an analytical framework. Int. J. Agric. Sustain. 2012, 11, 95–107. [Google Scholar] [CrossRef]
  67. López-Noriega, I.; Galluzzi, G.; Halewood, M.; Vernooy, R.; Bertacchini, E.; Gauchan, D.; Welch, E. Flows under Stress: Availability of Plant Genetic Resources in Times of Climate and Policy Change; Working Paper 18; CCAFS: Copenhagen, Denmark, 2012; Available online: https://hdl.handle.net/10568/21225 (accessed on 22 May 2022).
  68. McGuire, S.; Sperling, L. Seed systems smallholder farmers use. Food Secur. 2016, 8, 179–195. [Google Scholar] [CrossRef] [Green Version]
  69. Sperling, L.; Boettiger, S.; Barker, I. Integrating Seed Systems; AgpatnersXechange: Goodhue, MN, USA, 2013; pp. 1–32. Available online: https://seedsystem.org/wp-content/uploads/2014/03/Integrating-Seed-Systems-.pdf (accessed on 22 May 2022).
  70. Westengen, O.T.; Brysting, A.K. Crop adaptation to climate change in the semi-arid zone in Tanzania: The role of genetic resources and seed systems. Agric. Food Secur. 2014, 3, 3. [Google Scholar] [CrossRef] [Green Version]
  71. Westengen, O.T.; Berg, T. Crop Adaptation to Climate Change in SSA: The Role of Genetic Resources and Seed Systems. In Climate Change and Multi-Dimensional Sustainability in African Agriculture; Springer: Cham, Switzerland, 2016; pp. 327–343. [Google Scholar] [CrossRef]
  72. Fenzi, M.; Rogé, P.; Cruz-Estrada, A.; Tuxill, J.; Jarvis, D. Community seed network in an era of climate change: Dynamics of maize diversity in Yucatán, Mexico. Agric. Hum. Values 2021, 39, 339–356. [Google Scholar] [CrossRef]
  73. Jackson, L.; Pascual, U.; Hodgkin, T. Utilizing and conserving agrobiodiversity in agricultural landscapes. Agric. Ecosyst. Environ. 2007, 121, 196–210. [Google Scholar] [CrossRef]
  74. Di Falco, S.; Perrings, C. Crop biodiversity, risk management and the implications of agricultural assistance. Ecol. Econ. 2005, 55, 459–466. [Google Scholar] [CrossRef] [Green Version]
Figure 1. (a) Percentage distribution of benefits received by being a member of a farmers’ group in Nyando. (b) Percentage distribution of benefits received by being a member of a farmers’ group in Hoima.
Sustainability 14 06519 g001aSustainability 14 06519 g001b
Figure 2. (a) Comparison of major crop yields. (b) Trends in crop seed production between S4N and non-S4N participants.
Sustainability 14 06519 g002aSustainability 14 06519 g002b
Figure 3. Mean ± SE between S4N and non-S4N households on income from seed sales.
Sustainability 14 06519 g003
Figure 4. Mean ± SE between S4N and non-S4N households for household consumption, livestock feeding and seed storage.
Sustainability 14 06519 g004
Figure 5. Mean ± SE between S4N and non-S4N households for food security.
Sustainability 14 06519 g005
Figure 6. (a) Four-cell analysis results, indicating an increased number of bean and (b) finger millet (FM) varieties adopted by treatment households in Hoima, Uganda.
Sustainability 14 06519 g006
Figure 7. (a) shows increased number of finger millet and (b) sorghum varieties adopted among treatment households in Nyando, Kenya.
Sustainability 14 06519 g007
Table 1. Definition and measurement of variables of key household characteristics (covariates) used to determine the propensity scores of the intervention.
VariableType and DefinitionMeasurement
Dependent Variable
TreatmentDummy variable representing participation in the Seeds forNeeds (S4N) project1 if in S4N, 0 if not in S4N
Covariates
Sex of household headDummy, sex of household head1 if male, 0 if female
Age of household headContinuous, age of household headYears completed
Education of household headDummy, Level of education of household head1 basic education, 0 for no education
Household sizeDiscrete, household sizeNumber of household members
Land sizeContinuous, size of land holdingThe size of land owned by household in hectares
Land ownershipDummy, whether owned or shared1 for owned, 0 for shared
PlotsDiscrete, number of plotsNumber of plots
LabourDummy, source of labour—either unpaid family or hired1 for unpaid family labour, 0 for hired labour
Employment incomeDummy, whether the household receives additional income from employment (both farm and non-farm)1 for employment income, 0 for no employment income
Business incomeDummy, whether the household receives additional income from business1 for business income, 0 for no business income
DistanceDiscrete, distance to the nearest marketDistance to the nearest market in kilometers
Farmers’ groupDummy, whether the household head is a member of a farmers’ group1 for membership in a farmer’s group, 0 for no membership
Livestock (e.g., cattle, goat, sheep & poultry)Discrete, number of livestockNumber of livestock
Outcome indicator
Crop productionContinuous, total amount of output for each crop—beans, maize, millet and sorghumNumber of bags (for maize) and kilograms for beans, millet and sorghum harvested
Crop salesContinuous, total amount of output sold for each crop—beans, maize, millet and sorghumNumber of bags of maize and kilograms of beans, millet and sorghum harvested sold
Crop incomeContinuous, amount of income earned in USDAmount of income earned in USD (exchange rates used are 100Kshs/USD for Kenya and 3600Ugx/USD for \Uganda
Human consumptionContinuous, amount of output that is consumed in bags/kilogramsAmount of output that is consumed in bags/kilograms
Livestock feedingContinuous, amount of output that is used for livestock feeding in bags/kilogramsAmount of output that is used for livestock feeding in bags/kilograms
Seeds storedContinuous, amount of output that is stored as seeds in kilogramsContinuous, amount of output that is stored as seeds in kilograms
Food securityDummy, whether household has ever gone without food1 for never slept hungry, 0 for has slept hungry more than once
Table 2. Four-cell analysis of the study site characteristics.
Many Households in large areas
Common varieties for household food security and for market
Many households in small areas
Rare varieties grown for their special traits or characteristics or newly introduced varieties with specific adaptable traits (unique)
Few households in large areas
Varieties cultivated for home use or related to cultural or religious traditions and rituals (unique or under threat)
Few households in small areas
Varieties with low use value or specific use values to particular families (rare and under threat)
Table 3. Mean ± standard error (SE) between S4N and non-S4N households for household characteristics.
VariablesTotal Observation
N = 294
(1) S4N
N = 207
(2) Non S4N
N = 87
t-Value
MeanSEMeanSEMeanSE1 vs. 2
Sex of HH0.7540.0230.7670.0280.7270.043−0.797
Age of the HH49.7220.76450.7050.94947.5601.254−1.915 **
Education of the HH0.6780.0260.6520.0330.7470.0451.595
Household size5.4550.1325.4540.1705.4560.2010.008
Land size5.0660.4975.0300.5755.1430.9600.107
Land ownership0.9130.0150.9110.0190.9180.0260.231
Number of plots1.7500.1041.7690.1161.7110.214−0.262
Employment income0.1450.0190.1430.0230.1490.0340.156
Business income0.0140.0060.0080.0060.0260.0151.329
Source of labour0.9830.0070.9870.0070.9740.015−0.923
Farmers’ groups0.7330.0240.8740.0220.4390.047−9.705 *
Distance to market48.8972.01747.6842.50351.4913.3800.879
Note: * and ** denote 1% and 10% significance levels.
Table 4. Estimated impact of the S4N Project.
Project Variables EvaluatedImpactz-Valuep-Value
Maize production 20191448.521.520.13
Beans production 201963.960.810.42
Sorghum production 20192.820.100.92
Millet production 20195.520.090.93
Maize sales1227.981.470.14
Bean sales−30,820.90−1.400.16
Sorghum sales17.480.440.66
Millet sales−1.52−0.030.97
Maize income−35.04−0.470.637
Bean income−104.2 **−1.640.10
Sorghum income47.931.060.29
Millet income−3.04−0.110.916
Food security−0.005−0.080.94
Maize for human consumption−32.98−0.850.40
Bean for human consumption17.080.950.34
Sorghum for human consumption8.09 *4.930.00
Millet for human consumption−7.50 *−2.670.01
Maize for livestock feeding−329.11−1.040.30
Bean for livestock feeding−73.46 *−4.370.00
Sorghum for livestock feeding19.180.200.84
Maize seed stored−84.20 *−5.540.00
Bean seed stored7.050.870.38
Sorghum seed stored−6.84−1.510.13
Millet seed stored10.44 *3.130.00
Note: * and ** denotes 1% and 10% significance levels, respectively.
Publisher’s Note: MDPI stays neutral with regard to jurisdictional claims in published maps and institutional affiliations.

