Article

Bench-Scale Fixed-Bed Column Study for the Removal of Dye-Contaminated Effluent Using Sewage-Sludge-Based Biochar

by
Najib Mohammed Yahya Al-Mahbashi
1,*,
Shamsul Rahman Mohamed Kutty
1,
Muhammad Roil Bilad
2,
Nurul Huda
3,*,
Rovina Kobun
3,
Azmatullah Noor
1,
Ahmad Hussaini Jagaba
1,
Ahmed Al-Nini
1,
Aiban Abdulhakim Saeed Ghaleb
1 and
Baker Nasser Saleh Al-dhawi
1
1
Department of Civil and Environmental Engineering, Universiti Teknologi PETRONAS, Seri Iskandar 32610, Perak, Malaysia
2
Faculty of Integrated Technologies, Universiti Brunei Darussalam, Gadong, Bandar Seri Begawan BE1410, Brunei
3
Faculty of Food Science and Nutrition, Universiti Malaysia Sabah, Kota Kinabalu 88400, Sabah, Malaysia
*
Authors to whom correspondence should be addressed.
Sustainability 2022, 14(11), 6484; https://doi.org/10.3390/su14116484
Submission received: 1 April 2022 / Revised: 8 May 2022 / Accepted: 23 May 2022 / Published: 25 May 2022

Abstract

:
Batik industrial effluent wastewater (BIE) contains toxic dyes that, if directly channeled into receiving water bodies without proper treatment, could pollute the aquatic ecosystem and, detrimentally, affect the health of people. This study is aimed at assessing the adsorptive efficacy of a novel low-cost sewage-sludge-based biochar (SSB), in removing color from batik industrial effluent (BIE). Sewage-sludge-based biochar (SSB) was synthesized through two stages, the first is raw-material gathering and preparation. The second stage is carbonization, in a muffle furnace, at 700 °C for 60 min. To investigate the changes introduced by the preparation process, the raw sewage sludge (RS) and SSB were characterized by the Brunauer–Emmett–Teller (BET) method, Fourier-transform infrared spectroscopy (FTIR), and scanning electron microscopy. The surface area of biochar was found to be 117.7 m2/g. The results of FTIR showed that some functional groups, such as CO and OH, were hosted on the surface of the biochar. Continuous fixed-bed column studies were conducted, by using SSB as an adsorbent. A glass column with a diameter of 20 mm was packed with SSB, to depths of 5 cm, 8 cm, and 12 cm. The volumes of BIE passing through the column were 384 mL/d, 864 mL/d, and 1680 mL/d, at a flow rate of 16 mL/h, 36 mL/h, and 70 mL/h, respectively. The initial color concentration in the batik sample was 234 Pt-Co, and the pH was kept in the range of 3–5. The effect of varying bed depth and flow rate over time on the removal efficiency of color was analyzed. It was observed that the breakthrough time differed according to the depth of the bed and changes in the flow rates. The longest time, where breakthrough and exhausting points occurred, was recorded at the highest bed and slowest flowrate. However, the increase in flow rate and decrease in bed depth made the breakthrough curves steeper. The maximum bed capacity of 42.30 mg/g was achieved at a 16 mL/h flowrate and 12 cm bed height. Thomas and Bohart–Adams mathematical models were applied, to analyze the adsorption data and the interaction between the adsorption variables. For both models, the correlation coefficient (R2) was more than 0.9, which signifies that the experimental data are well fitted. Furthermore, the adsorption behavior is best explained by the Thomas model, as it covers the whole range of breakthrough curves.

1. Introduction

Environmental pollution is one of the current major global challenges [1]. Therefore, the global tendency towards minimizing, reusing, and recycling wastes, accompanied by attempts and efforts to impose environmental sustainability practices, is rapidly growing [2]. Wastewater effluent, either domestic or industrial, contains a wide range of pollutants, such as nutrients, dyes, and heavy metals [3]. These hazardous substances must be eliminated or minimized, before discharging the wastewater to receiving bodies [4]. Among these substances are dyes that, if not properly treated, could hinder the ecosystem’s photosynthetic activity, by preventing light penetration into the water [5]. However, batik is one of the traditional handicrafts of Malaysia, which represents the region’s heritage. In the manufacturing process of batik, three techniques are practiced in the industry: block batik, canting batik, and screen-printing batik [6]. Due to the huge demand in the local region and across the globe, batik is being manufactured in large quantities, which contributes to rapid economic development and, therefore, imposes inconceivable negative consequences to the environment [7]. Thus, one of the severe environmental issues is the dyed batik industry effluent (BIE), originated from various processes, including soaking, boiling, and rinsing. This effluent is, usually, discharged into natural water bodies without appropriate treatment, causing environmental and health problems [8]. This industrial effluent contains dyes, starch, and wax, leading to high pH, turbidity, COD, TSS, and concentrated color [7,9]. Moreover, the typically used dyes in batik are remazol and vinyl-sulfone-fiber-reactive ones [10], which have a complex molecular structure that is stable and cannot be degraded easily [11,12]. Different techniques have been developed to remove dyes from the wastewater, such as biodegradation, advanced oxidation, and Fenton, ozonation, and membrane technology [13]. Nevertheless, these techniques suffer from different flaws, such as long processing time and high cost. Compared to the many removal methods, the use of adsorption has been reported to be advantageous, not only at the laboratory level but also at the commercial level, when using available biomass precursors, such as seaweeds and agricultural wastes [14]. Recently, sewage sludge was reported to be a suitable raw material to prepare a high-adsorption-capacity biochar [15]. Besides the production of adsorbent, using sewage sludge as a feedstock is considered as an efficient disposal and management method [16].
Additionally, sludge resulting either from manufacturing activities or wastewater treatment is increasing, annually, which introduces another challenge in terms of disposal and management strategies [17]. The traditional method of handling wastewater is as follows: 10% of generated wastewater sludge is applied to agricultural land, 13% is used to produce biogas for energy, and the rest, which represents 77%, is disposed in landfills after dewatering, without proper treatment [18]. However, this traditional technique of handling and disposing of sludge has negative consequences and has deteriorated the ecosystem, in areas such as emission of greenhouse gases, groundwater contamination, and land contamination, creating another challenge to industries and municipalities, due to the lack of landfills [19]. Furthermore, sludge incineration is not an ecofriendly method, due to the formation of dioxins and toxic byproducts [20,21]. Besides that, the treatment and handling of sludge is an expensive process [22]. Thus, an alternative solution for sludge waste management is to valorize it into valuable products for further usage. The application of sludge, as biochar obtained by pyrolysis, is increasingly being used to remove various pollutants, such as heavy metals, dyes, phenolic compounds, and phosphates [23]. Various investigations have been reported in the literature on the use of adsorbents derived from sludge, for the adsorption of dye from the synthesized solution and real industrial effluent [21]. The purpose of this research was to evaluate the performance of the sewage-sludge-based biochar, in removing color from batik-effluent wastewater in column experiments. The effects of flow rate and bed depth on the removal process were investigated and fitted to the Thomas and Bohart–Adams models.

2. Materials and Methods

2.1. Collection of Sewage Sludge and Preparation of Adsorbent

The initial drying and carbonization of sewage sludge were conducted, following the procedure referred to in our previous study [24]. The sewage sludge came from the field of wastewater treatment plant located at Universiti Teknologi PETRONAS. Following the collection and natural drying in the sun, raw sewage sludge was dried in an oven, at 80 °C for 24 h. Then, it was carbonized in a muffle furnace, at a temperature of 700 °C for 60 min [25,26]. Henceforth, the produced SSB was, subsequently, ground and sieved to a size between 150 µm and 212 µm [24,27]. Characterization of SSB was conducted by a BET equation, based on the Brunauer–Emmett–Teller method, using an N2 adsorption/desorption isotherm, Fourier-transform infrared spectroscopy (FTIR), and scanning electron microscopy (SEM).

2.2. BIE Collection and Characterization

The batik effluent was obtained from a batik factory in Bota, Perak. Batik-effluent sample was screened on Whatman filter paper, with an aperture size of 0.45 µm, using a vacuum filtration system in a laboratory to remove the suspended particles, which might clog and block the wastewater flow in the column. The characterization of batik effluent is shown in Table 1.

2.3. Column Study

2.3.1. Experimental Set-Up

Column studies were conducted in three glass columns, of 2 cm diameter and 20 cm height. A peristaltic pump was used to convey BIE to the columns, at the required flow rate. Glass wool was inserted into the base opening of the column, to avoid any adsorbent leakage, provide the adsorbent bed with physical stability, distribute the solution, and eliminate channeling [24]. The interactions between parameters, including flow rates (16 mL/h, 36 mL/h, and 70 mL/h) and bed depth (5 cm, 8 cm, and 12 cm), were investigated. The pH of wastewater was adjusted, by adding diluted HCl or NaOH solution [28]. Samples from the column outlet were, periodically, collected and measured for color concentration, and the system was operated until saturation. The color was analyzed with s DR 3900 spectrophotometer, set at 120 and 455 nm.

2.3.2. Kinetic Modeling

  • Thomas Model
The Thomas kinetic model is simple and is applied widely to fit the experimental data of the fixed-bed column [29]. This model depends on the second-order reversible reaction kinetics and the Langmuir isotherm [30,31]. The calculation of parameters kinetic coefficient kTH and adsorption column capacity q0 is conducted using graph plot of Ct/C0 against time t for a given flow rate, using nonlinear regression analysis [14]. The linear form of the Thomas model’s equation is explained by Equation (1) [32].
ln ( C 0 C t 1 ) = k T H Q k T H C 0 t m  
  • Bohart–Adams model
Bohart and Adams first introduced this model in 1920, while studying the adsorption of chlorine on charcoal, based on maximum adsorption capacity (N0) and kinetic constants (kAB). This model explains the overall isotherm and the relationship between the effluent concentrations over the time and the initial concentration [33]. The linearized structure of the Bohart–Adams model is explained by Equation (2). This model is implemented to verify the column’s dynamic behavior and adopted by the experimental data for describing the initial part of the breakthrough curve, as cited by Chu [22].
ln ( C t C 0 ) = k A B C 0 t k A B N 0 ( Z U 0 )
where Z (cm) is the bed depth, kAB (L/mg·min) is the kinetic constant, N0 (mg/L) is the maximum adsorption capacity, and U0 (cm/min) is the linear velocity of the solution. A plot of ln (Ct/C0) versus t gives the value of correlation coefficients R2, kAB, and N0.

3. Results and Discussion

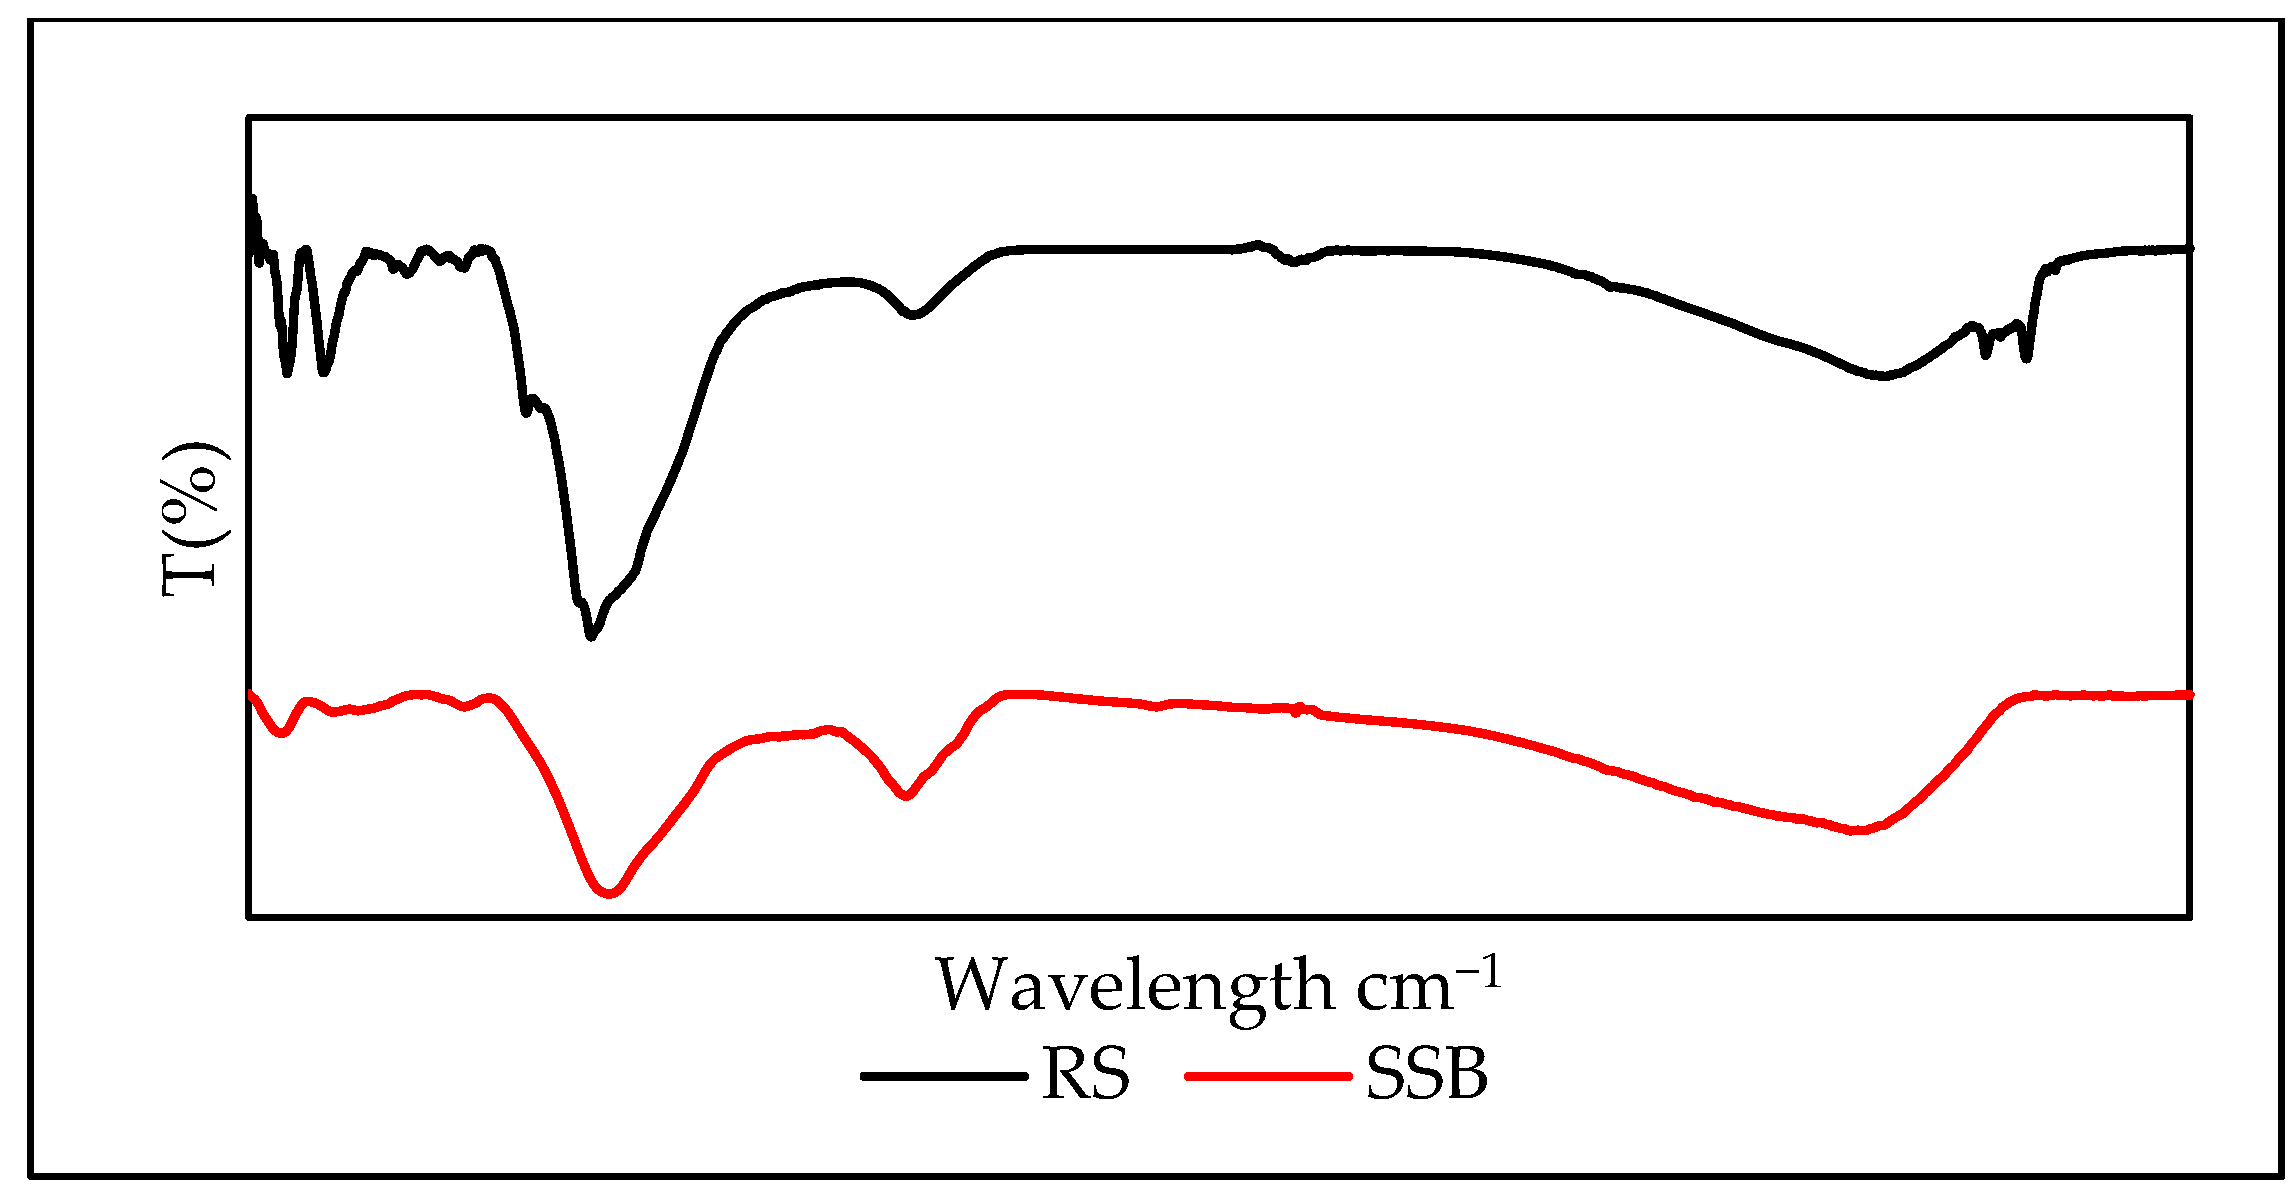
3.1. Adsorbent Preparation and Characterization

Table 2 presents the BET results of SSB. The specific surface area (BET) of the SSB was found to be 117.67 m2/g, and the total BJH volume was 0.007 cm3/g. According to the adsorption–desorption isotherm (shown in Figure 1), SSB has a reversible convex curve and matches, approximately, with type III, according to IUPAC classification [34]. This type indicates that the adsorbent has a microporous structure and contains many mesopores [35].
Biochar was obtained from sewage sludge at 700 °C under Nitrogen gas (BCSLN2) and carbon dioxide (BCSLCO2), using a muffle furnace [36]. The surface area is lower than the surface area that was achieved in this study. However, it can be seen the micropores are formed better. Textile industry sludge was used to produce textile-sludge-based biochar, TSB, to remove ofloxacin from aqueous solutions [37].
The N2 adsorption–desorption isotherms of SSB displayed a type IV curve (Figure 1). The absence of the H3-type hysteresis loop isotherm is due to the irregular structure of SSB, as illustrated with SEM [38]. Figure 2 and Figure 3 show the SEM images of the raw material and SSB at different magnifications. The sewage-sludge surface is heterogeneous and non-porous (Figure 2). Some pores have been formed on the SSB surface (Figure 3). The pore formation could be attributed to the carbonization process, which promoted the porous structure of the adsorbent [39]. The pores are formed during the removal of ash and volatile matter.
Furthermore, the abundance of pores in the surface enhances the adsorption process and provides sufficient active sites [40]. It has been proven that a longer contact time of activation resulted in a well-structured and porous adsorbent. Still, it is not economical regarding energy consumption [41]. Therefore, the sewage-sludge-activation time adopted in this study was one hour. The activation agent enlarges the surface area, minimizes the temperature and the required time for activation, and increases the yield percentage [42].
The appearance of porosity and wavy surface in SSB could be attributed to the removal of tar and impurities (Figure 3). The high porosity of the adsorbent, combined with its large surface area, provides high adsorption capacity. The pores of produced SSB are scattered, rough, less visible, and less numerous, which could be attributed to the absence of the chemical activation process. It was reported that the activated carbons, prepared without using a chemical activation agent, adopted considerably low surface areas, ranging between 10–50 m2/g, compared to 1000 m2/g adopted by those activated carbons to whom the chemical agent was introduced [43]. It was, also, found that a chemical agent, such as zinc chloride, eliminates the tar accumulation in the surface of activated carbon. Therefore, the microporosity in cellulosic and lignocellulosic wastes is developed [44].
Nevertheless, this analogy is not always applicable due to other factors, such as the nature of raw materials and activation temperature, which affect the formation of surface areas [45]. For instance, agricultural wastes contain lignin and lignocelluloses, which introduce a large surface area to the adsorbents [46]. Despite the excellent comparative benefits of utilizing sewage sludge, in terms of waste management and disposal, the surface area of sewage-sludge-based adsorbents, usually, is not of a high value compared to the adsorbents produced from agricultural waste [47]. The size of porosity for SSB and raw sludges were, approximately, 4.534 µm and 7.528 µm, respectively.
The sewage sludge EDX analysis (Figure 4) shows six elements in the composition of the raw sewage sludge (spectrum 1). Spectrum 1 shows a carbon signal at 0.277 KeV (53.3%) and oxygen at 34.5%, which gave a signal at 0.525 KeV. The spectrum, also, illustrates the existence of calcium (0.5%), Aluminum (2.6%), SI (4.1 %), and Fe (4.9%) at a low percentage, not exceeding 5% at K-alpha 3.690 KeV, 2.6 KeV, 2.7 KeV, and 6.12 KeV, respectively. The EDX analysis for SSB (Figure 4) showed eight elements in its composition (spectrum 2). Spectrum 2 shows a carbon signal at 0.26 KeV (17%), while oxygen is 40.4%, which appears at 5.25 KeV. Spectrum 2 also shows the existence of calcium (17%), Fe (12.8%), Si (12.8%), Al (10.5%), P (3.6%), and K (0.8%). Table 3 shows the elemental compositions of the raw sewage sludge and SSB in weightage percentage. The carbonization process decreased the carbon content of SSB, while the other elements’ percentages increased. Generally, the carbonization process expels the volatile matter. Chemical activation agents strip away the oxygen and enhance the decomposing process, leading to a rich carbon adsorbent [48]. It was shown that the C content of biochar activated by KOH could be either higher or lower than the original material, depending on the pyrolysis temperature and ash content of the raw material [49].
Figure 5 illustrates the graph of FTIR for sewage sludge and SSB. It can be seen that there are more bands in the curve of sewage sludge compared to the SSB curve. Furthermore, the intensity of bands on the sewage sludge curve is greater than that of the bands on the SSB curve. This could be due to the breaking of bonds during the carbonization process. A similar tendency was reported in preparing activated carbon from different waste materials, including fruit wastes, such as Ceiba speciosa kernels and onion leaves [50]. However, it was evident that some bands, such as 3367.47 cm−1 and 1017.39 cm−1, indicate the presence of OH groups and CO, respectively. These bands work as the active site on sewage-sludge-based biochar [51].

3.2. Column Study

3.2.1. Preliminary Study

The flow rate values and particle size were chosen based on the literature. The bench-scale laboratory column experiment’s flow rates ranged between 0.5–5 mL/min, and the particle size was below 300 µm [52,53]. Moreover, a calibration process was, also, conducted to select the suitable particle size and ensure there was no overflow during the experiments. It was found that there was smooth running over particle sizes of 150 µm, 212 µm, and 300 µm. In contradiction, too fine particles below 63 µm can clog the system and cause overflow.
Table 4 illustrates the daily flow volume, corresponding to the flow rates of 70 mL/h, 36 mL/h, and 12 mL/h. These slow flow rates are suitable for the applied size column. The results achieved, by investigating the particle size in the flow of solution into the column, showed that the smaller particle size is suitable for laboratory experiments, where the wall effect can be eliminated. Similar findings were reported by M. Malandrino et al., for removing heavy metals, where the suitable particle size of adsorbent was <90 μm. However, the small particle size is preferred to avoid channeling and overflow, provide more efficiency in the adsorption process, and reduce the required time [54,55].

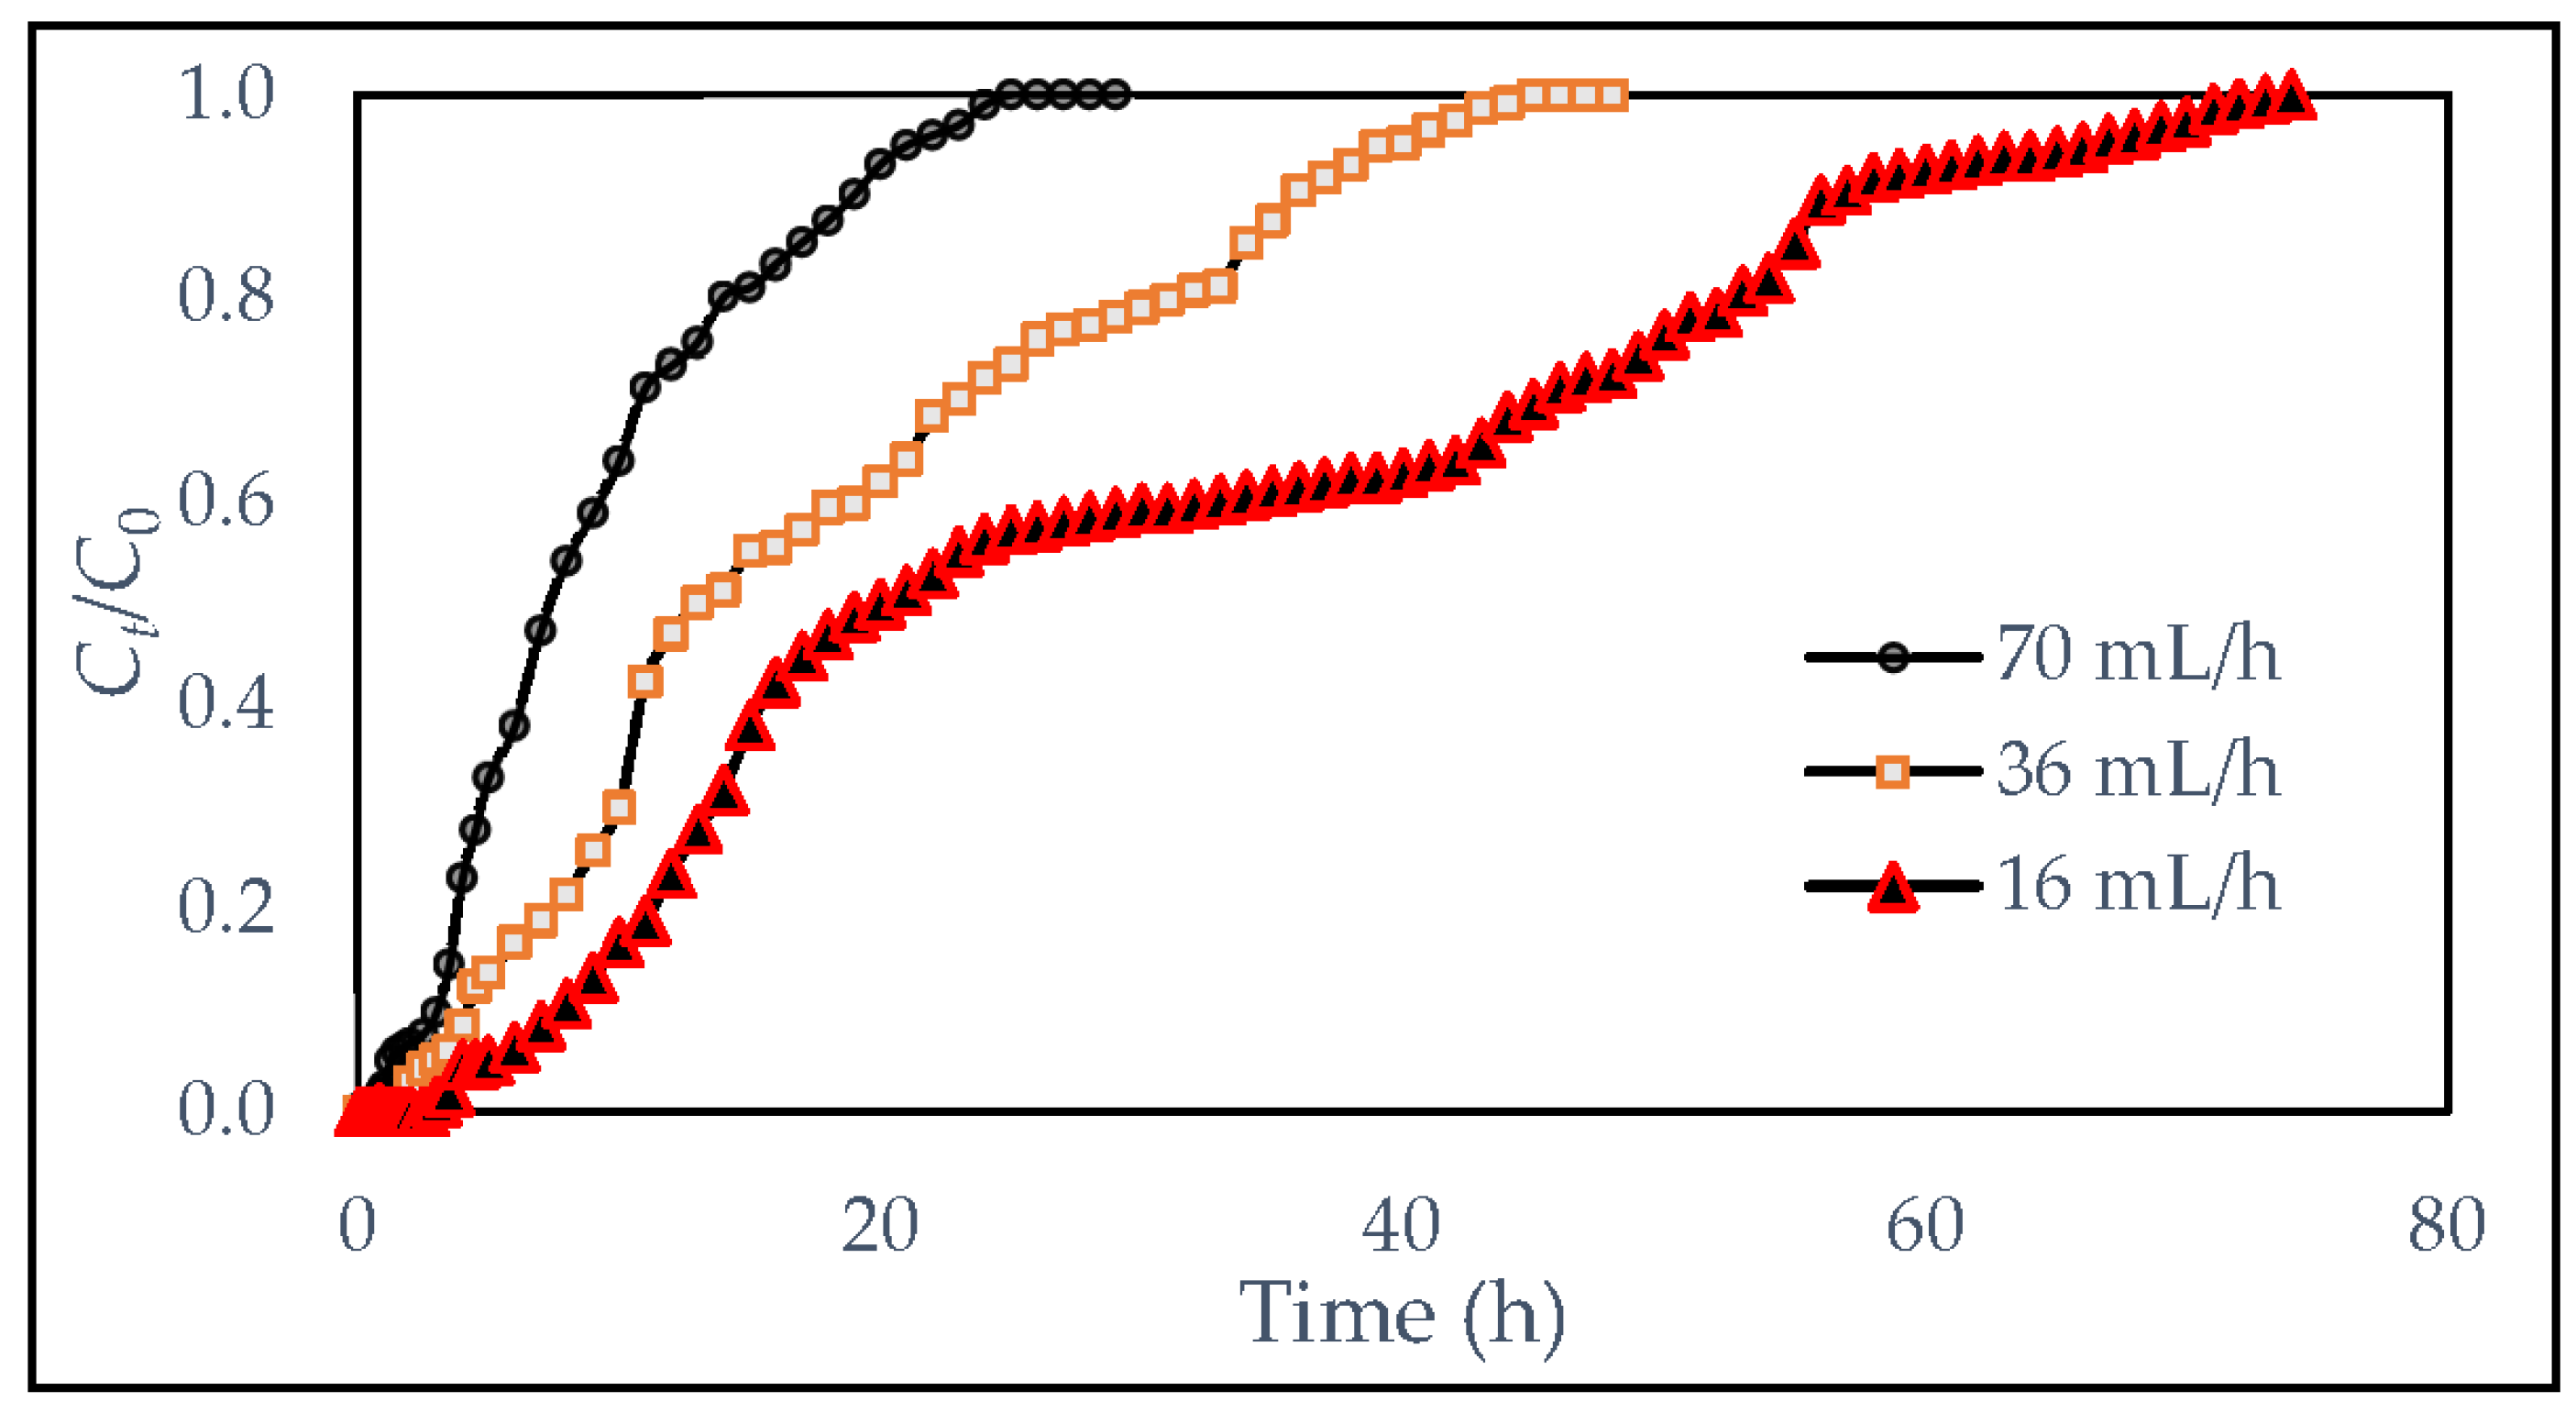
3.2.2. Influence of Operation Conditions on Dye Removal

Many factors affect the adsorption process, including flow rate, bed height, initial concentration, and pH. In this study, flow rate and bed depth effects were, separately, investigated. However, an acidic medium was reported to significantly increase in the removal of dyes, whether anionic or cationic, therefore, pH was maintained in the acidic range (3–5) [56]. Furthermore, the abundance of H+ enhances the impairment of electron donors in the dye structure [57].
  • Effect of feed-flow rate
Figure 6 depicts the change of the breakthrough curves, in a column packed with 12 cm of adsorbent and operated at flow rates of 16 mL/h, 36 mL/h, and 70 mL/h. It is evident that the breakthrough curve, at a lower flow rate (16 mL/h), tends to be more gradual and take longer to reach the point of exhaustion. However, at a higher flow rate, the curve becomes steeper. A similar trend was observed in the literature, during the adsorption of textile-industry effluent, using agro-waste-based activated carbon [58], removal of color from palm-oil-effluent wastewater using a sludge-based activated carbon [24], Chromium adsorption using crosslinked chitosan-Fe (III) complex (Ch-Fe) [59], and removal of Tartrazine anionic dye [60]. This trend, caused by the change in flow rate, could be attributed to the insufficient contact time between the adsorbate and adsorbent at a higher flow rate and to the rapid loading of adsorbent sites [61].
  • Effect of bed depth
Figure 7 shows the breakthrough curves of different bed depths of 5 cm, 8 cm, and 12 cm, at a constant flow rate of 36 mL/h. It can be noticed that the breakthrough and exhausting times increase with the increase in bed depth. Decreasing the bed depth caused the breakthrough curves to become steeper and achieve faster saturation, resulting in the bed’s early exhaustion. It was reported that the removal of dyes increased with the increase in bed depth at a constant flow rate and initial concentration, due to the abundance of active sites at a more extended bed depth [62]. An increase in breakthrough time of RO84 dye adsorption, due to the increase in bed depth, was, also, reported by Samir Charola et al. [63]. Furthermore, the mass transfer zone developed in small bed depth is tiny, leading to a steeper breakthrough curve [64].

3.2.3. Breakthrough Curve Behavior Investigation

The results of color removal in a fixed bed, at different flow rates and bed depths, are illustrated in Table 5. Generally, the adsorption capacity increases with the increase in the mass of the adsorbent. However, if the flow rate increases, the contact time is shortened, leading to a decrease in the adsorption capacity. The increase in the mass of the adsorbent expands the mass transfer zone (MTZ) because the increase in the adsorbent mass provides ample active sites and increases the surface area, which, in turn, contributes, effectively, to the widening of the mass transfer zone (MTZ) [65]. BIE was pumped through the columns with various bed depths (5 cm, 8 cm, and 12 cm) at three flow rates, 16 mL/h, 36 mL/h, and 70 mL/h. It was observed that the breakthrough time differed, according to the depth of the bed and changes in flow rates. At a depth of 12 cm, times of 75 min, 175 min, and 310 min elapsed before the breakthrough points were recorded for the flow rates of 70 mL/h, 36 mL/h, 16 mL/h, respectively. However, these periods of breakthrough times are the longest. They could be justified because the lengthy bed provides sufficient contact time between the adsorbate and adsorbent, assuring an abundance of active sites. Exhausting points, also, vary according to the bed depth, as it was found that the shortest bed, with a depth of 5 cm, recorded the shortest exhausting periods of 1100 min, 1320 min, and 3380 min for the flow rates of 70 mL/h, 36 mL/h, and 16 mL/h, respectively.
A comparison, between SSB-adsorption capacity and the adsorption capacities of different sewage-sludge-based biochar from the literature, has indicated that the maximum SSB capacity value is relatively lower. The maximum adsorption of para-aminobenzoic-acid-modified activated carbon was 66.87 mg/g, which was used to remove malachite green dye from aqueous solutions. The good adsorption capacity may be attributed to the nature of raw material of the activated carbon, which was date palm pits [66]. Adsorption capacity of 40 mg/g was achieved, using palm-shell-based activated carbon at pH 3 to remove reactive dyes from textile wastewater [67].

3.2.4. Mechanisms of Dyes Adsorption onto SSB

Adsorption of dyes onto the surface of biochar is carried out through multiple mechanisms, including electrostatic interactions, ion exchange, and π–π interactions. However, reactive dyes are removed through Van der Waals forces [68]. On the other hand, the biochar surface hosted many hydroxyl groups, which react with the reactive dyes to form hydrogen bonds. Hydroxyl groups (-OH) on the surface of biochar interact with the protonated amine (-NH3+) to form a hydrogen bond [69]. It is worth mentioning that batik-industry effluent consists of different types of reactive dyes, including naphthol, indigo soluble, and direct, remazol, and reactive dyes, which make it complicated to determine the adsorption mechanism [68]. Furthermore, the pH number affects the solubility of dyes and disassociation of functional groups. However, batik-wastewater effluent contains both cationic and anionic dyes, which are stable in an acidic medium (2–8). It was reported that a higher removal efficiency was achieved for anionic dyes in an acidic medium [68]. The possible mechanisms of adsorption into SSB are shown in Figure 8.

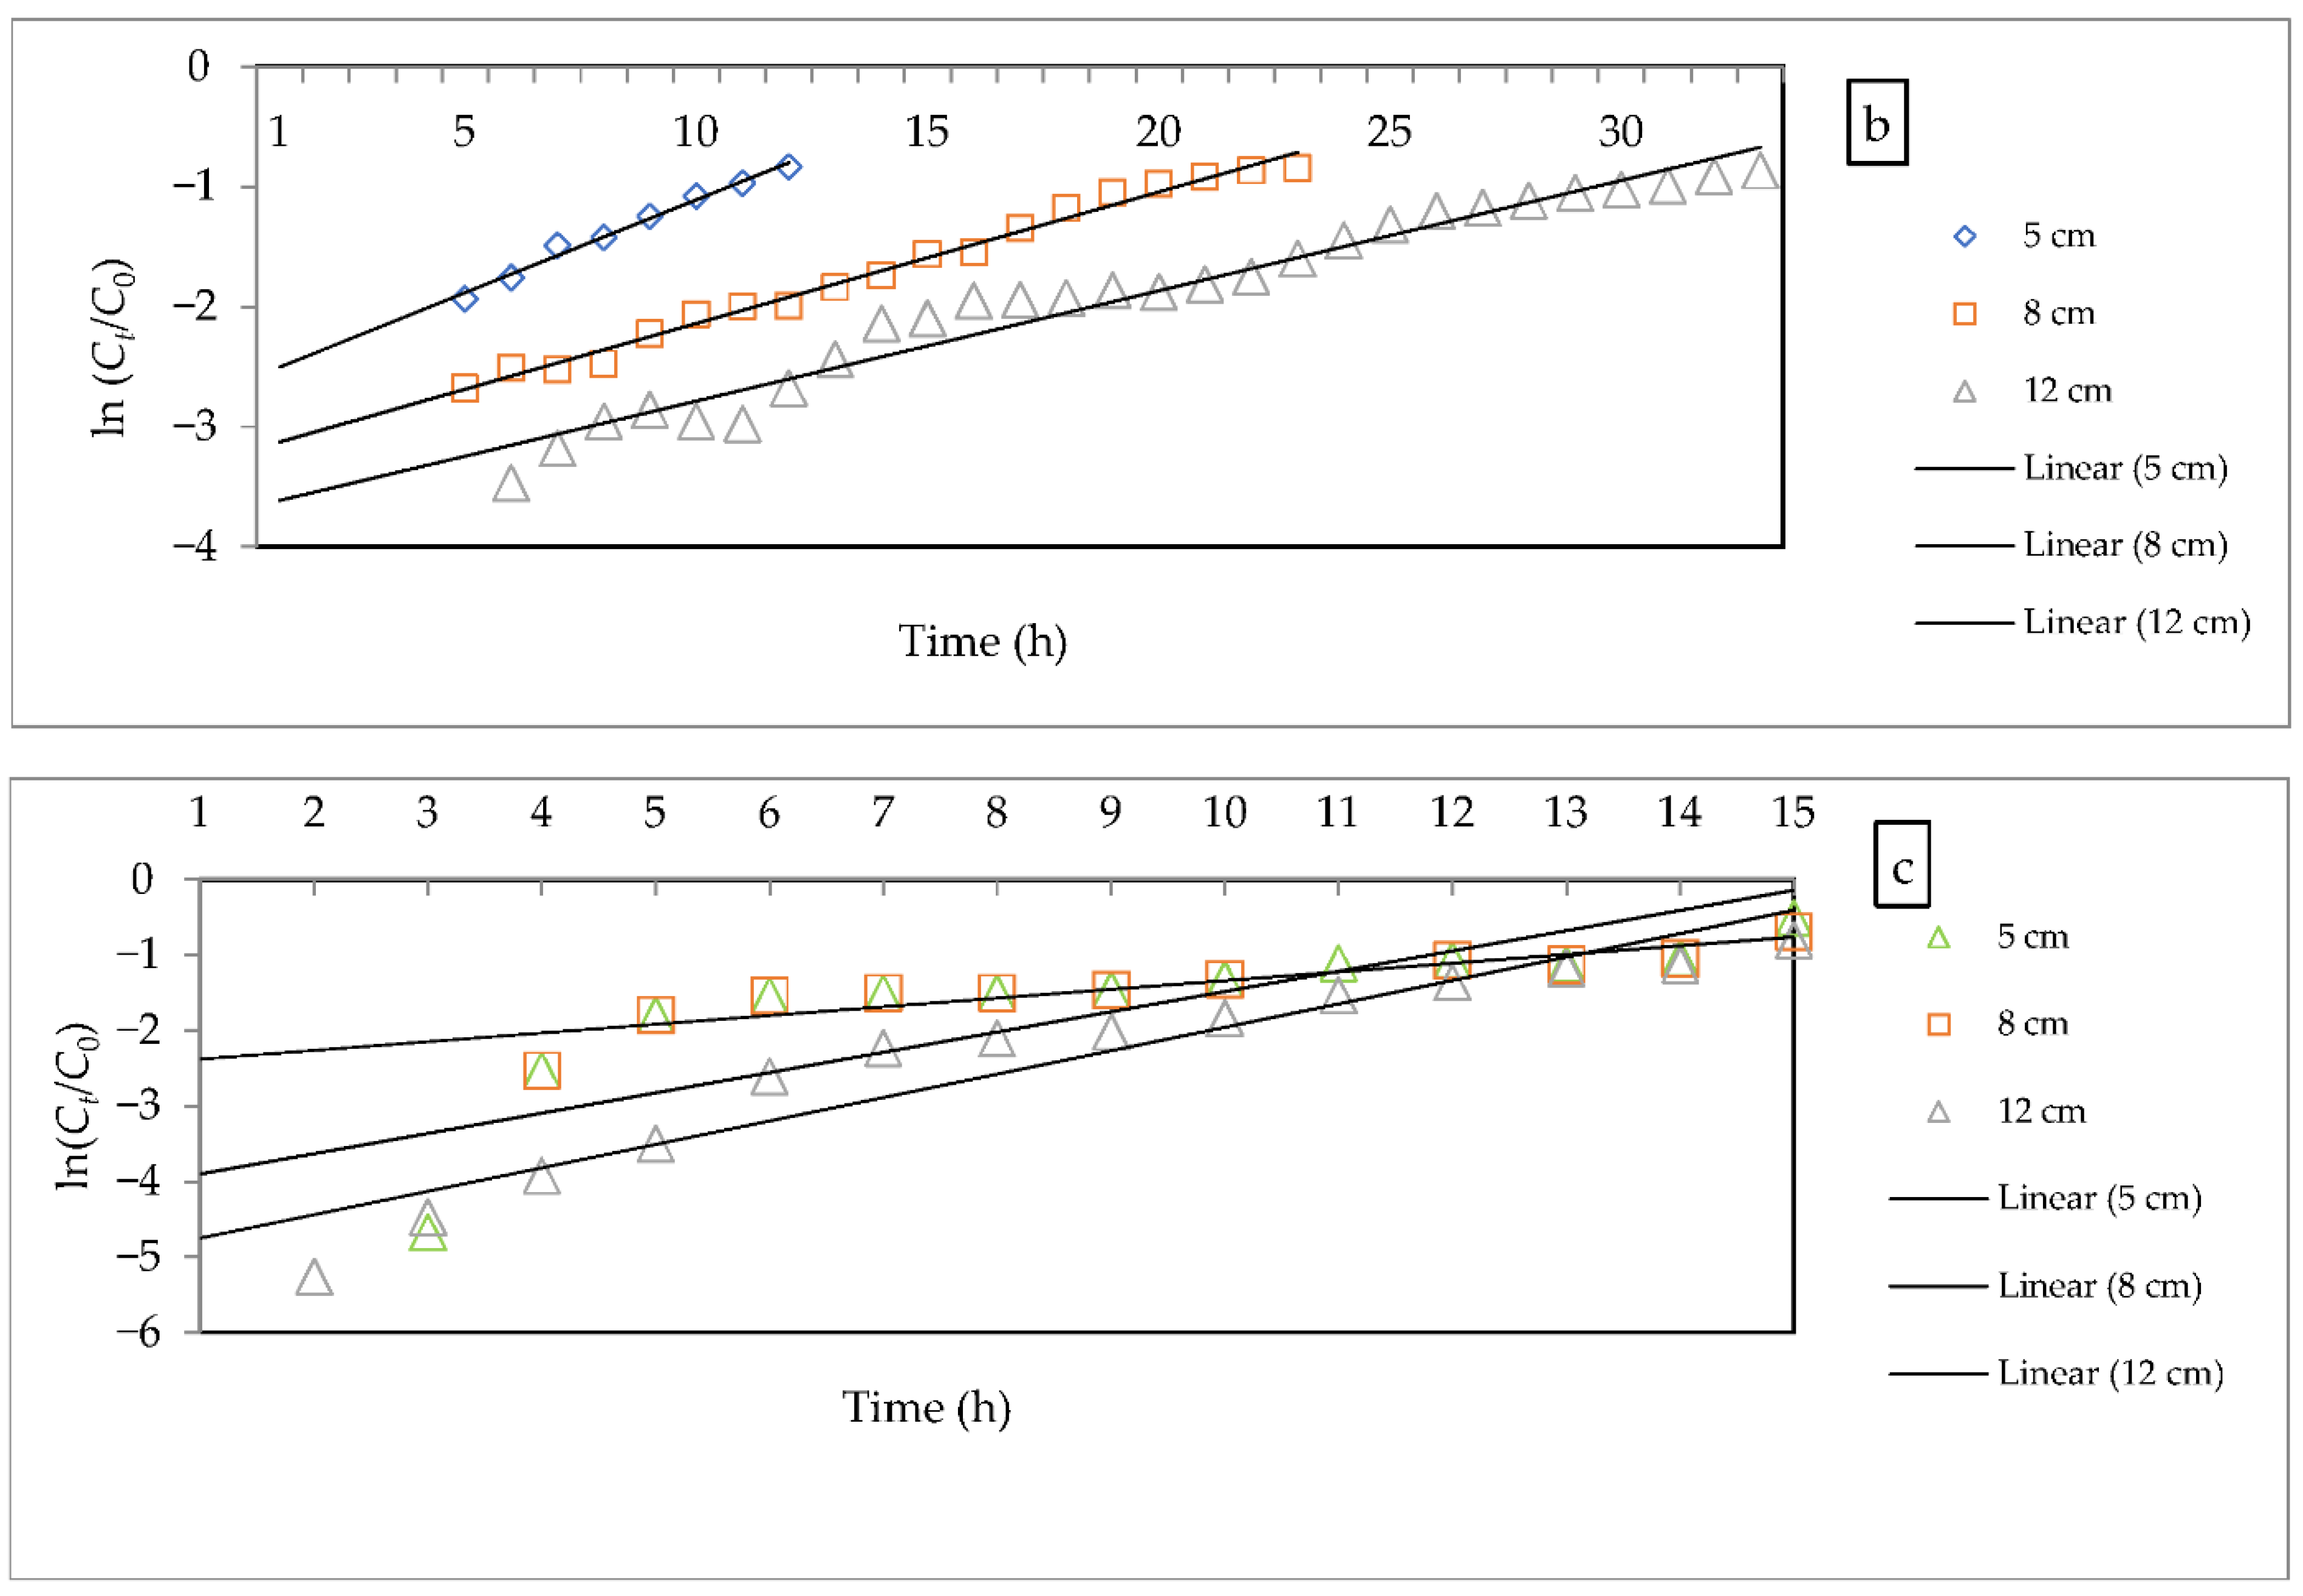
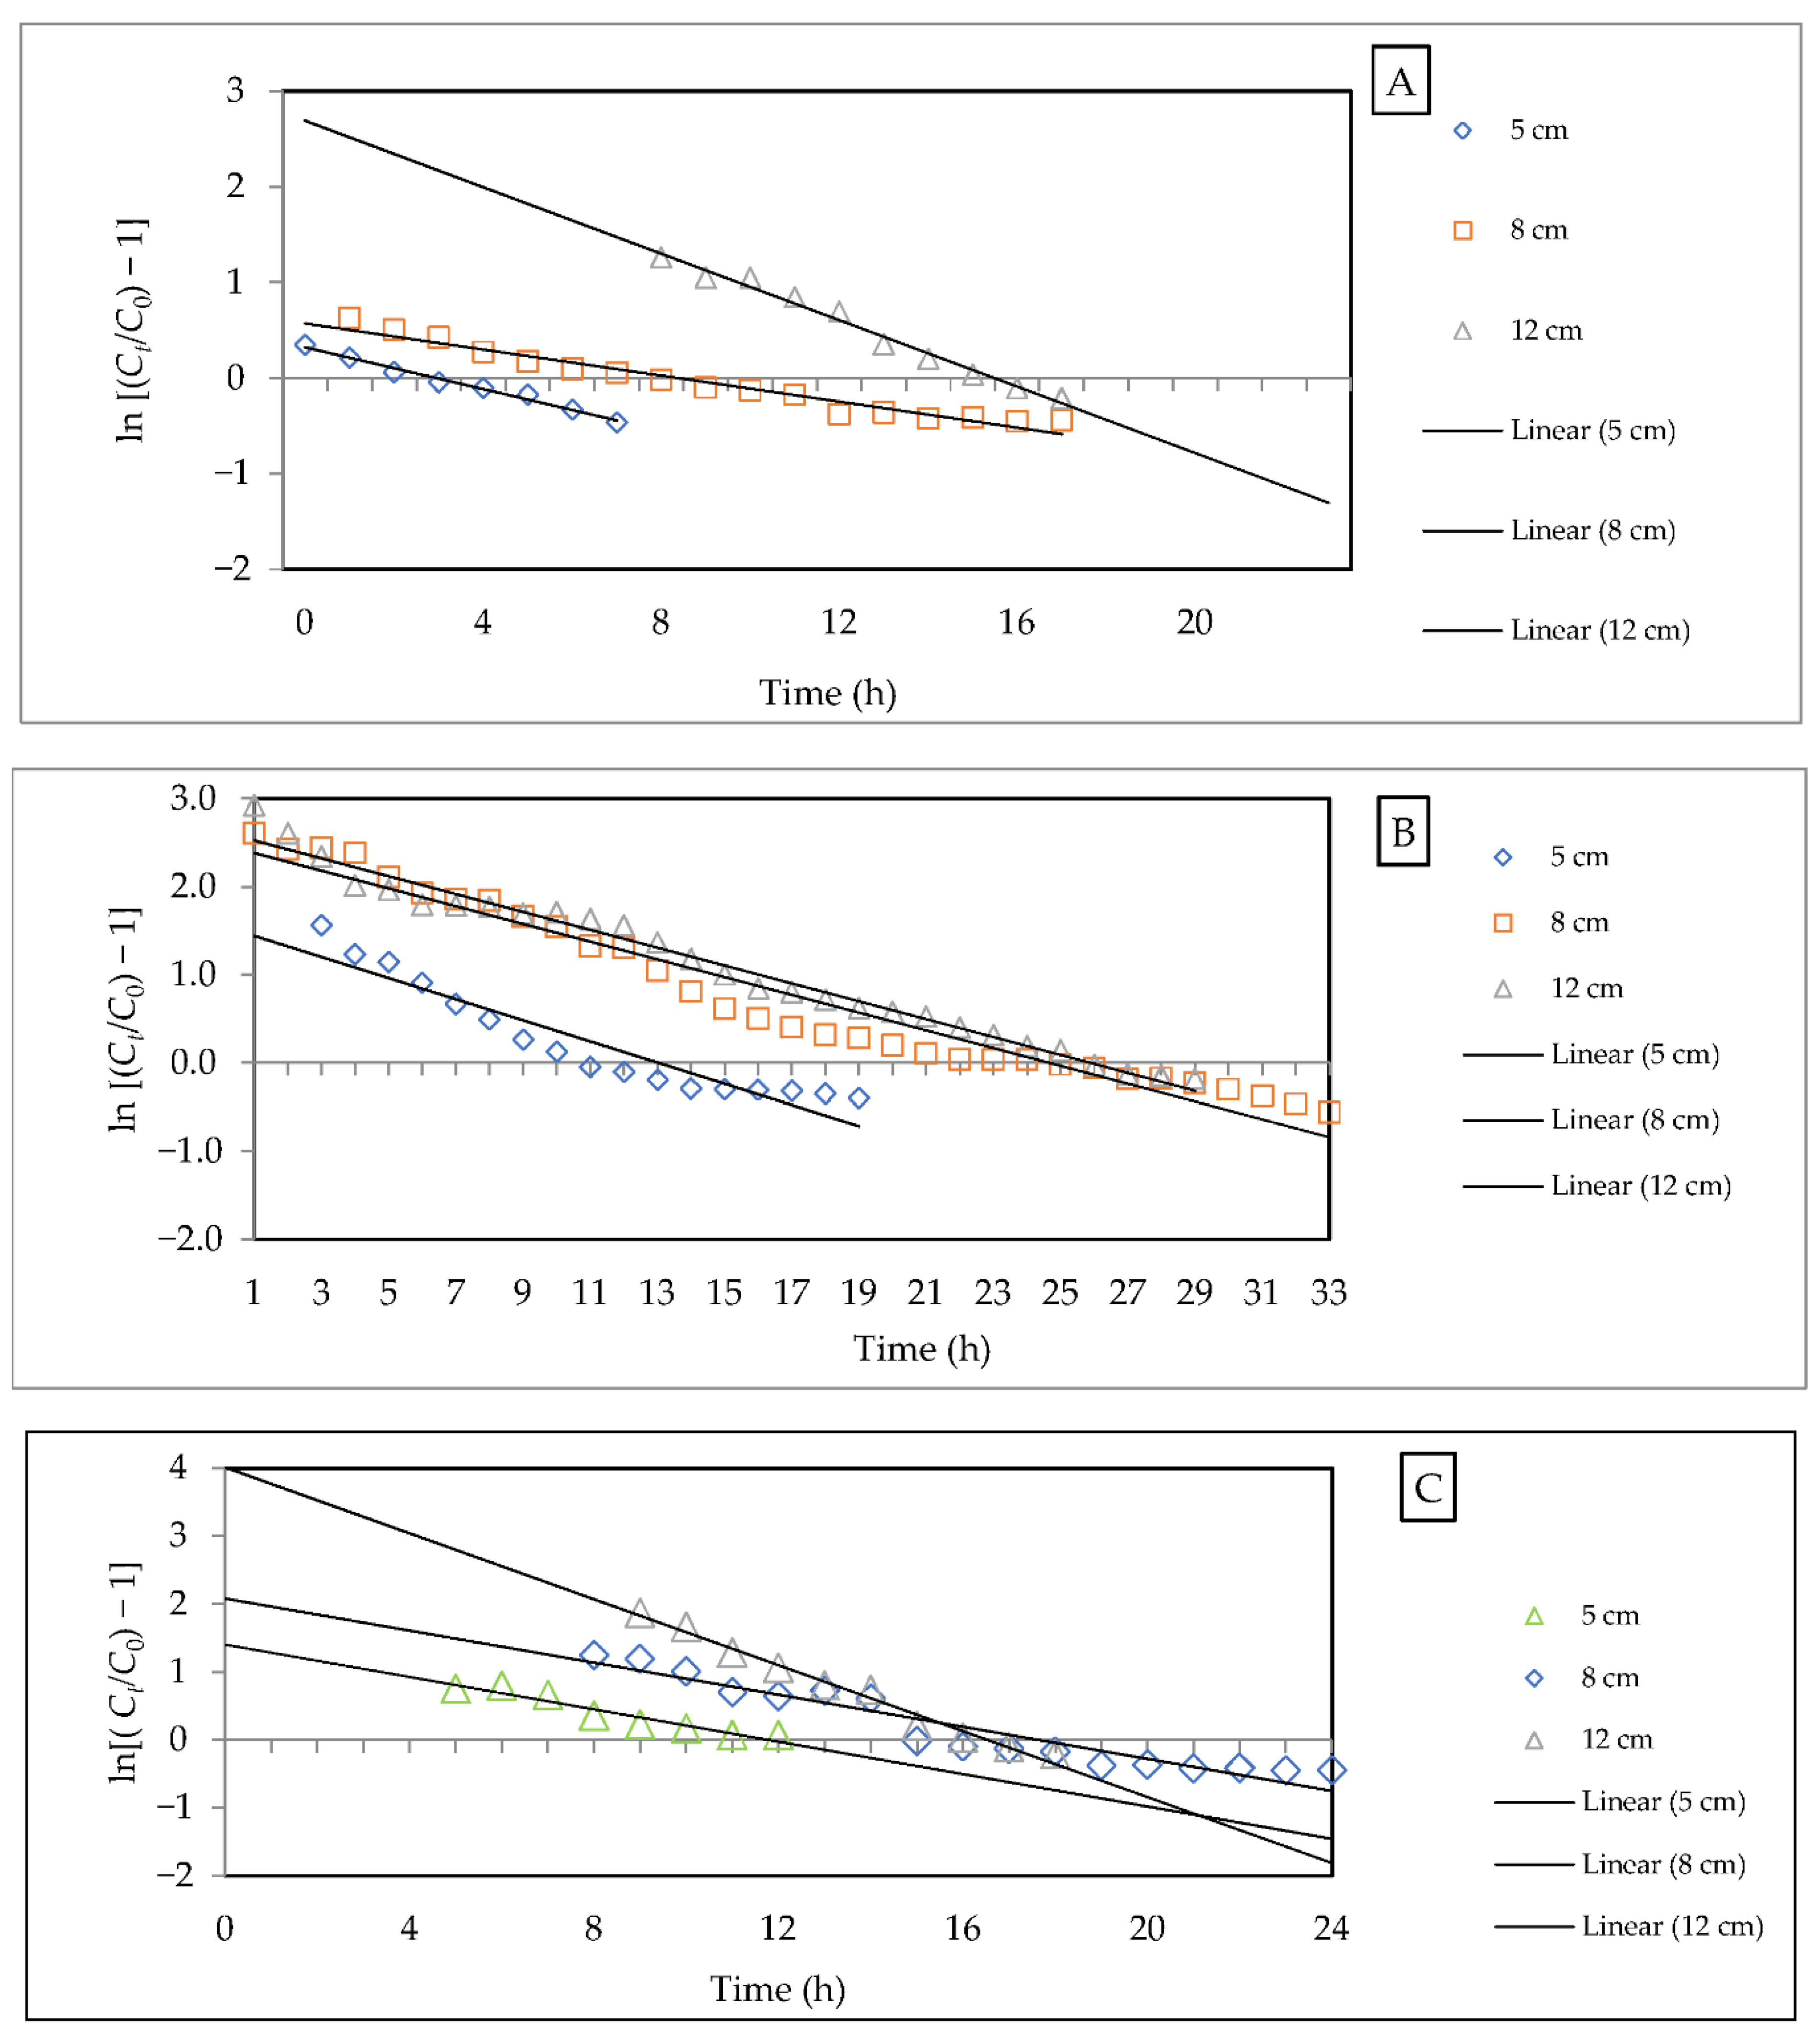
3.2.5. Evaluation of Kinetic Models

  • Bohart–Adams model
The Bohart–Adams model is, often, used to explain the initial part of the breakthrough curve (Ct/C0 < 0.5) [70]. In this model, the maximum adsorption capacity N 0 and Bohart–Adams kinetic constant ( k A B ) are determined, using a linear plot of ln ( C t / C 0 ) against time (h), as shown in Figure 9. The parameters of this model were calculated with the aid of Equation (2), as illustrated in Table 6. However, this model provides a reliable breakthrough curve estimation, with a high correlation coefficient R 2 value of between 0.92 and 0.99. It is obvious that an increase in flow rate leads to an increase in N 0   value and k A B . It indicates that the mass transfer zone controls the system of the adsorption process. This finding agrees with research conducted by Baral et al. [71]. The decrease in saturation concentration with the augmentation of bed depth could be assigned to the abundance of active sites [72,73]. The k A B value was, also, reported to decrease with an increase in bed depth. This model provides a simple explanation of the breakthrough curve, restricted to the experiment conditions [64,74].
  • Thomas model
In conceptual knowledge of column performance, the Thomas model is the most general and most widely used, to predict the behavior of the fixed-bed column, as it is able to represent the whole range of data [75]. Experimental data from the column study were fitted to the Thomas model, to determine the Thomas’ rate constant k T H and the maximum solid-phase concentration q 0 . The parameters were determined using non-linear regression analysis in Equation (1), as shown in Table 7. Thomas’s constant value is directly proportional to the flow rate and bed depth, where an increase in these two parameters will lead to an increase in Thomas’s constant rate. In addition, the total adsorption capacity q 0 decreases as the bed depth increases, but it keeps increasing with the increase in flow rate. This trend could be assigned to the fact that the adsorption process is governed by the mass transfer zone, not only by the chemical reactions. Therefore, the driving force is stronger in the longer bed depth because of the availability of active sites, which created a massive gap in the concentration between the adsorbate and adsorbent [76]. These findings matched with findings of Radhika et al.’s research, on removing perchlorate using activated carbon [77]. The value of R2 ranged from 0.9 up to 0.99, demonstrating that the regression line, almost perfectly, fits the model. Therefore, a comparison of the results, from the experimental breakthrough curve and the predicted breakthrough curve using the Thomas model, shows that the behavior of the column was correlative to each other under different flow rates, as shown in Figure 10.

4. Conclusions

This study was conducted to scrutinize the efficiency of sewage-sludge-based biochar (SSB), as a suitable adsorbent in column study, to remove the dye from batik-wastewater effluent. FTIR spectroscopy showed that the surface of SSB hosts some functional groups, including OH and CO, which are responsible for the adsorption of dye molecules. The removal process of dye in the fixed-bed column indicated the breakthrough time is directly proportional to the depth of the bed and inversely proportional to the flow rate. In modeling adsorption behavior, both the Thomas and Bohart–Adams models, sufficiently, explained the experimental data. However, Bohart–Adams can only describe the initial part of the breakthrough curve. The moving of the transfer zone is accelerated with the increase in flow rate. In summary, the column bed depth and flow rate highly affect the fixed-bed adsorption of dye onto sewage-sludge-based biochar (SSB). It has been proven that sewage sludge could be used as an effective adsorbent for dye removal. The SSB implication is a good alternative and an appropriate treatment alternative for batik effluent, due to its low cost and high efficiency. However, it is recommended to scale up the fixed-bed column to meet the actual treatment-plant conditions. Biochar’s potential applications for the removal of other pollutants should, also, be investigated. Similarly, future research should concentrate on evaluating sludge-based biochar as a potential material for the manufacturing of filtering membranes.

Author Contributions

Conceptualization, N.M.Y.A.-M. and S.R.M.K.; methodology, N.M.Y.A.-M. and S.R.M.K.; formal analysis, N.M.Y.A.-M., A.N., A.A.-N. and S.R.M.K.; investigation, N.M.Y.A.-M.; resources, N.M.Y.A.-M. and S.R.M.K.; data curation, S.R.M.K. and N.H.; writing—original draft preparation, N.M.Y.A.-M. and A.A.-N.; writing—review and editing, A.H.J., S.R.M.K., M.R.B. and R.K.; visualization, B.N.S.A.-d., A.A.S.G., N.H. and M.R.B.; supervision, S.R.M.K.; project administration, S.R.M.K.; funding acquisition, N.H. All authors have read and agreed to the published version of the manuscript.

Funding

This research was funded by Universiti Teknologi PETRONAS, and the APC was funded by Universiti Malaysia Sabah.

Institutional Review Board Statement

Not applicable.

Informed Consent Statement

Not applicable.

Data Availability Statement

The data used in this study are available from the corresponding author upon request, only for research purposes.

Conflicts of Interest

The authors declare no conflict of interest.

References

  1. Ghaleb, A.A.S.; Kutty, S.R.M.; Ho, Y.-C.; Jagaba, A.H.; Noor, A.; Al-Sabaeei, A.M.; Almahbashi, N.M.Y. Response Surface Methodology to Optimize Methane Production from Mesophilic Anaerobic Co-Digestion of Oily-Biological Sludge and Sugarcane Bagasse. Sustainability 2020, 12, 2116. [Google Scholar] [CrossRef] [Green Version]
  2. Almahbashi, N.; Kutty, S.; Ayoub, M.; Noor, A.; Salihi, I.; Al-Nini, A.; Jagaba, A.; Aldhawi, B.; Ghaleb, A. Optimization of Preparation Conditions of Sewage sludge based Activated Carbon. Ain Shams Eng. J. 2021, 12, 1175–1182. [Google Scholar] [CrossRef]
  3. Almahbashi, N.M.Y.; Kutty, S.R.M.; Chua, Y.C.; Sholagberu, A.T.; Ghaleb, A.A.S.; Aminu, N. Kinetics of Nutrient Removal in an Integrated Suspended Growth Reactor. Int. J. Integr. Eng. 2019, 11, 178–185. [Google Scholar] [CrossRef] [Green Version]
  4. Saeed, A.; Harun, N.; Sufian, S.; Siyal, A.; Zulfiqar, M.; Bilad, M.; Vagananthan, A.; Al-Fakih, A.; Ghaleb, A.; Almahbashi, N. Eucheuma cottonii Seaweed-Based Biochar for Adsorption of Methylene Blue Dye. Sustainability 2020, 12, 10318. [Google Scholar] [CrossRef]
  5. Collivignarelli, M.C.; Abbà, A.; Miino, M.C.; Damiani, S. Treatments for color removal from wastewater: State of the art. J. Environ. Manag. 2019, 236, 727–745. [Google Scholar] [CrossRef]
  6. Hairuddin, H.; Noor, N.L.M.; Ab Malik, A.M. Why do Microenterprise Refuse to Use Information Technology: A Case of Batik Microenterprises in Malaysia. Procedia Soc. Behav. Sci. 2012, 57, 494–502. [Google Scholar] [CrossRef] [Green Version]
  7. Azha, S.F.; Ismail, S. Feasible and economical treatment of real hand-drawn batik/textile effluent using zwitterionic adsorbent coating: Removal performance and industrial application approach. J. Water Process Eng. 2021, 41, 102093. [Google Scholar] [CrossRef]
  8. Khalik, W.F.; Ho, L.-N.; Ong, S.-A.; Voon, C.-H.; Wong, Y.-S.; Yusuf, S.Y.; Yusoff, N.A.; Lee, S.-L. Enhancement of simultaneous batik wastewater treatment and electricity generation in photocatalytic fuel cell. Environ. Sci. Pollut. Res. 2018, 25, 35164–35175. [Google Scholar] [CrossRef]
  9. Effendi, H.; Sari, R.D.; Hasibuan, S. Moringa oleifera as coagulant for batik effluent treatment. In Proceedings of the 35th Annual Conference of the International Association for Impact Assessment, Firenze Fiera Congress and Exhibition Center, Florence, Italy, 20–23 April 2015. [Google Scholar]
  10. Rashidi, H.; Sulaiman, N.N.; Hashim, N. Batik Industry Synthetic Wastewater Treatment Using Nanofiltration Membrane. Procedia Eng. 2012, 44, 2010–2012. [Google Scholar] [CrossRef] [Green Version]
  11. Haque, A.N.M.A.; Islam, M.A. The contribution of different vinyl sulphone-reactive dyes to an effluent. J. Taibah Univ. Sci. 2015, 9, 594–600. [Google Scholar] [CrossRef] [Green Version]
  12. Burkinshaw, S.M.; Kabambe, O. Attempts to reduce water and chemical usage in the removal of bifunctional reactive dyes from cotton: Part 2 bis (vinyl sulfone), aminochlorotriazine/vinyl sulfone and bis (aminochlorotriazine/vinyl sulfone) dyes. Dyes and Pigments 2011, 88, 220–229. [Google Scholar] [CrossRef]
  13. Lyu, H.; Gong, Y.; Gurav, R.; Tang, J. Chapter 9—Potential Application of Biochar for Bioremediation of Contaminated Systems Biochar Application; Elsevier: Amsterdam, The Netherlands, 2016. [Google Scholar]
  14. Choi, Y.K.; Choi, T.R.; Gurav, R.; Bhatia, S.K.; Park, Y.L.; Kim, H.J.; Kan, E.; Yang, Y.H. Adsorption behavior of tetracycline onto Spirulina sp. (microalgae)-derived biochars produced at different temperatures. Sci. Total Environ. 2020, 710, 136282. [Google Scholar] [CrossRef]
  15. Ho, S.-H.; Chen, Y.-D.; Yang, Z.-K.; Nagarajan, D.; Chang, J.-S.; Ren, N.-Q. High-efficiency removal of lead from wastewater by biochar derived from anaerobic digestion sludge. Bioresour. Technol. 2017, 246, 142–149. [Google Scholar] [CrossRef]
  16. Ni, B.-J.; Huang, Q.-S.; Wang, C.; Ni, T.-Y.; Sun, J.; Wei, W. Competitive adsorption of heavy metals in aqueous solution onto biochar derived from anaerobically digested sludge. Chemosphere 2018, 219, 351–357. [Google Scholar] [CrossRef]
  17. Ghaleb, A.; Kutty, S.; Salih, G.; Jagaba, A.; Noor, A.; Kumar, V.; Almahbashi, N.; Saeed, A.; Al-Dhawi, B.S. Sugarcane Bagasse as a Co-Substrate with Oil-Refinery Biological Sludge for Biogas Production Using Batch Mesophilic Anaerobic Co-Digestion Technology: Effect of Carbon/Nitrogen Ratio. Water 2021, 13, 590. [Google Scholar] [CrossRef]
  18. Hosomi, M. New challenges on wastewater treatment. Clean Technol. Environ. Policy 2016, 18, 627. [Google Scholar] [CrossRef] [Green Version]
  19. Ding, A.; Zhang, R.; Ngo, H.H.; He, X.; Ma, J.; Nan, J.; Li, G. Life cycle assessment of sewage sludge treatment and disposal based on nutrient and energy recovery: A review. Sci. Total Environ. 2021, 769, 144451. [Google Scholar] [CrossRef]
  20. Gómez-Pacheco, C.; Rivera-Utrilla, J.; Sánchez-Polo, M.; López-Peñalver, J. Optimization of the preparation process of biological sludge adsorbents for application in water treatment. J. Hazard. Mater. 2012, 217, 76–84. [Google Scholar] [CrossRef]
  21. Devi, P.; Saroha, A.K. Utilization of sludge based adsorbents for the removal of various pollutants: A review. Sci. Total Environ. 2017, 578, 16–33. [Google Scholar] [CrossRef]
  22. Hii, K.; Baroutian, S.; Parthasarathy, R.; Gapes, D.; Eshtiaghi, N. A review of wet air oxidation and Thermal Hydrolysis technologies in sludge treatment. Bioresour. Technol. 2014, 155, 289–299. [Google Scholar] [CrossRef]
  23. Gao, N.; Kamran, K.; Quan, C.; Williams, P.T. Thermochemical conversion of sewage sludge: A critical review. Prog. Energy Combust. Sci. 2020, 79, 100843. [Google Scholar] [CrossRef]
  24. Kutty, S.; Almahbashi, N.; Nazrin, A.; Malek, M.; Noor, A.; Baloo, L.; Ghaleb, A. Adsorption kinetics of colour removal from palm oil mill effluent using wastewater sludge carbon in column studies. Heliyon 2019, 5, e02439. [Google Scholar] [CrossRef] [Green Version]
  25. Sivaraj, R.; Rajendran, V.; Gunalan, G.S. Preparation and characterization of activated carbons from Parthenium biomass by physical and chemical activation techniques. E-J. Chem. 2010, 7, 1314–1319. [Google Scholar] [CrossRef] [Green Version]
  26. Rajeshwarisivaraj; Sivakumar, S.; Senthilkumar, P.; Subburam, V. Carbon from Cassava peel, an agricultural waste, as an adsorbent in the removal of dyes and metal ions from aqueous solution. Bioresour. Technol. 2001, 80, 233–235. [Google Scholar] [CrossRef]
  27. El-Sayed, G.O.; Yehia, M.M.; Asaad, A.A. Assessment of activated carbon prepared from corncob by chemical activation with phosphoric acid. Water Resour. Ind. 2014, 7, 66–75. [Google Scholar] [CrossRef] [Green Version]
  28. Badawi, M.; Negm, N.; Kana, M.A.; Hefni, H.; Moneem, M.A. Adsorption of aluminum and lead from wastewater by chitosan-tannic acid modified biopolymers: Isotherms, kinetics, thermodynamics and process mechanism. Int. J. Biol. Macromol. 2017, 99, 465–476. [Google Scholar] [CrossRef]
  29. Bishayee, B.; Ruj, B.; Nandi, S.; Chatterjee, R.P.; Mallick, A.; Chakraborty, P.; Nayak, J.; Chakrabortty, S. Sorptive elimination of fluoride from contaminated groundwater in a fixed bed column: A kinetic model validation based study. J. Indian Chem. Soc. 2021, 99, 100302. [Google Scholar] [CrossRef]
  30. Roshni, K.; Soumen, D. A breakthrough column study for removal of malachite green using coco-peat. Int. J. Phytoremediation 2019, 21, 1263–1271. [Google Scholar]
  31. Abbasi, M.; Safari, E.; Baghdadi, M.; Janmohammadi, M. Enhanced adsorption of heavy metals in groundwater using sand columns enriched with graphene oxide: Lab-scale experiments and process modeling. J. Water Process Eng. 2021, 40, 101961. [Google Scholar] [CrossRef]
  32. Saadi, Z.; Saadi, R.; Fazaeli, R. Fixed-bed adsorption dynamics of Pb (II) adsorption from aqueous solution using nanostructured γ-alumina. J. Nanostruct. Chem. 2013, 3, 48. [Google Scholar] [CrossRef] [Green Version]
  33. Njaramba, L.K.; Kim, S.; Kim, Y.; Cha, B.; Kim, N.; Yoon, Y.; Park, C.M. Remarkable adsorption for hazardous organic and inorganic contaminants by multifunctional amorphous core–shell structures of metal–organic framework-alginate composites. Chem. Eng. J. 2022, 431, 133415. [Google Scholar] [CrossRef]
  34. Muttakin, M.; Mitra, S.; Thu, K.; Ito, K.; Saha, B.B. Theoretical framework to evaluate minimum desorption temperature for IUPAC classified adsorption isotherms. Int. J. Heat Mass Transf. 2018, 122, 795–805. [Google Scholar] [CrossRef]
  35. Li, Y.-H.; Chang, F.-M.; Huang, B.; Song, Y.-P.; Zhao, H.-Y.; Wang, K.-J. Activated carbon preparation from pyrolysis char of sewage sludge and its adsorption performance for organic compounds in sewage. Fuel 2020, 266, 117053. [Google Scholar] [CrossRef]
  36. Czech, B.; Kończak, M.; Rakowska, M.; Oleszczuk, P. Engineered biochars from organic wastes for the adsorption of diclofenac, naproxen and triclosan from water systems. J. Clean. Prod. 2021, 288, 125686. [Google Scholar] [CrossRef]
  37. Singh, V.; Srivastava, V.C. Self-engineered iron oxide nanoparticle incorporated on mesoporous biochar derived from textile mill sludge for the removal of an emerging pharmaceutical pollutant. Environ. Pollut. 2019, 259, 113822. [Google Scholar] [CrossRef] [PubMed]
  38. Wang, P.; Chen, W.; Zhang, R.; Xing, Y. Enhanced Removal of Malachite Green Using Calcium-Functionalized Magnetic Biochar. Int. J. Environ. Res. Public Health 2022, 19, 3247. [Google Scholar] [CrossRef] [PubMed]
  39. Misran, E.; Okta, B.; Margaretha, S.E.; Purba, A.S. Banana stem based activated carbon as a low-cost adsorbent for methylene blue removal: Isotherm, kinetics, and reusability. Alex. Eng. J. 2022, 1, 1946–1955, 2022. [Google Scholar] [CrossRef]
  40. Ramalingam, R.J.; Sivachidambaram, M.; Vijaya, J.J.; Al-Lohedan, H.A.; Muthumareeswaran, M.R. Synthesis of porous activated carbon powder formation from fruit peel and cow dung waste for modified electrode fabrication and application. Biomass Bioenergy 2020, 142, 105800. [Google Scholar] [CrossRef]
  41. Davide, B.; Toni, V.; Henrik, R.; Lassi, U. Activated carbon from hydrolysis lignin: Effect of activation method on carbon properties. Biomass Bioenergy 2022, 159, 106387. [Google Scholar]
  42. Abdulhameed, A.S.; Firdaus, N.N.M.; Rangabhashiyam, S.; Jawad, A.H. Statistical modeling and mechanistic pathway for methylene blue dye removal by high surface area and mesoporous grass-based activated carbon using K2CO3 activator. J. Environ. Chem. Eng. 2021, 9, 105530. [Google Scholar] [CrossRef]
  43. Jun’ichi, H.; Atsuo, K.; Katsuhiko, M.; Watkinson, A.P. Preparation of activated carbon from lignin by chemical activation. Carbon 2000, 38, 1873–1878. [Google Scholar]
  44. Işılay, O.; Mehmet, Ş.; Ramazan, O.; Erdem, M. Preparation and characterization of activated carbon from grape stalk by zinc chloride activation. Fuel Processing Technol. 2014, 125, 200–206. [Google Scholar]
  45. Saeed, A.A.H.; Harun, N.Y.; Zulfani, N. Heavy metals capture from water sludge by kenaf fibre activated carbon in batch adsorption. Journal of Ecological Engineering 2020, 21, 102–115. [Google Scholar] [CrossRef]
  46. Bakar, N.A.; Othman, N.; Yunus, Z.M.; Altowayti, W.A.H. An insight review of lignocellulosic materials as activated carbon precursor for textile wastewater treatment. Environ. Technol. Innov. 2021, 22, 101445. [Google Scholar] [CrossRef]
  47. Mulla, B.A.; Belgin, G.; Özgür, S.; Kalderis, D. Evaluation of sewage sludge biochar and modified derivatives as novel SPE adsorbents for monitoring of bisphenol A. Chemosphere 2021, 268, 128866. [Google Scholar]
  48. Cansado, I.P.; Mourão, P.A. Impact of the use of co-adjuvants agents during chemical activation on the performance of activated carbons in the removal of 4-chloro-2-methyl-phenoxyacetic acid. Environ. Technol. Innov. 2021, 24, 102058. [Google Scholar] [CrossRef]
  49. Hua, H.; Jingchun, T.; Kai, G.; Ruozhu, H.; Hang, Z.; Werner, D. Characterization of KOH modified biochars from different pyrolysis temperatures and enhanced adsorption of antibiotics. RSC Adv. 2017, 7, 14640–14648. [Google Scholar]
  50. Franco, D.S.; Georgin, J.; Netto, M.S.; Allasia, D.; Oliveira, M.L.; Foletto, E.L.; Dotto, G.L. Highly effective adsorption of synthetic phenol effluent by a novel activated carbon prepared from fruit wastes of the Ceiba speciosa forest species. J. Environ. Chem. Eng. 2021, 9, 105927. [Google Scholar] [CrossRef]
  51. Wang, H.; Li, Z.; Yahyaoui, S.; Hanafy, H.; Seliem, M.K.; Bonilla-Petriciolet, A.; Dotto, G.; Sellaoui, L.; Li, Q. Effective adsorption of dyes on an activated carbon prepared from carboxymethyl cellulose: Experiments, characterization and advanced modelling. Chem. Eng. J. 2021, 417, 128116. [Google Scholar] [CrossRef]
  52. Oke, N.; Mohan, S. Development of nanoporous textile sludge based adsorbent for the dye removal from industrial textile effluent. J. Hazard. Mater. 2021, 422, 126864. [Google Scholar] [CrossRef]
  53. Peng, X.; Hu, F.; Zhang, T.; Qiu, F.; Dai, H. Amine-functionalized magnetic bamboo-based activated carbon adsorptive removal of ciprofloxacin and norfloxacin: A batch and fixed-bed column study. Bioresour. Technol. 2017, 249, 924–934. [Google Scholar] [CrossRef] [PubMed]
  54. Mery, M.; Ornella, A.; Agnese, G.; Maurizio, A.; Mentasti, E. Adsorption of heavy metals on vermiculite: Influence of pH and organic ligands. J. Colloid Interface Sci. 2006, 299, 537–546. [Google Scholar]
  55. Kulkarni, S.J.; Tapre, R.W.; Patil, S.V.; Sawarkar, M.B. Adsorption of phenol from wastewater in fluidized bed using coconut shell activated carbon. Procedia Eng. 2013, 51, 300–307. [Google Scholar] [CrossRef] [Green Version]
  56. Kurniawati, S.; Indriyanti, N.Y. Adsorption of Anionic and Cationic Dyes in Batik Wastewater Using Biomass Adsorbents: Literature Review. JKPK (Jurnal Kimia dan Pendidikan Kimia) 2021, 6, 274–291. [Google Scholar]
  57. Aris, M.; Hanny, V.; Nur, Z.; Agus, P.; Wicaksono, K.A. Performance of bioequalization-electrocatalytic integrated method for pollutants removal of hand-drawn batik wastewater. J. Water Process Eng. 2018, 21, 77–83. [Google Scholar]
  58. Topare, N.S.; Bokil, S.A. Adsorption of textile industry effluent in a fixed bed column using activated carbon prepared from agro-waste materials. Mater. Today Proc. 2021, 43, 530–534. [Google Scholar] [CrossRef]
  59. Demarchia, C.A.; Debrassia, A.; Magrob, J.D.; Nedelkoc, N.; Ślawska-Waniewskac, A.; Dłużewskic, P.; Greneched, J.M.; Rodriguesa, C.A. Adsorption of Cr (VI) on crosslinked chitosan–Fe (III) complex in fixed-bed systems. J. Water Process Eng. 2015, 7, 141–152. [Google Scholar] [CrossRef]
  60. Ali, M.A.; Mubarak, M.F.; Keshawy, M.; Zayed, M.A.; Ataalla, M. Adsorption of Tartrazine anionic dye by novel fixed bed Core-Shell- polystyrene Divinylbenzene/Magnetite nanocomposite. Alex. Eng. J. 2021, 61, 1335–1352. [Google Scholar] [CrossRef]
  61. Jafari, M.; Rahimi, M.R.; Asfaram, A.; Ghaedi, M.; Javadian, H. Experimental design for the optimization of paraquat removal from aqueous media using a fixed-bed column packed with Pinus Eldarica stalks activated carbon. Chemosphere 2021, 291, 132670. [Google Scholar] [CrossRef]
  62. Al-Zawahreh, K.; Barral, M.T.; Al-Degs, Y.; Paradelo, R. Competitive removal of textile dyes from solution by pine bark-compost in batch and fixed bed column experiments. Environ. Technol. Innov. 2022, 27, 102421. [Google Scholar] [CrossRef]
  63. Samir, C.; Rahul, Y.; Prasanta, D.; Maiti, S. Fixed-bed adsorption of Reactive Orange 84 dye onto activated carbon prepared from empty cotton flower agro-waste. Sustain. Environ. Res. 2018, 28, 298–308. [Google Scholar]
  64. Alardhi, S.M.; Albayati, T.M.; Alrubaye, J.M. Adsorption of the methyl green dye pollutant from aqueous solution using mesoporous materials MCM-41 in a fixed-bed column. Heliyon 2020, 6, e03253. [Google Scholar] [CrossRef] [PubMed] [Green Version]
  65. Chen, S.; Yue, Q.; Gao, B.; Li, Q.; Xu, X.; Fu, K. Adsorption of hexavalent chromium from aqueous solution by modified corn stalk: A fixed-bed column study. Bioresour. Technol. 2012, 113, 114–120. [Google Scholar] [CrossRef] [PubMed]
  66. Naushad, M.; Alqadami, A.A.; Al-Kahtani, A.A.; Ahamad, T.; Awual, R.; Tatarchuk, T. Adsorption of textile dye using para-aminobenzoic acid modified activated carbon: Kinetic and equilibrium studies. J. Mol. Liq. 2019, 296, 112075. [Google Scholar] [CrossRef]
  67. Birgani, P.M.; Ranjbar, N.; Abdullah, R.C.; Wong, K.T.; Lee, G.; Ibrahim, S.; Park, C.; Yoon, Y.; Jang, M. An efficient and economical treatment for batik textile wastewater containing high levels of silicate and organic pollutants using a sequential process of acidification, magnesium oxide, and palm shell-based activated carbon application. J. Environ. Manag. 2016, 184, 229–239. [Google Scholar] [CrossRef] [PubMed]
  68. Daud, N.M.; Abdullah, S.R.S.; Hasan, H.A.; Dhokikah, Y. Integrated physical-biological treatment system for batik industry wastewater: A review on process selection. Sci. Total Environ. 2022, 819, 152931. [Google Scholar] [CrossRef]
  69. Hassan, M.M.; Carr, C.M. A critical review on recent advancements of the removal of reactive dyes from dyehouse effluent by ion-exchange adsorbents. Chemosphere 2018, 209, 201–219. [Google Scholar] [CrossRef]
  70. Al-Mahbashi, N.; Kutty, S.; Jagaba, A.; Al-Nini, A.; Ali, M.; Saeed, A.; Ghaleb, A.; Rathnayake, U. Column Study for Adsorption of Copper and Cadmium Using Activated Carbon Derived from Sewage Sludge. Adv. Civ. Eng. 2022, 2022, 1–11. [Google Scholar] [CrossRef]
  71. Baral, S.; Das, N.; Ramulu, T.; Sahoo, S.; Das, S.; Chaudhury, G.R. Removal of Cr(VI) by thermally activated weed Salvinia cucullata in a fixed-bed column. J. Hazard. Mater. 2009, 161, 1427–1435. [Google Scholar] [CrossRef]
  72. Fallah, N.; Taghizadeh, M. Continuous fixed-bed adsorption of Mo(VI) from aqueous solutions by Mo(VI)-IIP: Breakthrough curves analysis and mathematical modeling. J. Environ. Chem. Eng. 2020, 8, 104079. [Google Scholar] [CrossRef]
  73. Chatterjee, S.; Mondal, S.; De, S. Design and scaling up of fixed bed adsorption columns for lead removal by treated laterite. J. Clean. Prod. 2017, 177, 760–774. [Google Scholar] [CrossRef]
  74. Nazari, G.; Abolghasemi, H.; Esmaieli, M.; Pouya, E.S. Aqueous phase adsorption of cephalexin by walnut shell-based activated carbon: A fixed-bed column study. Appl. Surf. Sci. 2016, 375, 144–153. [Google Scholar] [CrossRef]
  75. Gao, Q.; Liu, H.; Cheng, C.; Li, K.; Zhang, J.; Zhang, C.; Li, Y. Preparation and characterization of activated carbon from wool waste and the comparison of muffle furnace and microwave heating methods. Powder Technol. 2013, 249, 234–240. [Google Scholar] [CrossRef]
  76. Nithya, K.; Sathish, A.; Kumar, P.S. Packed bed column optimization and modeling studies for removal of chromium ions using chemically modified Lantana camara adsorbent. Process Saf. Environ. Protect. 2020, 33, 101069. [Google Scholar] [CrossRef]
  77. Radhika, R.; Jayalatha, T.; Jacob, S.; Rajeev, R.; George, B.K. Adsorption performance of packed bed column for the removal of perchlorate using modified activated carbon. Process Saf. Environ. Prot. 2018, 117, 350–362. [Google Scholar]
Figure 1. Nitrogen adsorption–desorption isotherm of SSB.
Sustainability 14 06484 g001
Figure 2. Morphology on raw sludge surface.
Sustainability 14 06484 g002
Figure 3. Morphology of SSB at different magnifications.
Sustainability 14 06484 g003
Figure 4. SEM-EDX analysis spectrum.
Sustainability 14 06484 g004
Figure 5. Fourier-transform infrared spectroscopy (FTIR) spectra for SSB and raw sewage sludge.
Sustainability 14 06484 g005
Figure 6. Effect of varying flowrate at a depth of 12 cm.
Sustainability 14 06484 g006
Figure 7. Effect of bed depth at a flow rate of 36 mL/h.
Sustainability 14 06484 g007
Figure 8. Removal mechanism of dyes onto SSB.
Sustainability 14 06484 g008
Figure 9. Bohart–Adams plot for the effect of different bed depths, (a) at a flow rate of 70 mL/h, (b) at a flow rate of 36 mL/h, and (c) at aflow rate of 16 mL/h.
Sustainability 14 06484 g009aSustainability 14 06484 g009b
Figure 10. Thomas plot for the effect of different bed depths, (A) at a flow rate of 70 mL/h, (B) at a flow rate of 36 mL/h, and (C) at a flow rate of 16 mL/h.
Sustainability 14 06484 g010
Table 1. Characterization of raw batik-industry effluent BIE wastewater.
ParametersUnitValue
pH-9
CODmg/L115
ColorPt-Co234
Table 2. BET surface area and porosity distribution of SSB.
BET ResultUnitSSBBCSLN2 [36]BCSLCO2 [36]TSB [37]
BET surface aream2/g117.667689.283.591
Surface area of Microporem2/g16.0873---
Volume of Microporecm3/g0.0069670.0240.02060.2769
BJH Adsorption average pore diameternm6.009336.195.86-
Table 3. EDX results of raw sewage sludge and SSB.
SampleWeightage of Elements (%)
COFeSiAlCaPK
Raw sewage sludge53.334.54.94.12.60.5--
SSB1740.412.812.810.52.03.60.8
Table 4. Volume of daily effluent corresponds to different flow rates.
Flow Rate (mL/h)Volume of Effluent
(mL/Day)(L/Day)
7016801.68
368640.864
163840.384
Table 5. Breakthrough curves parameters.
Flow Rate mL/hBed Depth (cm)Breakthrough Point (min)Exhausting Point (min)Mass Transfer Zone (MTZ) (cm)Adsorption Capacity (mg/g)
7053511004.8414.54
85012207.6719.45
1275126011.2927.44
3656013204.7719.33
811022207.6026.10
12175234011.1029.53
16512533604.8120.23
823035407.4829.32
12310396011.0642.30
Table 6. Parameters of the Bohart–Adams model.
Flow Rate mL/h Z   cm k A B   mL / ( mg · min · cm · 10 4 ) N 0   mg / L R 2 Fitted Equation
7052.828938.780.9287 y   = 0.2713   x   2.3063
82.385818.950.927 y   = 0.1851   x   2.6432
122.274193.160.9167 y   = 0.2179   x   3.7589
3651.615108.010.9871 y   = 0.1549   x   2.6582
81.143333.680.9615 y   = 0.1096   x   3.2356
120.962676.190.953 y   = 0.0919   x   3.7051
1652.2811340.99 y   = 1.0325   x   7.2861
82.33925.590.97 y   = 0.154   x   2.7405
122.4705.940.94 y   = 0.3101   x   5.0607
Table 7. Parameters of the Thomas model.
Flow Rate (mL/h)Z (cm) k T H   ( mL / min · mg )   ×   10 4 q 0   ( mg / g )   ×   10 4 R 2 Fitted Equation
7051.141.20.99y = −0.1092x + 0.9765
81.250.930.96y = −0.0749x + 0.9845
121.810.870.98y = −0.1739x + 2.3439
3650.711.250.9y = −0.1199x + 1.5615
81.051.060.95y = −0.1008x + 2.4854
121.060.620.98y = −0.1015x + 2.6268
1651.011.090.92y = −0.1193x + 1.5221
81.050.760.94y = −0.1334x + 2.0116
121.10.520.90y = −0.2427x + 3.2833
Publisher’s Note: MDPI stays neutral with regard to jurisdictional claims in published maps and institutional affiliations.

