Abstract
The conventional reservoir operation strategy considering hydropower production ignores the ecology of the downstream rivers and causes a series of environmental problems. To ensure the sustainable development of a reservoir, the operation strategy should consider both the economic benefits of the power station and the ecological benefits in downstream rivers, the key to which is to select suitable parameters for quantifying the ecological objectives of the rivers and incorporate them into the reservoir operation model. To this end, the ecological index (EI) based on the Indicators of Hydrological Alteration (IHA) was developed to reflect the ecology of the downstream rivers, and a reservoir ecological operation model that takes into account the power generation capacity of the power station and the degree of hydrological alteration was constructed, which can be solved using the Non-Dominated Sorting Genetic Algorithm II (NSGA-II). The results show that the mean EI values increase a lot, from 0.24 to 0.62, after the construction of reservoir, and the optimal reservoir operation strategy in each typical year can reduce the hydrological alteration significantly (the reduction rates of both the abundant and dry water years exceed 20%), while ensuring the hydropower production of the power station (the reduction rates of hydropower production are just 1.64%, 3.15%, and 3.16% for abundant, normal, and dry water years, respectively), which provides a good reference for restoring the natural hydrological situation of downstream rivers.
1. Introduction
A large number of reservoir projects have resulted in the spatial and temporal redistribution of water resources, thereby greatly improving the efficiency of water resource utilization. Reservoirs play an important role in promoting socioeconomic development [1]. However, the construction of dams blocks the exchange of materials, energy, and information between the upstream and downstream rivers, changing the natural hydrological conditions of the rivers and damaging the long-term hydrological-ecological responses of the river system, thus triggering ecosystem stress and causing a series of environmental problems [2,3]. Conventional reservoir operation models consider socioeconomic benefits and ignore the ecological benefits of downstream rivers, resulting in more prominent river ecological problems. In order to ensure the basic ecological functions of rivers, it is necessary to consider the ecological benefit objectives of rivers in the process of reservoir scheme design and operation, to alleviate the ecological pressure on rivers caused by reservoir construction and operation, and to maintain the biodiversity characteristics of the rivers through a reasonable operation plan.
Reservoir operation considering downstream ecology aims to achieve a balance between economic and ecological benefits through water scheduling. Specially, this balance means increasing the downstream flow to replenish water when the downstream ecology is poor, and focusing on power generation benefits when the downstream ecology is good. The key of constructing reservoir ecological operation model lies in determining how to incorporate the ecological elements into the current reservoir operation model, which can be divided into two main categories according to the different ways they consider ecological elements [4]. The first type calculates the ecological flow of the river downstream and uses it as a constraint of the operation model [5,6] in order to ensure that the reservoir operation meets the basic ecological needs of the river. With the improvement and supplementation of ecological flow calculation methods, such as hydrological methods, hydraulics methods, and habitat simulation methods, this type of model has been more fully studied. The second type quantifies the ecological elements of rivers and uses them, along with the economic efficiency objectives of the reservoirs, as the objective function of the operation model [7,8]. Compared with the first type of model, the second type of model considers both the economic and ecological benefits of reservoirs. Therefore, it can reflect the ecological conditions of the different operation schemes and is more meaningful in guiding the ecological operation of reservoirs.
Numerous scholars have conducted relevant studies regarding the quantification of the ecological elements. These scholars have proposed that the calculated minimum ecological flow could be used to define the degree of ecological protection [9] or that the distance between the discharge flow and the flow range could be used to assess the impact on ecology. These ecological objectives can guide the ecological operation of reservoirs to a certain extent, but they still lack clear ecological significance, leading to insufficient rationality of the calculation results [10].
As ecological demands are considered in reservoir operation models, making traditional operation models more complex, some scholars have carried out research on solving multi-constraint and multi-objective reservoir operation models, and have also proposed different solution algorithms for different solution purposes. The algorithms can be divided into two categories of actuarial algorithms and approximate algorithms [11]. The actuarial algorithms can find the absolute optimal solution, but the running time of the algorithm increases exponentially in complex optimization problems, while the approximate algorithms can find optimal solutions that are close to the actuarial optimum and have shorter running times [12]. In recent years, many hybrid algorithms combining high precision and the high convergence rate have been proposed to solve the complex reservoir operation model [11,12,13].
The hydrological situation of a river reflects the changes of hydrological features, which in turn are closely related to the river ecosystem and determine not only the life patterns of aquatic organisms, but also affect abiotic factors such as water quality, substrate, and geomorphology. It has been well proved that hydrological parameters are the main drivers of river ecology and play an important role in maintaining the structure and function of river ecosystems. Thus, the use of hydrological elements to construct river ecological objectives is an effective way to reflect the ecological needs of rivers [14,15]. The Indicators of Hydrological Alteration (IHA) is a group of five hydrological variables corresponding to different functions [16]. These indicators characterize the hydrological information in a comprehensive, scientific, simple, and easy-to-use manner, and they have clear ecological significance and a good response relationship to ecology. Most of the current studies on the IHA have focused on responding to river ecological conditions by studying changes in the hydrological conditions [17,18,19], and relatively few studies have been conducted on how to use the IHA to quantify ecological objectives and incorporate them into reservoir operation.
To this end, in this study, the ecological index (EI) was defined based on the IHA and incorporated into the reservoir operation model. A multi-objective reservoir operation model was constructed, including the EI of downstream river and the Hydropower Production (HP) of the power plant, and solved using the Non-Dominated Sorting Genetic Algorithm II (NSGA-II) to search for the scheduling scheme that takes into account the economic benefits of the hydropower plant and the ecological benefits of the downstream river. The organization structure diagram of this paper is as shown in Figure 1. The two main contributions of this paper are as follows: (1) it provides a way of defining the ecological objective with hydrological parameters in IHA and can be applied to most reservoirs with few ecological data; (2) it constructs a reservoir operation model to search for operation strategy considering the ecological benefits of a downstream river and guide practice reservoir operations.

Figure 1.
The organization structure diagram of this paper.
2. Methods
2.1. Quantification of River Ecological Objectives
Quantifying river ecological objectives is the basis for reservoir ecological operation. Since river ecosystems involve many elements, it is difficult to accurately quantify ecological demands, but hydrological elements are important drivers of river systems, so the ecological objectives of rivers can be quantified based on the hydrological elements. The key to this lies in the following two points: (1) choosing hydrological parameters that are suitable and reflect the ecological demands of rivers, and (2) adopting scientific methods to quantify the ecological objectives based on the chosen parameters.
To address the above two problems, the hydrological parameters selected in the study were derived from the IHA. In addition, considering the strong correlations between the parameters in IHA, in order to reduce the complexity of the model, fewer parameters containing as much original information as possible were selected to quantify the ecological needs of the river, and a river ecological index reflecting the ecological status of the river was defined by the main parameters selecting with principal component analysis and by assigning the weights based on the contribution of each principal component.
2.2. Indicators of Hydrological Alteration
The Indicators of Hydrological Alteration (IHA) divides all of 33 hydrological parameters into five major groups: the monthly mean flow, annual extreme flow, time of occurrence of the annual extreme flow, high and low flow and frequency, and the rate and frequency of the flow change. Each group of hydrological parameters has a different ecological significance. The first group (monthly mean flow) reflects the requirements of the organisms related to the habitat, soil moisture, and water temperature. The second group (annual extreme flow) reflects the relationship between the shaping of the river’s morphology and the material–energy exchange. The third group (time of extreme flow occurring) represents the temporal characteristics of the river ecology and provides signals for biological migration and spawning. The fourth group (high and low flow frequencies with time) can maintain the basic form of the river and ensure a certain scale of riverine organisms. The fifth group (rate and frequency of flow changes) reflects the pressure imposed by the changing flow conditions on the organisms and the environment, which excludes alien species and protects the original native species. The specific parameters are presented in Table 1.

Table 1.
The five groups of the IHA parameters.
The quantification of the 33 parameters mentioned above is described in [8]. It is important to note that, since the study area does not have days of disconnection (the 24th parameter) in natural flow, the occurrence of days of disconnection could have a significant impact on the river’s ecology. In order to avoid downstream flow breakage during reservoir operation and to reduce the parameter redundancy in the process of quantifying ecological objectives to some extent, a minimum flow constraint was set to avoid downstream flow breakage, and the remaining 32 parameters were used to quantify the ecological objectives.
2.3. Ecological Index
Since runoff has the characteristic of continuity, many of the parameters in the IHA system have strong correlations, and thus, the original index system needs to be simplified. For an index system with strong correlations among variables, principal component analysis is an effective method of dimensionality reducing the processing, and it can filter out the main components from many variables, and thus achieve simplification of the original data structure [20,21]. In this study, principal component analysis was used to select the main parameters from the above-mentioned 32 parameters (excluding the 24th parameter of days of disconnection), and the ecological index (EI) of the river was defined to reflect the ecological conditions of the river using the degree of change of the preferred parameters.
where is the flow series, from which the 32 parameters in the IHA can be calculated; is the degree of change of the th parameter selected by the principal component analysis; is the river ecological index corresponding to the flow series ; is the value of the th parameter of the flow series; is the total number of the selected parameters; and is the weight of the th parameter. This considers the fact that each principal component characterizes the original data information through the contribution degree, and the greater the contribution degree is, the more important to the original data information it is. Thus, it is necessary to give it a greater weight, so the weight of the preferred parameters can be determined according to the contribution degree of their corresponding principal components.
The natural hydrological conditions of rivers play an important role in maintaining the structural stability and functional integrity of river ecosystems, and the restoration of the natural hydrological conditions of rivers is often the goal in river ecological scheduling [22,23]. As the hydrological conditions change, which in turn affects the river ecosystem, the river ecological index reflects the river’s ecological condition through the alteration of the parameters. The larger the value of the ecological index, the greater the alteration of the parameter is, and the more unfavorable it is for the river ecology.
2.4. Ecological Operation Model
Reservoir ecological operation needs to take into account the economic benefits of the power station, as well as the ecological benefits of the downstream rivers. For this reason, in this study, the hydropower production (HP) of the power station and the river ecological index (EI) were taken as the objectives of the reservoir operation model, and the minimum flow constraint was added to the constraints of the conventional reservoir operation model to ensure the constant flow of the downstream rivers. The model’s objectives and constraints are as follows.
2.5. Objectives
- (1)
- Ecological objective
According to the above analysis, the river ecological index quantifies the impact on the river ecology through the alteration of the hydrological conditions. The smaller its value, the more beneficial to the ecology, so the ecological objective of the reservoir operation is as follows.
where is the series of the discharge flow, including the generation flow and the abandoned flow .
- (2)
- Economic objective
Hydropower production is an important economic goal of the power, and thus, the reservoir operation should ensure the economic benefits of the station as much as possible. In this study, the HP was taken as the economic goal and was calculated as follows:
where is the output coefficient of the hydropower station, and and are the generation flow and generation head of the th period, respectively.
2.6. Constraints
The constraints used in the model are consistent with the conventional reservoir operation model, including the water balance constraint, reservoir capacity constraint, maximum discharge flow constraint, and power station output constraint. In addition, in order to avoid the appearance of days of disconnection, a minimum discharge flow constraint was added.
- (1)
- Water balance constraints:where and are the initial and final volumes during the reservoir period, respectively; and and are the inflow and outflow during the reservoir period, respectively.
- (2)
- Reservoir capacity constraint:where and are the minimum and maximum reservoir capacity of the reservoir at period , respectively.
- (3)
- Outflow constraint:where is the maximum outflow during period ; and is the minimum ecological flow, corresponding to a frequency of 10% on the flow ephemeris curve to avoid the appearance of days of disconnection.
- (4)
- Capacity constraint:where and are the guaranteed output and maximum output of the hydropower station, respectively.
2.7. Solving the Model
The reservoir ecological operation problem is characterized by high nonlinearity, a complex objective function, and many constraints. The traditional multi-objective optimization algorithm suffers from a low operational efficiency and difficulty in convergence when solving this model, but the NSGA-II adopts non-inferior solution fast sorting, congestion distance calculation, and elite retention strategy, which can improve the computational speed and maintain a better distribution of solution sets in solving multi-objective problems and has been widely used to solve multi-objective optimization problems. To this end, in this study, the NSGA-II [24] was used to solve the reservoir ecological operation model. The specific process is shown in Figure 2.
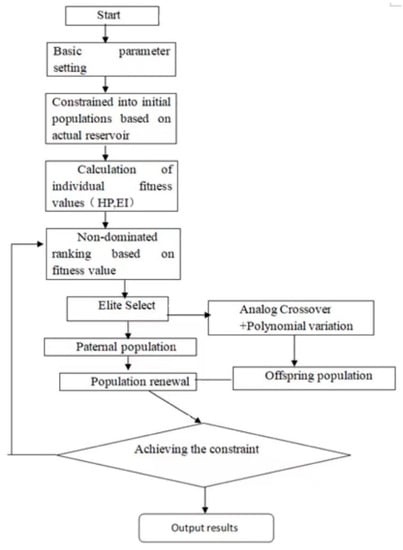
Figure 2.
NSGA-II-based reservoir ecological scheduling model solution.
3. Results and Discussions
In this study, a reservoir in Hunan Province was taken as an example. Above the dam site, the mainstream is 21 km long, the controlled rain catchment area is 53.63 km2, the average multi-year flow is 1.51 m3/s, the normal storage level is 1180 m, the dead water level is 1146 m, and the total reservoir capacity is 33.652 million m3. The power station adopts the high head diversion development method. The construction started in October 1984, and the water was stored for power generation in 1987. Expansion and renovation were carried out in 2014, and the renovation guarantees a power output of 7.5 MW, with a total installed capacity of 18.9 MW. It is a medium-sized water conservancy pivot project with power generation as the main purpose, and irrigation and flood control as the benefits. The power station has been in operation for many years, and the benefits of flood control and power generation have been remarkable, but the operation mode was mainly designed for power generation and has changed the hydrological conditions of the downstream rivers, seriously damaging the ecology of the rivers. Therefore, there is an urgent need to study the ecological operation method of the reservoir to promote ecological restoration of the downstream rivers.
3.1. Analysis of the Hydrological Situation before and after the Construction of the Reservoir
Since the reservoir construction began in 1984, the daily runoff information collected from 1962 to 1981, a total of 20 years, was used as the natural runoff series, and the power station outflow after the construction of the reservoir (from 1999 to 2018, i.e., a total of 20 years) was used as the altered runoff series. First, based on the IHA index system, the relevant information about each parameter was compiled, and the hydrological variability of each parameter after the reservoir construction was calculated with reference to the range of variation (RVA) method proposed by Richter. The results are shown in Table 2.
Table 2.
IHA index calculation results.
As can be seen from Table 2, the hydrological parameters were significantly different before and after the construction of the reservoir. Under the natural conditions, the downstream rivers did not appear with days of disconnection, but after the construction of the reservoir, in order to raise the water level for power generation, there were long periods of disconnection, up to 176 days. It can be seen that the variability of each parameter in the IHA changed significantly after the construction of the reservoir. The variabilities of 24 of the 33 parameters exceeded 60%, among which 13 had variabilities of 100%. Only three parameters (mean flow in March (IHA3), mean flow in August (IHA8), and number of flow reversals (IHA33)) had variabilities of less than 30%.
3.2. Calculation Results of EI
In order to characterize the ecological changes in the downstream rivers before and after the construction of the reservoir by representative parameters, the main parameters were selected using principal component analysis from 32 parameters in IHA based on the flow series before the construction of reservoir, and the results are shown in Table 3.
Table 3.
Main parameters of the preferred method of principal component analysis.
As can be seen from Table 3, the cumulative contribution of the first six principal components to the hydrological situation reached 85.33%, satisfying the requirement of a cumulative contribution of greater than 85%. The parameter with the highest factor loading in each principal component was used to characterize the component, and the six parameters of minimum 7-day flow, mean flow in July, mean flow in March, number of flow reversals, low pulse count, and minimum 1-day flow were finally preferred. The weights of the preferred parameters were determined according to the contribution of each principal component, and the initial contribution was corrected in order to satisfy the condition that the sum of the weights of each parameter is 1. The weights of the six parameters were finally determined to be 0.344, 0.216, 0.125, 0.111, 0.104, and 0.100, respectively. The parameter of minimum 7-day flow had the highest weight, indicating that this parameter has the greatest influence on the degree of hydrological change.
The river ecological index (EI) for each year before and after the construction of the reservoir was calculated according to Equations (1) and (2), and the results are shown in Table 4.
Table 4.
Calculated ecological index (EI) of rivers downstream of reservoirs before and after reservoir construction.
The number of exceedance parameters in the table refers to the number of the 32 parameters in the IHA that were not within the upper and lower limits of the RVA (between frequencies of 25% and 75%). The higher the number is, the higher the degree of variability of the hydrology is, and the more unfavorable to the river ecology. It can be seen that the maximum number of exceedance parameters before the construction of the reservoir was 23, the number was mostly around 20, and the minimum number was 9 in 1981. However, the number of exceedance parameters increased significantly after the construction, and all exceeding 25, with the lowest occurring in 2005 at 25 and the highest in 2018 at 31. In addition, the calculated EI values also increased significantly. The EI values before the construction basically remained below 0.5 and only exceeded 0.5 in 1965, the values all exceeded 0.5 after the construction, and the mean value increased from 0.24 to 0.62. These results indicate that the hydrological conditions of the downstream rivers have changed significantly due to the construction and operation of the reservoir, which is consistent with the above RVA calculation results.
To further demonstrate the effectiveness of the EI in characterizing the ecological condition of the river, in this study, the EI was compared with a diversity index, i.e., the Shannon index (SI), and the comparison of results are shown in Figure 3.
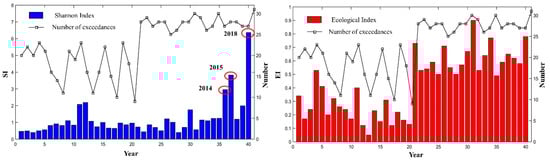
Figure 3.
Changes in Shannon index (SI) and river ecological index (EI) before and after reservoir construction.
The SI is a regression equation between the ecological objectives and hydrological variables and was established by using the IHA indicator system as the hydrological variable and by identifying the quantitative relationships between the hydrological factors and the ecological objectives through genetic programming methods [25]. It can be used to assess the state of a river’s ecosystem and is calculated as follows.
where is the annual minimum flow time; , , and are the minimum 1-day flow (IHA13), minimum 3-day flow (IHA15), and minimum 7-day flow (IHA17), respectively; is the maximum 7-day flow (IHA18); and are the mean flows in March (IHA3) and May (IHA5), respectively; and is the average rate of increase in traffic (IHA31).
It can be seen from Figure 3 that the difference between the SI values before and after the reservoir construction is not significant, and only the values in 2014, 2015, and 2018 were larger. This is due to the change from low to high flow under the regulation of the reservoir, which caused a significant increase in the rate of increase of the flow, thus leading to a larger SI. The number of exceedances can be used to qualitatively analyze the changes in the hydrological parameters, and the higher the number is, the greater the degree of hydrological alteration is. The number of exceedance parameters was significantly higher after the construction of the reservoir than before, indicating that the hydrological parameters changed significantly before and after the construction of the reservoir, and the calculated SI did not reflect this characteristic, while the EI differed significantly before and after the construction of the reservoir, as it was lower before and significantly higher after the construction of the reservoir, which is consistent with the changes in the hydrological parameters of the river, indicating that the defined EI is reliable for characterizing the ecological status of a river.
3.3. Construction and Solution of Reservoir Ecological Operation Model
In the study, a reservoir ecological operation model was constructed with the hydropower production (HP) and the ecological index (EI) as the economic and ecological benefit objectives, respectively. Typical years were selected for analysis in years with abundant water (2017), normal water (2006), and dry water (2007). The NSGA-II was used to solve the reservoir ecological operation model using the following parameter settings: a population size of 200, global iteration number of 200, crossover probability of 0.9, and variance probability of 0.1. The non-inferiority solution sets for each typical year are shown in Figure 4. From left to right, the sets of reservoir ecological operation strategies are for the abundant water, normal water, and dry water years.
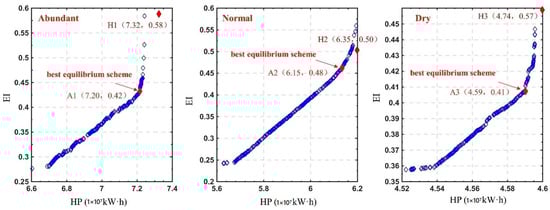
Figure 4.
Sets of reservoir ecological operation strategies in three typical years.
Figure 4 shows the positive correlation between the two objectives of HP and EI. As the HP value increases, the EI also increases, indicating that, when the economic benefits of the power plant are increased, the impact on the river ecology also gradually increases. There is a competitive relationship between the economic and ecological benefit objectives. Taking a typical year with abundant water (2017) as an example, when the HP increased from 6.60 × 10⁷ kWh to 7.24 × 10⁷ kWh, the EI increased from 0.276 to 0.584, and the impact on the river ecology increased significantly. Therefore, in order to ensure the ecological benefits of the downstream rivers, part of the power generation benefits must be sacrificed.
In addition, the two objectives of HP and EI follow the law of diminishing marginal utility. That is as the HP increases, the EI initially increases slowly, and after the HP exceeds a certain value, the EI increases rapidly. Taking the abundant water year (2017) as an example, when the HP was less than 7.20 × 10⁷ kWh, the EI increased slowly. The HP increased from 6.60 × 10⁷ kWh to 7.20 × 10⁷ kWh, and EI increased from 0.28 to 0.42; that is, a small EI increase of 0.14 resulted in a large HP increase of 0.6 × 10⁷ kWh. When the HP exceeded 7.20 × 10⁷ kWh and increased to 7.32 × 10⁷ kWh, the EI increased rapidly to 0.58; that is, the large EI increase of 0.16 only resulted in a small HP increase of 0.12 × 10⁷ kWh. Reservoir ecological operation schemes should take into account the economic benefits of the power station and the ecological benefits of the downstream rivers. Therefore, operation strategies A1 (HP: 7.20 × 10⁷ kWh, EI: 0.42), A2 (HP: 6.15 × 10⁷ kWh, EI: 0.48) and A3 (HP: 4.59 × 10⁷ kWh, EI: 0.41) were selected as the best equilibrium schemes for reservoir ecological operation in abundant, normal, and scarce water resource years, respectively (red dots in Figure 4).
In order to further verify the rationality of the selected strategies, they were compared with the historical strategies for each type of year, and the results are shown in Table 5. This paper also compares the released flow under the optimal and historical operation strategy, as shown in Figure 5. The released flow process of historical operation strategy completely changes the natural hydrological regime of the river, with the opposite phenomenon of natural flow, where there is low flow during the flood season and high flow during the dry season. However, the released flow process of the optimal operation strategy has a good similarity to the natural flow.
Table 5.
Comparison of ecological scheduling scheme and conventional scheduling scheme under each typical year. The symbol ↓ means that the parameter is reduced.

Figure 5.
Released flow process in historical and optimal operation strategy.
As can be seen from Table 5, the historical strategy overly pursues economic benefits, and the HP for each type of year is greater than that of the ecological strategy, which ignores the ecological conditions of the downstream rivers, causing significant hydrological alteration and high river ecological index. Although the HP of the ecological strategy was slightly lower (1.64%, 3.15%, and 3.16% for abundant, normal, and dry water years, respectively), the EI was significantly improved, with the reduction rates of both the abundant and dry water years exceeding 20%. In addition, by counting the number of exceeded parameters in the IHA under each strategy, it was found that the number under the ecological strategy was significantly smaller, and the number decreased by 6, 8, and 9 in the abundant, normal, and dry water years, respectively. Thus, the ecological operation strategies can retain more hydrological characteristics of the natural flow and are conducive to restoring the natural hydrological conditions of the river.
In summary, the ecological operation strategy selected for each type of year is able to reduce the degree of hydrological alteration to a large extent while ensuring that the power generation capacity of the power station is not reduced. These strategies take into account the economic benefits of the power station and the ecological benefits of the downstream rivers and are of great significance for guiding the ecological operation of the reservoir and promoting the ecological restoration of the downstream rivers.
4. Conclusions
Based on the Indicators of Hydrological Alteration, in this study, principal component analysis was used to select the main parameters, and the river ecological index (EI) was defined to reflect the ecological conditions of the rivers through parameter weighting. The EI was integrated into the model to construct a multi-objective reservoir operation model that takes into account the economic and ecological benefits of the power station, which was solved using the NSGA-II. The results of the case study demonstrate that the model and operation strategies provide a good reference for improving the downstream ecological environment of hydropower stations.
- (1)
- Compared with the Shannon index (SI), the river ecological index (EI) can be used to analyze the alteration in the hydrological conditions after reservoir construction year by year. In addition, the analysis results are consistent with those of the RVA method, indicating that the defined EI can reflect the ecological conditions of the river well.
- (2)
- Compared with the historical strategy, the ecological operation strategy under each type of year considers both the economic and ecological benefits. It retains more of the hydrological characteristics of the natural flow while ensuring a certain power generation capacity of the power station, which is conducive to restoring the natural hydrological conditions of the river.
- (3)
- This paper provides a way of defining the ecological objective with hydrological parameters in IHA, which just considers the hydrological requirements. However, the river ecosystem is influenced by multiple factors such as hydrology, bio-topography, and geology, so the analysis of other elements affecting the river ecosystem and the research revealing responsive relationships between these variable are both worthy of further study.
Author Contributions
D.H.: Conceptualization, Data curation, Investigation, and Supervision. G.L.: Methodology, Formal analysis, and Writing—original draft. X.H.: Methodology and Visualization. All authors have read and agreed to the published version of the manuscript.
Funding
This research was funded by Water resources planning institute of Xinjiang Water Resources Department through the project on ecological regulation and ecological response of kriya River Basin [2020.B-003]. This research was also funded by Xinjiang science and Technology Department through the project of Xinjiang Jinghe temperate desert ecosystem field scientific observation platform construction [PT2107].
Informed Consent Statement
Informed consent was obtained from all subjects involved in the study.
Acknowledgments
This research was jointly funded by the project: construction of a field scientific observation platform for temperate desert ecosystems in river Jing, Xinjiang (PT2107).
Conflicts of Interest
The authors declare that they have no known competing financial interests or personal relationships that could have appeared to influence the work reported in this paper.
References
- Tilmant, A.; Beevers, L.; Muyunda, B. Restoring a flow regime through the coordinated operation of a multireservoir system: The case of the Zambezi River basin. Water Resour. Res. 2010, 46, 8897. [Google Scholar] [CrossRef]
- Song, X.X.; Zhuang, Y.H.; Wang, X.L.; Li, E.H.; Zhang, Y.Y.; Lu, X.R.; Yang, J.; Liu, X. Analysis of Hydrologic Regime Changes Caused by Dams in China. J. Hydrol. Eng. 2020, 25, 05020003. [Google Scholar] [CrossRef]
- Song, X.X.; Zhuang, Y.H.; Wang, X.L.; Li, E.H.; Zhang, Y.Y.; Lu, X.R.; Yang, J.; Liu, X. Research on ecological impacts of the joint operation of cascade reservoirs in the upstream of the Yellow River. J. Hydraul. 2018, 49, 1187–1198. [Google Scholar]
- Wang, H.; Brill, E.D.; Ranjithan, R.S.; Sankarasubramanian, A. A framework for incorporating ecological releases in single reservoir operation. Adv. Water Resour. 2015, 78, 9–21. [Google Scholar] [CrossRef]
- Ye, Z.X.; Shen, Y.J.; Chen, Y.P. Multiple methods for calculating minimum ecological flux of the desiccated Lower Tarim River, Western China. Ecohydrology 2013, 6, 1040–1047. [Google Scholar] [CrossRef]
- Zhang, H.X.; Chang, J.X.; Gao, C.; Wu, H.S.; Wang, Y.M.; Lei, K.X.; Long, R.H.; Zhang, L.P. Cascade hydropower plants operation considering comprehensive ecological water demands. Energy Convers. Manag. 2019, 180, 119–133. [Google Scholar] [CrossRef]
- Tsai, W.-P.; Chang, F.-J.; Chang, L.-C.; Herricks, E.E. AI techniques for optimizing multi-objective reservoir operation upon human and riverine ecosystem demands. J. Hydrol. 2015, 530, 634–644. [Google Scholar] [CrossRef]
- Li, D.N.; Wan, W.H.; Zhao, J.S. Optimizing environmental flow operations based on explicit quantification of IHA parameters. J. Hydrol. 2018, 563, 510–522. [Google Scholar] [CrossRef]
- Fang, G.H.; Ding, Z.Y.; Huang, X.F.; Dai, L.H. Optimization of hydropower reservoir operation considering river ecological protection. J. Hydroelectr. Eng. 2018, 37, 1–9. [Google Scholar]
- Gao, C. Study on Ecological Scheduling of Reservoirs in the Lower Lancang River; Xian University of Technology: Xi’an, China, 2018. [Google Scholar]
- Mohammadi, M.; Farzin, S.; Mousavi, S.-F.; Karami, H. Investigation of a New Hybrid Optimization Algorithm Performance in the Optimal Operation of Multi-Reservoir Benchmark Systems. Water Resour. Manag. 2019, 33, 4767–4782. [Google Scholar] [CrossRef]
- Ehteram, M.; Karami, H.; Mousavi, S.F.; Farzin, S.; Kisi, O. Evaluation of contemporary evolutionary algorithms for optimi-zation in reservoir operation and water supply. J. Water Supply Res. Technol.-Aqua 2018, 67, 54–67. [Google Scholar] [CrossRef]
- Yaseen, Z.M.; Karami, H.; Ehteram, M.; Mohd, N.S.; Mousavi, S.F.; Hin, L.S.; Kisi, O.; Farzin, S.; Kim, S.; El-Shafie, A. Opti-mization of Reservoir Operation using New Hybrid Algorithm. Water Resour. Hydrol. Eng. 2018, 22, 4668–4680. [Google Scholar]
- Yan, M.; Fang, G.-H.; Dai, L.-H.; Tan, Q.-F.; Huang, X.-F. Optimizing reservoir operation considering downstream ecological demands of water quantity and fluctuation based on IHA parameters. J. Hydrol. 2021, 600, 126647. [Google Scholar] [CrossRef]
- Xu, M.Z.; Wang, Z.Y.; Pan, B.Z.; Gong, T.Z.; Liu, L. Research on assemblage characteristics of macroinvertebrates in the Yalu Tsangpo River Basin. J. Ecol. 2012, 32, 2351–2360. [Google Scholar]
- Richter, B.D.; Baumgartner, J.V.; Wigington, R.; Braun, D.P. How much water does a river need? Freshw. Biol. 1997, 37, 231–249. [Google Scholar] [CrossRef] [Green Version]
- Guo, W.X.; Li, Y.; Wang, H.X.; Zha, H.F. Assessment of Eco-hydrological Regime of Lower Reaches of Three Gorges Reservoir Based on IHA-RVA. Yangtze River Basin Resour. Environ. 2018, 27, 2014–2021. [Google Scholar]
- Zhuo, Z.Y.; Qian, Z.; Jiang, H.; Wang, H.X.; Guo, W.X. Evaluation of Hydrological Regime in Xiangjiang Basin Based on IHA-RVA Method. China Rural Water Hydropower 2020, 8, 188–192. [Google Scholar]
- Zhang, Q.; Gu, X.; Singh, V.P.; Chen, X. Evaluation of ecological instream flow using multiple ecological indicators with consideration of hydrological alterations. J. Hydrol. 2015, 529, 711–722. [Google Scholar] [CrossRef]
- Zhang, Q.; Gu, X.H.; Singh, V.P.; Chen, X.H. A development of a rating method and weighting system for green store buildings in China. Renew. Energy 2015, 73, 123–129. [Google Scholar]
- Karakoyun, Y.; Yumurtaci, Z.; Donmez, A.H. Environmental flow assessment for energy generation sustainability employing different hydraulic evaluation methods: Cambasi hydropower plant case study in Turkey. Clean Technol. Environ. Policy 2016, 18, 583–591. [Google Scholar] [CrossRef]
- Ren, K.; Huang, S.Z.; Huang, Q.; Wang, H.; Leng, G.Y.; Cheng, L.Y.; Fang, W.; Li, P. A nature-based reservoir optimization model for resolving the conflict in human water demand and riverine ecosystem protection. J. Clean. Prod. 2019, 231, 406–418. [Google Scholar] [CrossRef]
- Gao, Y.Q.; Zhou, T.; Ma, Z.Z.; Xiao, X.; Zhao, C.C. optimization of reservoir operation chart considering natural hydrological regime. Water Resour. Prot. 2020, 36, 60–67. [Google Scholar]
- Dai, L.Q.; Wang, Y.; Jiang, D.G.; Wang, M.M.; Zheng, T.G.; Dai, H.C. NSGA-II-based multi-objective ecological operation of Three Gorges Reservoir during impounding period at end of flood season. Water Resour. Hydropower Eng. 2017, 48, 122–127. [Google Scholar]
- Yang, Y.C.E.; Cai, X.; Herricks, E.E. Identification of hydrologic indicators related to fish diversity and abundance: A data mining approach for fish community analysis. Water Resour. Res. 2008, 44, W04412. [Google Scholar] [CrossRef]
Publisher’s Note: MDPI stays neutral with regard to jurisdictional claims in published maps and institutional affiliations. |
© 2022 by the authors. Licensee MDPI, Basel, Switzerland. This article is an open access article distributed under the terms and conditions of the Creative Commons Attribution (CC BY) license (https://creativecommons.org/licenses/by/4.0/).