
Neighboring Green Network and Landscape Metrics Explain Biodiversity within Small Urban Green Areas—A Case Study on Birds


Abstract
:1. Introduction
2. Methods
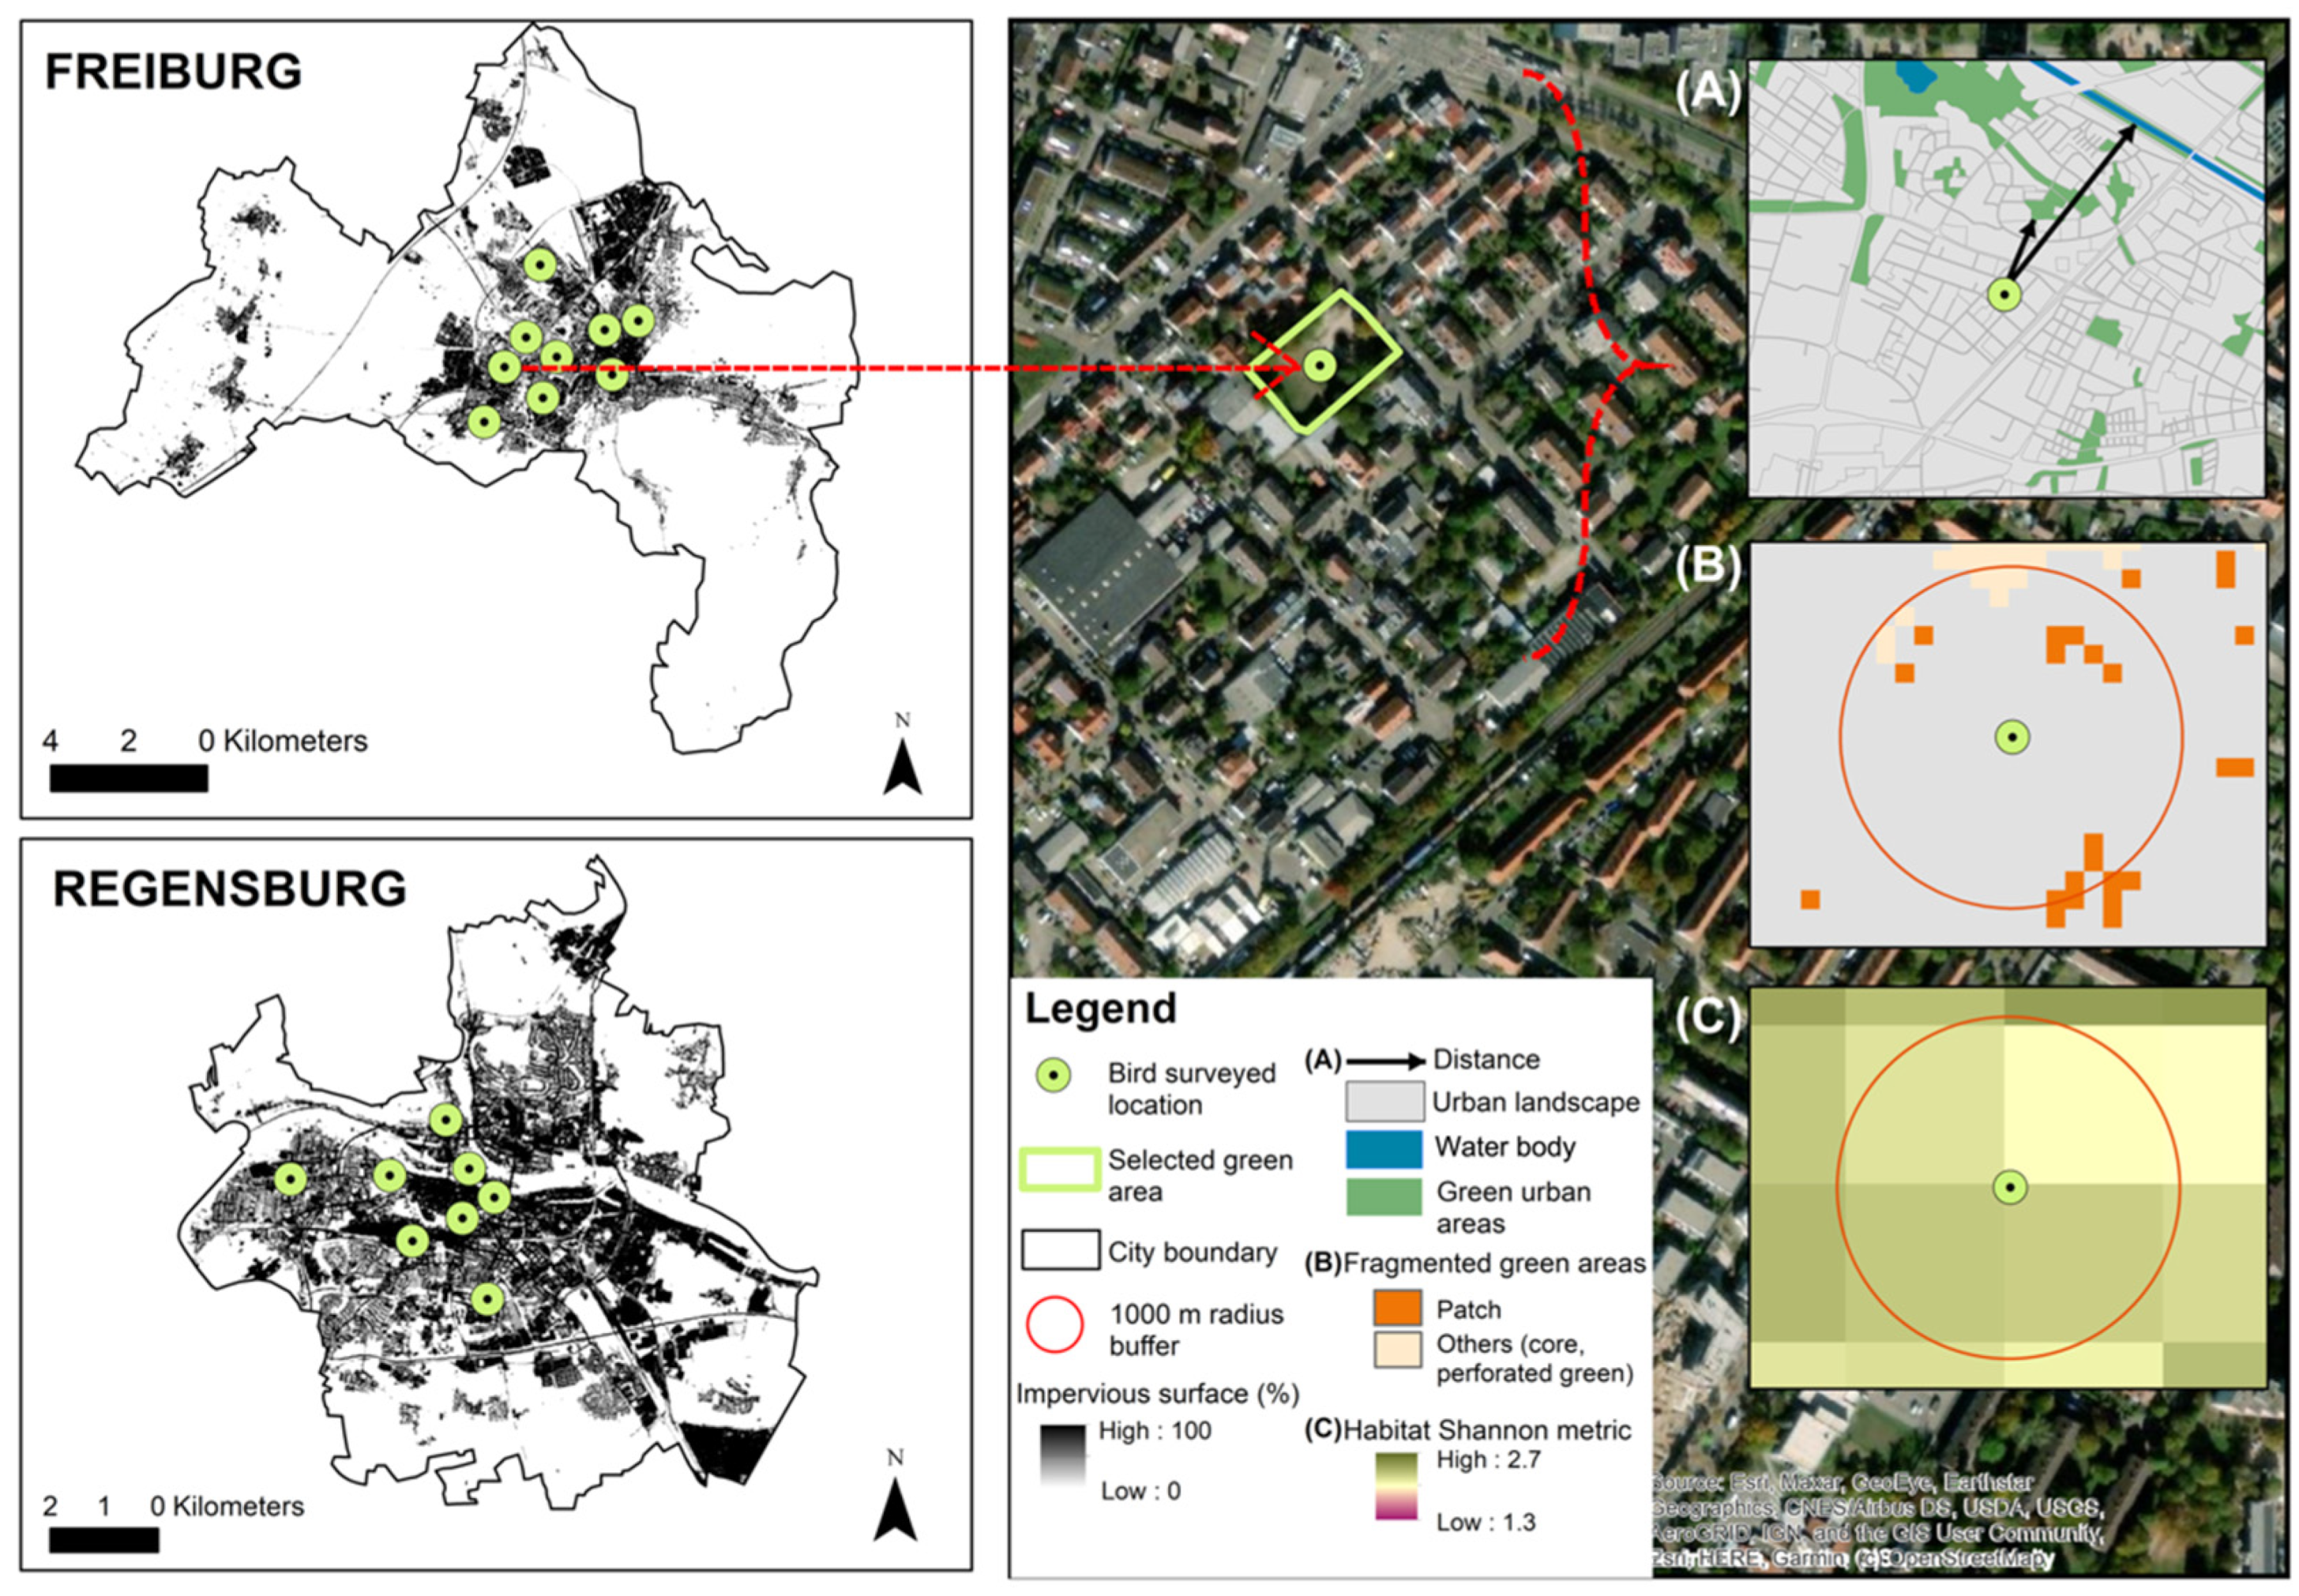
2.1. Study Sites
2.2. Bird Survey
2.3. Explanatory Variables
2.4. Analysis
2.4.1. Modelling
2.4.2. Variation Partitioning
3. Results
3.1. Modelling
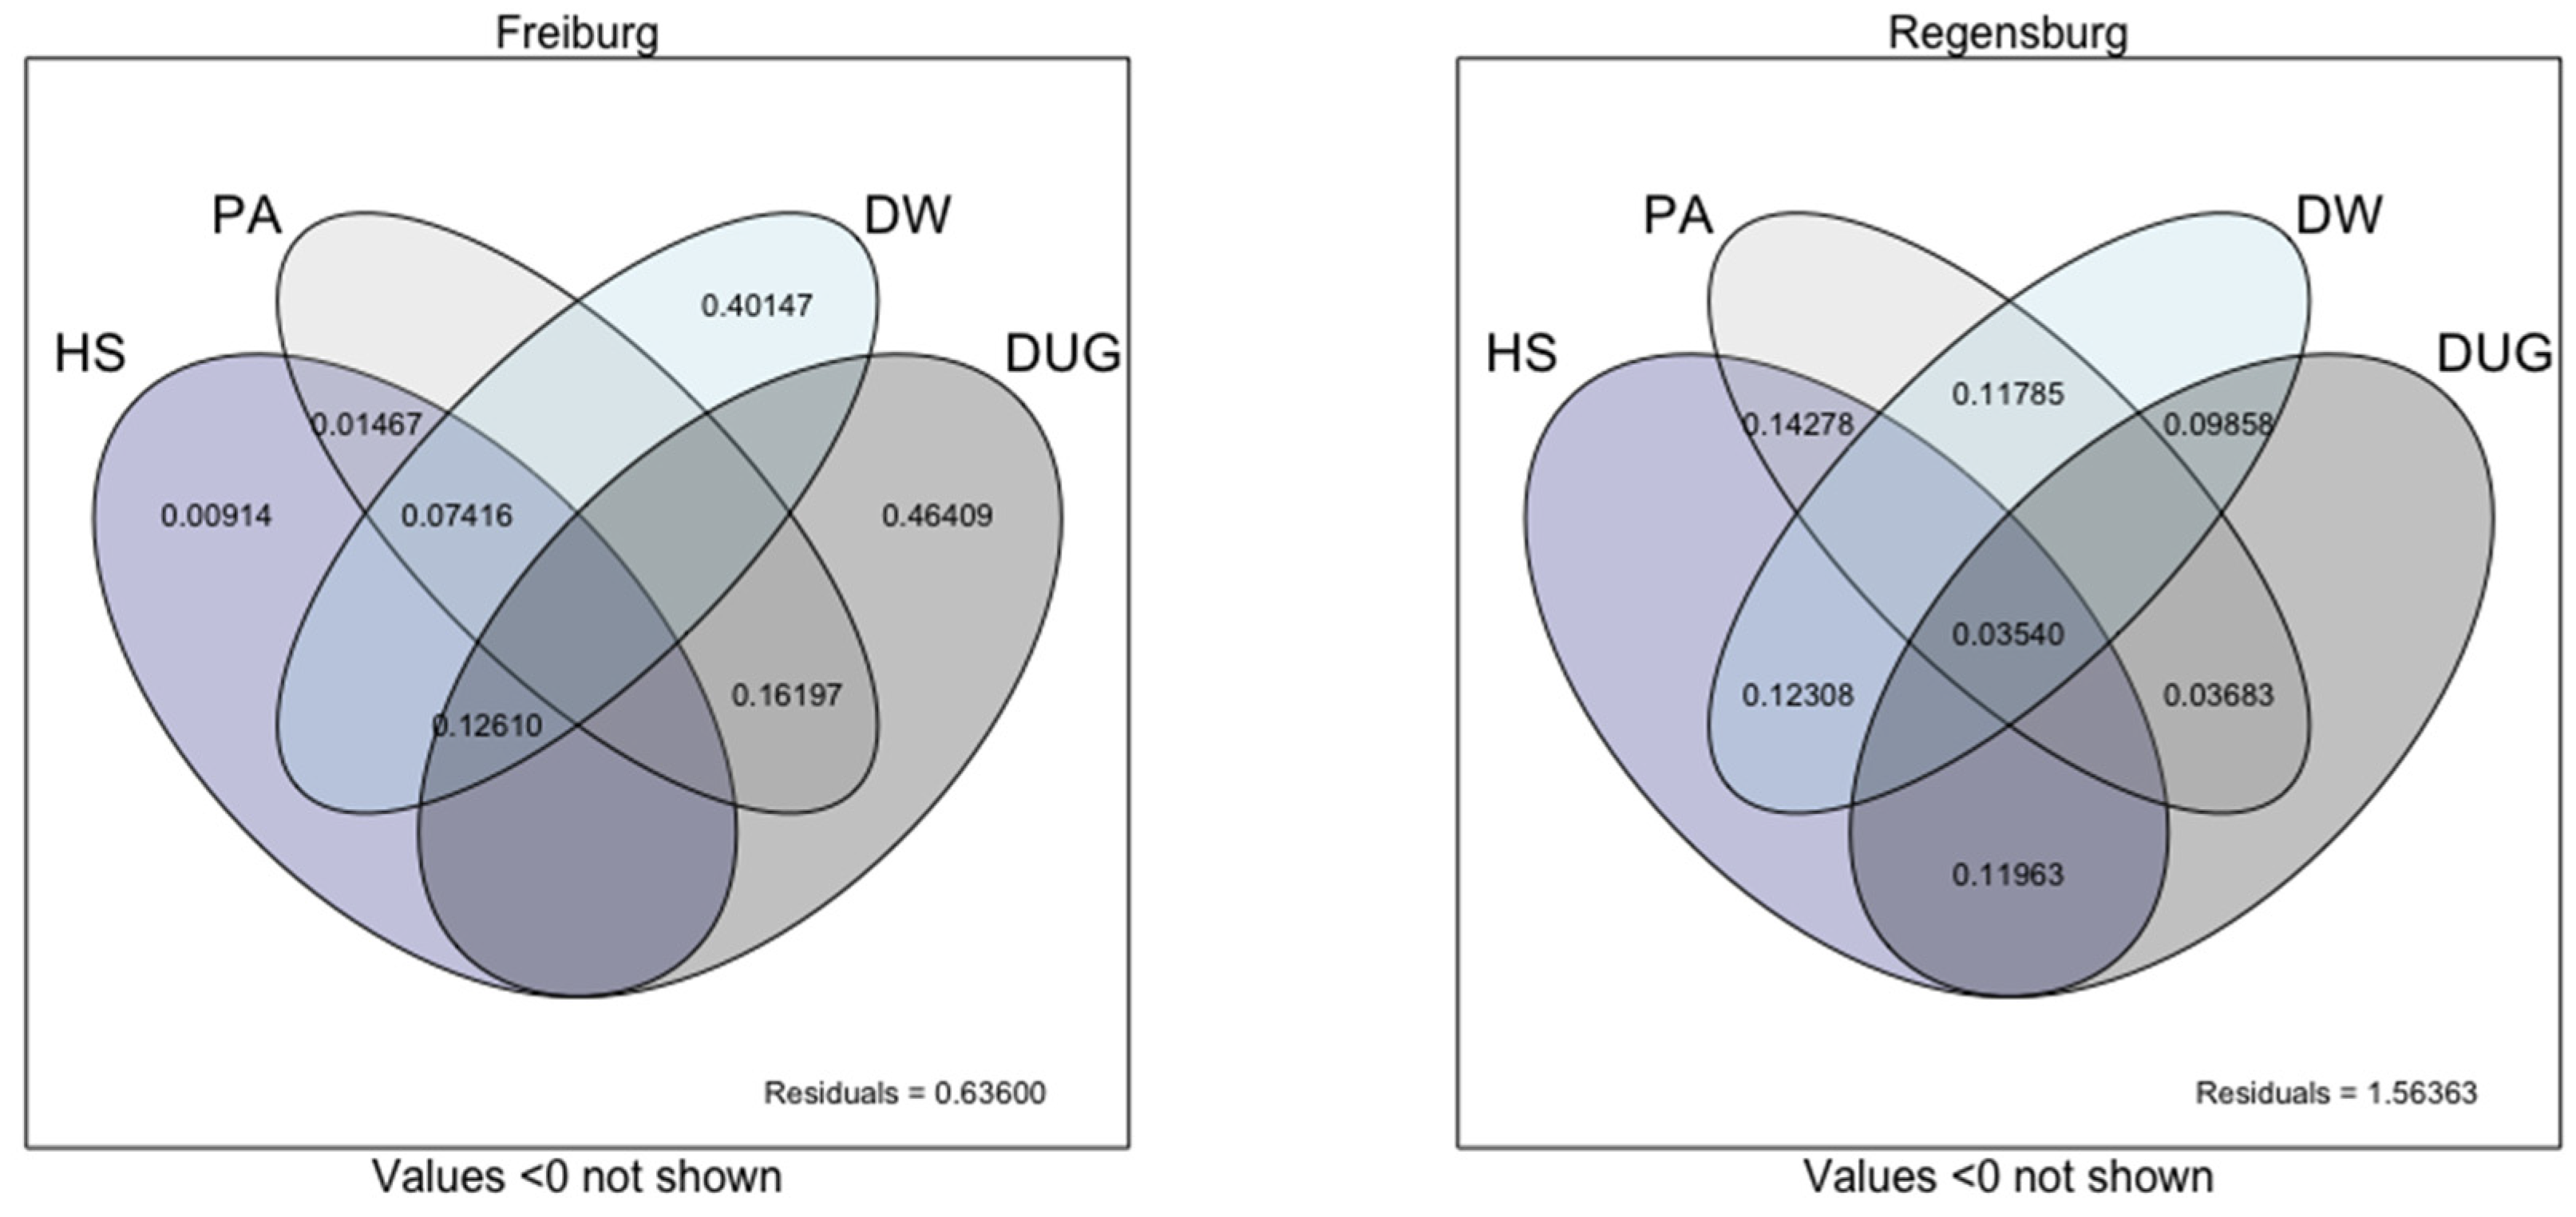
3.2. Variation Partitioning
4. Discussion
Supplementary Materials
Author Contributions
Funding
Institutional Review Board Statement
Informed Consent Statement
Data Availability Statement
Acknowledgments
Conflicts of Interest
References
- Benton-Short, L.; Keeley, M.; Rowland, J. Green infrastructure, green space, and sustainable urbanism: Geography’s important role. Urban Geogr. 2017, 40, 330–351. [Google Scholar] [CrossRef]
- Lepczyk, C.A.; Aronson, M.F.J.; Evans, K.L.; Goddard, M.; Lerman, S.B.; MacIvor, J.S. Biodiversity in the City: Fundamental Questions for Understanding the Ecology of Urban Green Spaces for Biodiversity Conservation. BioScience 2017, 67, 799–807. [Google Scholar] [CrossRef] [Green Version]
- Khera, N.; Mehta, V.; Sabata, B. Interrelationship of birds and habitat features in urban greenspaces in Delhi, India. Urban For. Urban Green. 2009, 8, 187–196. [Google Scholar] [CrossRef]
- Leveau, L.M.; Ruggiero, A.; Matthews, T.J.; Bellocq, M.I. A global consistent positive effect of urban green area size on bird richness. Avian Res. 2019, 10, 30. [Google Scholar] [CrossRef] [Green Version]
- Callaghan, C.T.; Major, R.E.; Lyons, M.B.; Martin, J.; Kingsford, R. The effects of local and landscape habitat attributes on bird diversity in urban greenspaces. Ecosphere 2018, 9, e02347. [Google Scholar] [CrossRef] [Green Version]
- Biroli, A.P.; Van Doren, B.M.; Grabowska-Zhang, A. Drivers of avian species richness and community structure in urban courtyard gardens. J. Urban Ecol. 2020, 6, juz026. [Google Scholar] [CrossRef]
- Drinnan, I.N. The search for fragmentation thresholds in a Southern Sydney Suburb. Biol. Conserv. 2005, 124, 339–349. [Google Scholar] [CrossRef]
- Kang, W.; Minor, E.; Park, C.-R.; Lee, D. Effects of habitat structure, human disturbance, and habitat connectivity on urban forest bird communities. Urban Ecosyst. 2015, 18, 857–870. [Google Scholar] [CrossRef]
- Strohbach, M.; Lerman, S.B.; Warren, P.S. Are small greening areas enhancing bird diversity? Insights from community-driven greening projects in Boston. Landsc. Urban Plan. 2013, 114, 69–79. [Google Scholar] [CrossRef]
- Schütz, C.; Schulze, C.H. Functional diversity of urban bird communities: Effects of landscape composition, green space area and vegetation cover. Ecol. Evol. 2015, 5, 5230–5239. [Google Scholar] [CrossRef]
- Liordos, V.; Jokimäki, J.; Kaisanlahti-Jokimäki, M.-L.; Valsamidis, E.; Kontsiotis, V. Niche Analysis and Conservation of Bird Species Using Urban Core Areas. Sustainability 2021, 13, 6327. [Google Scholar] [CrossRef]
- Liordos, V.; Jokimäki, J.; Kaisanlahti-Jokimäki, M.-L.; Valsamidis, E.; Kontsiotis, V.J. Patch, matrix and disturbance variables negatively influence bird community structure in small-sized managed green spaces located in urban core areas. Sci. Total Environ. 2021, 801, 149617. [Google Scholar] [CrossRef] [PubMed]
- Chace, J.F.; Walsh, J.J. Urban effects on native avifauna: A review. Landsc. Urban Plan. 2006, 74, 46–69. [Google Scholar] [CrossRef]
- Threlfall, C.G.; Mata, L.; Mackie, J.A.; Hahs, A.K.; Stork, N.E.; Williams, N.S.G.; Livesley, S.J. Increasing biodiversity in urban green spaces through simple vegetation interventions. J. Appl. Ecol. 2017, 54, 1874–1883. [Google Scholar] [CrossRef] [Green Version]
- Aronson, M.F.J.; La Sorte, F.A.; Nilon, C.H.; Katti, M.; Goddard, M.A.; Lepczyk, C.A.; Warren, P.S.; Williams, N.S.G.; Clilliers, S.; Clarkson, B.; et al. A global analysis of the impacts of urbanization on bird and plant diversity reveals key anthropogenic drivers. Proc. R. Soc. B Biol. Sci. 2014, 281, 20133330. [Google Scholar] [CrossRef]
- Lepczyk, C.A.; Sorte, F.A.L.; Aronson, M.F.; Goddard, M.A.; MacGregor-Fors, I.; Nilon, C.H.; Warren, P.S. Global patterns and drivers of urban bird diversity. In Ecology and Conservation of Birds in Urban Environments; Springer International Publishing: Cham, Switzerland, 2017; pp. 13–33. [Google Scholar]
- Sultana, M.; Corlatti, L.; Storch, I. The interaction of imperviousness and habitat heterogeneity drives bird richness patterns in south Asian cities. Urban Ecosyst. 2020, 24, 335–344. [Google Scholar] [CrossRef]
- Strohbach, M.W.; Haase, D.; Kabisch, N. Birds and the City: Urban Biodiversity, Land Use, and Socioeconomics. Ecol. Soc. 2009, 14, 31. [Google Scholar] [CrossRef] [Green Version]
- Trimble, M.J.; van Aarde, R.J. Geographical and taxonomic biases in research on biodiversity in human-modified landscapes. Ecosphere 2012, 3, 1–16. [Google Scholar] [CrossRef]
- Li, E.; Parker, S.S.; Pauly, G.B.; Randall, J.M.; Brown, B.V.; Cohen, B.S. An Urban Biodiversity Assessment Framework That Combines an Urban Habitat Classification Scheme and Citizen Science Data. Front. Ecol. Evol. 2019, 7, 277. [Google Scholar] [CrossRef] [Green Version]
- Estevo, C.A.; Nagy-Reis, M.B.; Silva, W.R. Urban parks can maintain minimal resilience for Neotropical bird communities. Urban For. Urban Green. 2017, 27, 84–89. [Google Scholar] [CrossRef]
- Yang, X.; Tan, X.; Chen, C.; Wang, Y. The influence of urban park characteristics on bird diversity in Nanjing, China. Avian Res. 2020, 11, 45. [Google Scholar] [CrossRef]
- Wojtyszyn, B. Spatial Development of Regensburg/Ratyzbona Towards the City of “Green” Housing Estates. Civ. Environ. Eng. Rep. 2020, 30, 185–195. [Google Scholar] [CrossRef]
- FWTM. Approaches to Sustainability, Green City Freiburg. Freiburg. 2017. Available online: https://www.awec2017.com/images/GreenCity_English.pdf (accessed on 1 April 2022).
- Stadt Freiburg. FR.ITZ Online Das Statistik Portal, FR.ITZ Informationsportal. 2021. Available online: https://fritz.freiburg.de/Informationsportal/#app/startpage (accessed on 28 November 2021).
- Stadt Regensburg. Informationen und Zahlen. 2021. Available online: http://www.statistik.regensburg.de/menue/informationen_u_zahlen.php (accessed on 5 August 2021).
- Taubenböck, H.; Reiter, M.; Dosch, F.; Leichtle, T.; Weigand, M.; Wurm, M. Which city is the greenest? A multi-dimensional deconstruction of city rankings. Comput. Environ. Urban Syst. 2021, 89, 101687. [Google Scholar] [CrossRef]
- City Mayors. City Mayors: Germany’s Greenest Cities. 2017. Available online: http://www.citymayors.com/environment/german-green-cities.html (accessed on 30 March 2022).
- Buehler, R.; Jungjohann, A.; Keeley, M.; Mehling, M. How Germany Became Europe’s Green Leader: A Look at Four Decades of Sustainable Policymaking. Solutions 2011, 2, 51–63. [Google Scholar]
- Bibby, C.J.; Hill, D.A.; Burgess, N.D.; Mustoe, S. Bird Census Techniques, 2nd ed.; Academic Press: London, UK, 2000. [Google Scholar]
- Sultana, M.; Müller, M.; Magdalena, M.; Storch, I. OSF|Data of the Study on Small Green Areas. Available online: https://osf.io/9jsav/?view_only=c77fd1b5d8224146a058c70c82415600 (accessed on 6 March 2022).
- Copernicus Land Monitoring Service. Urban Atlas 2018—Copernicus Land Monitoring Service. 2022. Available online: https://land.copernicus.eu/local/urban-atlas/urban-atlas-2018?tab=download (accessed on 30 March 2022).
- Ares, R. Mapping Guide for a European Urban Atlas. 2012. Available online: http://ec.europa.eu/regional_policy/sources/tender/pdf/2012066/annexe2.pdf (accessed on 6 March 2022).
- Tuanmu, M.-N.; Jetz, W. A global, remote sensing-based characterization of terrestrial habitat heterogeneity for biodiversity and ecosystem modelling. Glob. Ecol. Biogeogr. 2015, 24, 1329–1339. [Google Scholar] [CrossRef]
- Vogt, P.; Riitters, K.H.; Estreguil, C.; Kozak, J.; Wade, T.G.; Wickham, J.D. Mapping Spatial Patterns with Morphological Image Processing. Landsc. Ecol. 2006, 22, 171–177. [Google Scholar] [CrossRef]
- Buchhorn, M.; Lesiv, M.; Tsendbazar, N.-E.; Herold, M.; Bertels, L.; Smets, B. Copernicus Global Land Cover Layers—Collection 2. Remote Sens. 2020, 12, 1044. [Google Scholar] [CrossRef] [Green Version]
- Silva, C.P.; García, C.E.; Estay, S.; Barbosa, O. Bird Richness and Abundance in Response to Urban Form in a Latin American City: Valdivia, Chile as a Case Study. PLoS ONE 2015, 10, e0138120. [Google Scholar] [CrossRef] [Green Version]
- Carvajal-Castro, J.D.; Ospina-L, A.M.; Toro-López, Y.; Pulido-G, A.; Casas, L.C.; Guerrero-Peláez, S.; García-Merchán, V.H.; Vargas-Salinas, F. Birds vs bricks: Patterns of species diversity in response to urbanization in a Neotropical Andean city. PLoS ONE 2019, 14, e0218775. [Google Scholar] [CrossRef] [Green Version]
- Marcacci, G.; Westphal, C.; Wenzel, A.; Raj, V.; Nölke, N.; Tscharntke, T.; Grass, I. Taxonomic and functional homogenization of farmland birds along an urbanization gradient in a tropical megacity. Glob. Chang. Biol. 2021, 27, 4980–4994. [Google Scholar] [CrossRef]
- R Development Core Team. R: A Language and Environment for Statistical Computing; R Foundation for Statistical Computing: Vienna, Austria, 2013; Available online: https://www.R-project.org/ (accessed on 10 April 2021).
- RStudio Team. RStudio: Integrated Development Environment for R; RStudio: Boston, MA, USA, 2021; Available online: https://www.rstudio.com/ (accessed on 10 April 2021).
- Venables, W.N.; Ripley, B.D. Modern Applied Statistics with S, 4th ed.; Springer: New York, NY, USA, 2002. [Google Scholar]
- Fox, J.; Weisberg, S. An R Companion to Applied Regression, 3rd ed.; Sage: Thousand Oaks, CA, USA, 2019. [Google Scholar]
- Akinwande, M.O.; Dikko, H.G.; Samson, A. Variance Inflation Factor: As a Condition for the Inclusion of Suppressor Variable(s) in Regression Analysis. Open J. Stat. 2015, 5, 754–767. [Google Scholar] [CrossRef] [Green Version]
- Bartoń, K. Package ‘MuMIn’ Title Multi-Model Inference. 2022. Available online: https://cran.r-project.org/web/packages/MuMIn/MuMIn.pdf (accessed on 2 April 2022).
- Borcard, D.; Legendre, P.; Drapeau, P. Partialling out the Spatial Component of Ecological Variation. Ecology 1992, 73, 1045–1055. [Google Scholar] [CrossRef] [Green Version]
- Oksanen, J.; Blanchet, G.F.; Kindt, R.; Legendre, P.; Minchin, R.P.; O’hara, B.R.; Simpson, L.G.; Solymos, P.; Stevens, H.M.H.; Wagner, H.; et al. Package ‘vegan’. Community Ecology Package. Community Ecol. Package 2019, 2, 1–297. Available online: https://cran.r-project.org/web/packages/vegan/vegan.pdf (accessed on 10 April 2021).
- Bauer, H.-G.; Boschert, M.; Förschler, M.I.; Hölzinger, J.; Kramer, M.; Mahler, U. Rote Liste und Kommentiertes Verzeichnis der Brutvogelarten Baden-Württembergs; LUBW Landesanstalt für Umwelt, Messungen und Naturschutz Baden-Württemberg: Stuttgart, Germany, 2016; Volume 6. [Google Scholar]
- Bayerisches Landesamt für Umwelt (LfU). Rote Liste und Liste der Brutvögel Bayerns. 2016. Available online: https://www.lfu.bayern.de/natur/rote_liste_tiere/2016/index.htm (accessed on 30 March 2022).
- Sorace, A.; Gustin, M. Species Richness and Species of Conservation Concern in Parks of Italian Towns. In Ecology and Conservation of Birds in Urban Environments; Springer: Cham, Switzerland, 2017; pp. 425–448. [Google Scholar] [CrossRef]
- Tryjanowski, P.; Morelli, F.; Mikula, P.; Kristin, A.; Indykiewicz, P.; Grzywaczewski, G.; Kronenberg, J.; Jerzak, L. Bird diversity in urban green space: A large-scale analysis of differences between parks and cemeteries in Central Europe. Urban For. Urban Green. 2017, 27, 264–271. [Google Scholar] [CrossRef]
- Ferenc, M.; Sedláček, O.; Fuchs, R.; Dinetti, M.; Fraissinet, M.; Storch, D. Are cities different? Patterns of species richness and beta diversity of urban bird communities and regional species assemblages in E urope. Glob. Ecol. Biogeogr. 2013, 23, 479–489. [Google Scholar] [CrossRef]
- van Heezik, Y.; Freeman, C.; Porter, S.; Dickinson, K.J.M. Garden Size, Householder Knowledge, and Socio-Economic Status Influence Plant and Bird Diversity at the Scale of Individual Gardens. Ecosystems 2013, 16, 1442–1454. [Google Scholar] [CrossRef]
- Johnson, C.D.; Evans, D.; Jones, D. Birds and Roads: Reduced Transit for Smaller Species over Roads within an Urban Environment. Front. Ecol. Evol. 2017, 5, 36. [Google Scholar] [CrossRef] [Green Version]
- Rao, S.; Koli, V.K. Edge Effect of Busy High Traffic Roads on the Nest Site Selection of Birds Inside the City Area: Guild Response. Transp. Res. Part D Transp. Environ. 2017, 51, 94–101. Available online: https://www.infona.pl//resource/bwmeta1.element.elsevier-7668b2fe-4df1-35a6-a667-4314cd70d841 (accessed on 13 May 2022). [CrossRef]
- Donnelly, R.; Marzluff, J.M. Relative importance of habitat quantity, structure, and spatial pattern to birds in urbanizing environments. Urban Ecosyst. 2006, 9, 99–117. [Google Scholar] [CrossRef]
- Evans, K.L.; Newson, S.E.; Gaston, K.J. Habitat influences on urban avian assemblages. Ibis 2008, 151, 19–39. [Google Scholar] [CrossRef]
- Faeth, S.H.; Saari, S.; Bang, C. Urban Biodiversity: Patterns, Processes and Implications for Conservation. eLS 2012. [Google Scholar] [CrossRef]
- Beninde, J.; Veith, M.; Hochkirch, A. Biodiversity in cities needs space: A meta-analysis of factors determining intra-urban biodiversity variation. Ecol. Lett. 2015, 18, 581–592. [Google Scholar] [CrossRef] [PubMed]
- Clergeau, P.; Croci, S.; Jokimäki, J.; Kaisanlahti-Jokimäki, M.-L.; Dinetti, M. Avifauna homogenisation by urbanisation: Analysis at different European latitudes. Biol. Conserv. 2006, 127, 336–344. [Google Scholar] [CrossRef]
- Morelli, F.; Benedetti, Y.; Ibáñez-Álamo, J.D.; Jokimäki, J.; Mänd, R.; Tryjanowski, P.; Møller, A.P. Evidence of evolutionary homogenization of bird communities in urban environments across Europe. Glob. Ecol. Biogeogr. 2016, 25, 1284–1293. [Google Scholar] [CrossRef]
- Heggie-Gracie, S.D.; Krull, C.R.; Stanley, M.C. Urban divide: Predictors of bird communities in forest fragments and the surrounding urban matrix. Emu-Austral Ornithol. 2020, 120, 333–342. [Google Scholar] [CrossRef]
- da Silva, B.F.; Pena, J.C.; Viana-Junior, A.B.; Vergne, M.; Pizo, M.A. Noise and tree species richness modulate the bird community inhabiting small public urban green spaces of a Neotropical city. Urban Ecosyst. 2020, 24, 71–81. [Google Scholar] [CrossRef]
- Riva, F.; Fahrig, L. The Disproportionately High Value of Small Patches for Biodiversity Conservation. Conserv. Lett. 2022, e12881. Available online: https://onlinelibrary.wiley.com/doi/full/10.1111/conl.12881 (accessed on 13 May 2022).
- Leveau, L.M.; Leveau, C.M. Street design in suburban areas and its impact on bird communities: Considering different diversity facets over the year. Urban For. Urban Green. 2019, 48, 126578. [Google Scholar] [CrossRef]
- Cox, D.T.C.; Inger, R.; Hancock, S.; Anderson, K.; Gaston, K.J. Movement of feeder-using songbirds: The influence of urban features. Sci. Rep. 2016, 6, 37669. [Google Scholar] [CrossRef] [Green Version]
- Elmqvist, T.; Zipperer, W.; Güneralp, B. Urbanization, habitat loss, biodiversity decline: Solution pathways to break the cycle | Treesearch. In Routledge Handbook of Urbanization and Global Environmental Change; Seta, K., Solecki, W.D., Griffith, C.A., Eds.; Routledge: London, UK; New York, NY, USA, 2016. [Google Scholar]
- European Union. The Birds Directive: 40 Years Conserving Our Shared Natural Heritage; Publications Office of the European Union (EU): Luxembourg, 2019. [Google Scholar]

| (A). Case of Freiburg | ||||||||||
| Models | (Int) | GA | DG | DW | HS | PA | AICc | Δi | wi | R2 |
|---|---|---|---|---|---|---|---|---|---|---|
| ~GA | 0.76 | 0.06 | −6.4 | 0.00 | 0.892 | 0.23 | ||||
| ~GA + DW | 0.76 | 0.05 | −0.02 | 0.3 | 6.76 | 0.030 | 0.27 | |||
| ~GA + DG | 0.76 | 0.05 | −0.01 | 0.6 | 7.04 | 0.026 | 0.25 | |||
| ~GA + HS | 0.76 | 0.06 | 0.01 | 0.7 | 7.07 | 0.026 | 0.25 | |||
| ~GA + PA | 0.76 | 0.06 | 0.01 | 0.7 | 7.13 | 0.025 | 0.24 | |||
| (B). Case of Regensburg | ||||||||||
| Models | (Int) | IS | DW | DG | HS | PA | AICc | Δi | wi | R2 |
| ~IS | 12.37 | −1.5 | 45.2 | 0.00 | 0.91 | 0.35 | ||||
| ~IS + PA | 12.37 | −1.08 | 1.28 | 51.3 | 6.05 | 0.04 | 0.57 | |||
| ~IS + DG | 12.37 | −1.23 | −0.99 | 52.7 | 7.43 | 0.02 | 0.49 | |||
| ~IS + DW | 12.37 | −1.40 | −0.33 | 54.4 | 9.15 | 0.01 | 0.36 | |||
| ~IS + HS | 12.37 | −1.56 | −0.09 | 54.6 | 9.32 | 0.01 | 0.35 | |||
Publisher’s Note: MDPI stays neutral with regard to jurisdictional claims in published maps and institutional affiliations. |
© 2022 by the authors. Licensee MDPI, Basel, Switzerland. This article is an open access article distributed under the terms and conditions of the Creative Commons Attribution (CC BY) license (https://creativecommons.org/licenses/by/4.0/).
Share and Cite
Sultana, M.; Müller, M.; Meyer, M.; Storch, I. Neighboring Green Network and Landscape Metrics Explain Biodiversity within Small Urban Green Areas—A Case Study on Birds. Sustainability 2022, 14, 6394. https://doi.org/10.3390/su14116394
Sultana M, Müller M, Meyer M, Storch I. Neighboring Green Network and Landscape Metrics Explain Biodiversity within Small Urban Green Areas—A Case Study on Birds. Sustainability. 2022; 14(11):6394. https://doi.org/10.3390/su14116394
Chicago/Turabian StyleSultana, Marufa, Max Müller, Magdalena Meyer, and Ilse Storch. 2022. "Neighboring Green Network and Landscape Metrics Explain Biodiversity within Small Urban Green Areas—A Case Study on Birds" Sustainability 14, no. 11: 6394. https://doi.org/10.3390/su14116394
APA StyleSultana, M., Müller, M., Meyer, M., & Storch, I. (2022). Neighboring Green Network and Landscape Metrics Explain Biodiversity within Small Urban Green Areas—A Case Study on Birds. Sustainability, 14(11), 6394. https://doi.org/10.3390/su14116394