1. Introduction
Soils are an indispensable, limited, and vital non-renewable natural resource in terms of their fertility. Therefore, soil cover should be protected and used sustainably [
1,
2]. Soil is both a means and an object of labor in agriculture [
3]. As a result of human activity, soil fertility can change (increase or decrease) or can be sustainably maintained [
4].
The availability, use, and protection of soils require more and more attention from scientists and society, as agriculture is fully in line with the development and well-being of the human civilization. Soil’s resistance to anthropogenic and natural influences [
5], its possibilities for self-purification [
6], and the long time required for the manifestation of the changes in its characteristics [
7,
8], are factors that many take for granted. Soil’s buffering capacity [
9], and its ability to filter [
10] and absorb contaminants [
11], makes its degradation noticeable only when it is sufficiently advanced [
12].
New farming approaches, including all so-called organic agricultures, have been created to decrease and eliminate the negative impacts of synthetic fertilizers on soils and plants, and through them, on human health and the environment [
13]. Peat, animal wastes, agricultural plant wastes, and treated sewage sludge are examples of organic fertilizers. In contrast, inorganic fertilizers include chemical substances such as potassium chloride, ammonium nitrate, urea, NPK (nitrogen, phosphorus, and potassium), and others [
14].
Since the beginning of the 21st century, the production and utilization of biochar for agricultural and environmental purposes has become a focus of interdisciplinary research [
15,
16,
17]. Biochar is applied in order to decrease the adversity and environmental hazards of chemical fertilizers. It has been claimed that biochar improves soil fertility, reduces the need for mineral fertilizers, increases yields and crop quality, and protects groundwater and the atmosphere from pollution, including oil contamination [
18]. This carbon-rich solid substance has been primarily investigated since its unearthing in the Amazon basin in Terra Preta [
19], and is referred to as a model for sustainable agriculture. Even in China, the idea of “Straw Biochar Returning” was proposed in 2006, advocating for the strategy of returning carbonized straw to the field while considering the entire industrial chain [
17]. China is the world’s most significant straw producer, with its total straw output accounting for more than 15% of the worldwide straw output in recent years [
15].
Biochar is produced from thermally destroyed biomass in an anoxic environment under the action of temperatures below 700 °C [
12]. Straw may be used to make high-value biochar and biomass gas and accomplish carbon fixation [
15]. Straw biochar has the potential to reduce environmental pollution caused by crops while also increasing economic advantages and achieving cleaner manufacturing processes [
15]. Different types of straw are used to produce biochar, such as wheat [
20], corn [
21], rice [
22], sunflower [
23], and cotton [
24].
Our paper presents the results for biochar production from wheat straw from three different regions in Bulgaria. There is a significant variance in straw use levels in different countries, with Bulgaria having a low utilization value when compared to China, for example. Straw burning in the field is still a common practice for farmers; hence, it is yet a viable resource use strategy [
25]. Straw has a high yield, but the amount that can be returned to the field as fertilizer is still limited. The wheat harvested in 2021 was 7.16 million tons, or 52% more, than in the previous year. This result is a very suitable precondition for investigating the use of straw for biochar production. Our study demonstrates the production of straw biochar using a specially designed reactor, which is explained in detail. Three samples of wheat straw were taken from three agricultural regions in Bulgaria, situated in the northeast, southwest, and central parts of the country. Three different reactor temperatures were applied during the biochar production process. The characteristics and main chemical composition (resulting in 17 elements and compounds) of the biochar samples were determined while also examining and analyzing the possibility of using the produced straw biochar as an environmentally friendly fertilizer.
2. Materials and Methods
2.1. Materials
Three samples of straw from three different places in Bulgaria were used: Sandanski, Kavarna, and Pazardzhik (
Figure 1). The main characteristic of the selected regions are as follows:
The municipality of Sandanski is located on the south-western border of Bulgaria (
Figure 1, point 1). The climate in the region is a warm and transitional Mediterranean climate. The average annual air temperature is 13.9 °С; the average annual rainfall is 533 mm, characterized by a summer minimum and autumn–winter maximum [
26]. The region is represented by forest soils (Chromic Luvisols) with a reddish color and sandy loam texture [
26]. The municipality’s total area is 998.4 km
2, of which 347.5 km
2 is agricultural land, and 158.6 km
2 is arable land.
The municipality of Kavarna is situated in the north-eastern region of Bulgaria, on the Black Sea coastline (
Figure 1, point 2). The region has a temperate continental climate, formed under the direct influence of the Black Sea. The average annual air temperature is 11.8 °С, which is relatively low for the region’s latitude; the average annual rainfall is 411–480 mm with a spring–summer minimum and an autumn maximum. The region is characterised by clay chernozem (black soil), distinguished by surface wetting and glazing [
27]. The municipality’s total area is 481.4 km
2, of which 419.6 km
2 is agricultural land, and 374.3 km
2 is arable land.
The Pazardzhik region is situated in Southern Bulgaria (
Figure 1, point 3). It has a favourable transitional–continental climate with summer droughts. The average annual air temperature is 12.5 °С; the summer is hot and long, allowing for multiple cropping. The average annual rainfall is 500 mm, with a spring–autumn maximum and a summer minimum. The region is characterized by forest and alluvial–meadow soils [
28]. The municipality’s total area is 636.72 km
2, of which 577.1 km
2 is agricultural land, and 456.4 km
2 is arable land.
Wheat straw from the three regions was used to produce the biochar.
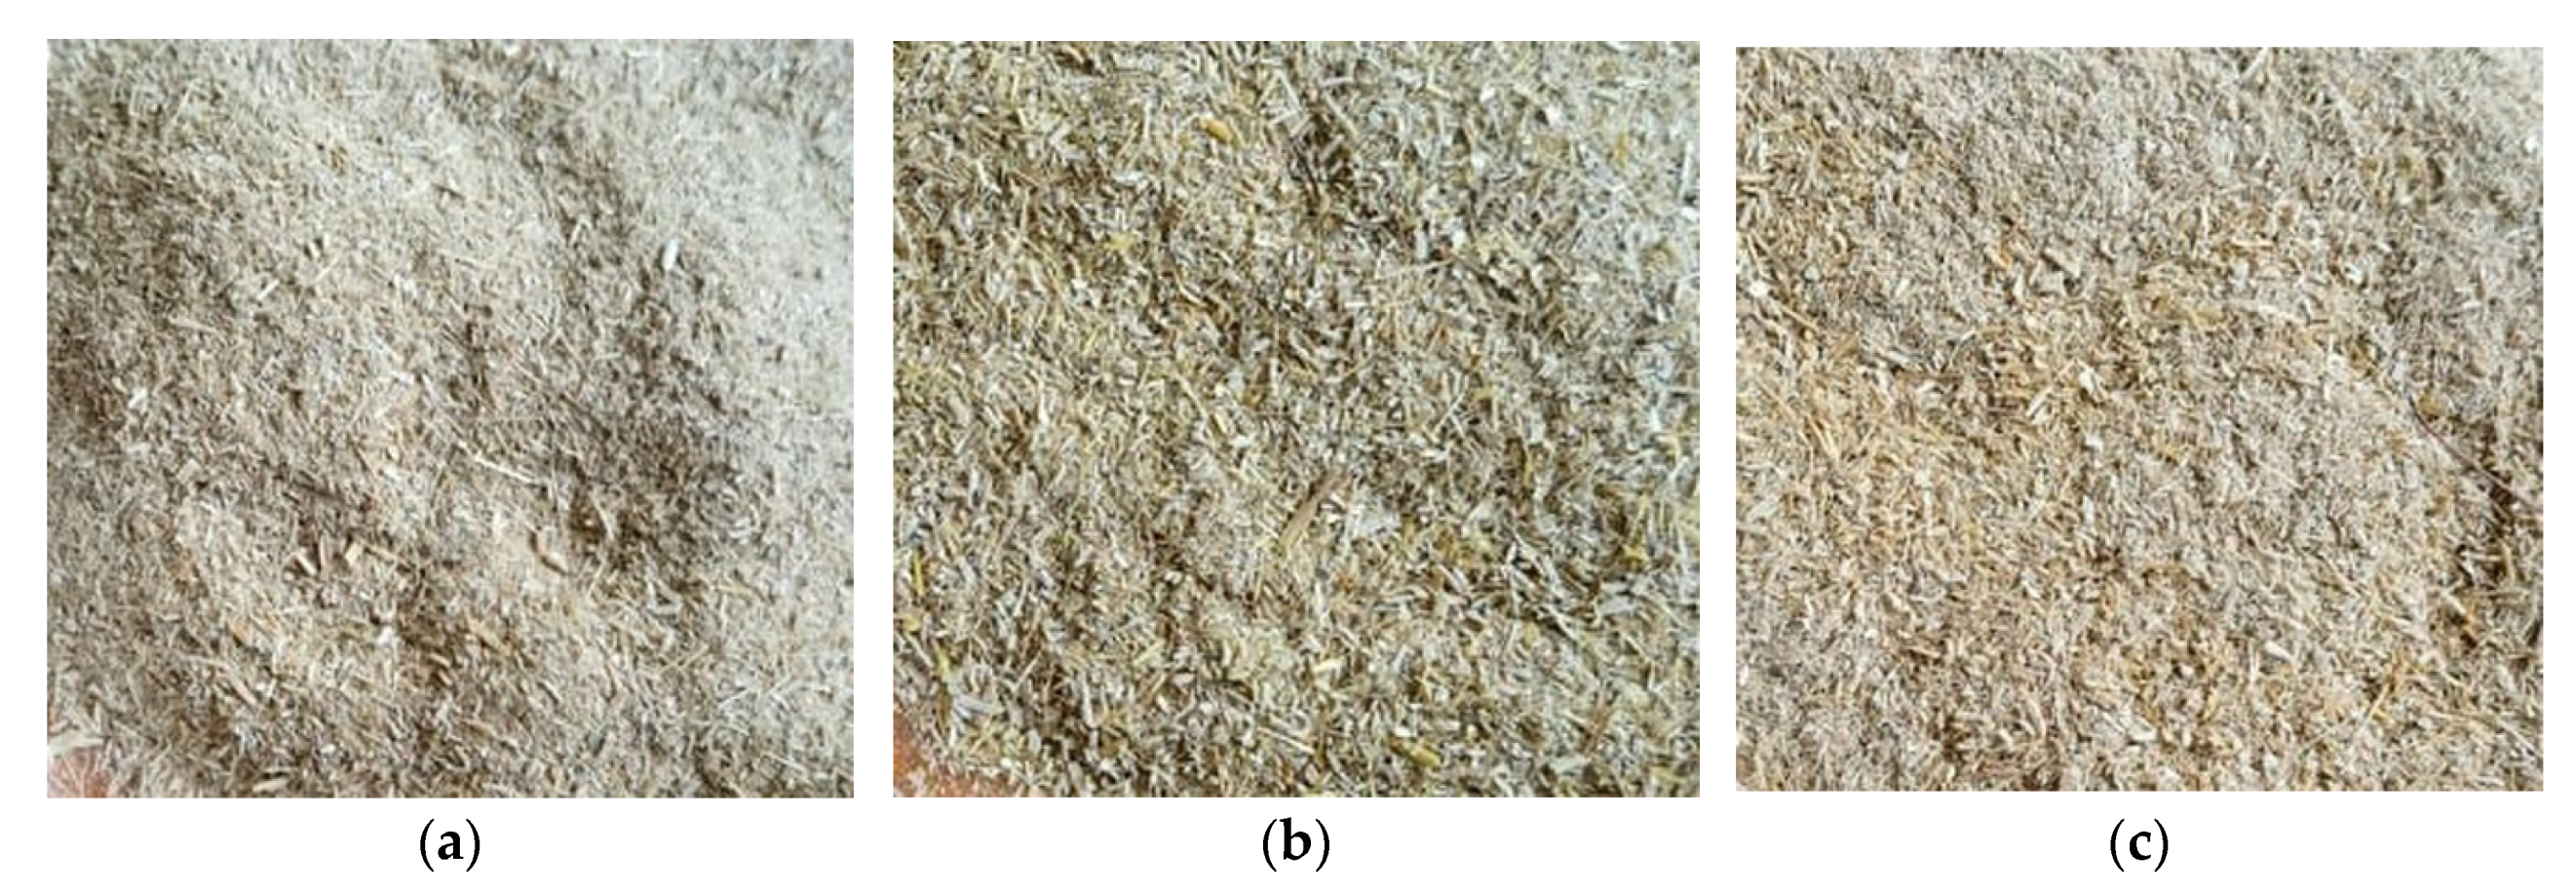
Figure 2 presents pictures of the wheat straw after the grinding process.
Figure 3 shows microscopies under 200 times enlargement, taken with a Levenhuk DTX 500 microscope (Levenhuk, Tampa, FL, USA).
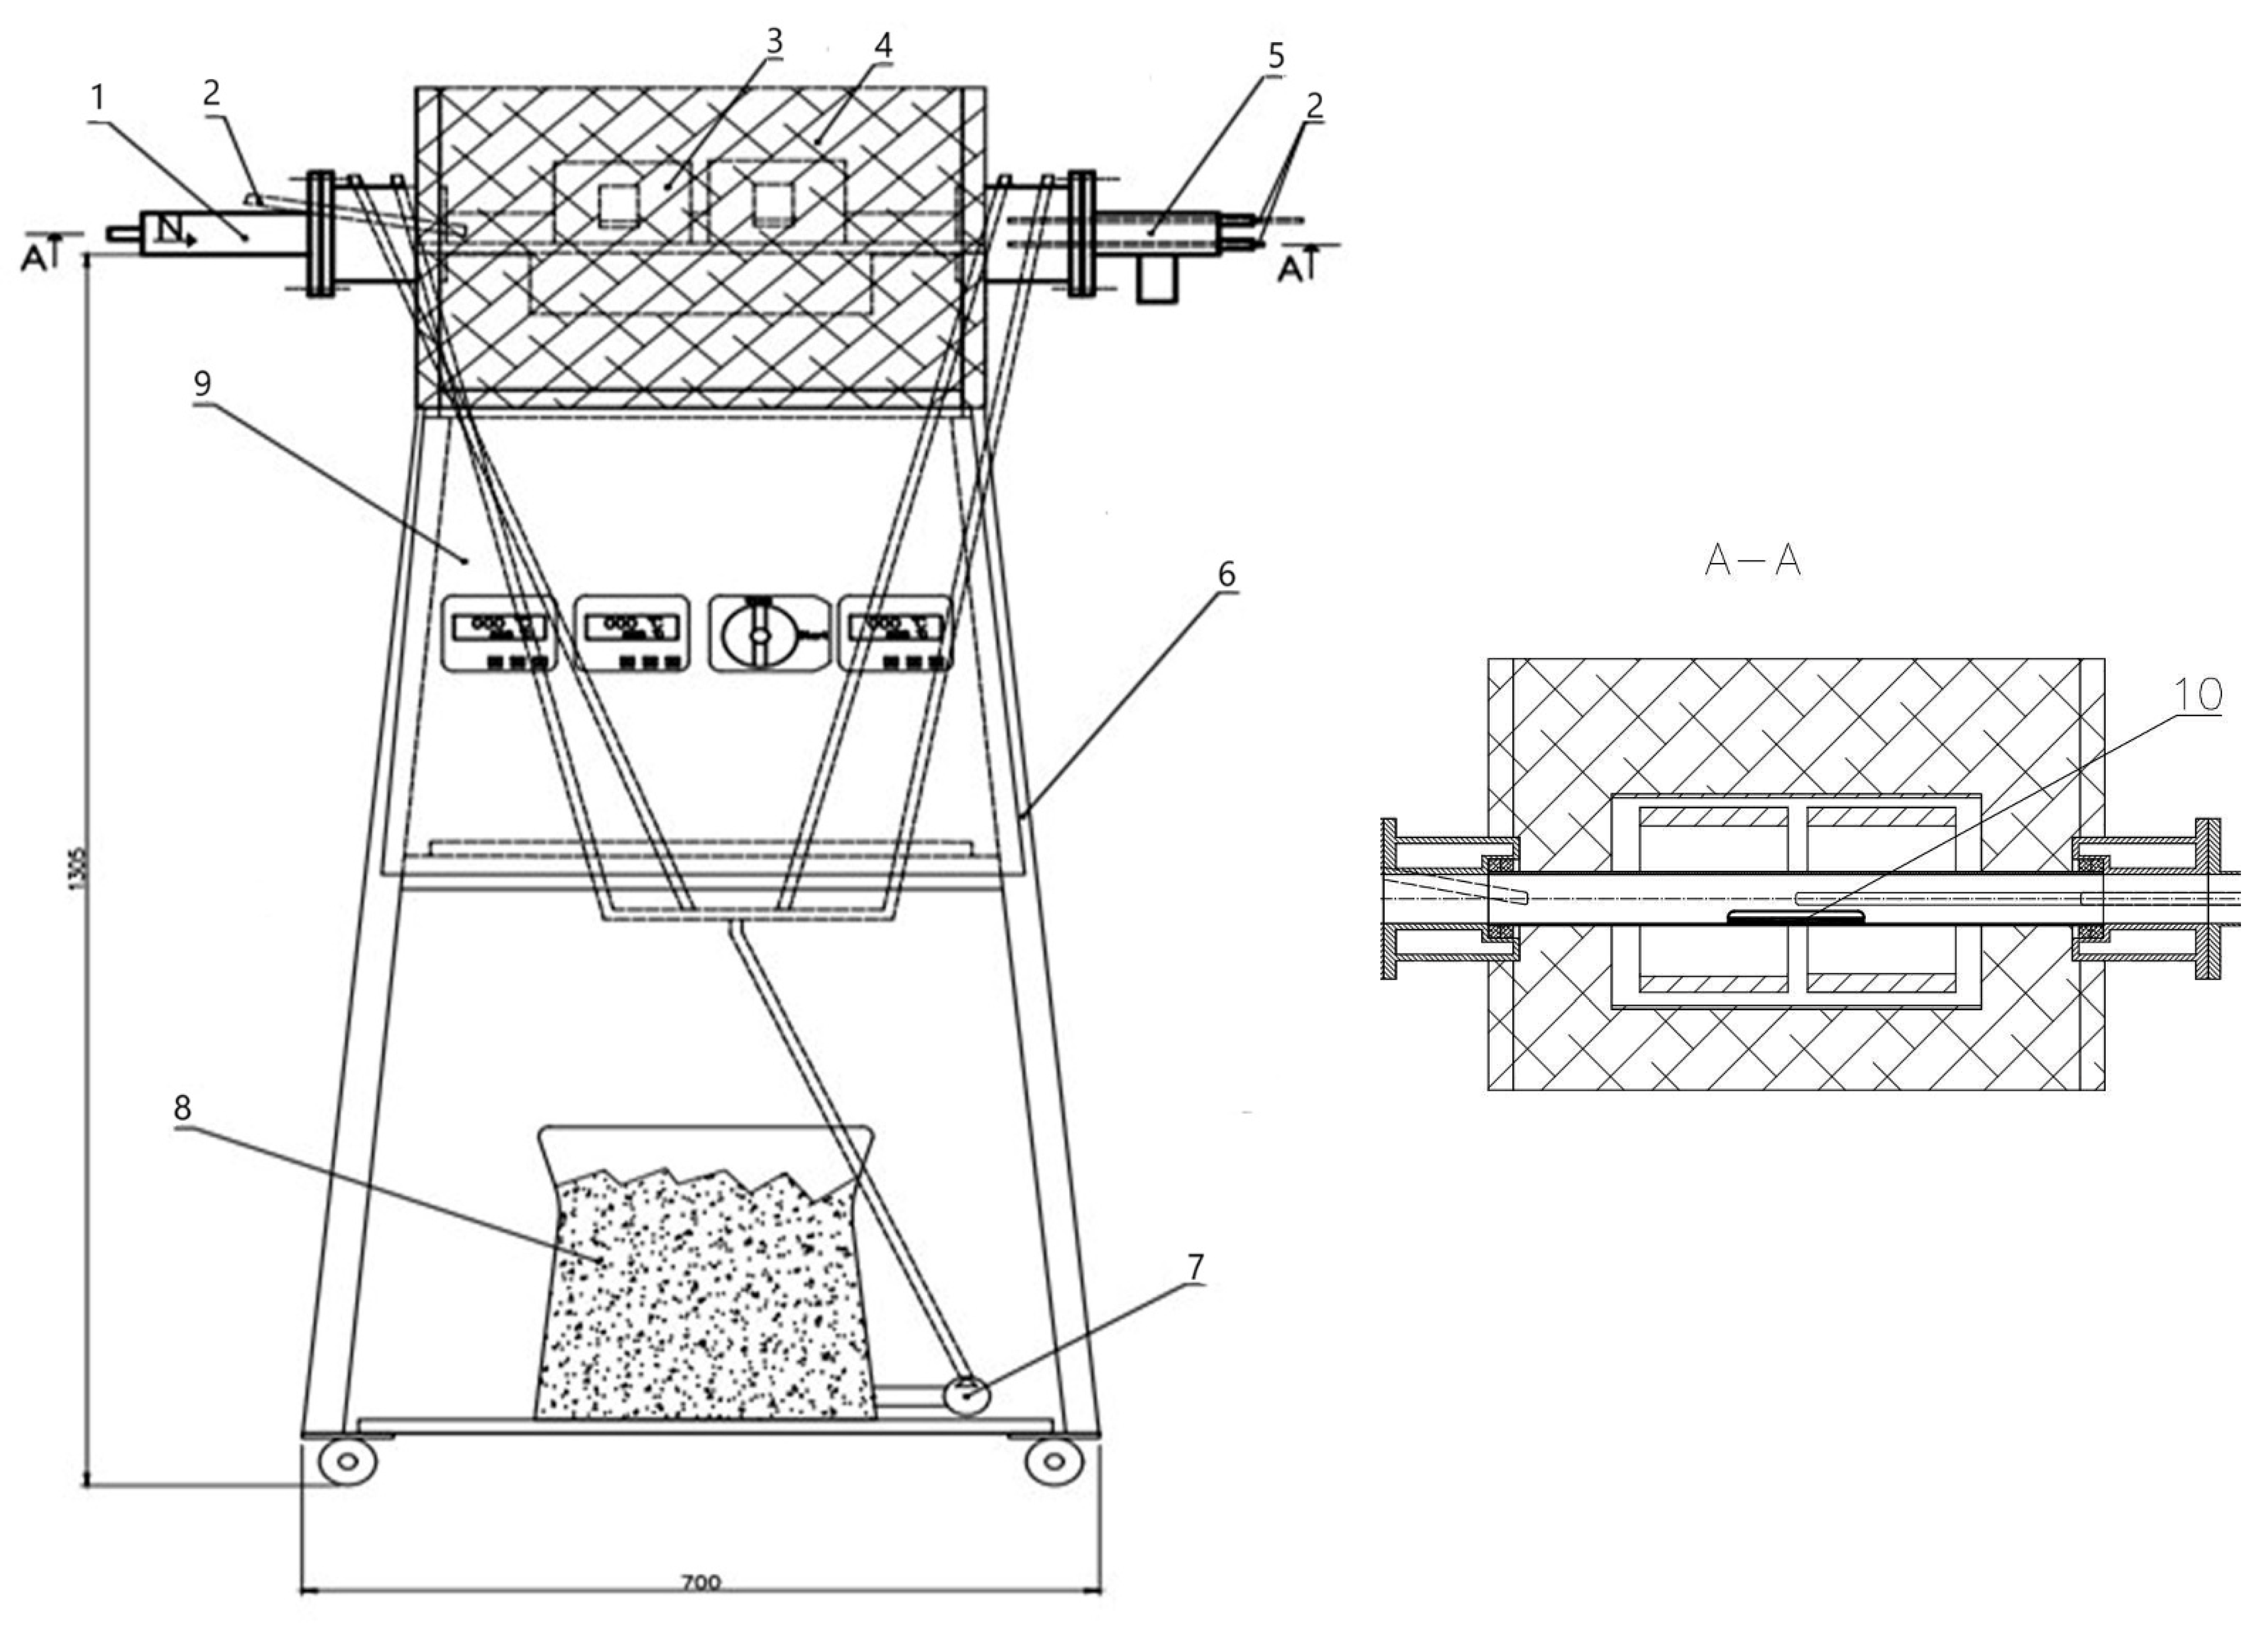
2.2. The Experimental Set-Up
The experiments were performed with a horizontal tubular laminar type reactor, designed to study the processes of thermal conversion of conventional and alternative fuels through different processes, such as pyrolysis, oxidation, and carbonisation [
29]. The biochar in our experiment was produced using the process of pyrolysis.
Figure 4 presents the scheme of the reactor.
The sample (10) is inserted through the front flange (1) inside the reaction zone. The reaction zone is made of a quartz tube with a length of 500 mm and an inner diameter of 40 mm. It is connected through glands, using high-temperature ceramic packing for sealing. The front (1) and back (5) connection flanges are made of stainless steel and equipped with cooling chambers to reduce the temperature of both the parts in the connection area and the flue gases. The front flange (1) is also used as an entrance for the nitrogen (N2).
The temperature profile in the reaction zone of the laminar reactor is achieved by three tubular (belt) ceramic electric heaters (3) with stainless steel cladding. The heaters are mounted along the quartz tube. Each of them consists of electric heating elements (an outer diameter 160 mm, inner diameter 150 mm, and length 120 mm) placed in ceramic insulation material.
The reactor’s frame (6) is built with square profiles of 35 × 35 mm. All sensors and relays to control the thermocouples (2) are mounted on the cover (9). The thermocouples (2) type K (nickel–chromium/nickel–alumel (alumel-alloy of 95% Ni, 2% Al, 2% Mg and 1% Si)), are used to measure the temperature in the reaction zone. They are suitable for use in temperatures ranging from 50 °C to 1200 °C. Three thermocouples are positioned at the inlet, at the outlet and in the middle of the reaction zone.
The back flange (5) is applied to remove the exhaust gases from the system. The middle and the last thermocouples (2) are installed on (5). The water pump (7) uses water from the tank (8) and, through the pipes, cools the flanges (1) and (5).
Тhe quartz tube and the adjacent heaters (3) are covered with aluminium silicate insulation (4) (High-T resistant, 1400 °C, Aluminosilicate Felt Fiber Insulation Blanket). The insulation (4) reduces the heat losses to the environment alongside the reaction zone and complements the measures to achieve an isothermal reaction regime.
Temperature regulators type REX-C700 FK06-M*AN with digital display are connected to the tubular electric heaters (3) and the thermocouples (2). They monitor and control the temperature profile and are used for programming the heating rate.
The line for supplying and draining cooling water for the flanges and a line for supplying a gas mixture for oxidation of the sample to the reactor are connected to the reactor. Rotameters regulate the amount of supplied gas. A manometer measures the pressure in the reactor.
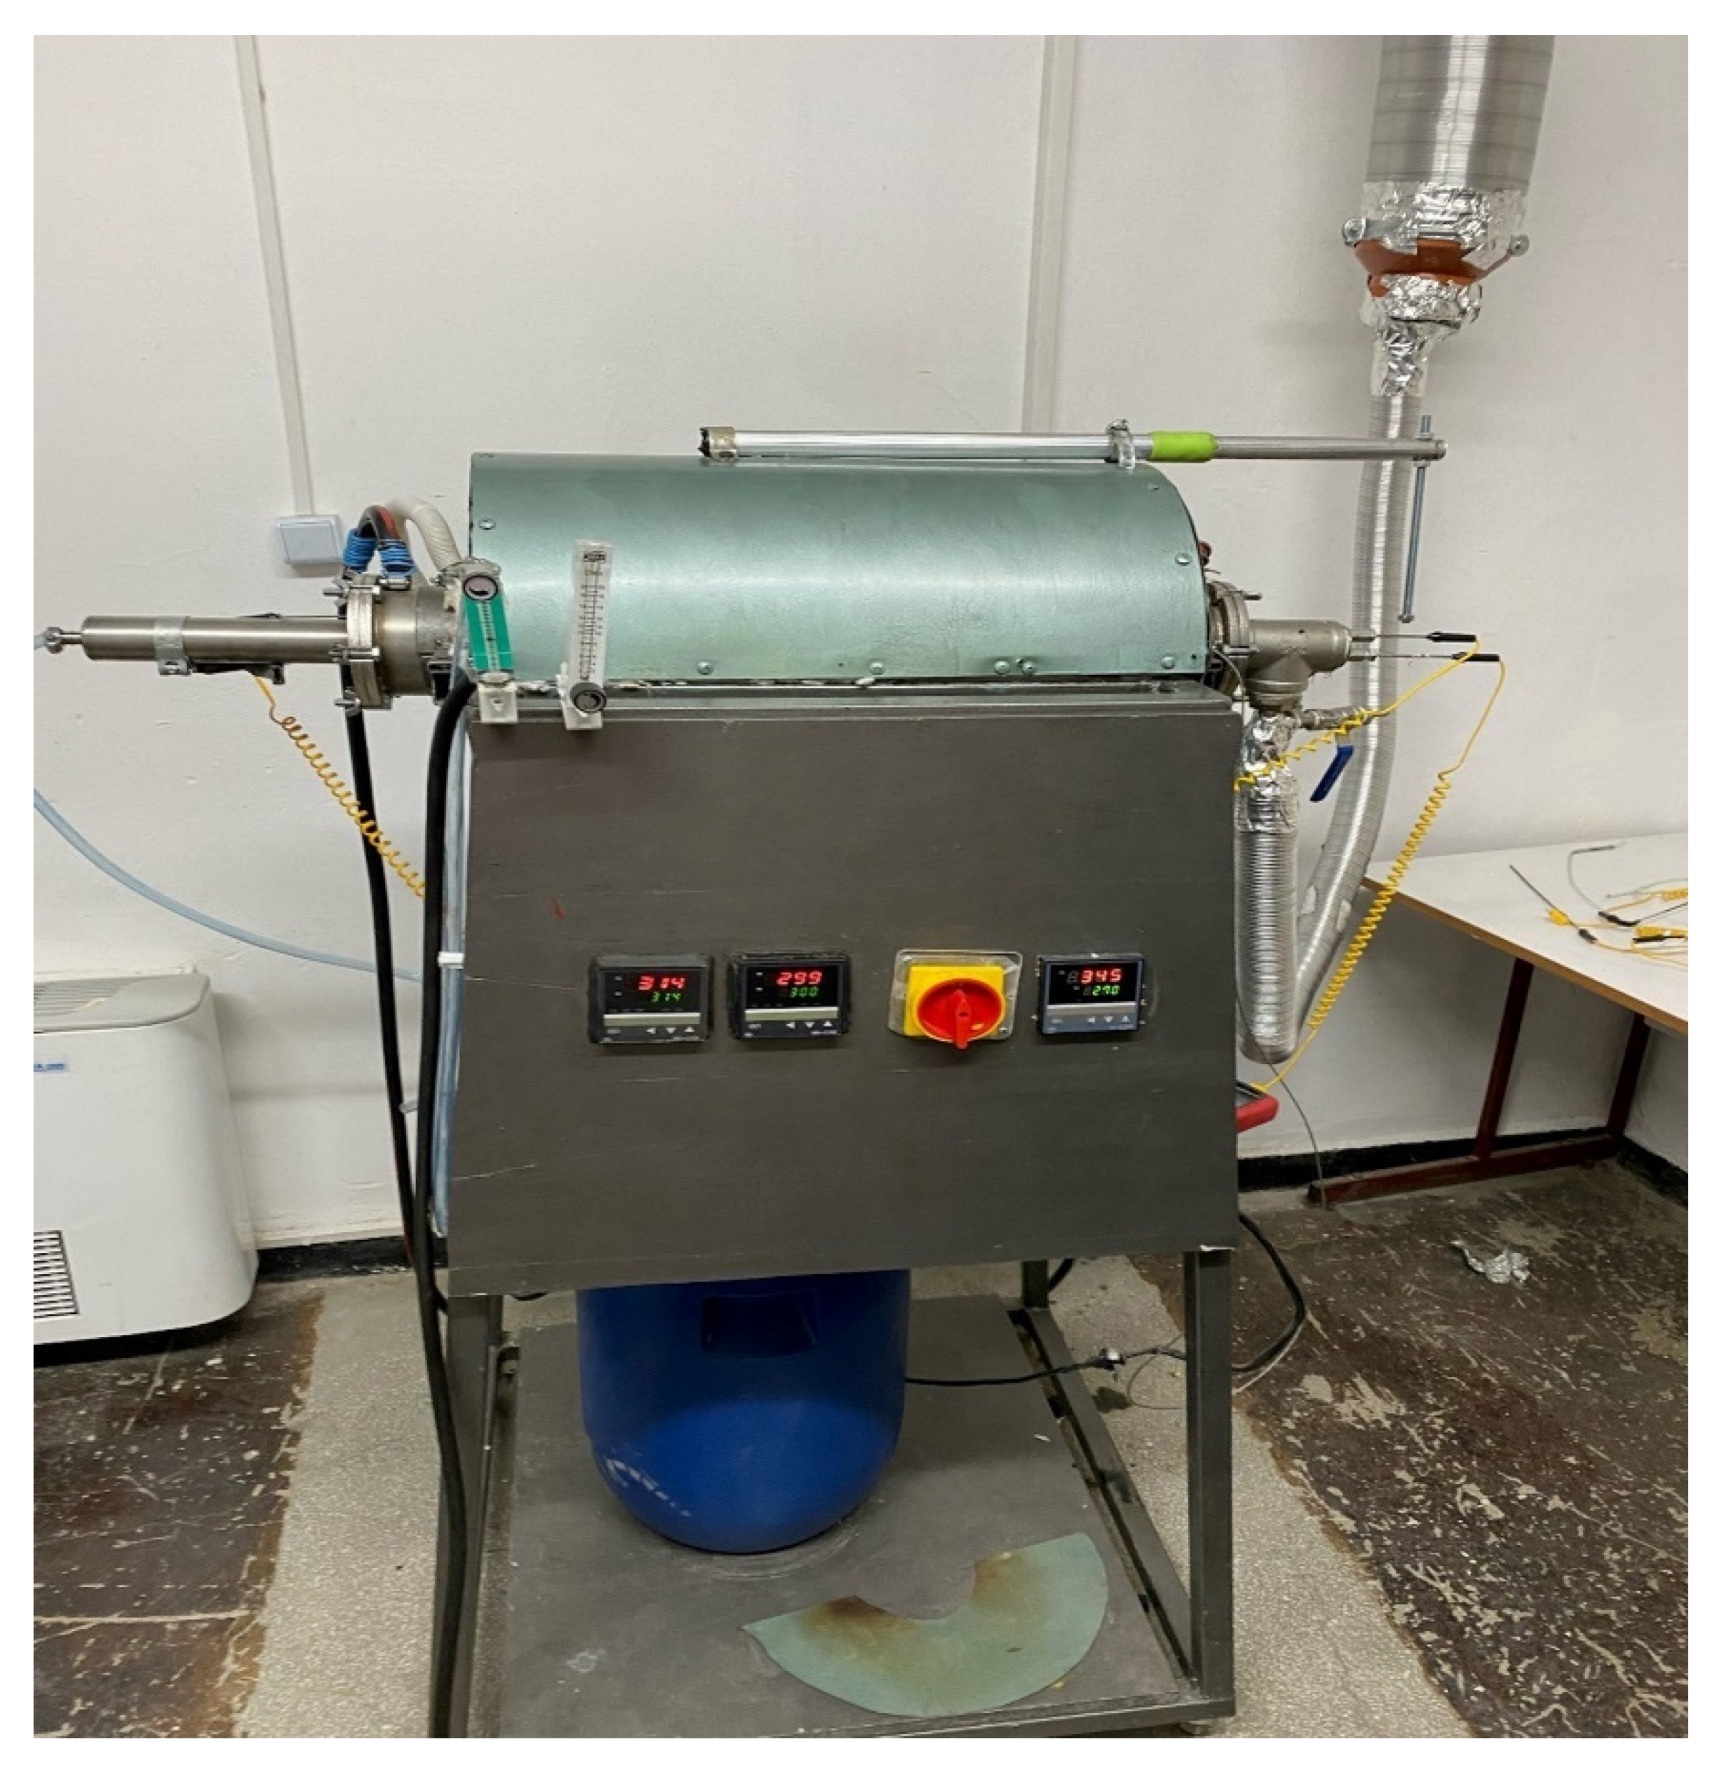
The maximum operating temperature in the reaction zone is up to 1200 °C. А picture of the reactor is shown in
Figure 5.
2.3. Samples Preparation
The straw was ground into small fractions with a centrifugal knife grinder. Since the straw could be ignited, it was ground in cycles. After grinding, the sample particles were separated through a sieve with a mesh size of 1 mm.
About three grams of the ground straw with 1 mm or fewer particles were placed in a crucible of a predetermined size. To accurately determine the amount of the sample, the weight of the crucible was measured empty and after filling, using a digital Moisture Analyzer, Model DAB 100-3 (Kern & Sohn, GmbH, Balingen, Germany). Finally, the crucible with the straw sample was put in the middle of the reactor.
The reactor was heated using nitrogen from a bottle, and after reaching the desired temperature (300 °C, 400 °C or 500 °C), the sample was allowed to sit in the reactor below this temperature for 60 min. Only then the reactor was opened and gradually cooled to avoid the ignition of the sample. After reaching 60 °C, the sample was placed in a desiccator to separate any residual moisture. The sample was kept in the desiccator for 10 min, and its weight was measured again.
2.4. Plan of the Experiment
The plan of the conducted experiment is shown in
Table 1.
The wheat straw from each region was marked with a letter: “S” for Sandanski, “K” for Kavarna, and “P” for Pazardzhik. The straw samples from each region were subjected to three temperatures of the pyrolysis process: 300 °C, 400 °C, and 500 °C. The temperature was added to the sample coding. Thus, S300 means straw from the Sandanski region, processed at a temperature of 300 °C.
The measurements were performed at the College of Energy and Electronics, Technical University of Sofia.
2.5. Performed Measurements of the Biochar
2.5.1. Determination of Moisture Content
The moisture content of the samples was determined following ISO 18134-3:2015 [
30]. A sample of solid biochar with a specified mass was heated to 105 ± 2 °C according to ISO 14780:2017 [
31]. The moisture content was represented by the mass fraction of analytical moisture, expressed in relative units (wt. %). The calculations were based on the weight loss of the sample until a constant mass was reached.
The moisture in the test sample was determined following the equation:
where m
1 is the mass of the empty container, g; m
2 is the mass of the full container before heating/drying, g; m
3 is the mass of the full container after heating/drying, g.
2.5.2. Determination of Volatile Substances Content
The existence of volatile substances was determined following the EN ISO 18122: 2015 standard [
32]. The sample was heated in the absence of air at 900 ± 10 °C for 7 min. The results were presented in relative units (wt.%).
The following equation was used to calculate of the volatile substances V
d, wt. %:
where m
1 is the mass of the empty crucible and lid, g; m
2 is the mass of the full crucible and lid before heating, g; m
3 is the mass of the full crucible and lid after heating, g.
2.5.3. Determination of the Ash Content
The ash content of the dry mass of the biochar was determined following ISO 18122:2015 [
32]. The sample was heated to 550 ± 10 °C under controlled conditions (free air access, heating rate). The amount of ash A
d was determined in wt. % following the expression:
where m
1 is the mass of the empty crucible, g; m
2 is the mass of the full crucible, g; m
3 is the mass of the crucible and ash, g.
2.5.4. Determination of the Fixed Carbon Content
The fixed carbon content C
fix was determined in wt. % using the expression:
2.5.5. Determination of the Joint Ash and Carbon Content
The joint ash and carbon content A&C was calculated in wt. % using the expression:
where m
1 is the mass of the empty crucible, g; m
2 is the mass of the full crucible, g; m
3 is the mass of the crucible and ash, g; φ
a is the humidity of the samples.
2.5.6. Determination of the Main Chemical Elements and Compounds in the Biochar
The samples were analyzed using the p-XRF S1 Titan Spectrometer of Bruker (USA) in the Centre of Archeometry, Laboratory of Conservation and Restoration. Internal Calibration of the Spectrometer (Rh-tube, Peltier cooling, 30 mm2, Si-drift detector (SDD), MnKα resolution 150 eV, collimator 0.1 mm to 1.5 mm) was used (respectively Application Geo Chem, Method Dual Mining) for 60 s. Additionally, some samples were measured using a Bruker M1 MISTRAL Micro-XRF spectrometer (Bruker, San Jose, CA, USA). The results are presented as an arithmetic mean (in wt. %) of three measurements on each sample.
3. Results
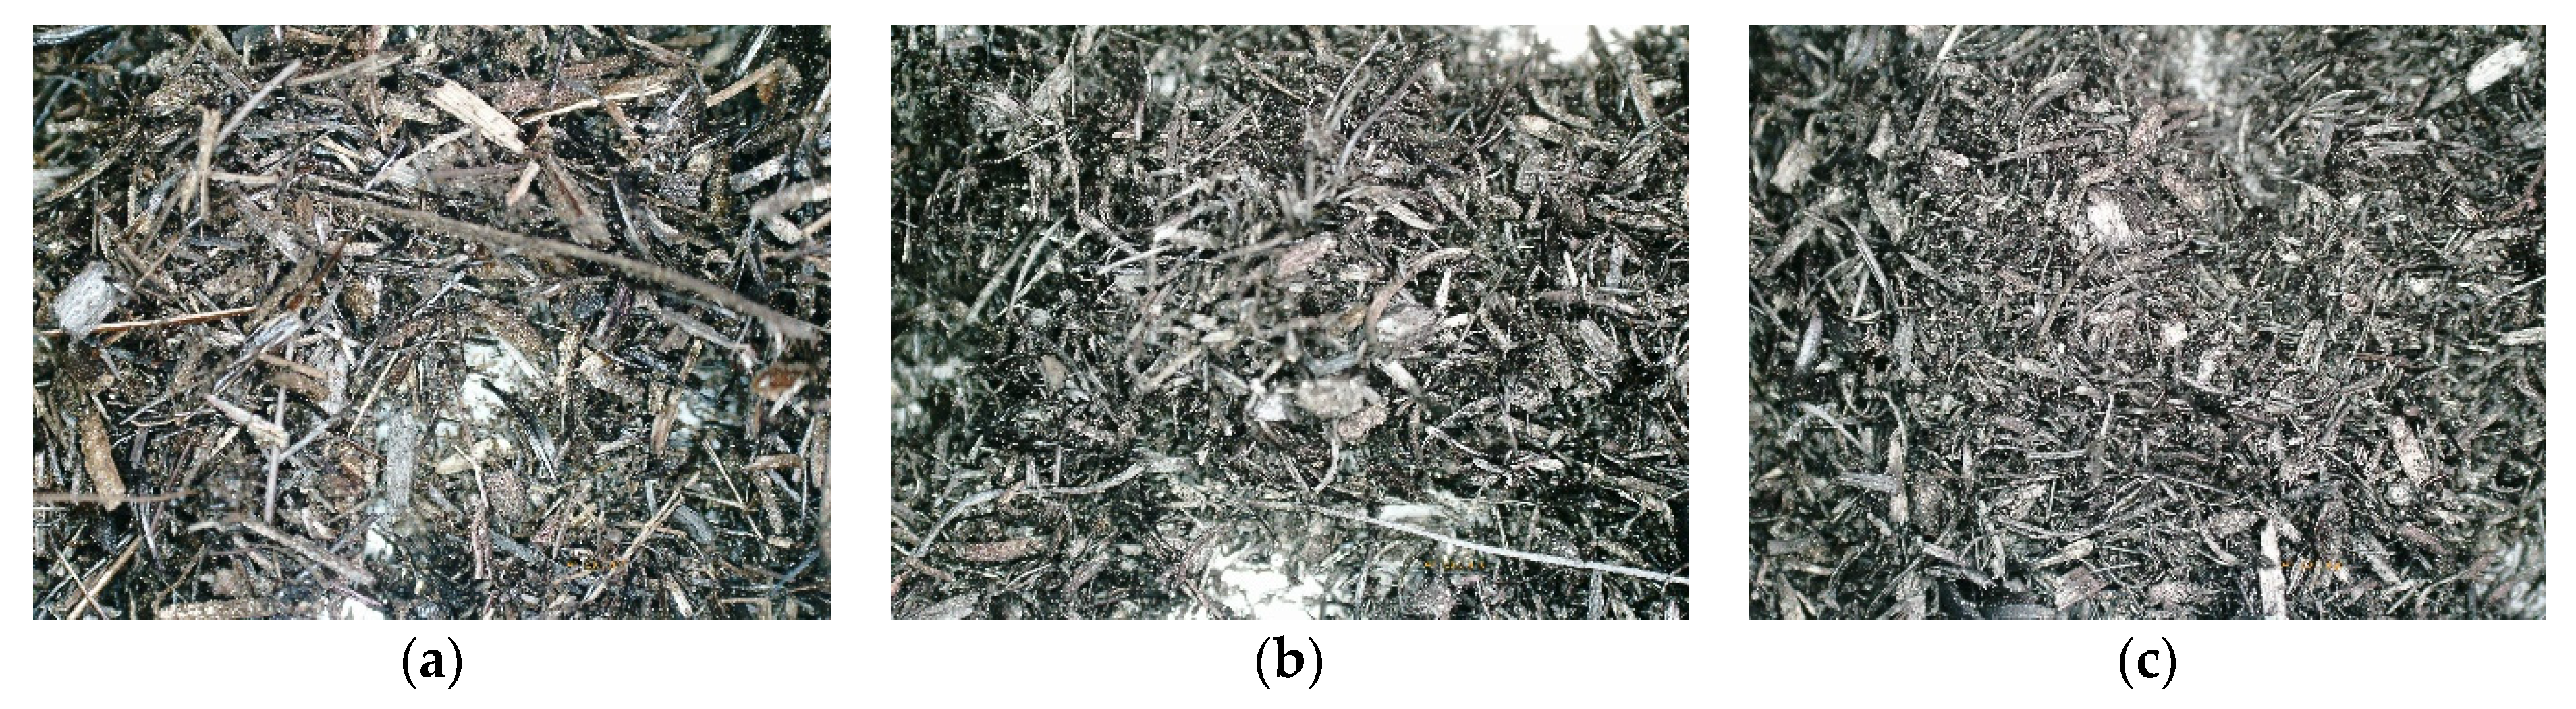
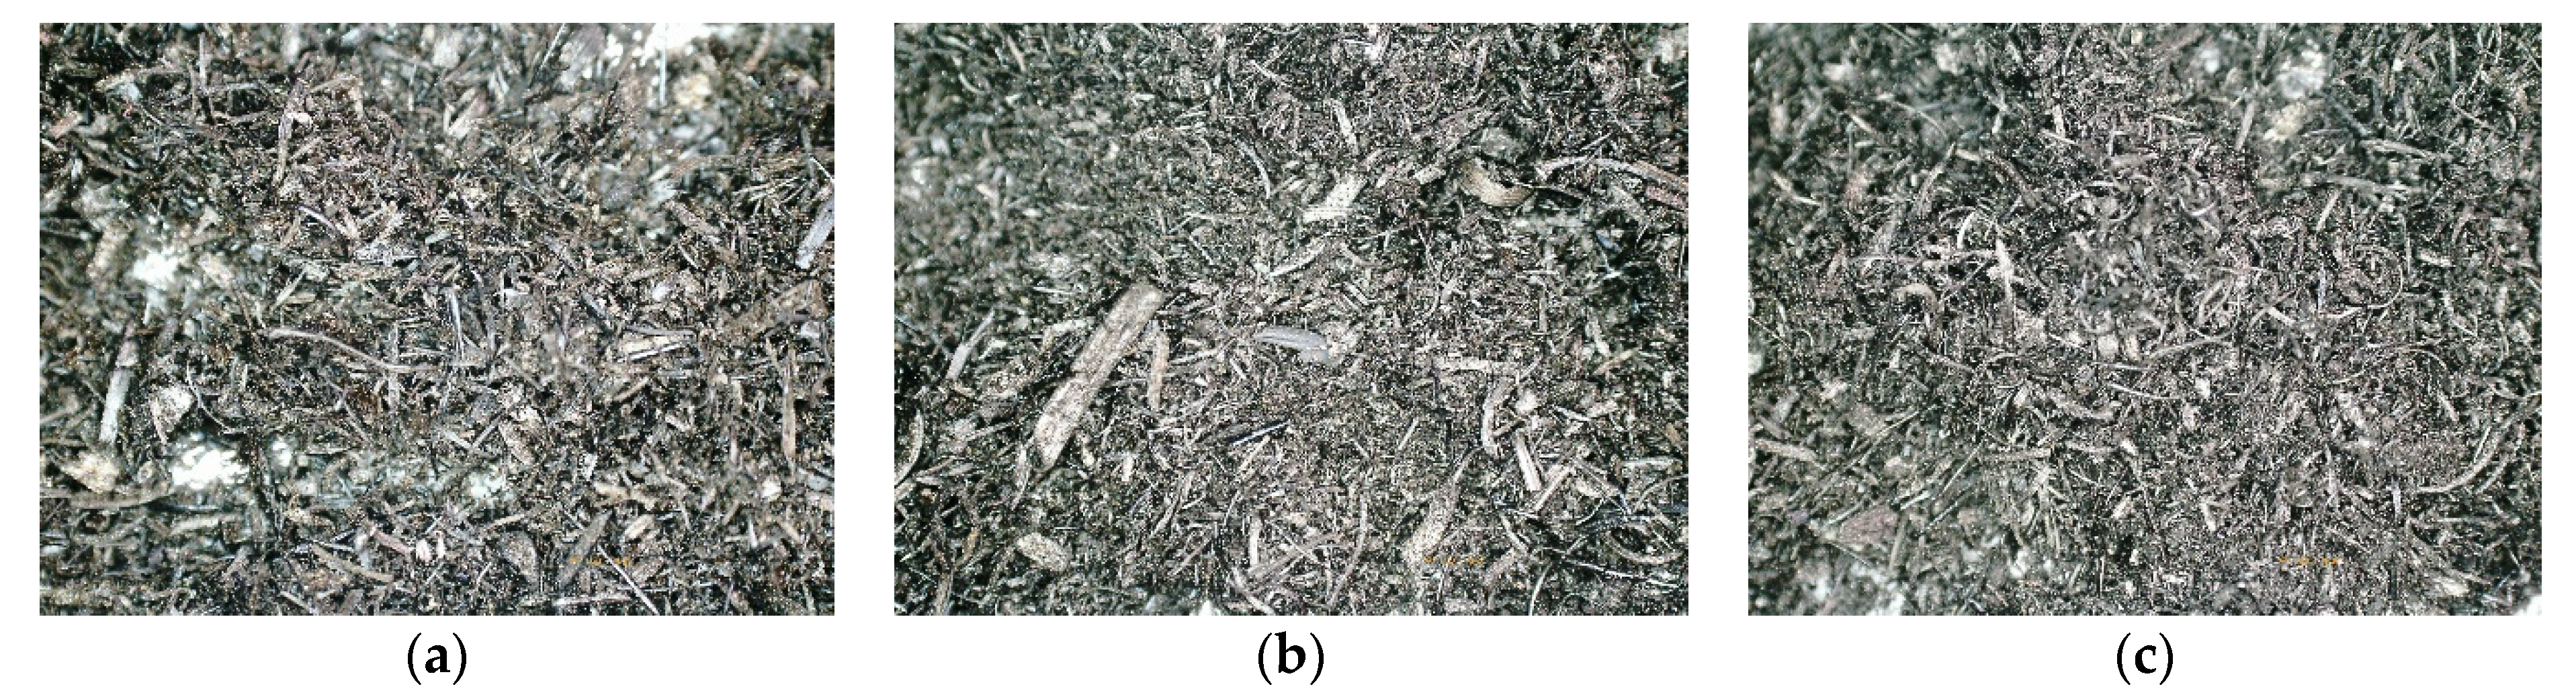
Figure 7,
Figure 8 and
Figure 9 present microscopic pictures of the nine versions of biochar obtained from wheat straw via pyrolysis.
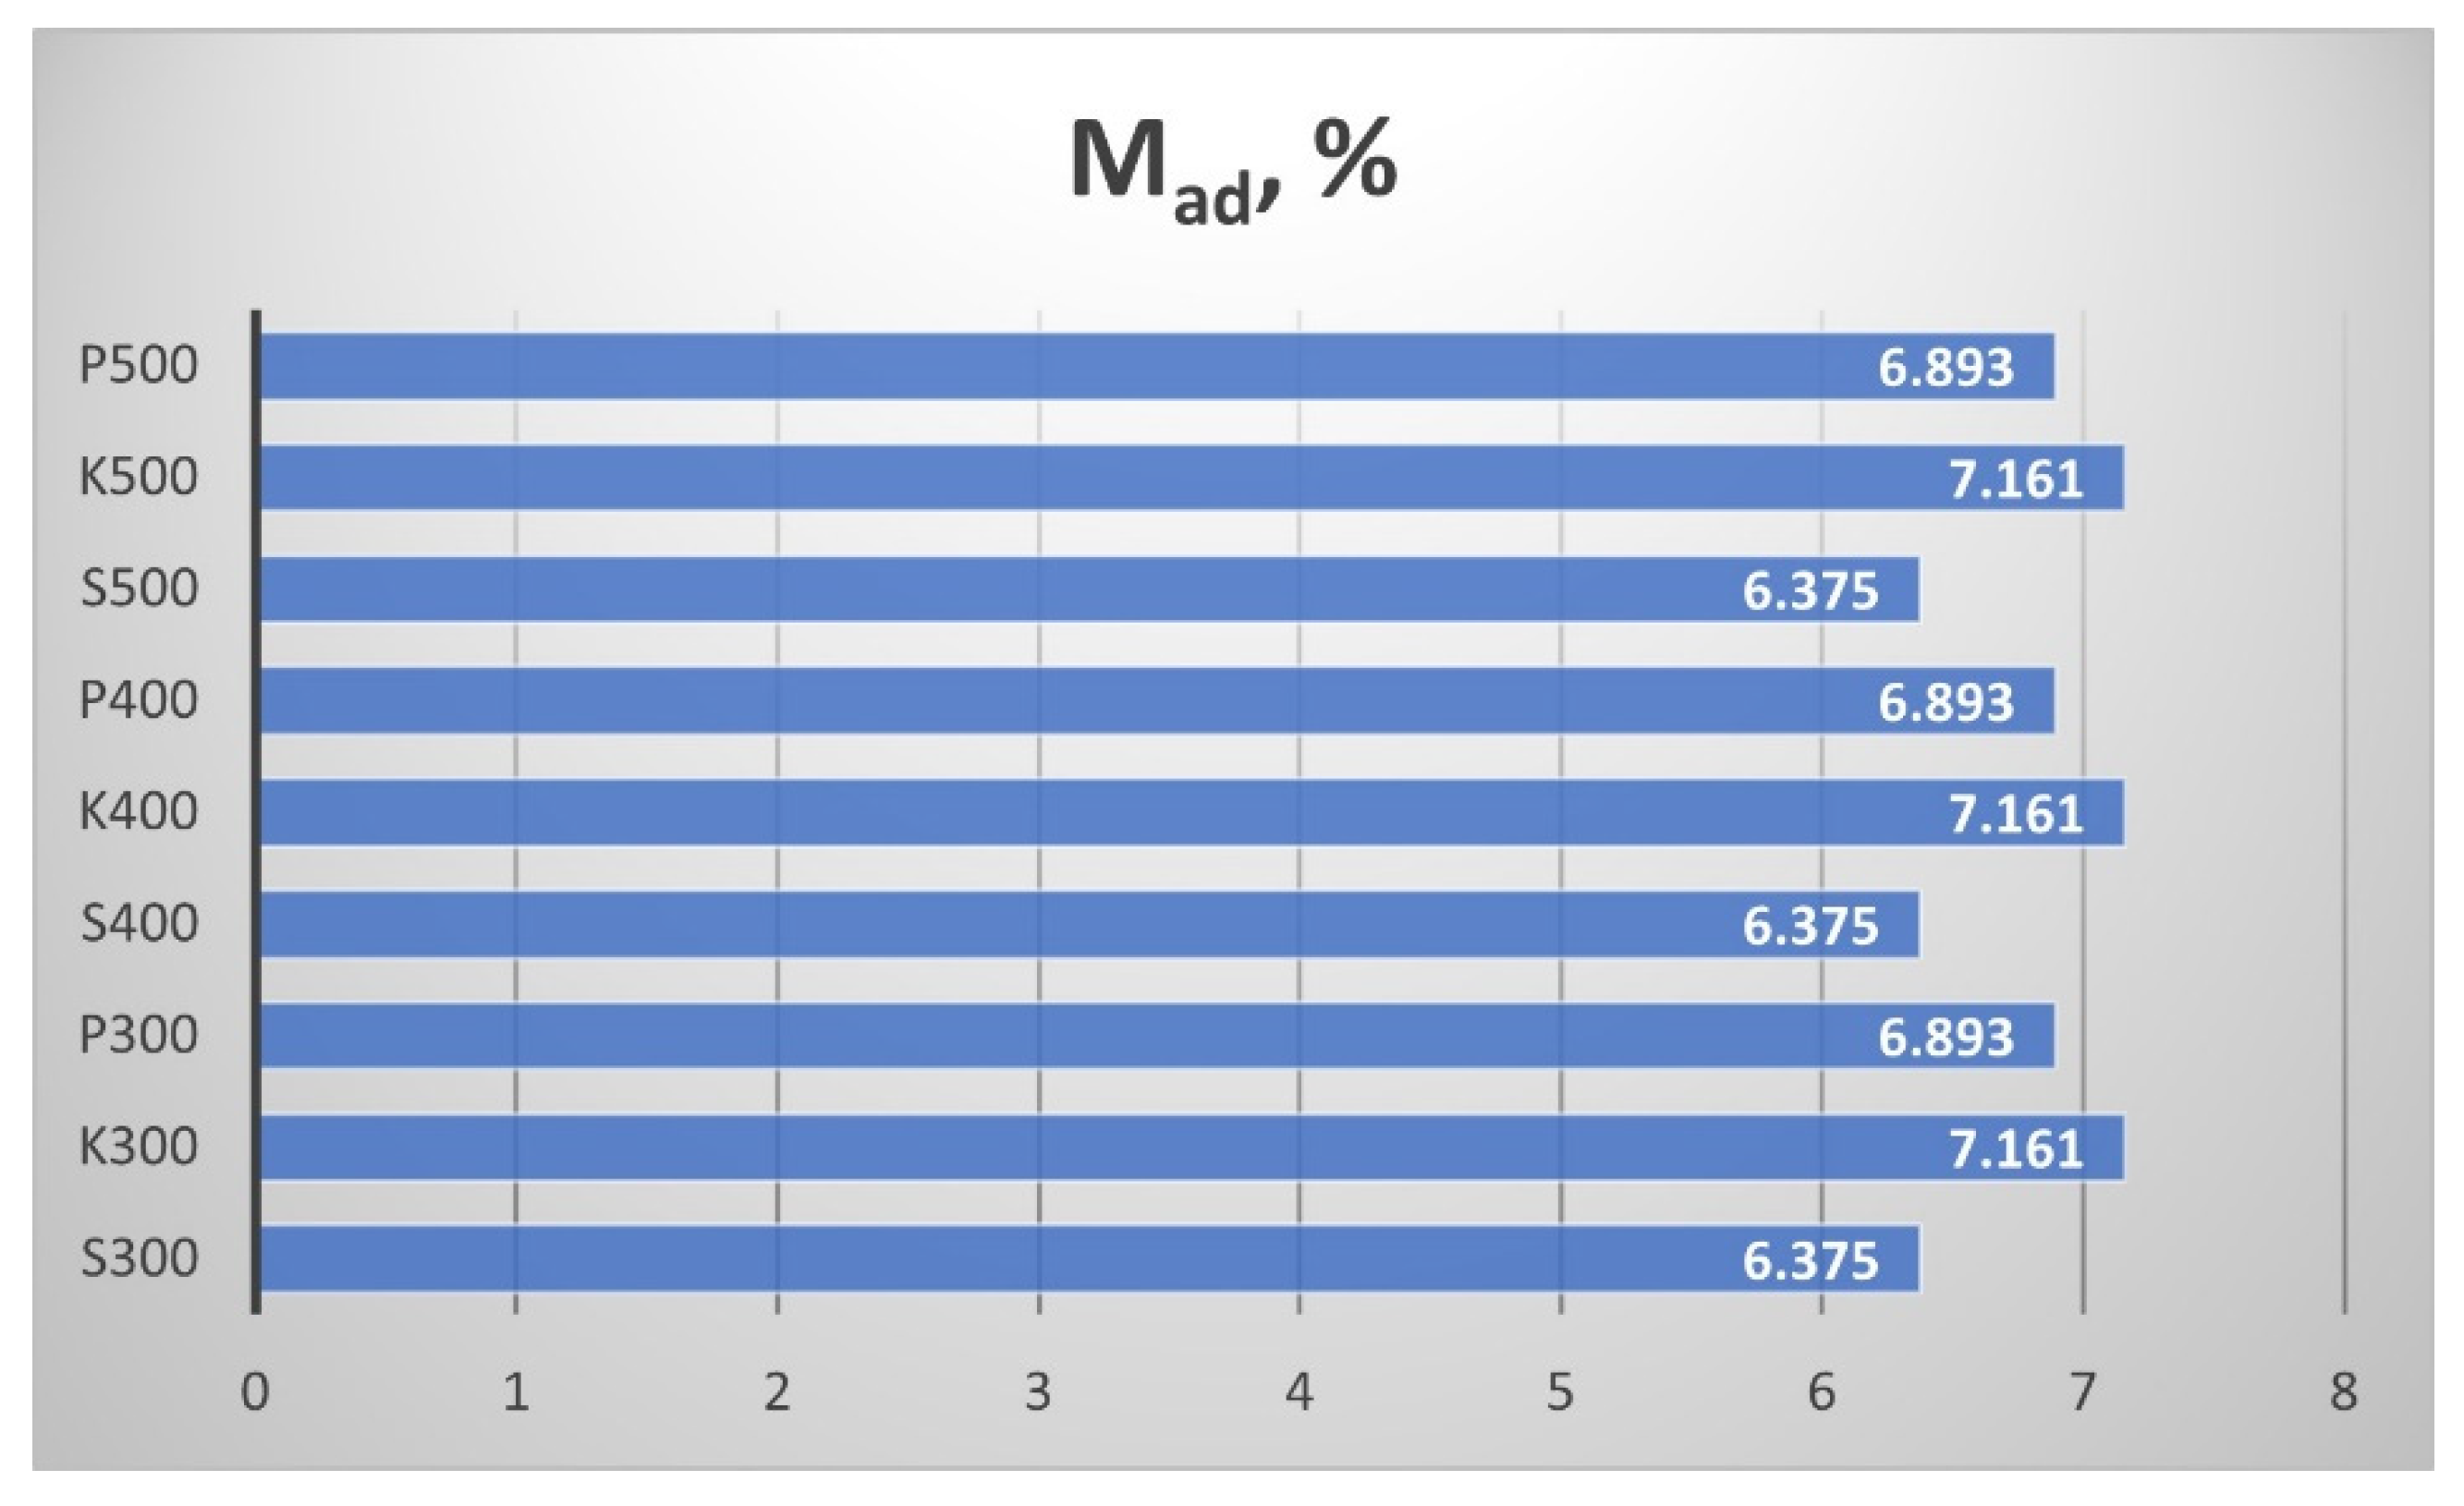
Figure 10 presents the results from determining the moisture content M
ad of the produced biochar. The moisture content of all biochar samples was in the range of 6.4 ÷ 7.2 wt. %. In fact, the temperature increment of the pyrolysis process in the interval 300 ÷ 500 °C did not affect the moisture content of the resulting straw biochar from the particular region.
Figure 11 shows the content of volatile substances V
d. All biochar samples had a high content of volatile compounds, despite the straw region and the pyrolysis temperature. The temperature of the process influenced V
d: the content in the biochar slightly increased with the higher temperatures.
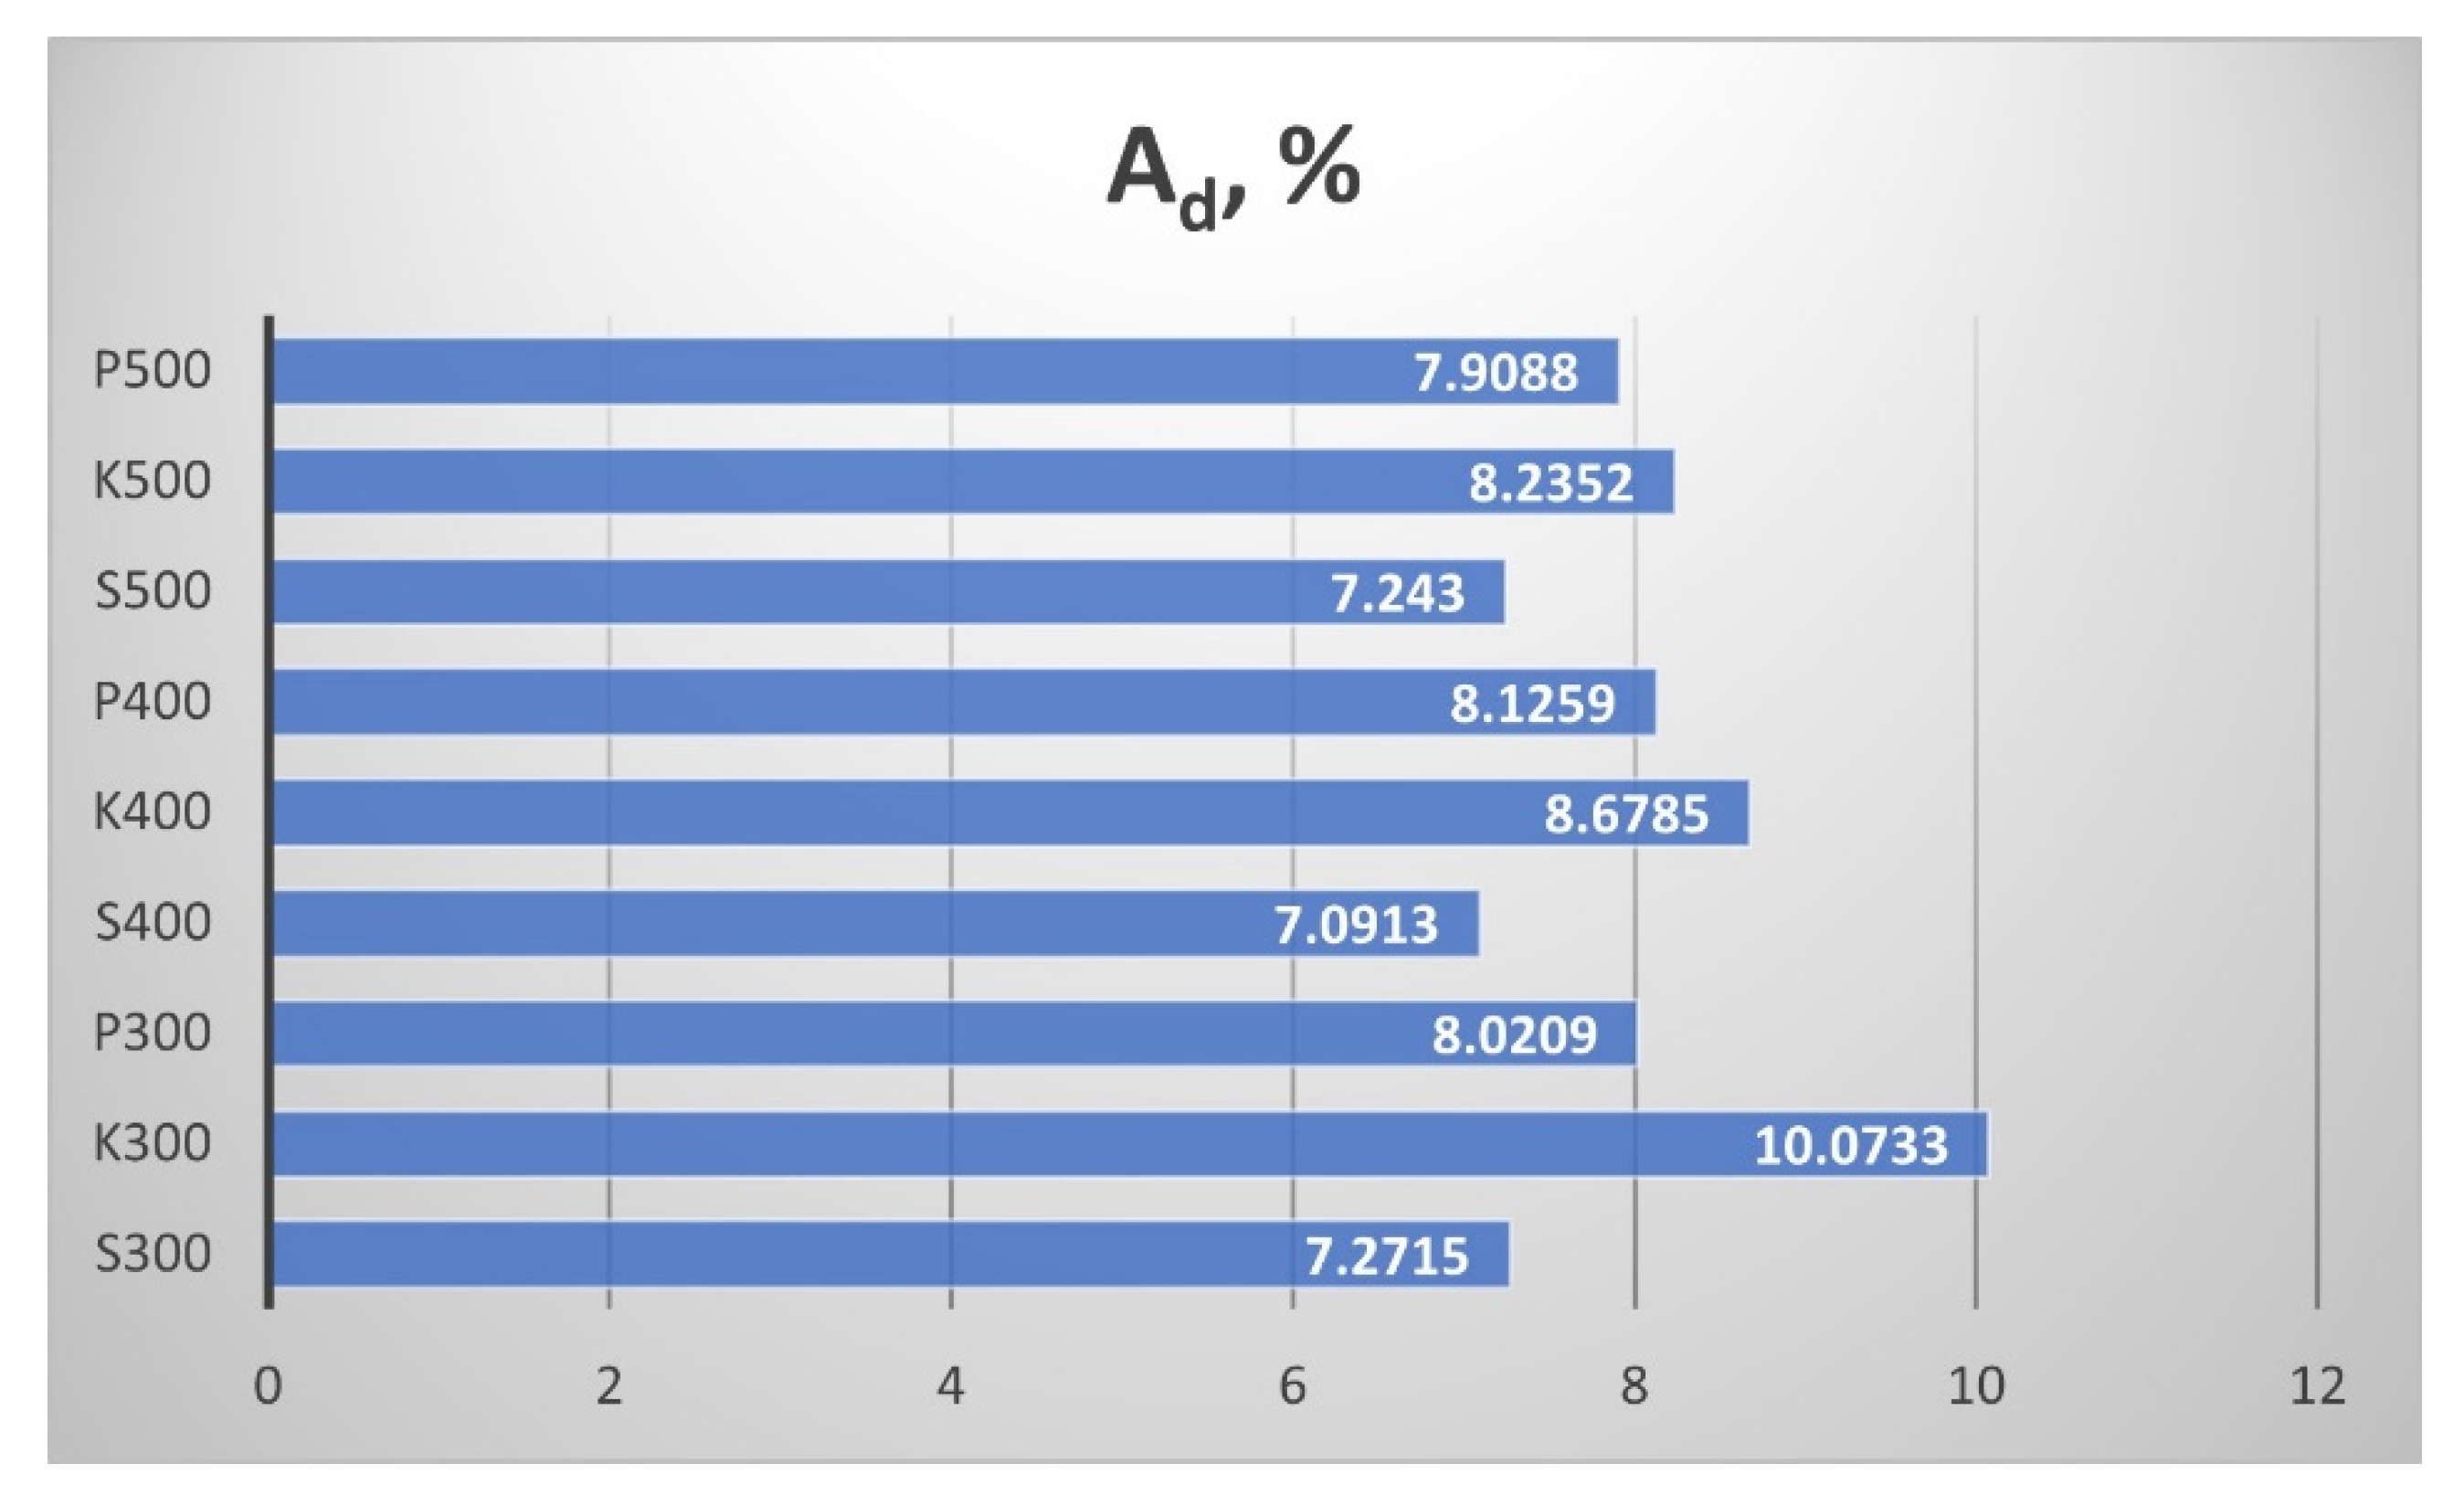
The ash content A
d in the biochar samples is presented in
Figure 12. The ash content slightly decreased with the increment of the pyrolytic temperature from 300 °C to 500 °C. The highest ash content had the straw biochar from the samples from Kavarna.
The results from the determination of the fixed carbon content C
fix are summarized in
Figure 13. Тhe straw samples had a different behavior when the pyrolytic temperature increased. The C
fix of the samples from Sandanski and Pazardzhik increased with the rise of the process temperature from 300 °C to 400 °C, but at 500 °C they decreased. Nevertheless, the fixed carbon content raised continuously with the increment of the temperature in the samples from Kavarna. In general, C
fix remained in the range of 7.5–12 wt. % in all biochar samples.
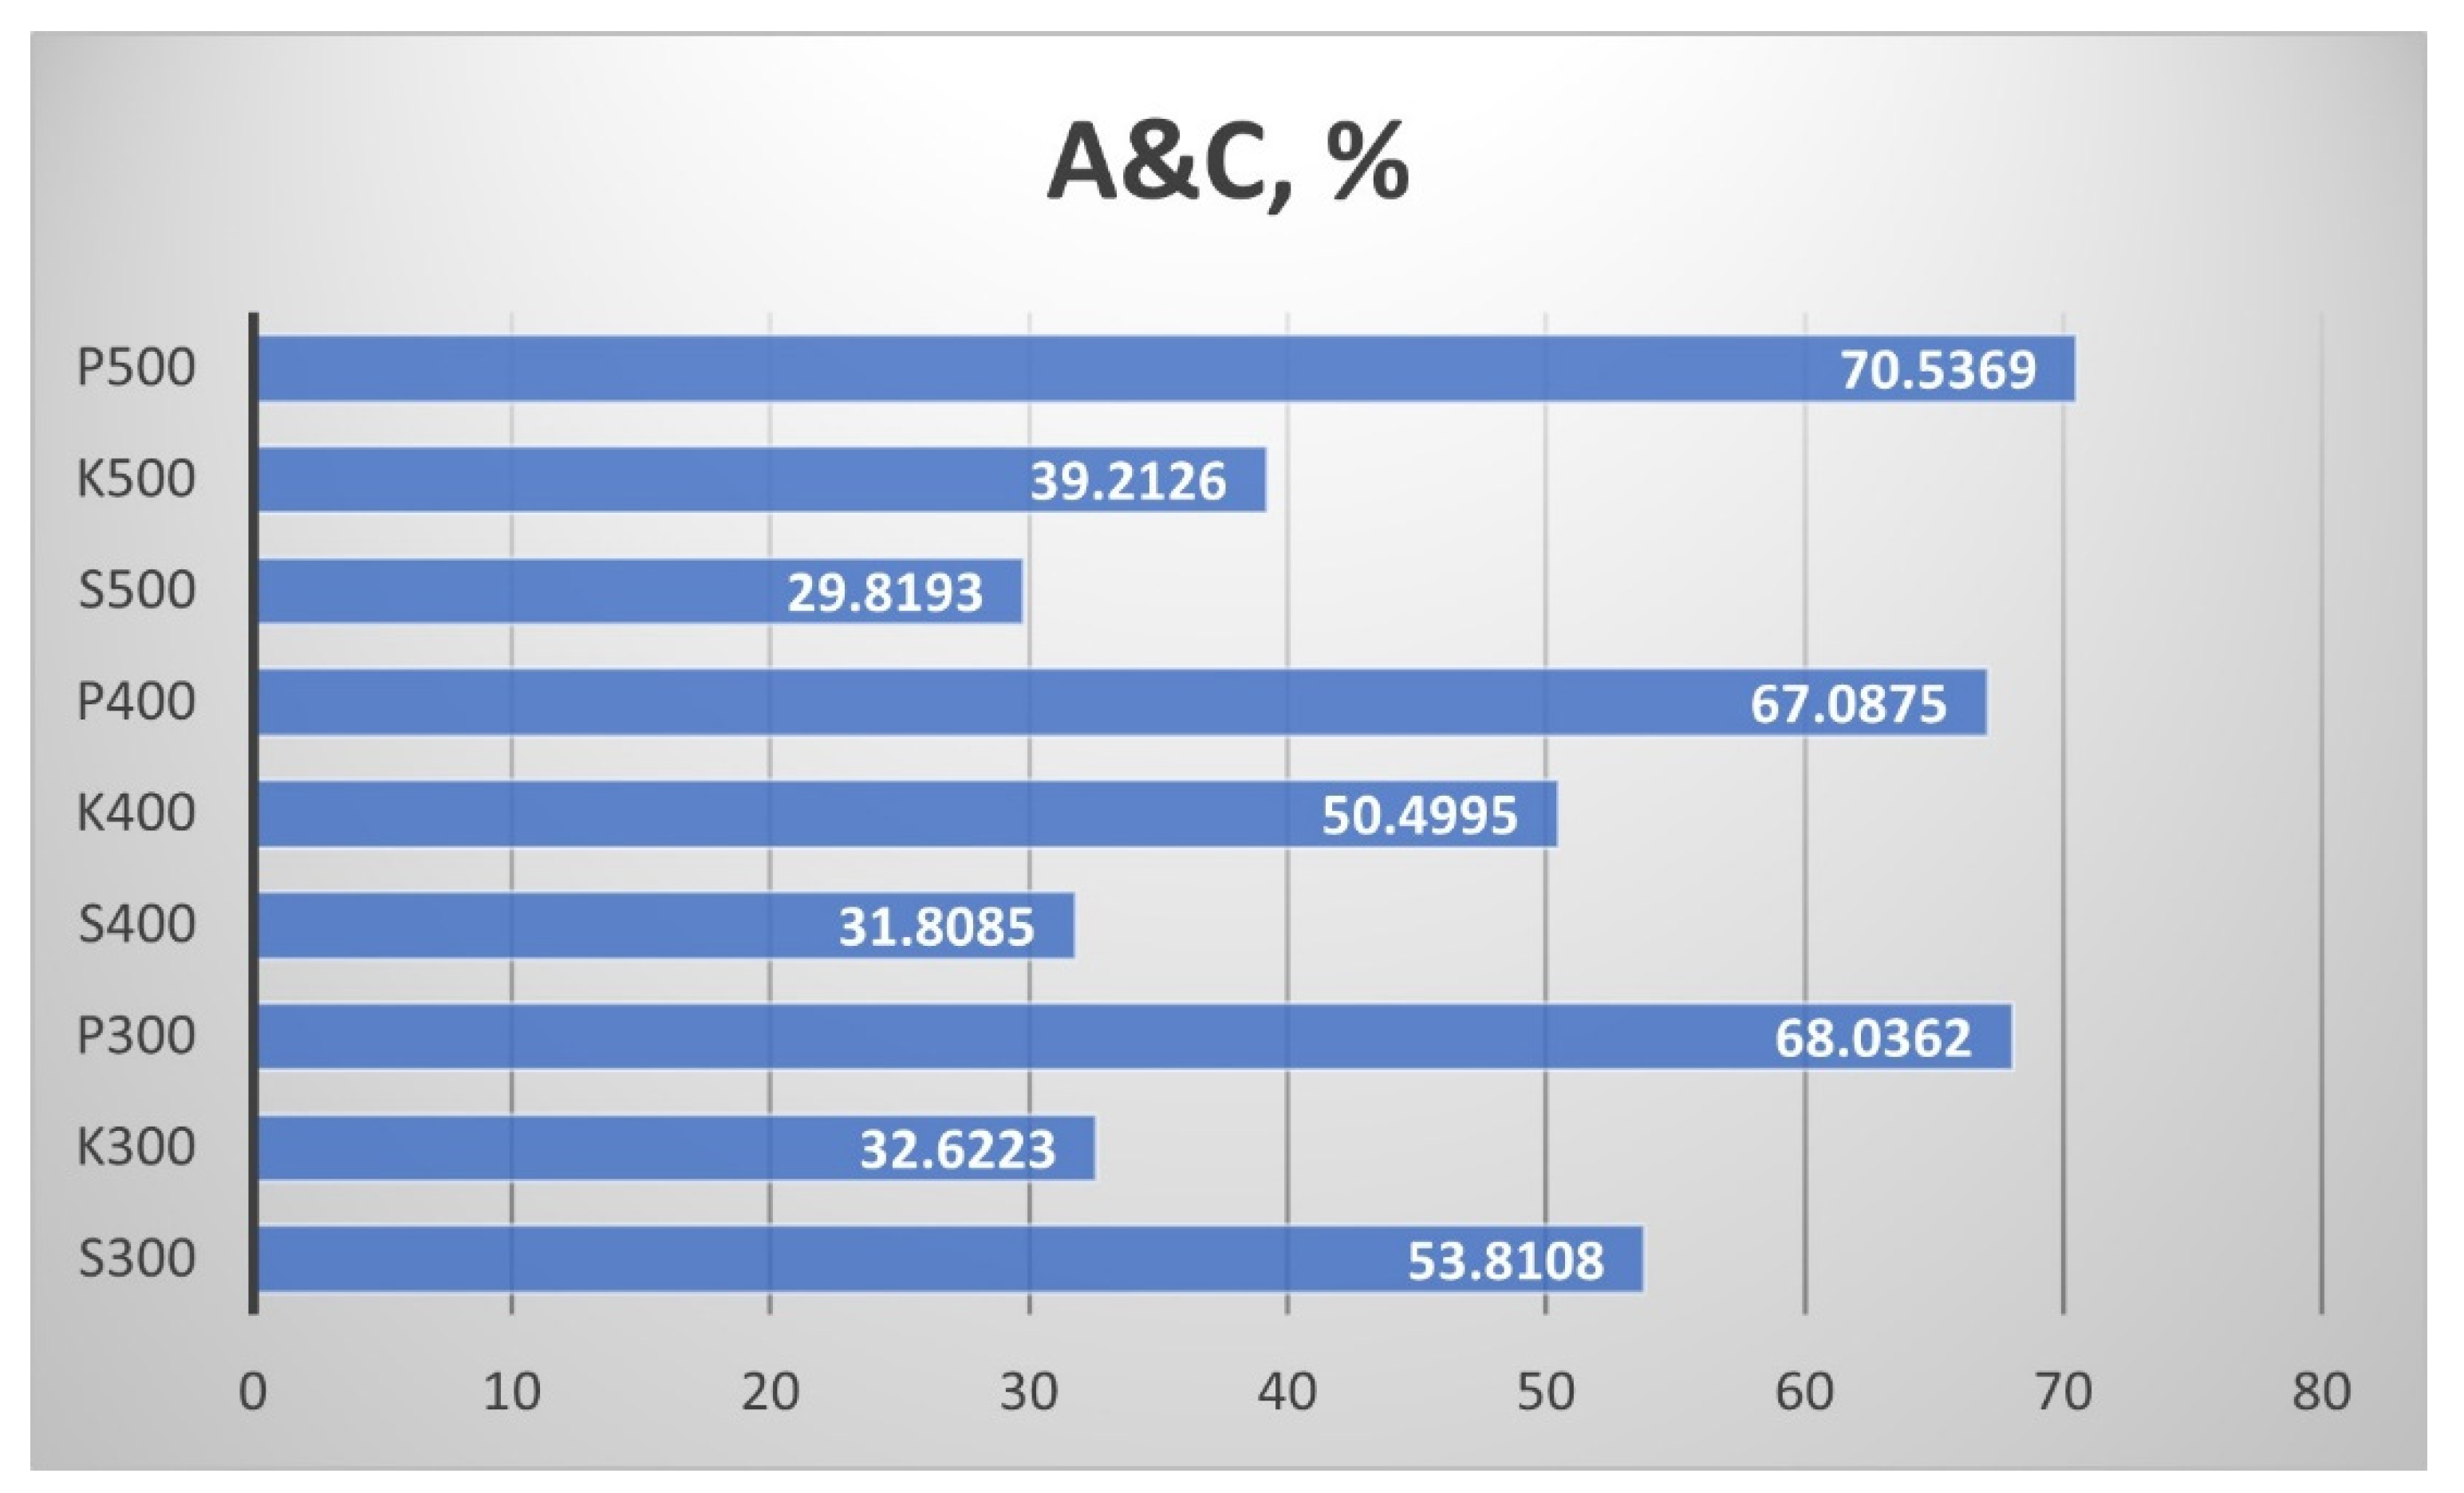
Figure 14 shows the results for the joint content of ash and carbon A&C. While the straw biochar from Pazardzhik had highest values of A&C, the biochar from Sandanski had the lowest. In the samples from Sandanski, the maximum A&C is obtained at a temperature of 300 °C, and then the joint ash and carbon content significantly decreased. The other samples showed an increase in A&C with the pyrolytic temperature rise, but the change in the biochar from Kavarna was more significant than in the samples from Pazardzhik. The influence of the temperature of the process was the least for the straw samples from Pazardzhik. The influence of the temperature of the process was the least for the straw samples from Pazardzhik.
Figure 15,
Figure 16,
Figure 17,
Figure 18,
Figure 19,
Figure 20,
Figure 21,
Figure 22,
Figure 23,
Figure 24,
Figure 25,
Figure 26,
Figure 27,
Figure 28 and
Figure 29 present results from the spectrometry of the obtained nine samples of biochar. The following elements in the biochar composition were measured: aluminium oxide Al
2O
3 (
Figure 15), silicon dioxide SiO
2 (
Figure 16), phosphorus pentoxide P
2O
5 (
Figure 17), sulphur s (
Figure 18), chlorine (
Figure 19), potassium oxide K
2O (
Figure 20), calcium oxide CaO (
Figure 21), titanium dioxide TiO2 (
Figure 22), vanadium V (
Figure 23), ferric oxide Fe
2O
3 (
Figure 24), nickel Ni (
Figure 25), copper Cu (
Figure 26), zinc Zn (
Figure 27), strontium Sr (
Figure 28), and p alladium Pd (
Figure 29).
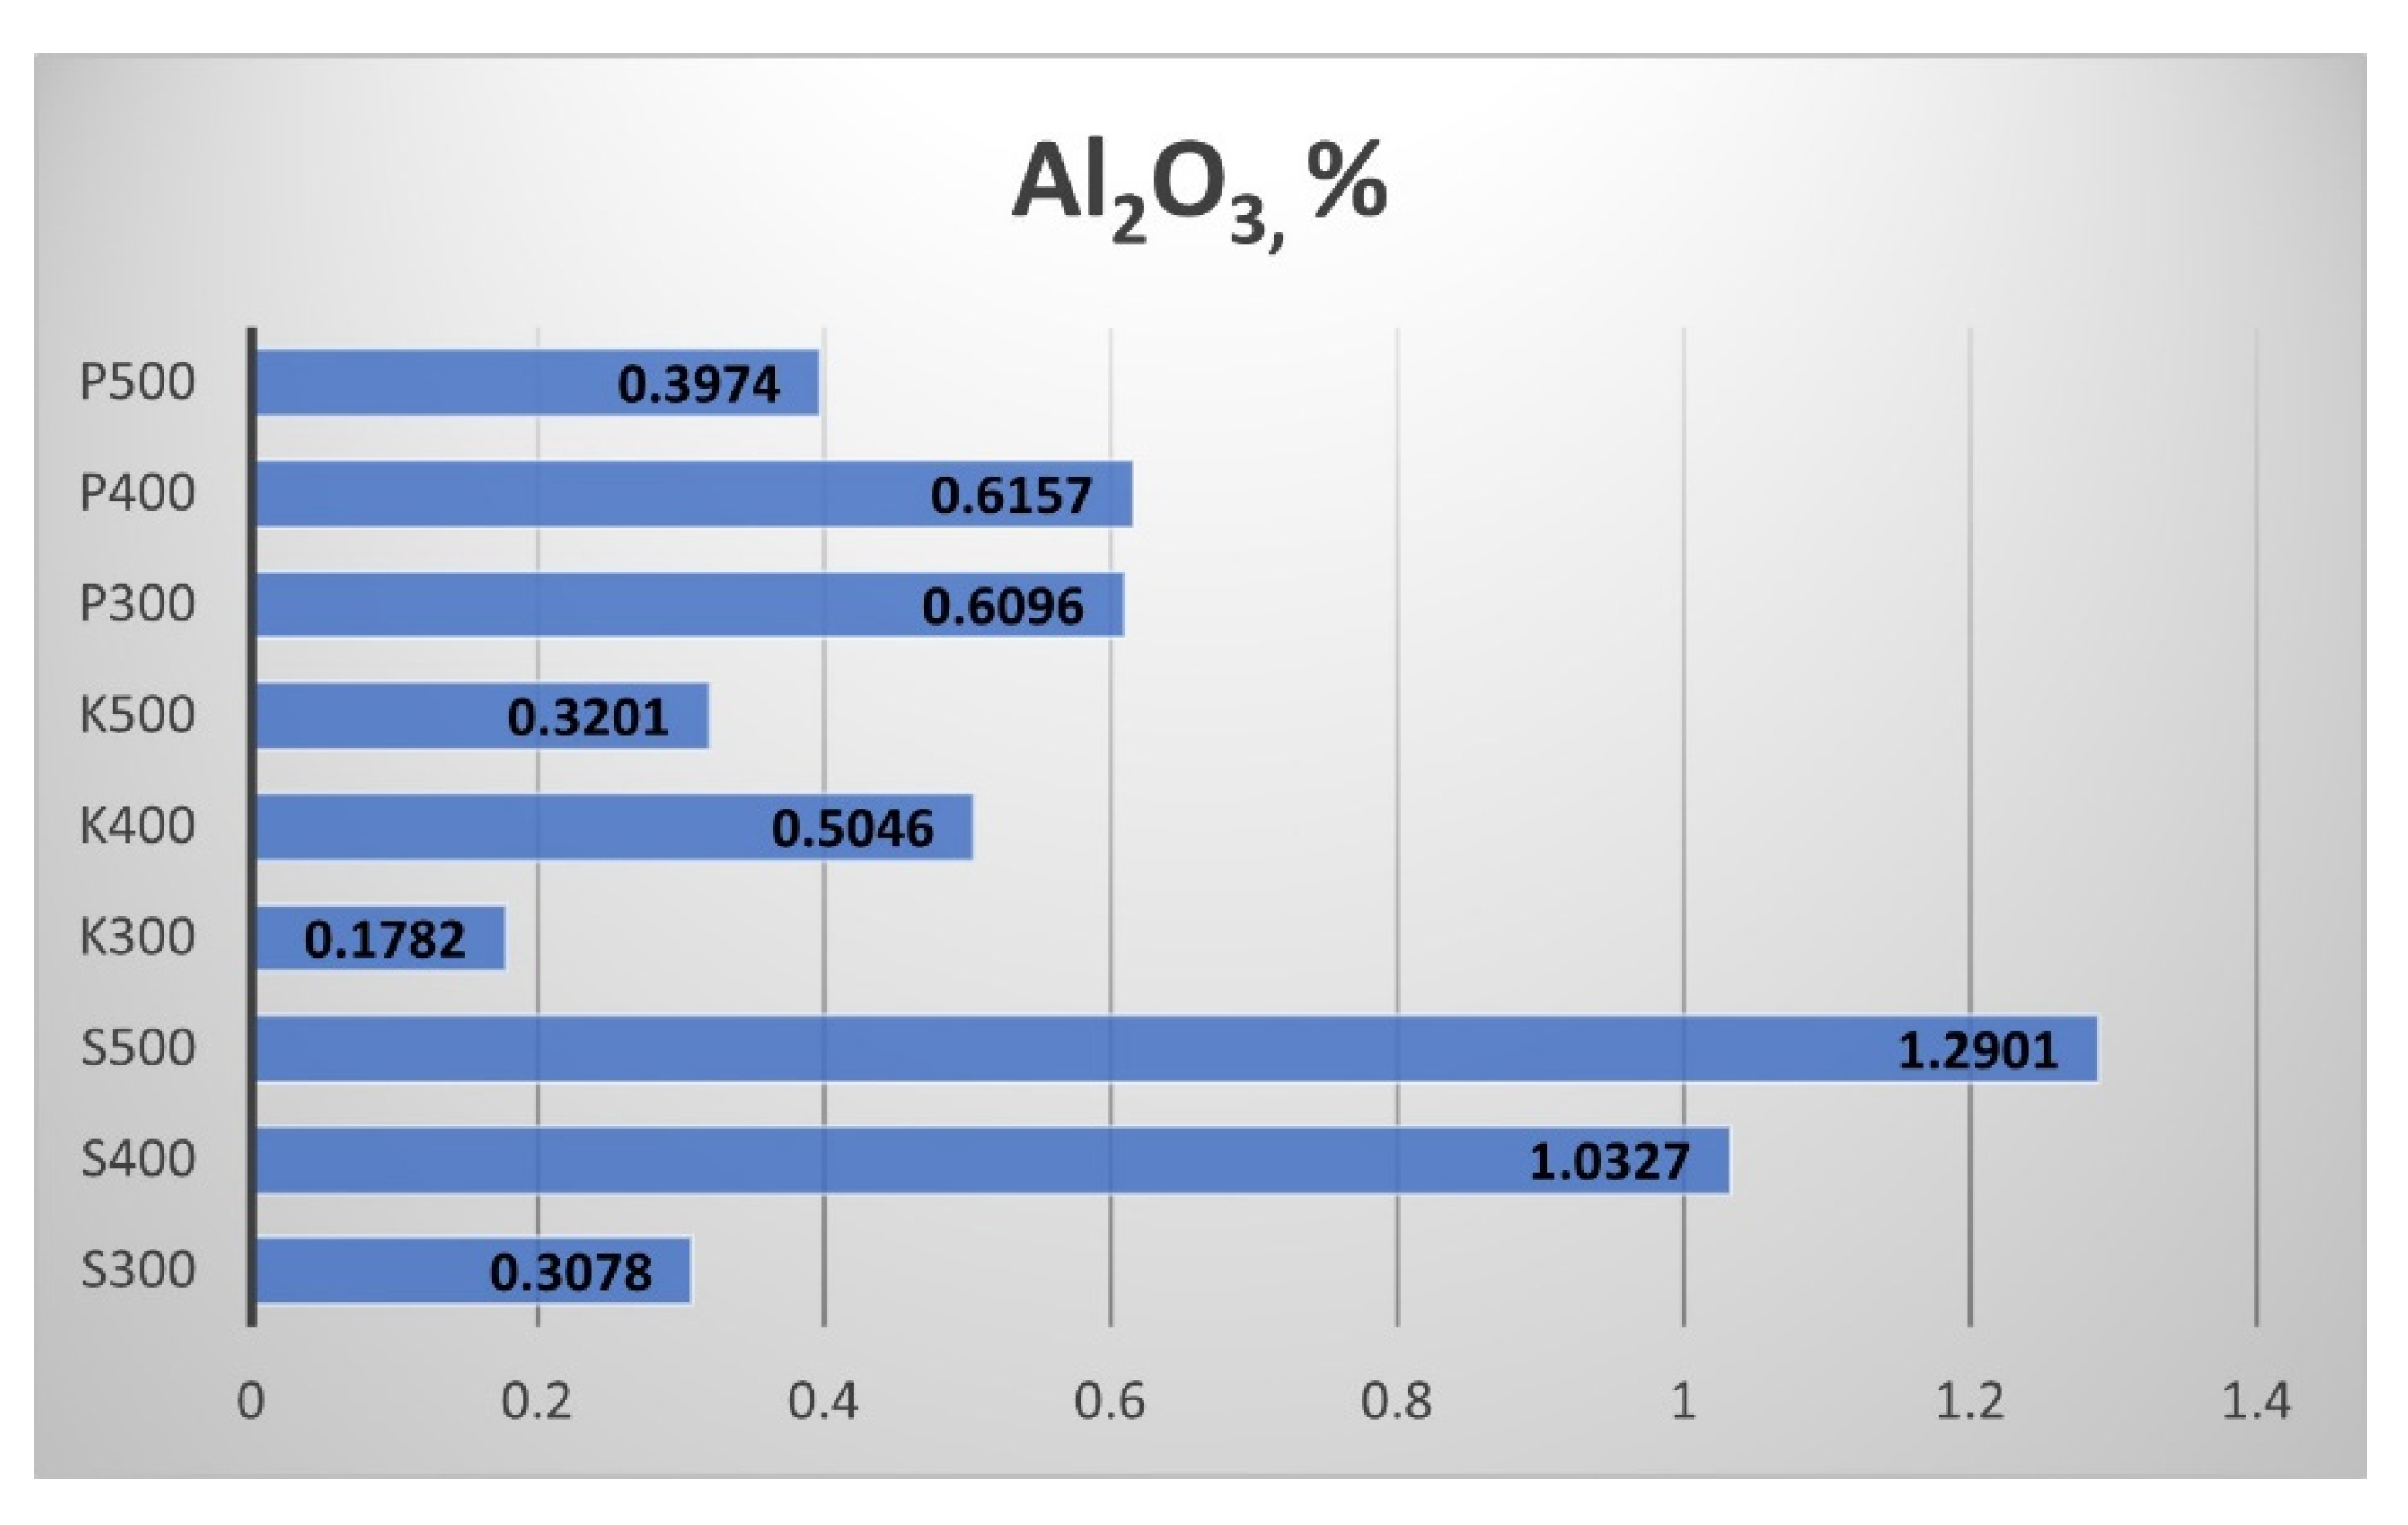
The Aluminium oxide (Al
2O
3) results in
Figure 15 show that the straw biochar from Sandanski the highest content, and the biochar from Kavarna had the lowest. The pyrolytic temperature had influenced the Al
2O
3 content leading to an increment from 300 to 400 °C and a decrement from 400 °C to 500 °C. The samples from Sandanski were an exception, as the rise of the pyrolytic temperature from 300 °C to 500 °C provoked a continuous increase of the Al
2O
3 content of the produced biochar.
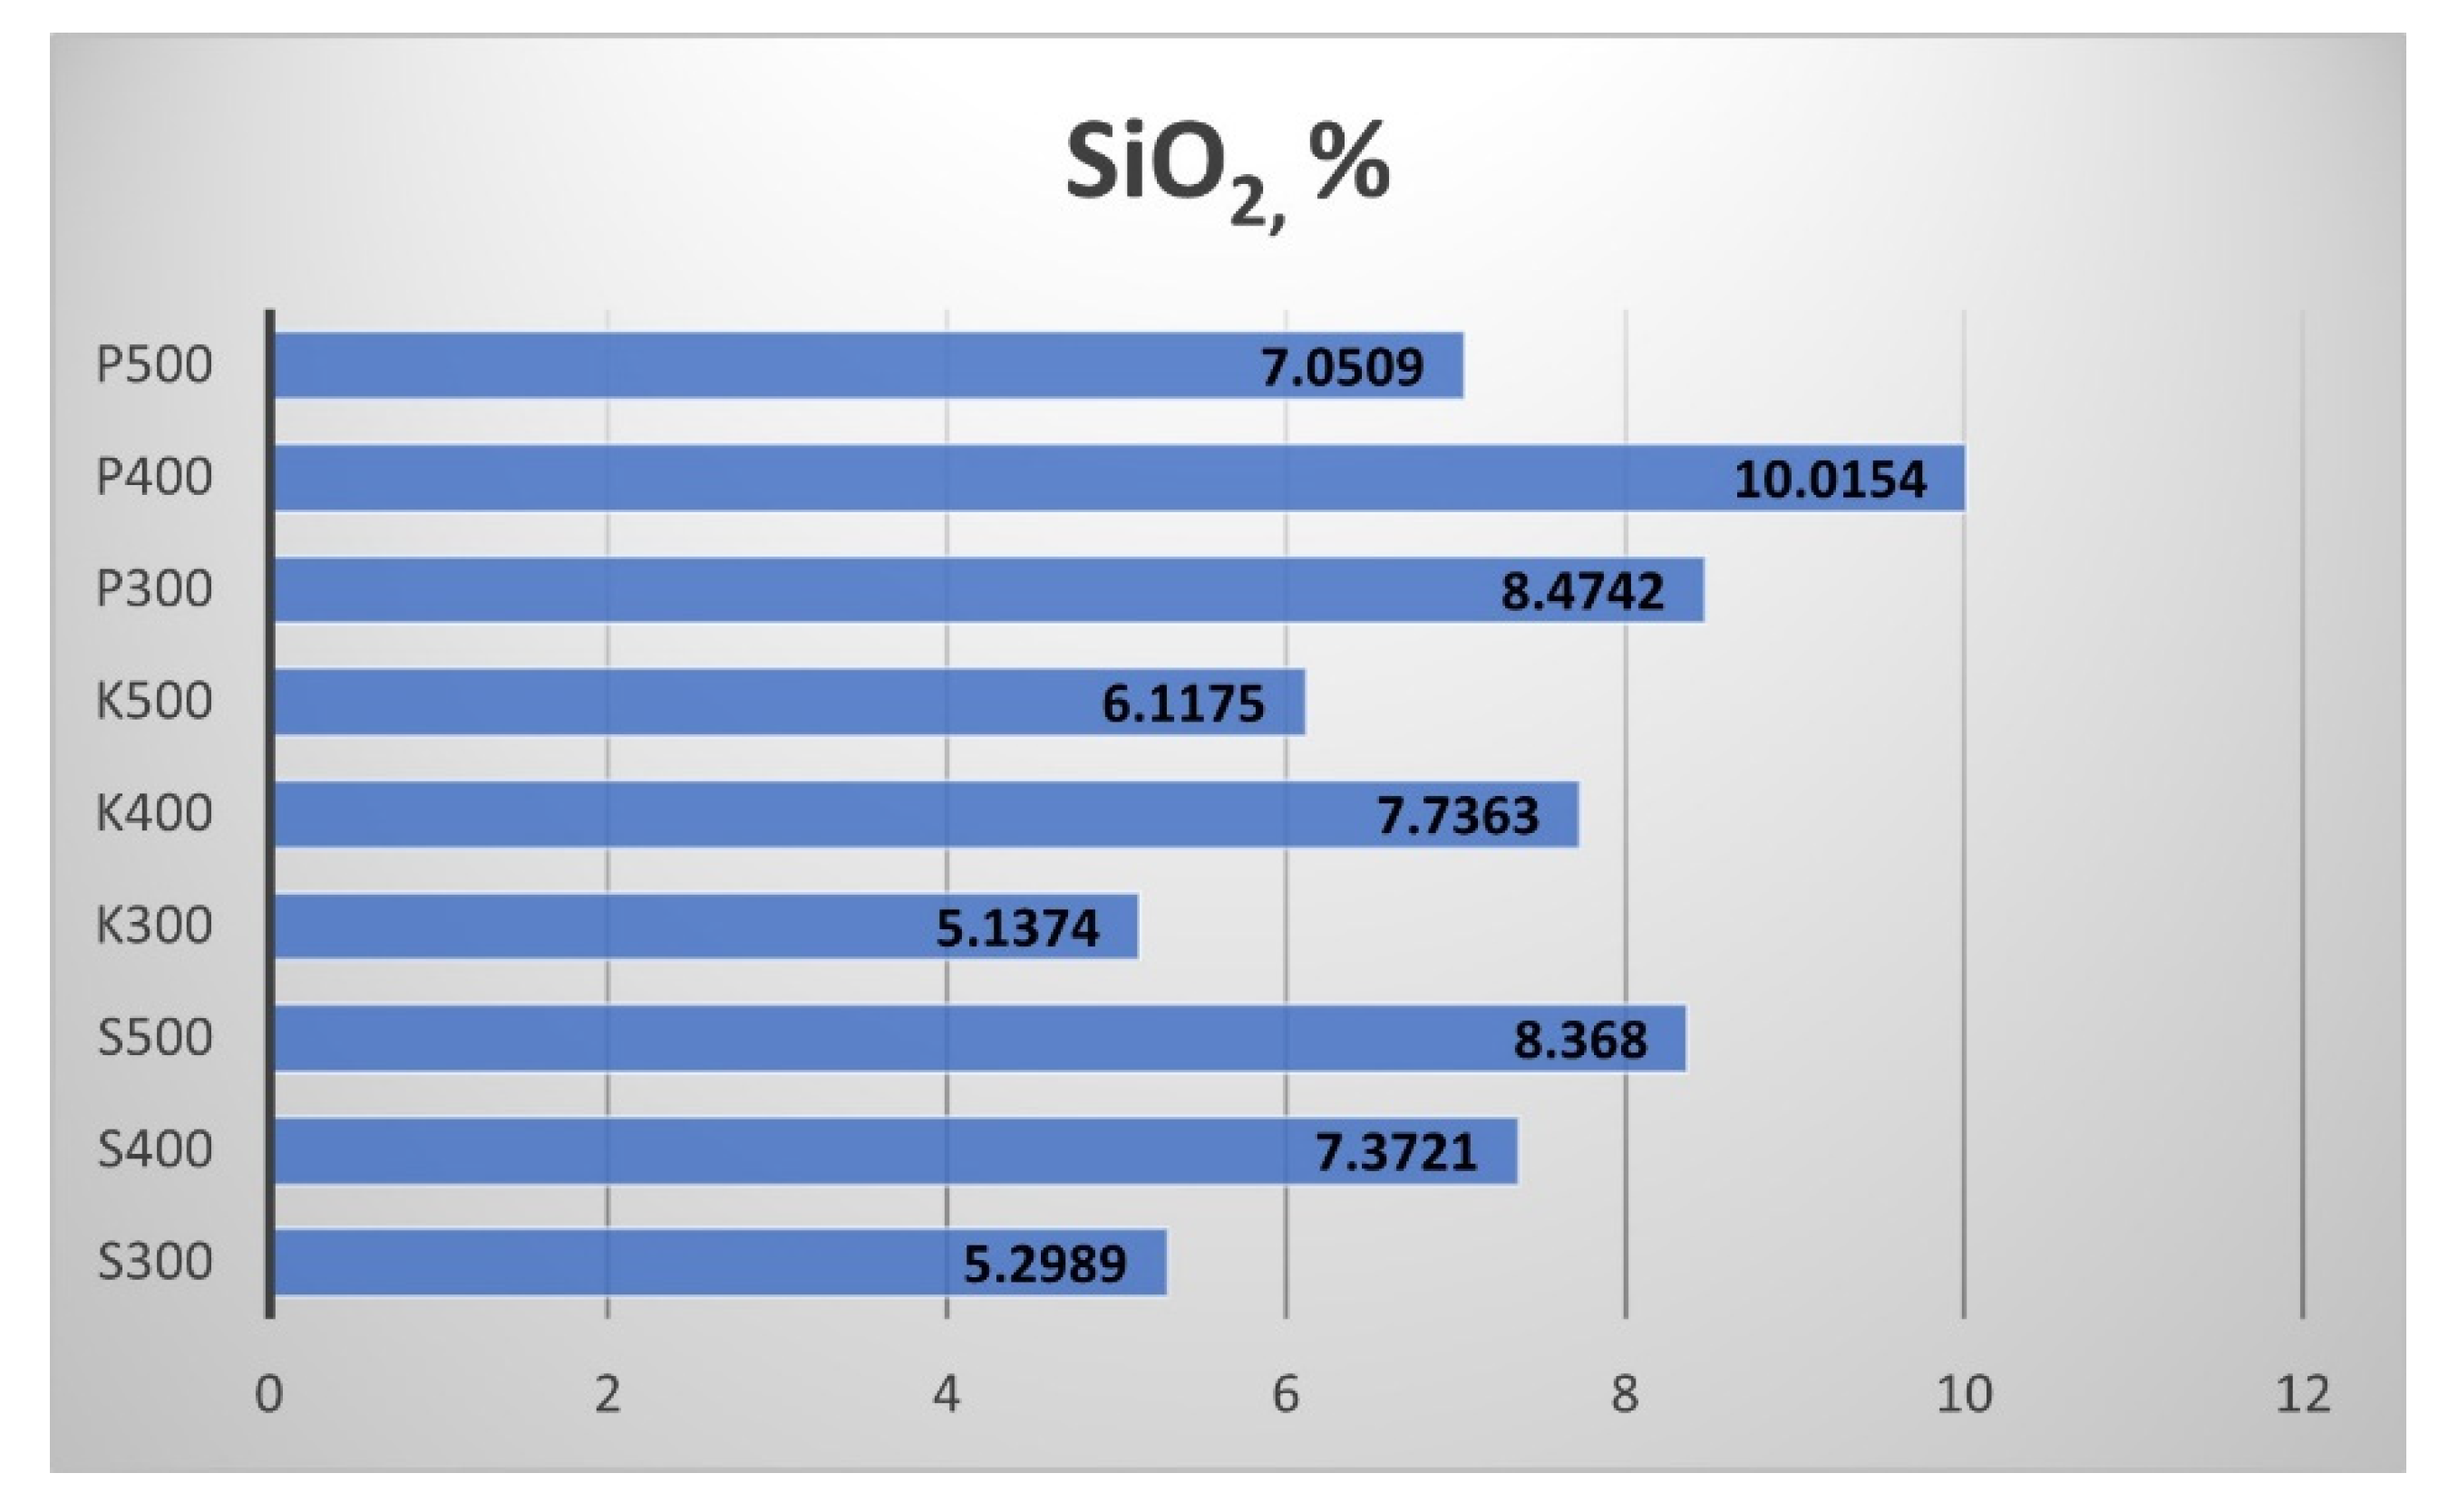
The Silicon dioxide (SiO
2) results are shown in
Figure 16. Similarly to the Al
2O
3 content (
Figure 15), the SiO
2 in the biochar increased with the temperature rise from 300 °C to 400 °C and decreased with the temperature rise from 400 °C to 500 °C. The biochar from Sandanski was again an exception, as the rise of the pyrolytic temperature led to a continuous increment of the SiO
2 content.
Figure 17 presents the Phosphorus pentoxide (P
2O
5) content of the biochar samples. The highest P
2O
5 content showed the straw biochar from Sandanski. The increment of the processing temperature from 300 °C to 400 °C provoked more than double the augmentation of the P
2O
5 content in the Sandanski and Kavarna biochar samples. At the same time, the biochar samples from Pazardzhik demonstrated a decrement of the P
2O
5 content with the temperature rise.
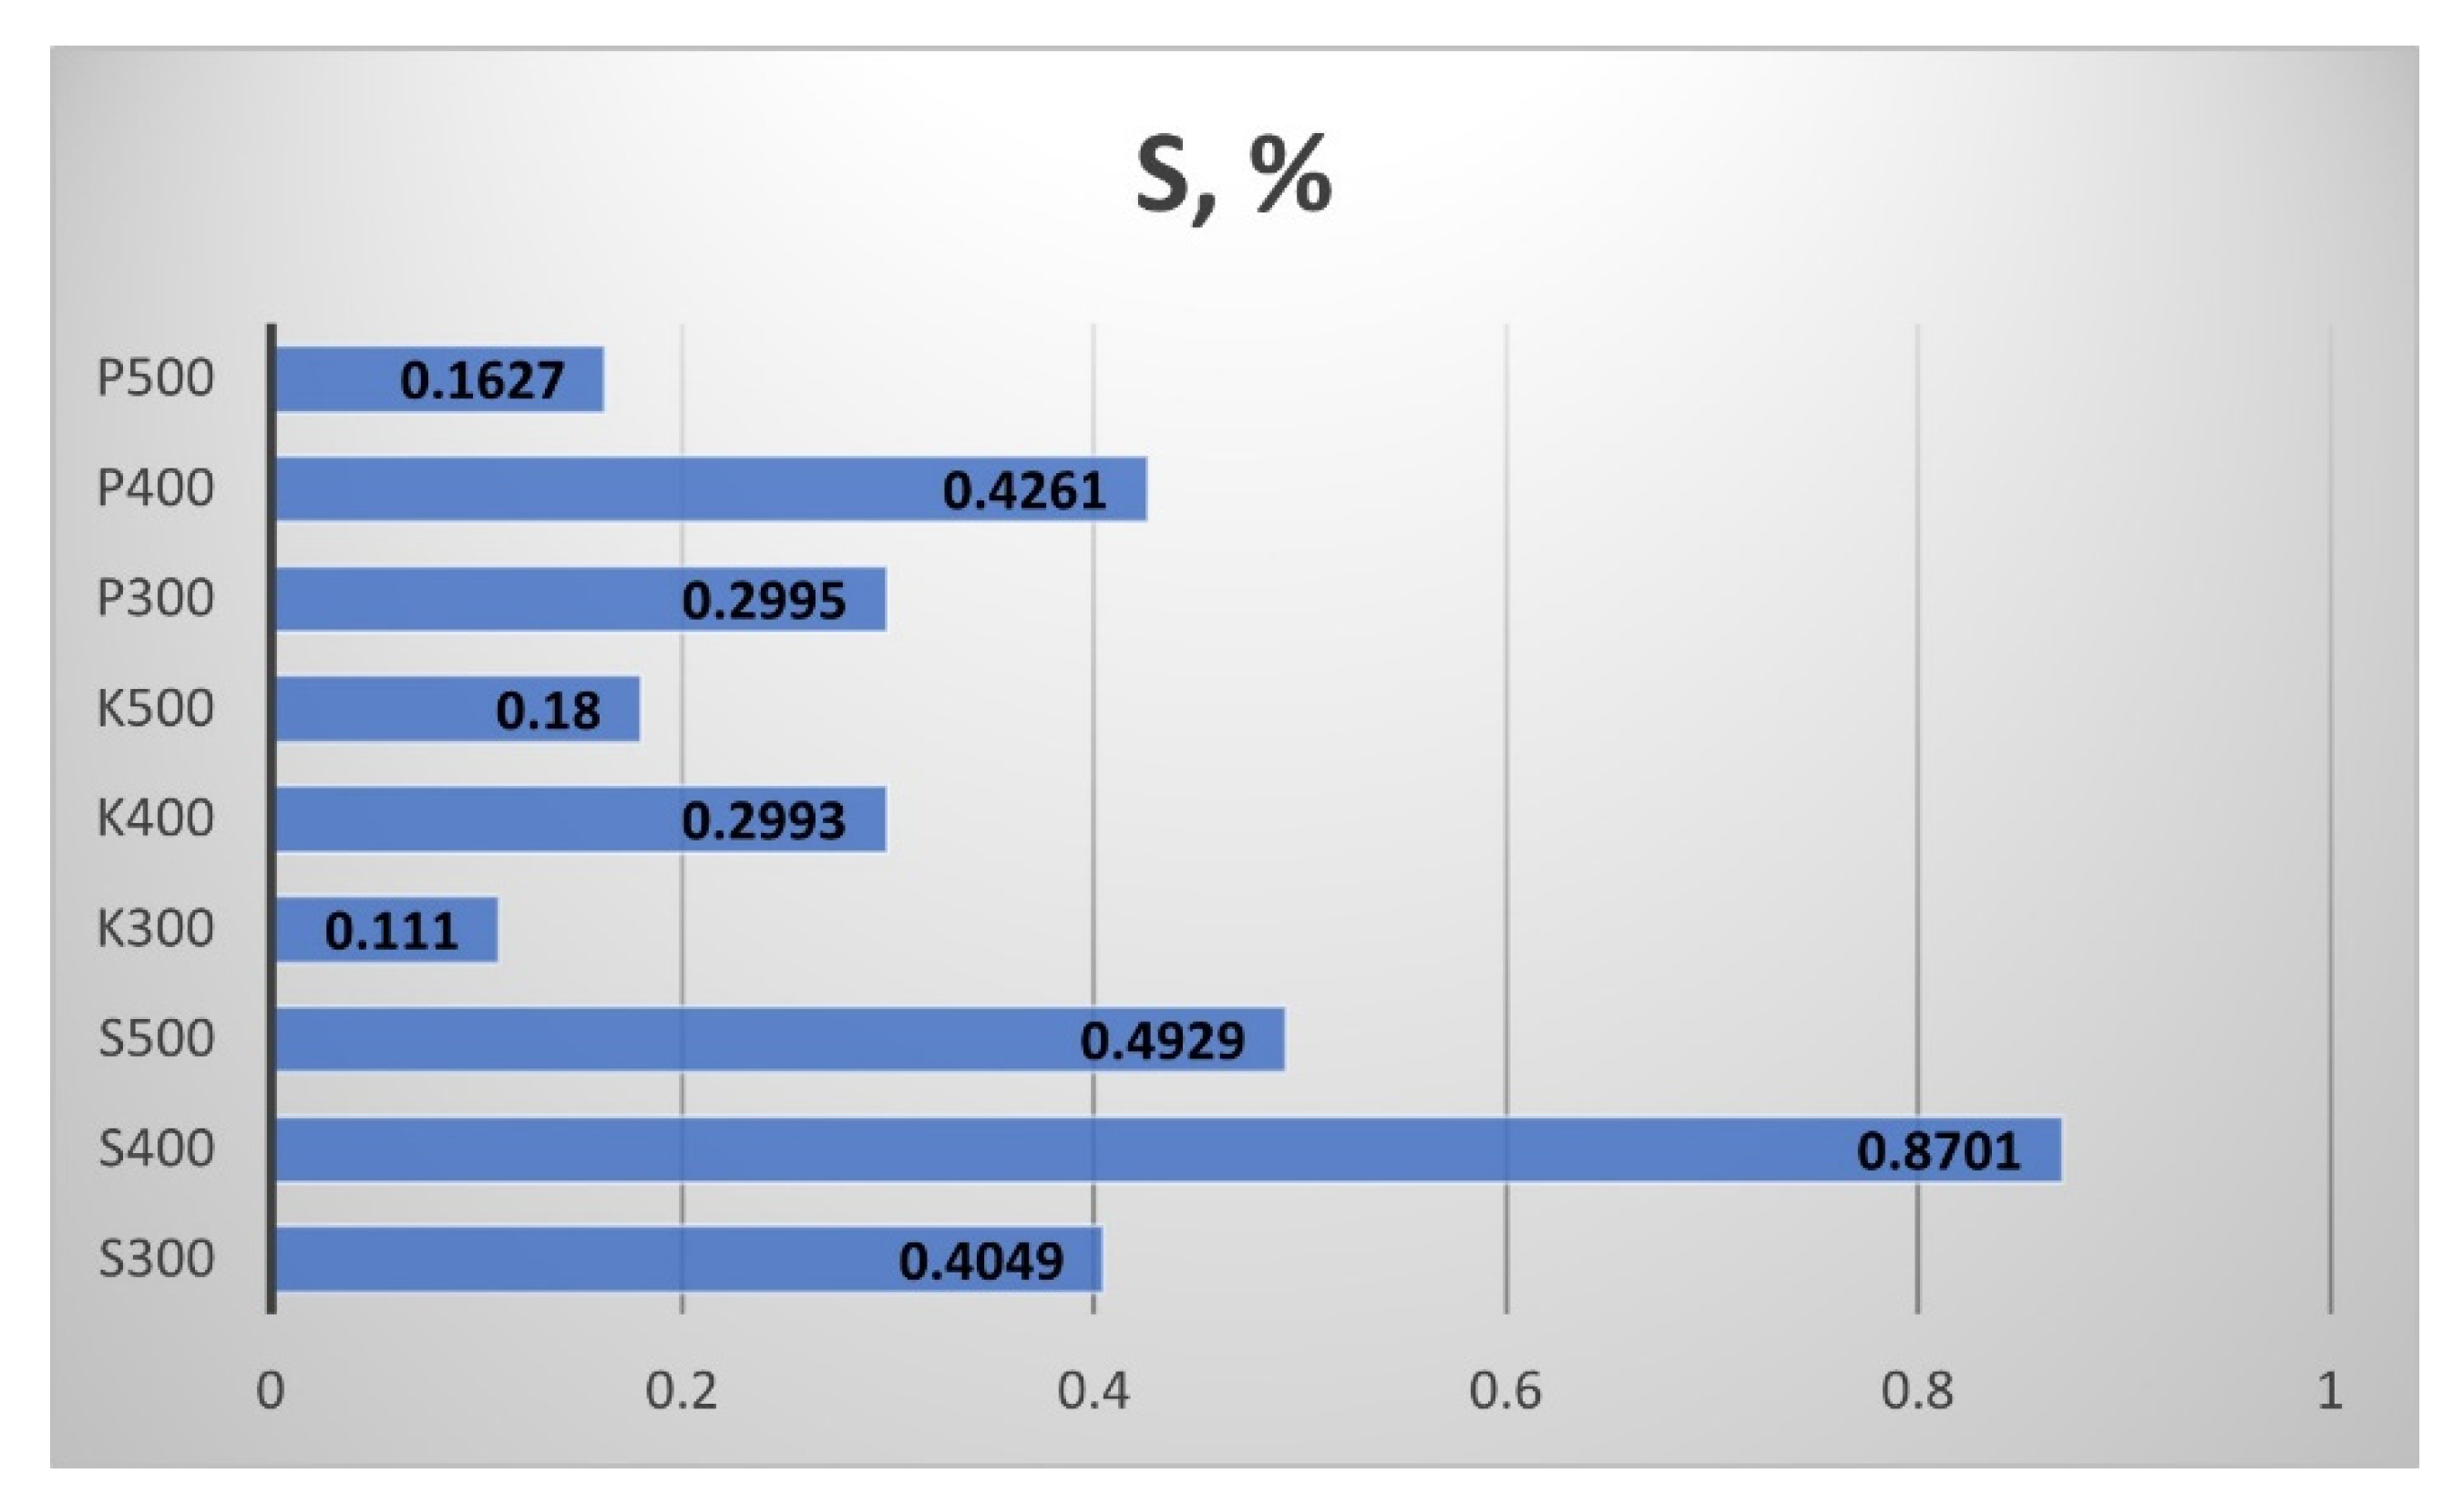
The results for the Sulphur (S) content of the biochar are presented in
Figure 18. The straw biochar from Sandanski showed the highest S content. The rise of the processing temperature from 300 °C to 400 °C provoked a double increment of the sulphur content in all biochar samples. The rise of the processing temperature from 400 °C to 500 °C led to a decrement in the S content in the biochar.
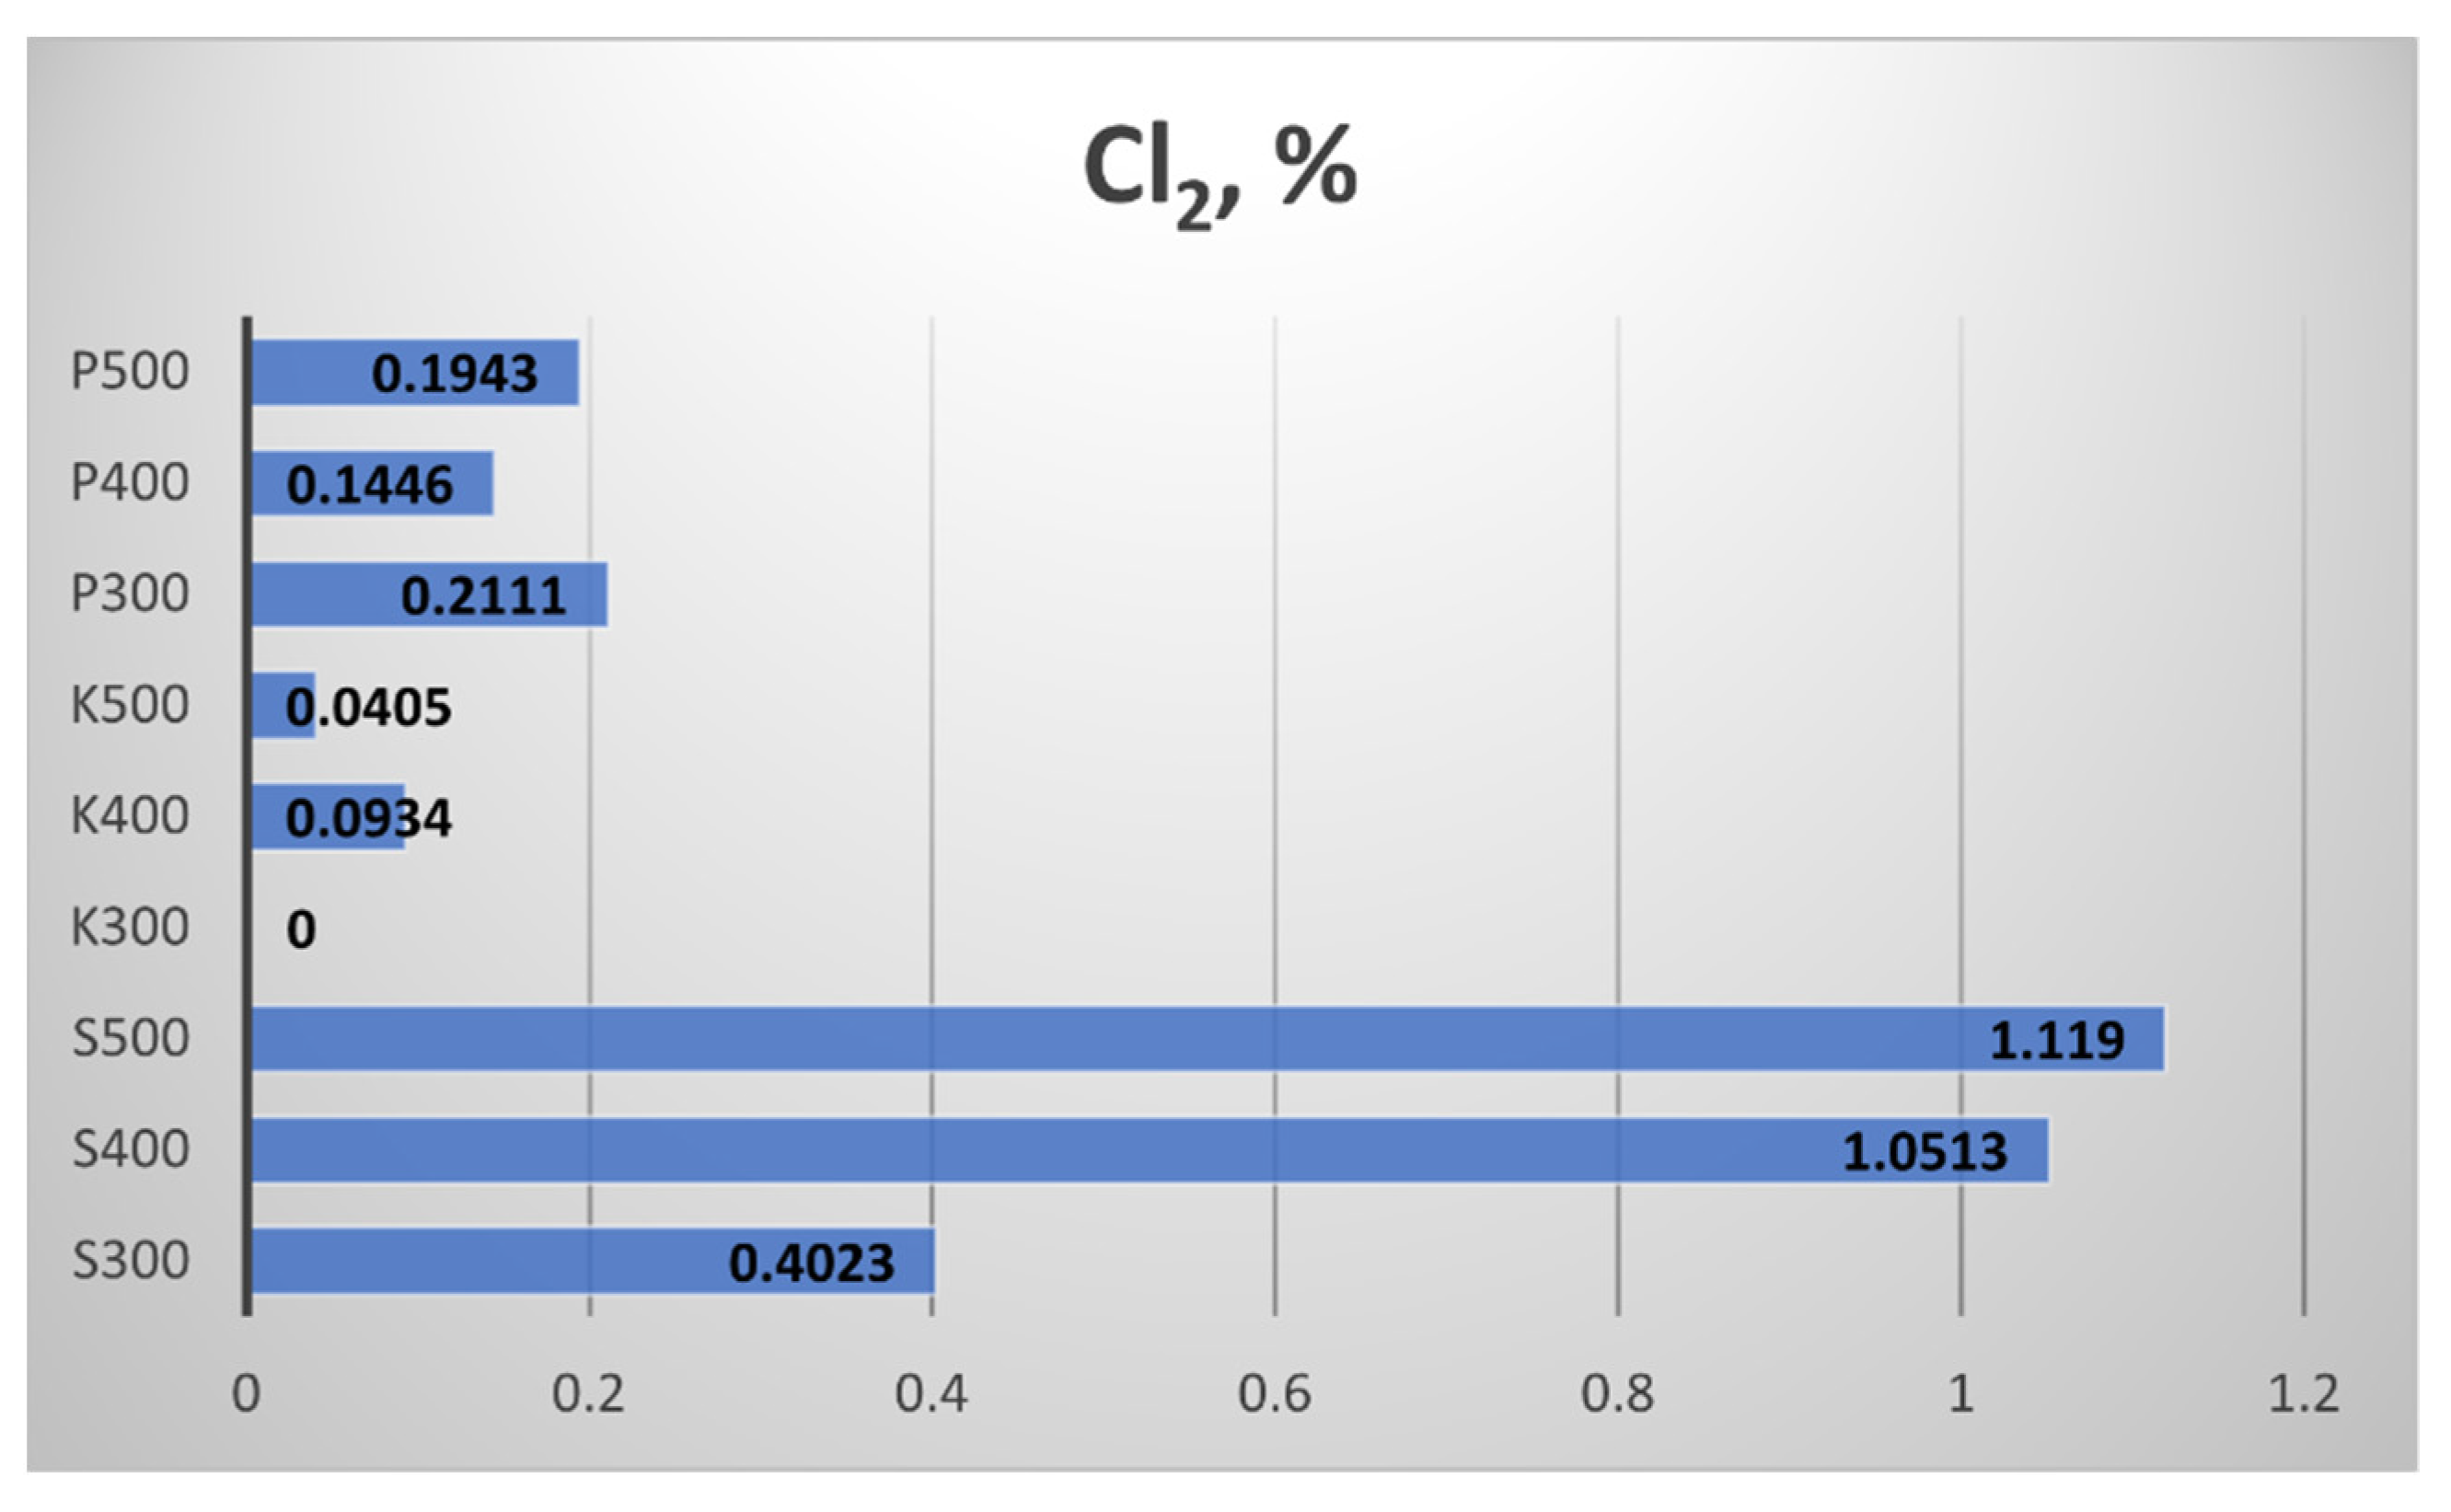
Figure 19 presents the results for the Chlorine (Cl) content of the biochar samples. The highest Cl content was measured in the straw biochar from Sandanski, and the increment of the pyrolytic temperature to 400 °C and 500 °C provoked more than 2.5 times a rise in the Cl content compared to the samples obtained at 300 °C. In the biochar from Kavarna, obtained at 300 °C, the Cl content was null, while Cl content was found at the other two temperatures. In the biochar from Pazardzhik, almost equal values of chlorine content were measured.
The results for the Potassium oxide (K
2O) content of the biochar samples are presented in
Figure 20. The highest K
2O content showed the straw biochar from Sandanski. The increment of the processing temperature from 300 °C to 400 °C provoked a rise in the K
2O content in all biochar samples (being almost two times higher in the case of the biochar from Sandanski). The increment of the processing temperature from 400 °C to 500 °C led to a slight decrement in the K
2O content in the biochar from Kavarna and Pazardzhik, while it continued increasing in the sample from Sandanski.
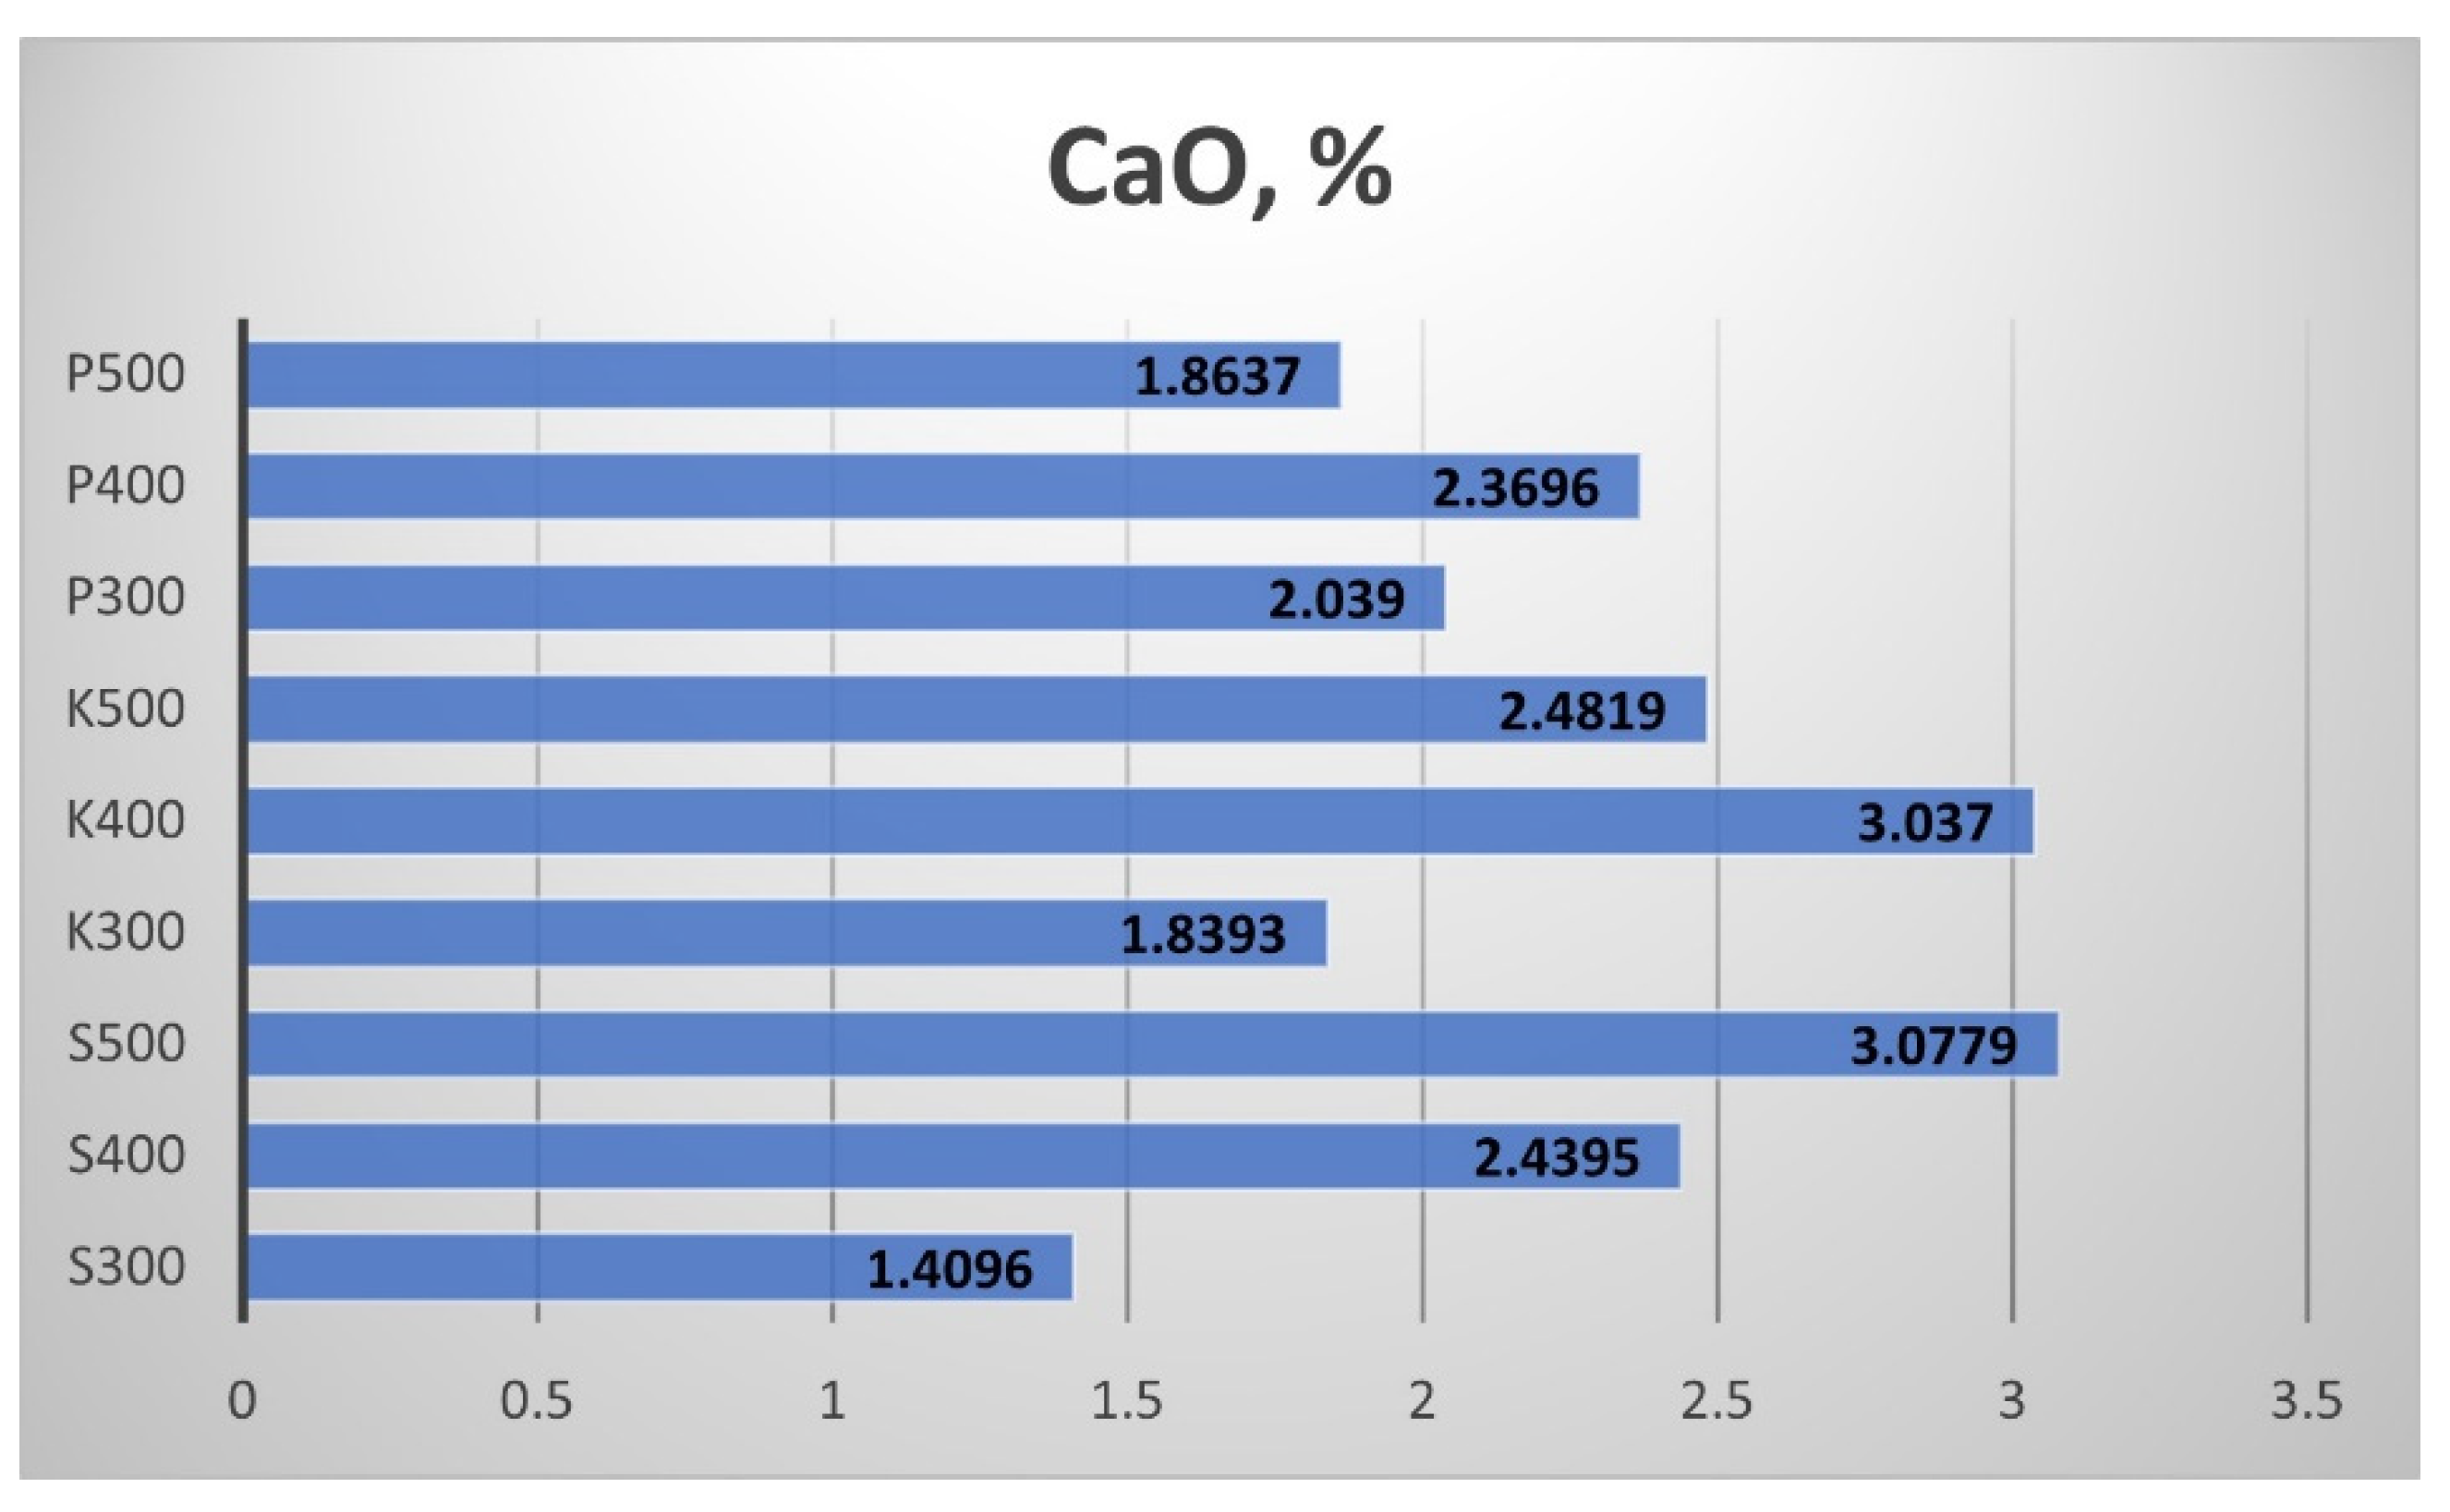
Figure 21 summarises the results for the Calcium oxide (CaO) content of the produced biochar. The increment of the processing temperature from 300 °C to 400 °C provoked a rise in the CaO content in all biochar samples, while the increment of the processing temperature from 400 °C to 500 °C led to a decrement in the CaO content, except for the sample from Sandanski.
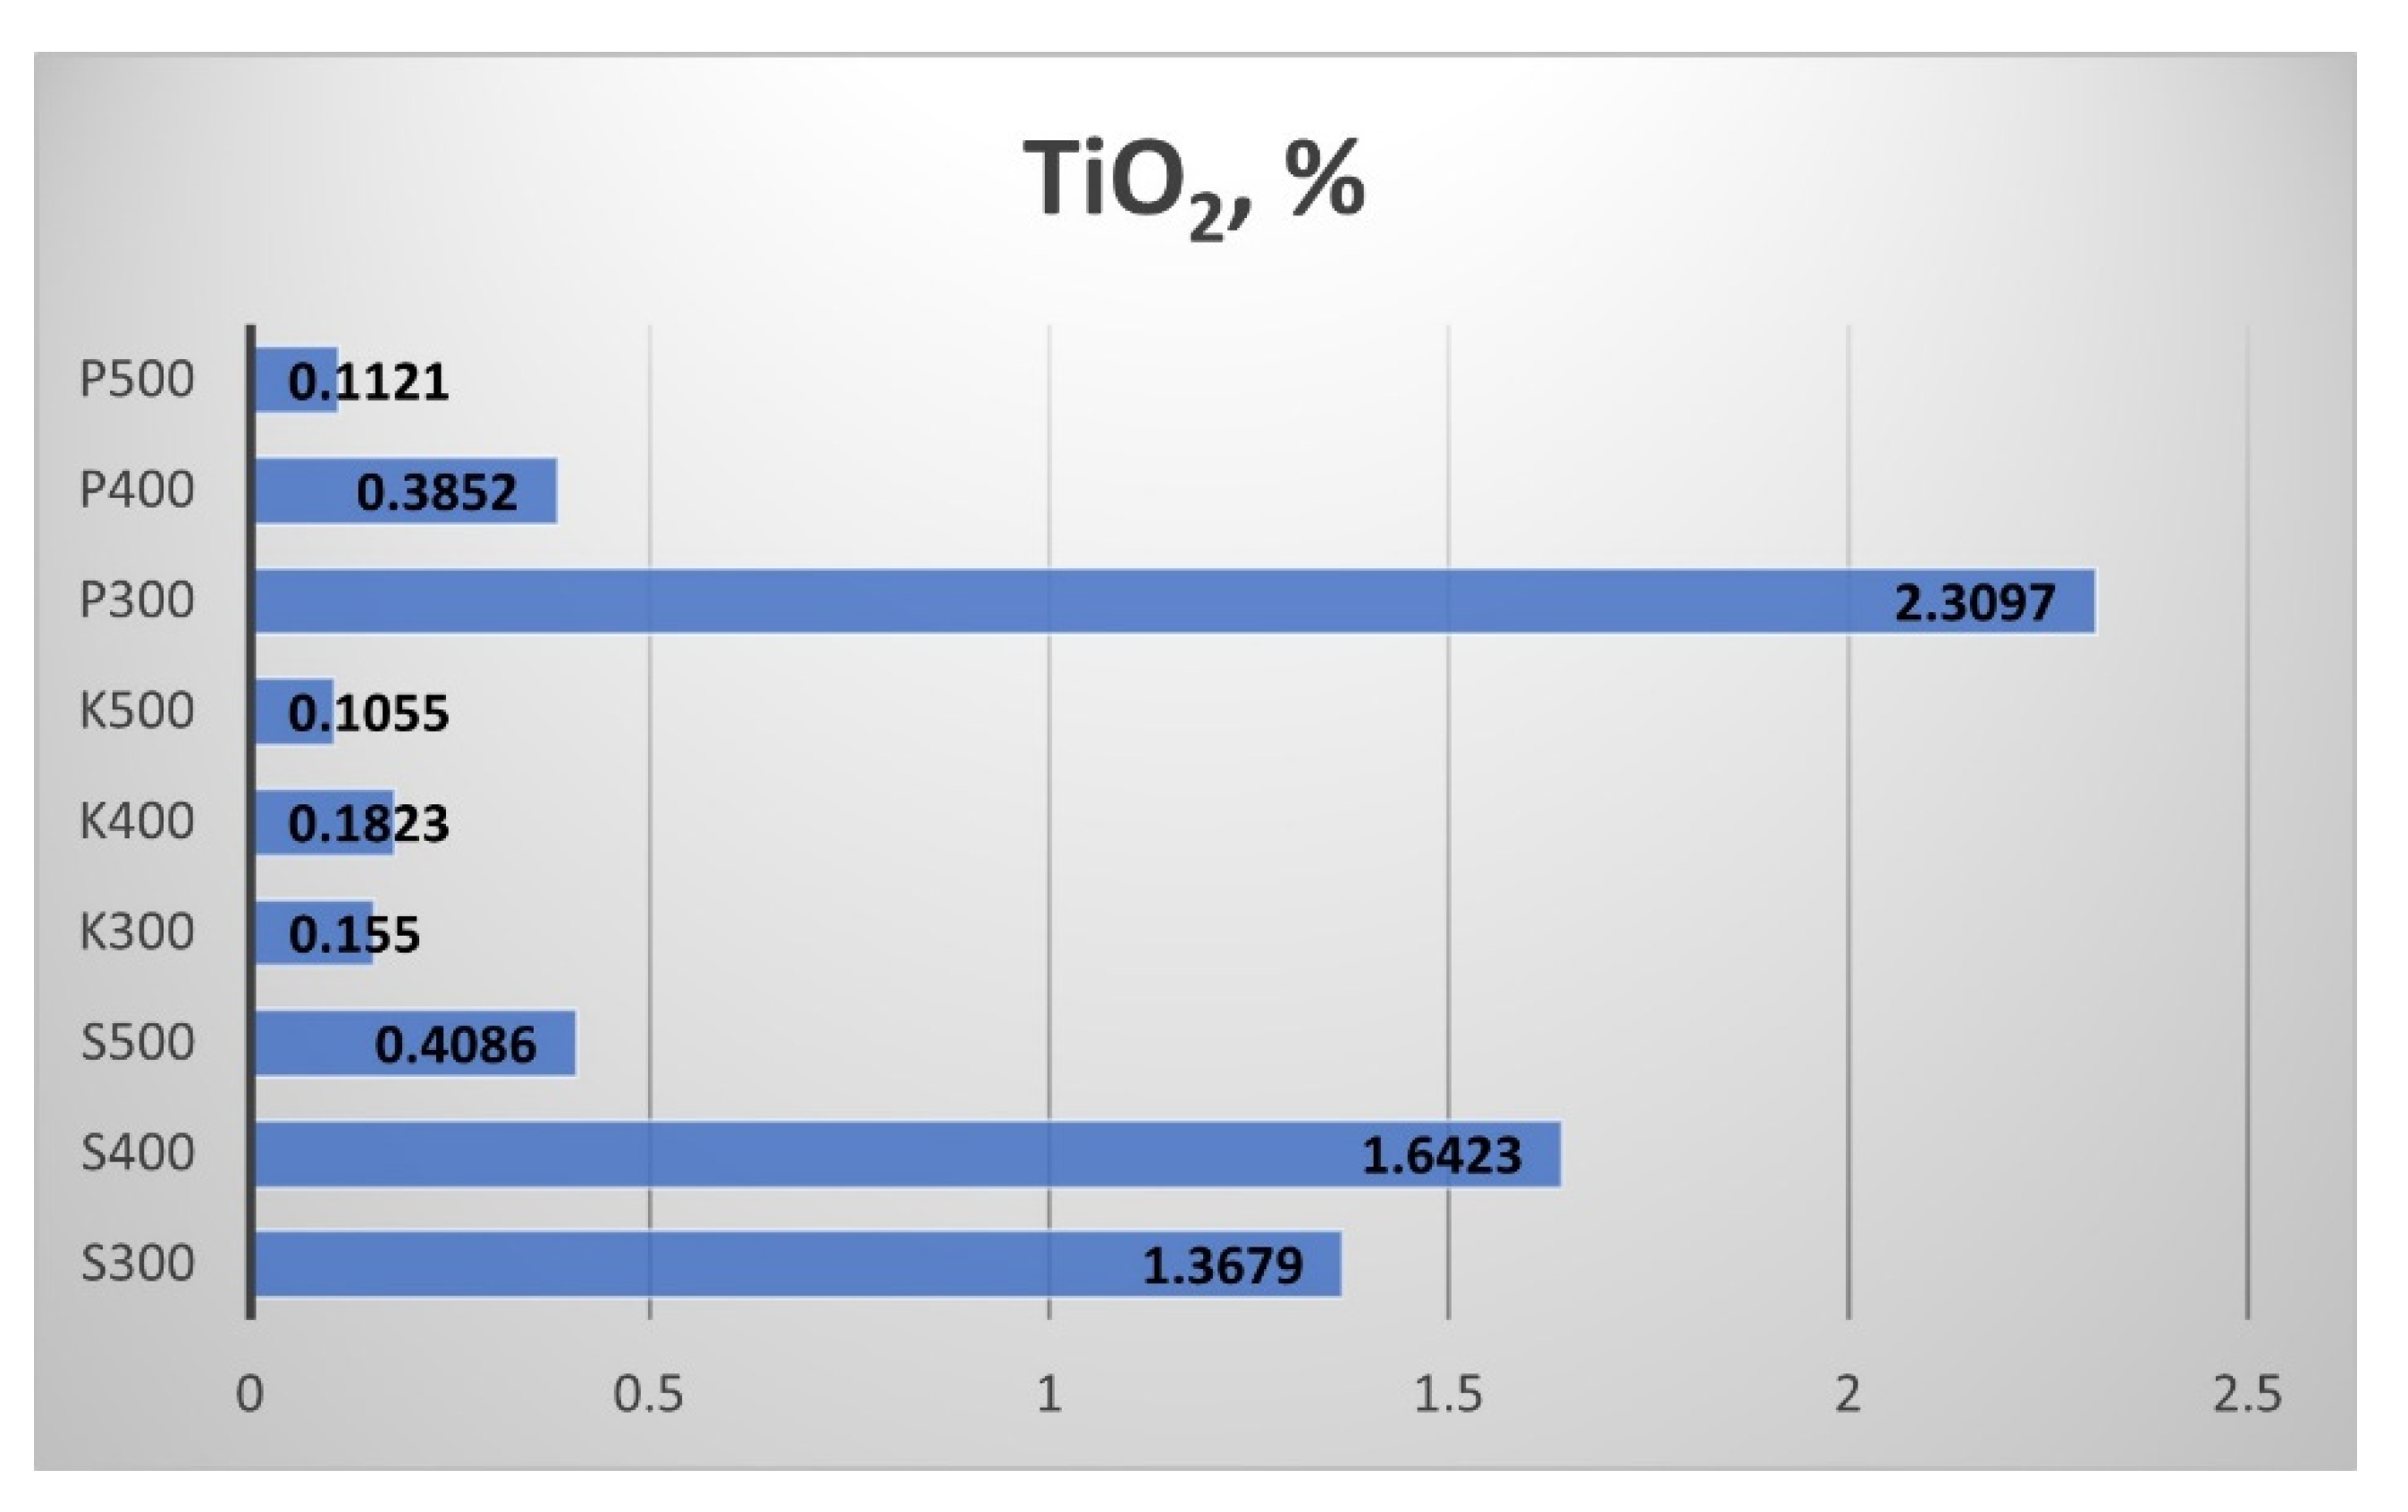
The results for the biochar samples’ Titanium dioxide (TiO
2) content are shown in
Figure 22. The highest TiO
2 content showed the straw biochar from Pazardzhik, produced at 300 °C. The rise of the pyrolytic temperature led to a fast descent of the TiO
2 content. The increment of the processing temperature from 300 °C to 400 °C provoked a rise in the TiO
2 content in the samples from Sandanski and Kavarna, while the next rise to 500 °C led to a decrement in the TiO
2 content.
Figure 23 presents the results for the biochar’s Vanadium (V) content. The samples from Kavarna did not have this element, while the biochar from Sandanski and Kavarna showed small quantities of Vanadium.
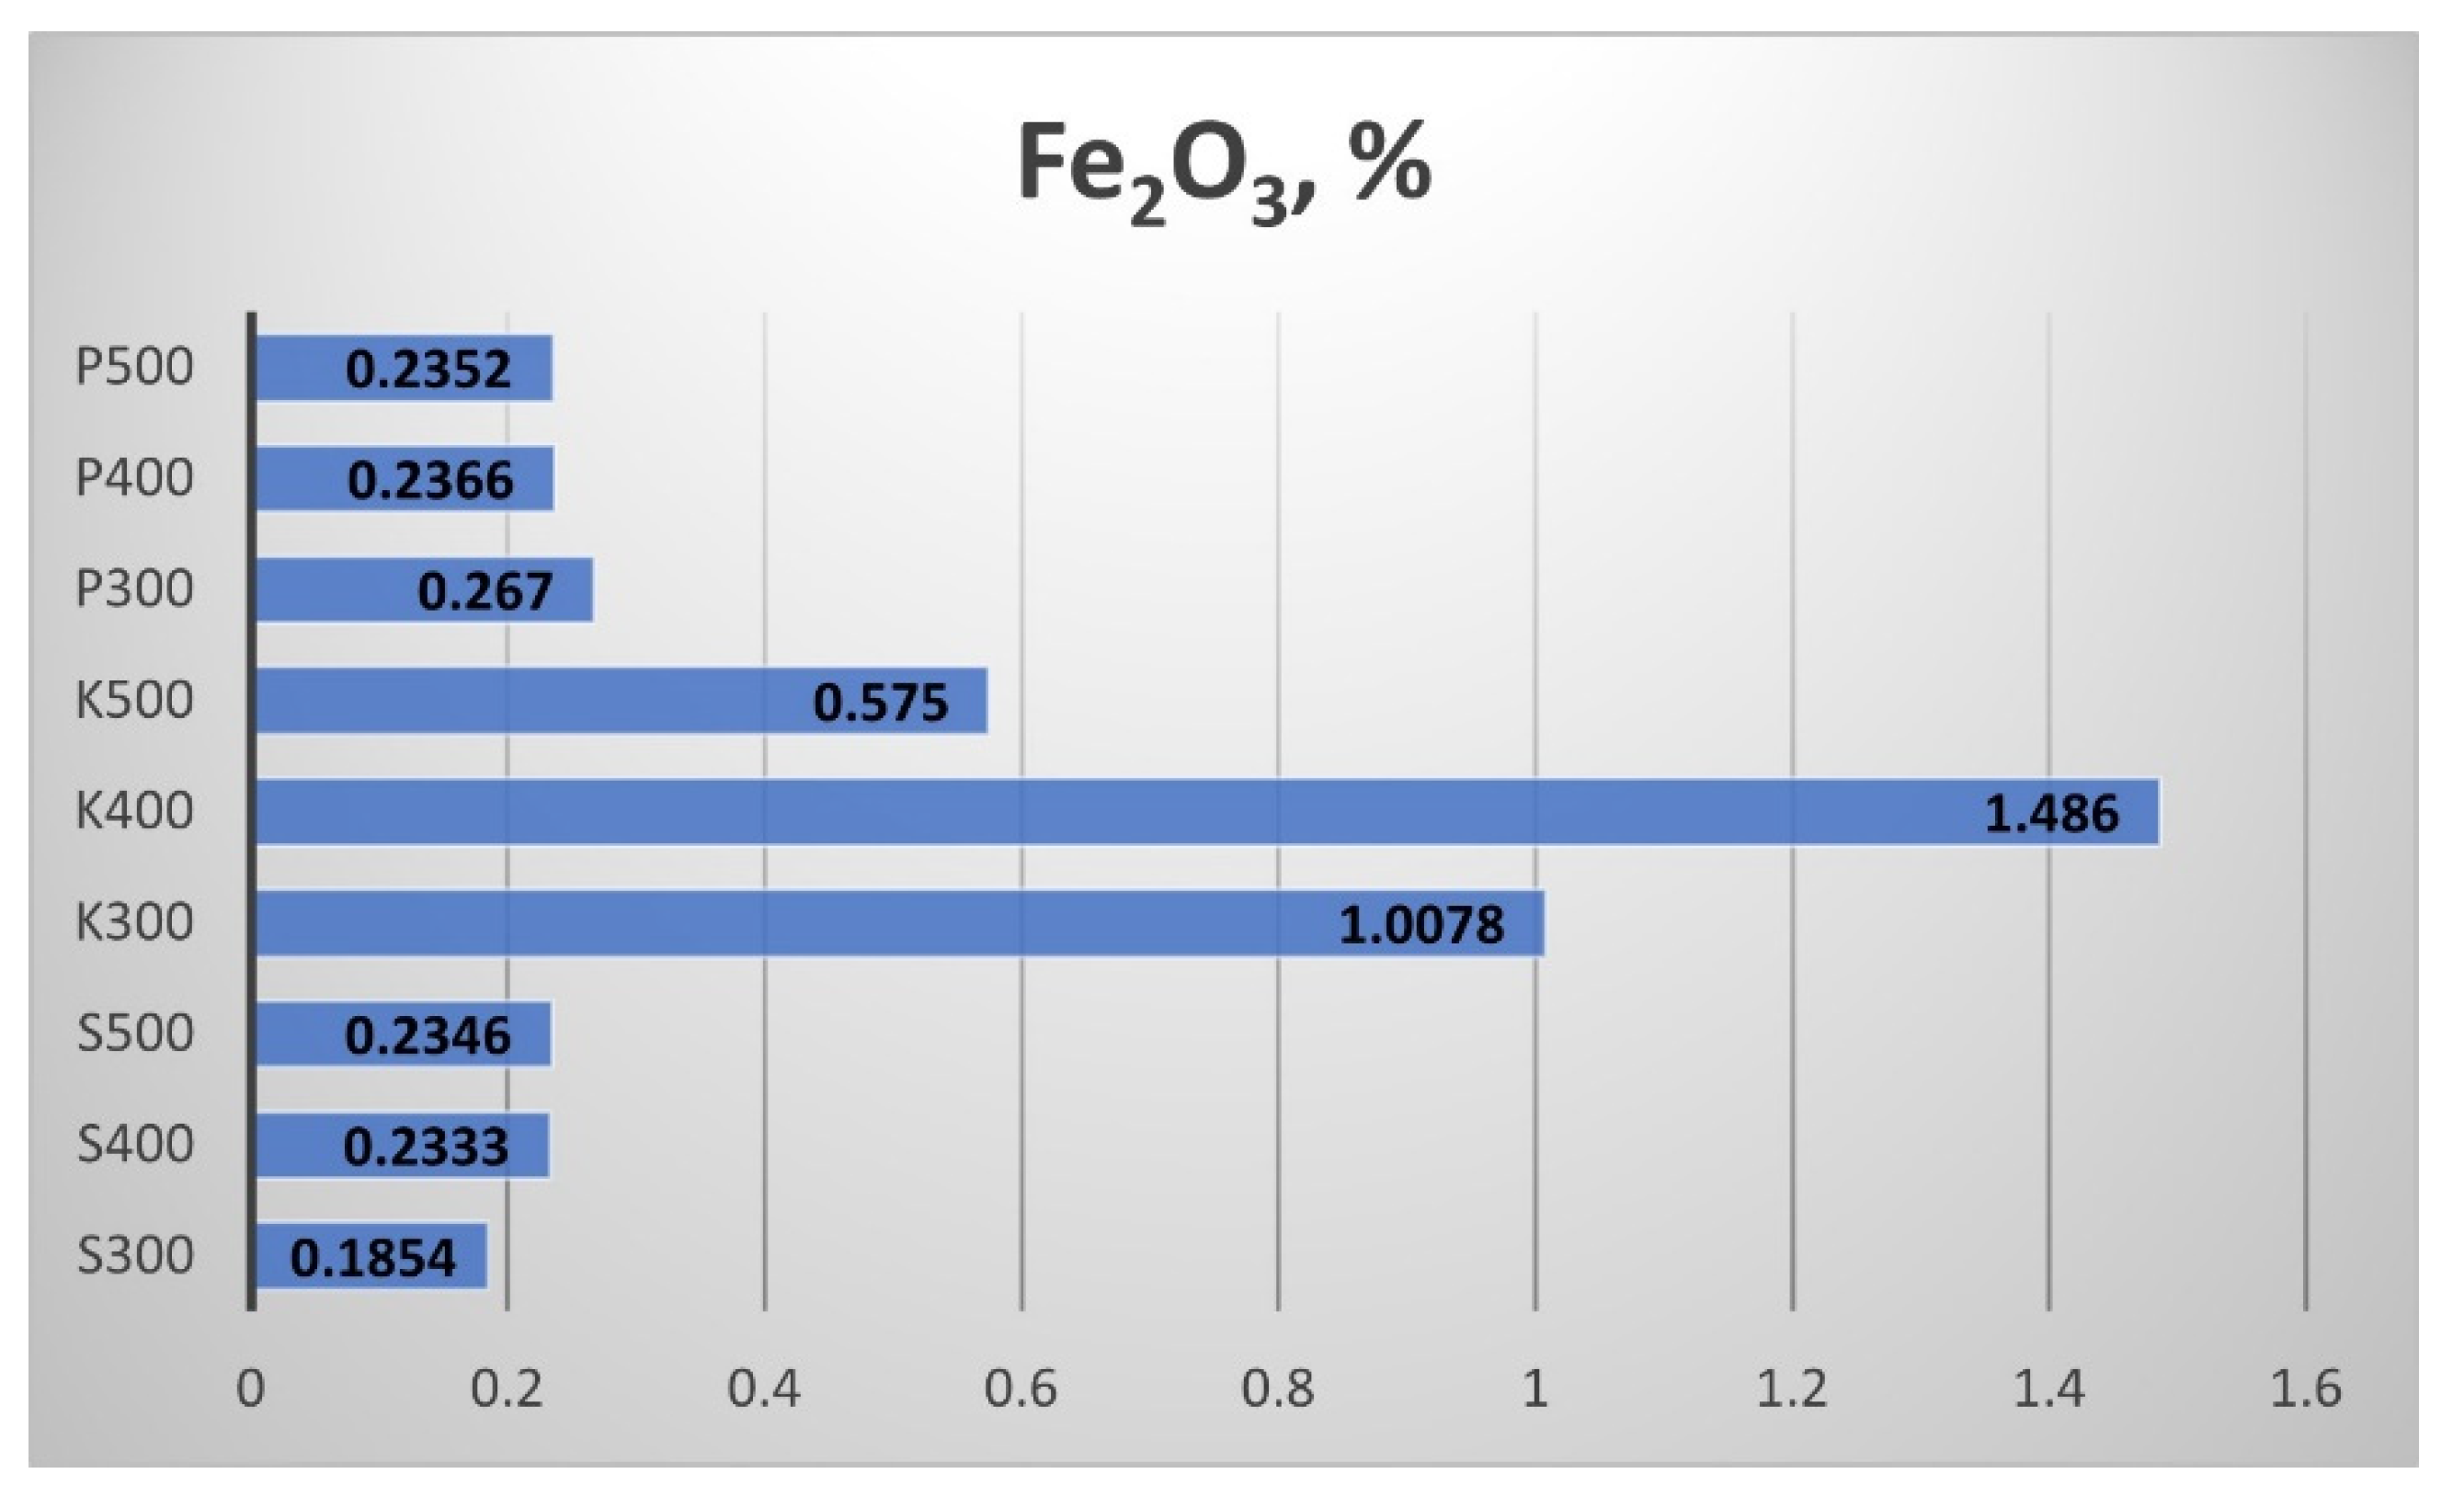
The results for the Ferric oxide (Fe
2O
3) content of the biochar samples are shown in
Figure 24. The highest Fe
2O
3 content showed the straw biochar from Kavarna. These samples clearly illustrated the effect of the pyrolytic temperature change. The biochar samples from Sandanski and Pazardzhik showed a smaller content of Fe
2O
3 with a weak influence of the temperature increment.
Figure 25 shows the content of Nickel (Ni) in the biochar samples. The amount is minimal, and the small changes with the temperature could be attributed to the measurement error.
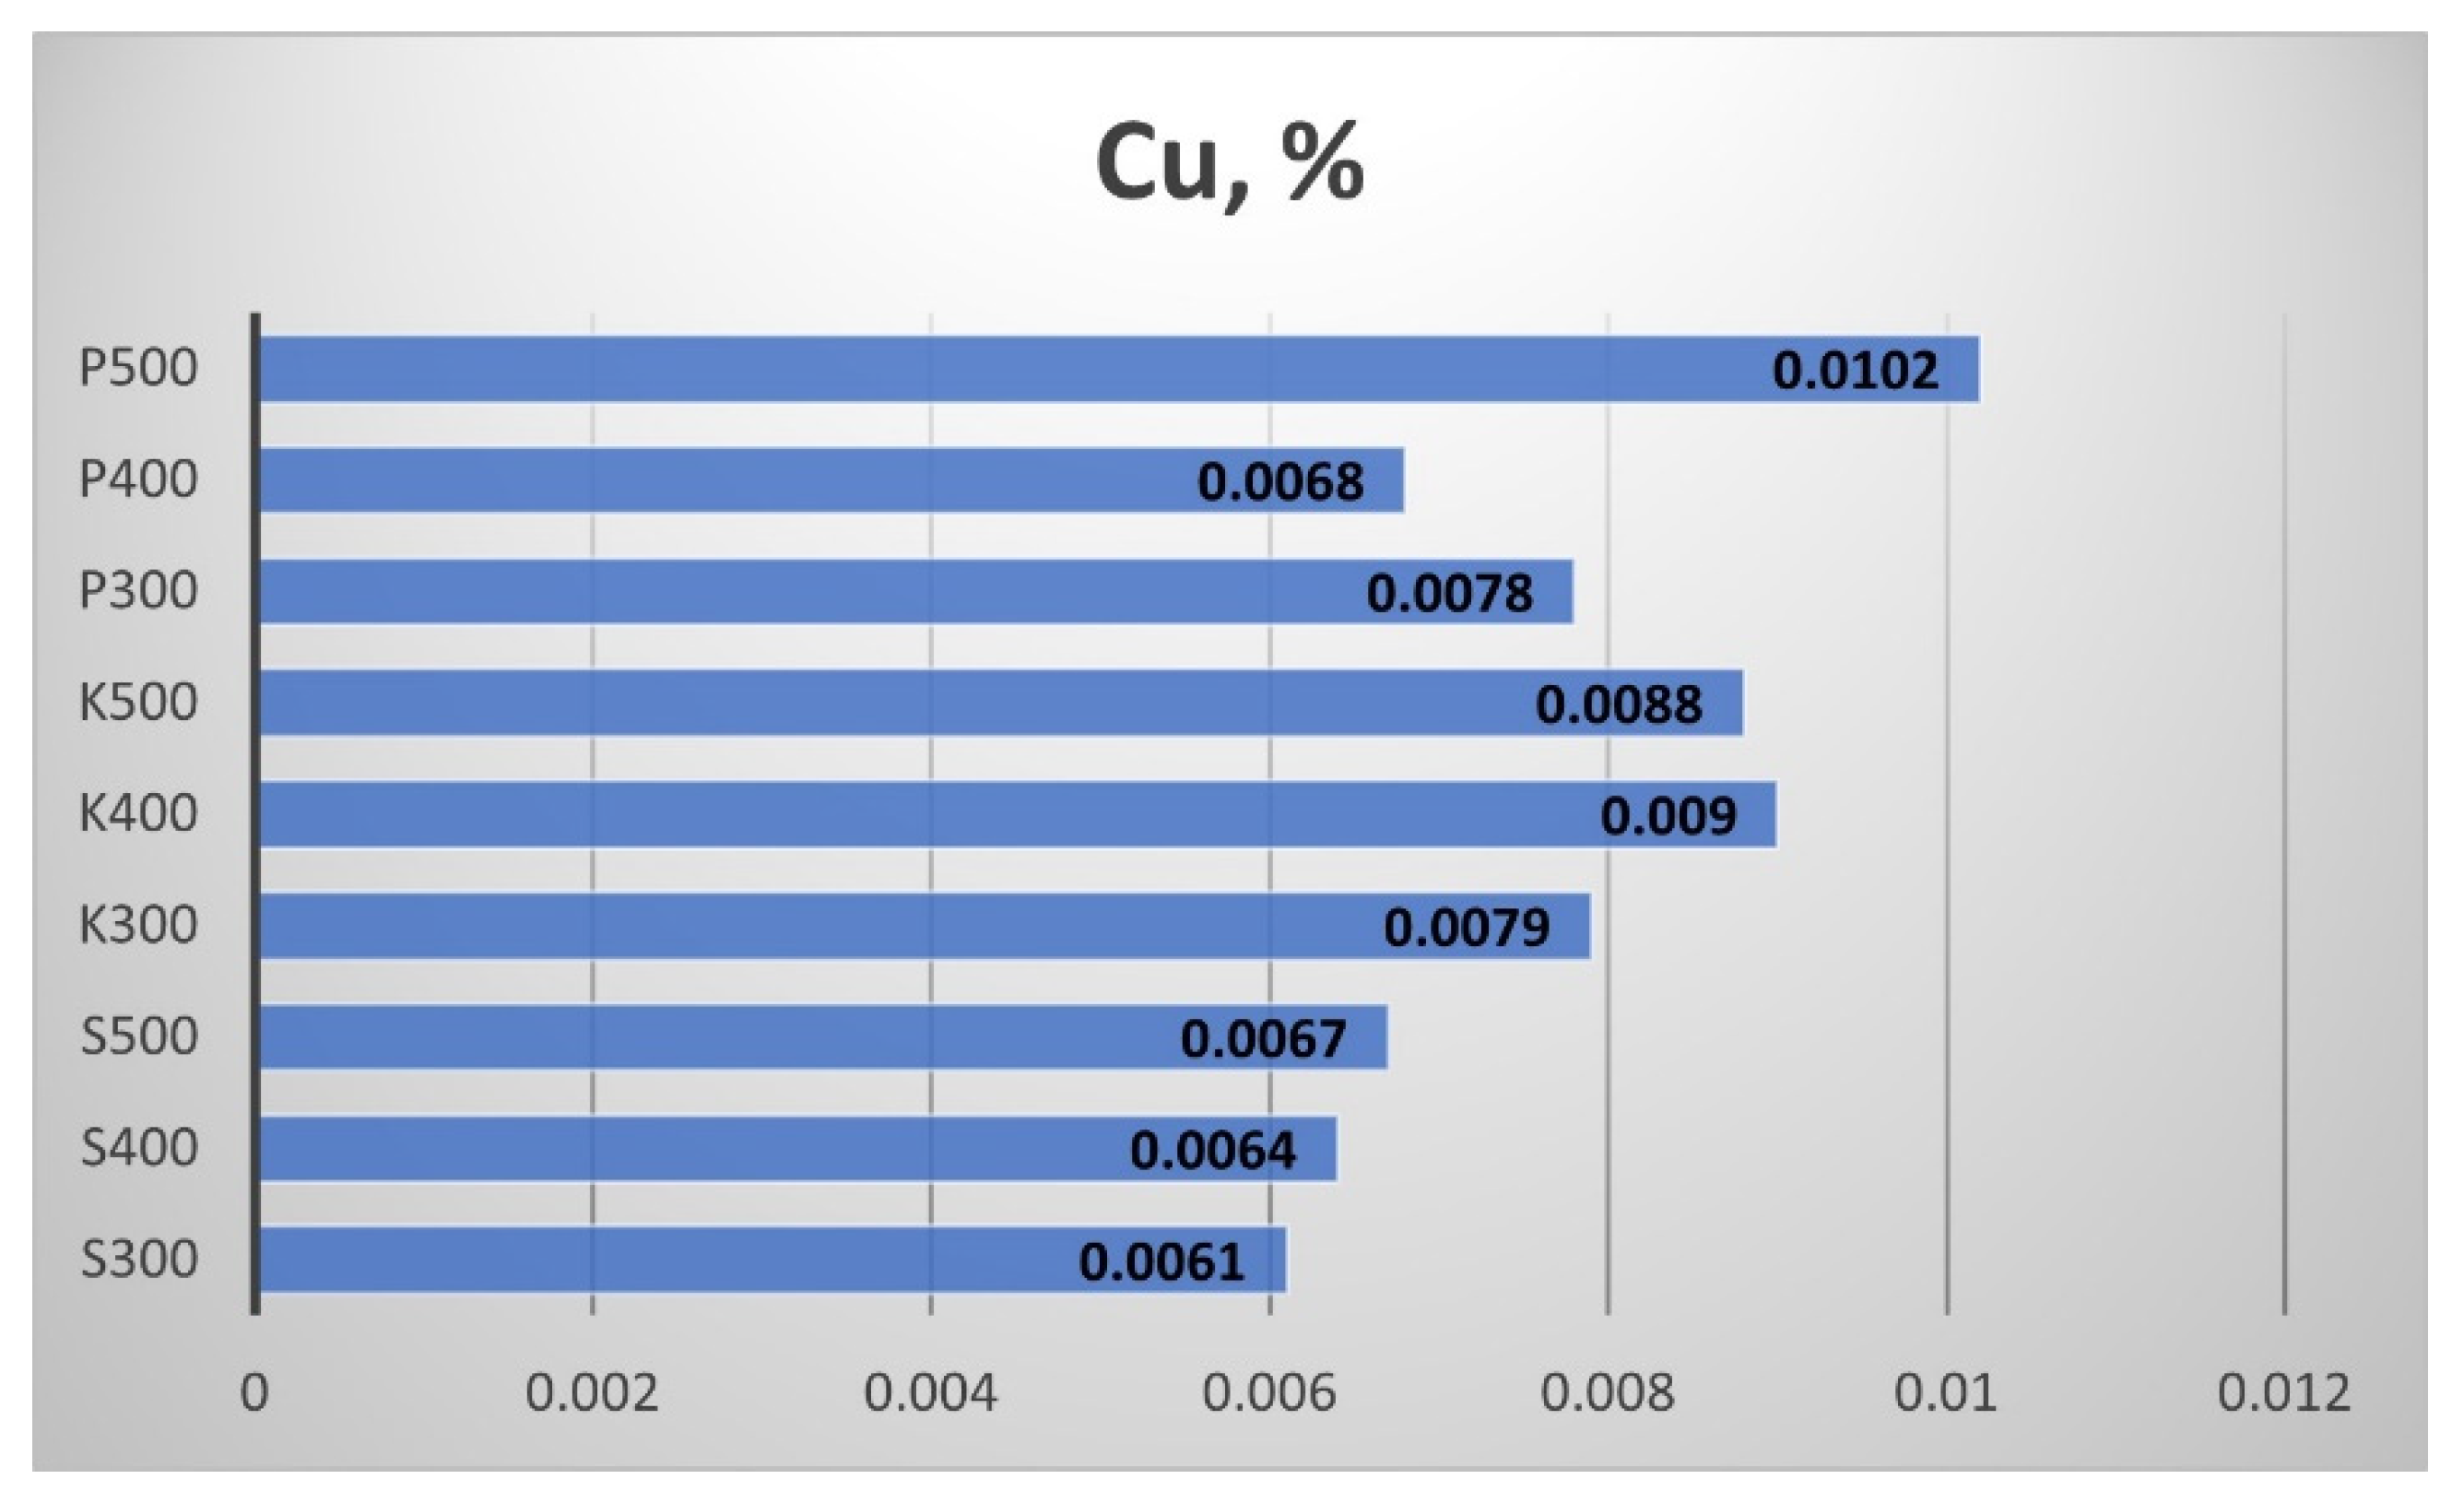
Figure 26 summarizes the results from the Cooper (Cu) content measurements in the biochar samples. The amount is again minimal and the minor changes due to the temperature could be attributed to the error of the measurement. The exception is the Cu content of the biochar from Pazardzhik, where the increment of the pyrrolic temperature in the investigated range led to a different Cu content on the biochar.
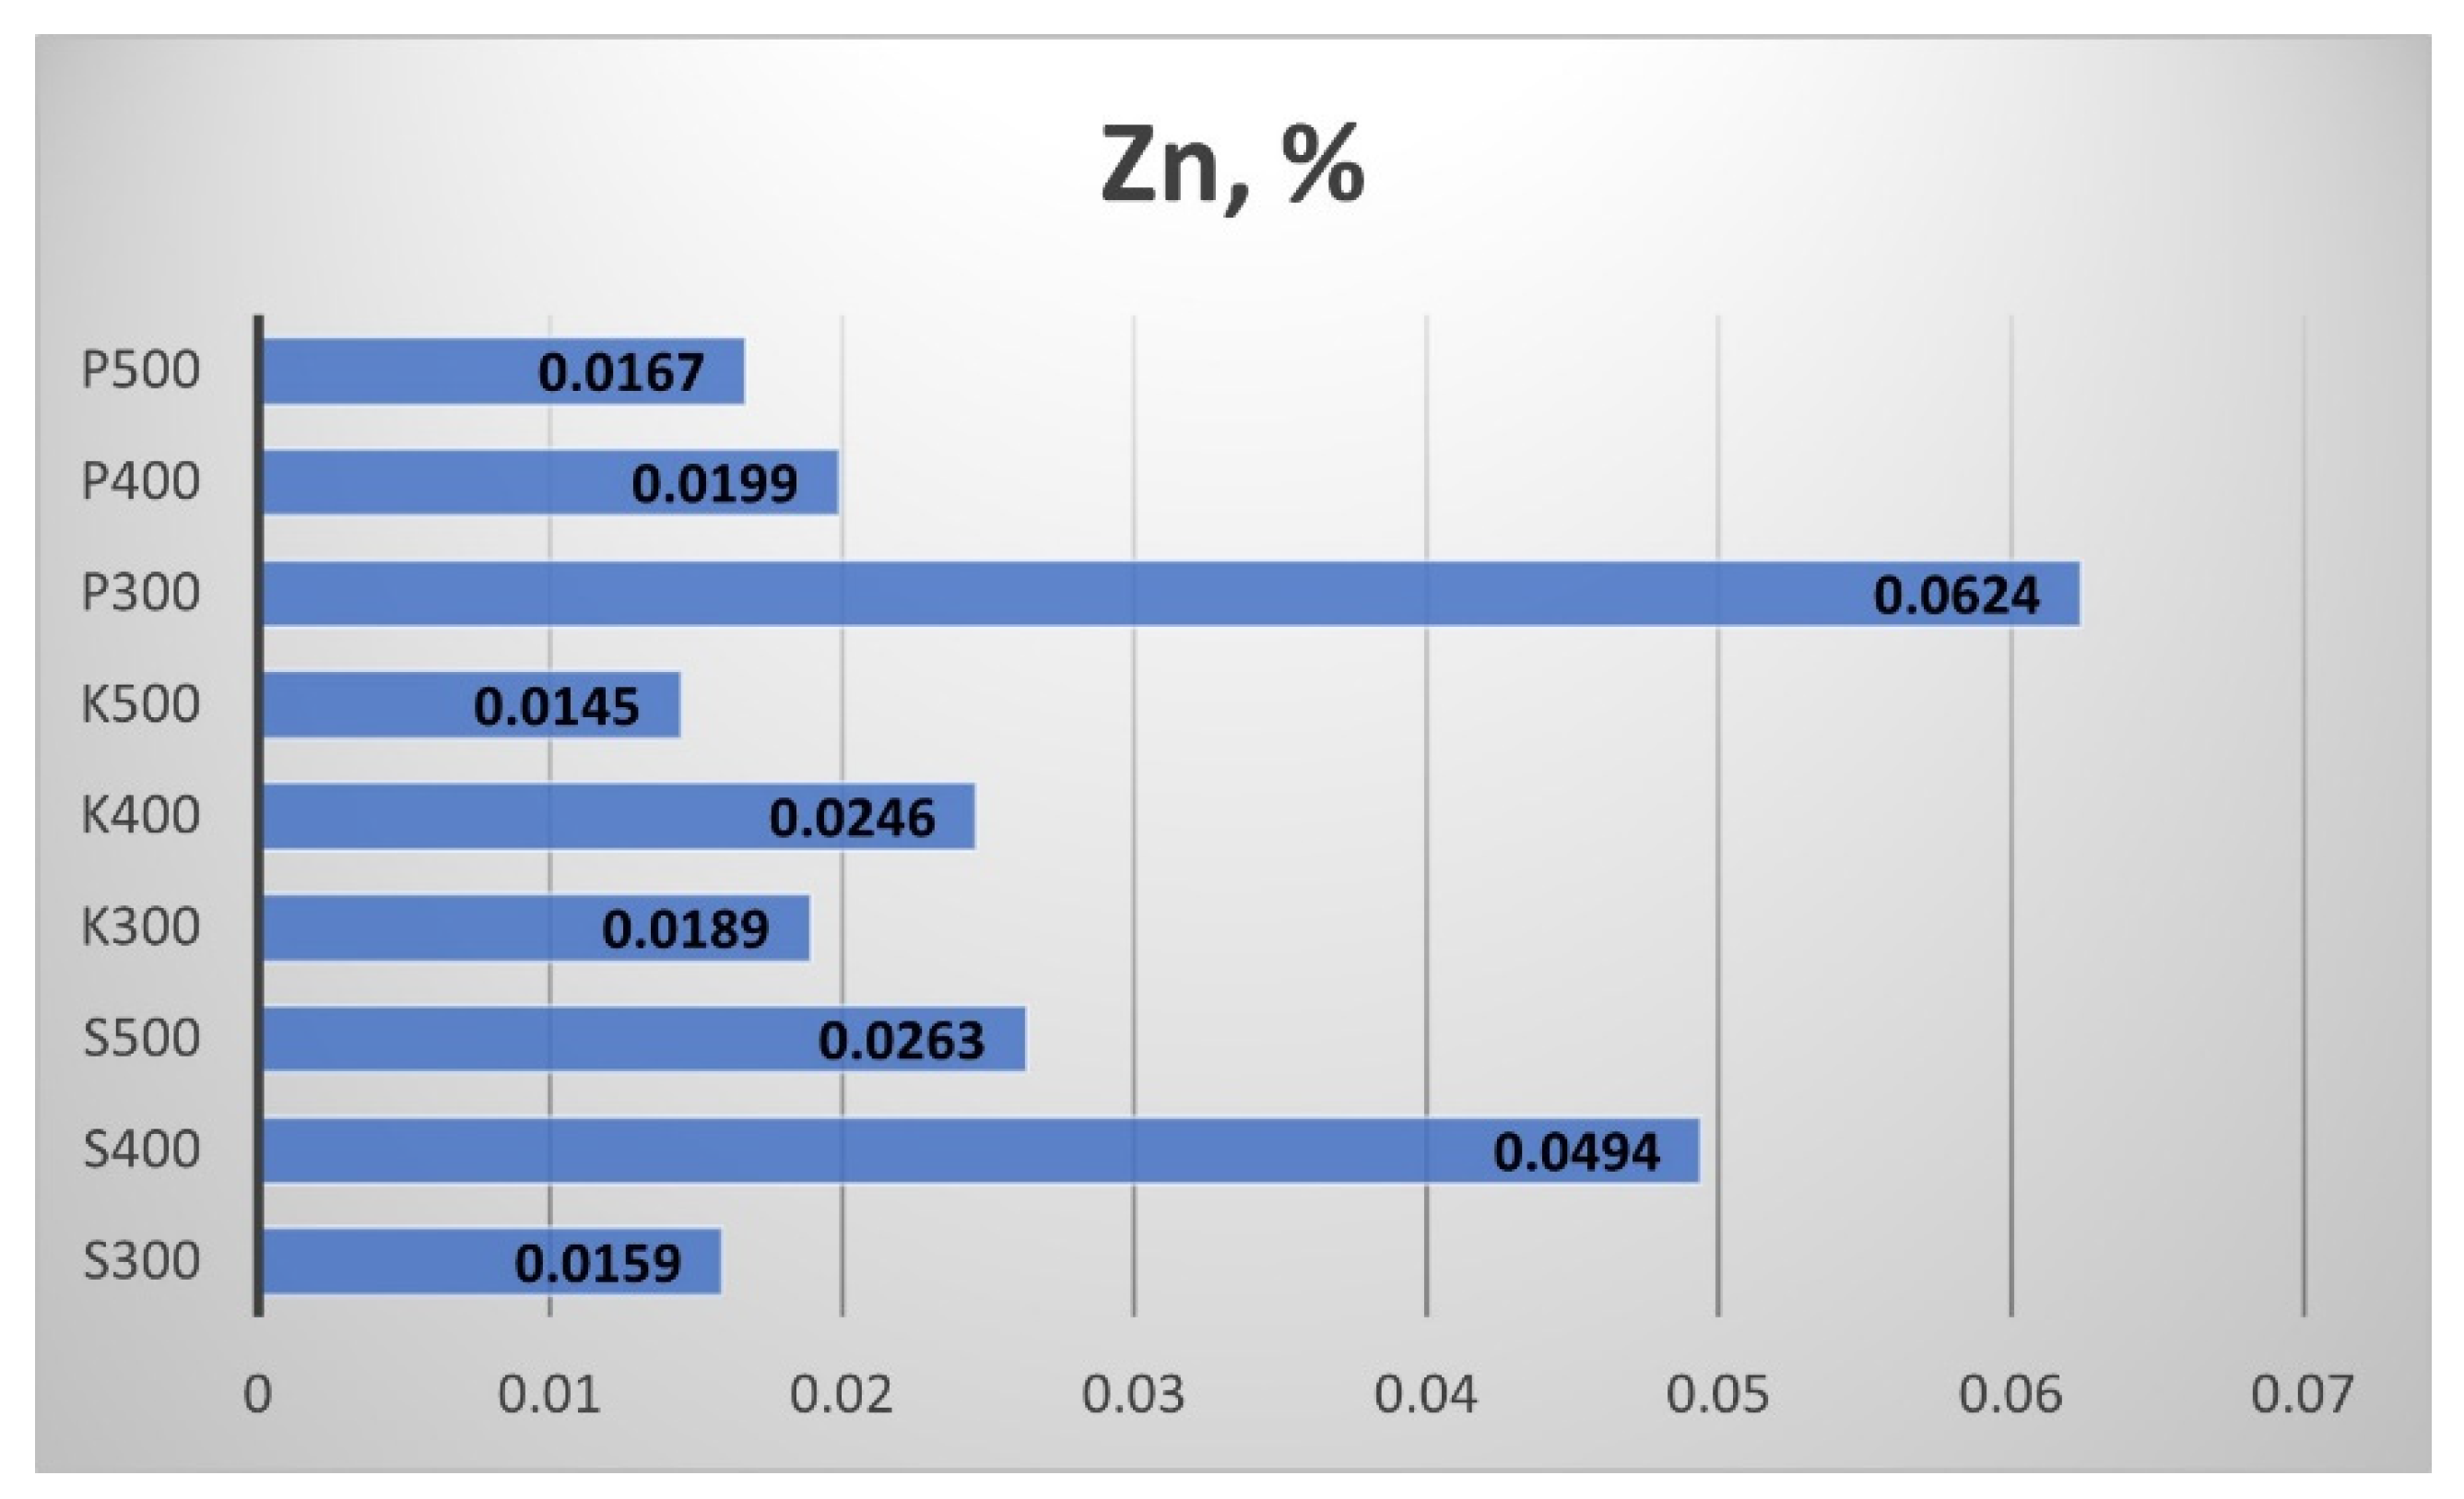
The results for the Zinc (Zn) content in the produced biochar are shown in
Figure 27. The highest is the Zn content in the straw biochar from Pazardzhik, produced at 300 °C and that from Sandanski, produced at 400 °C.
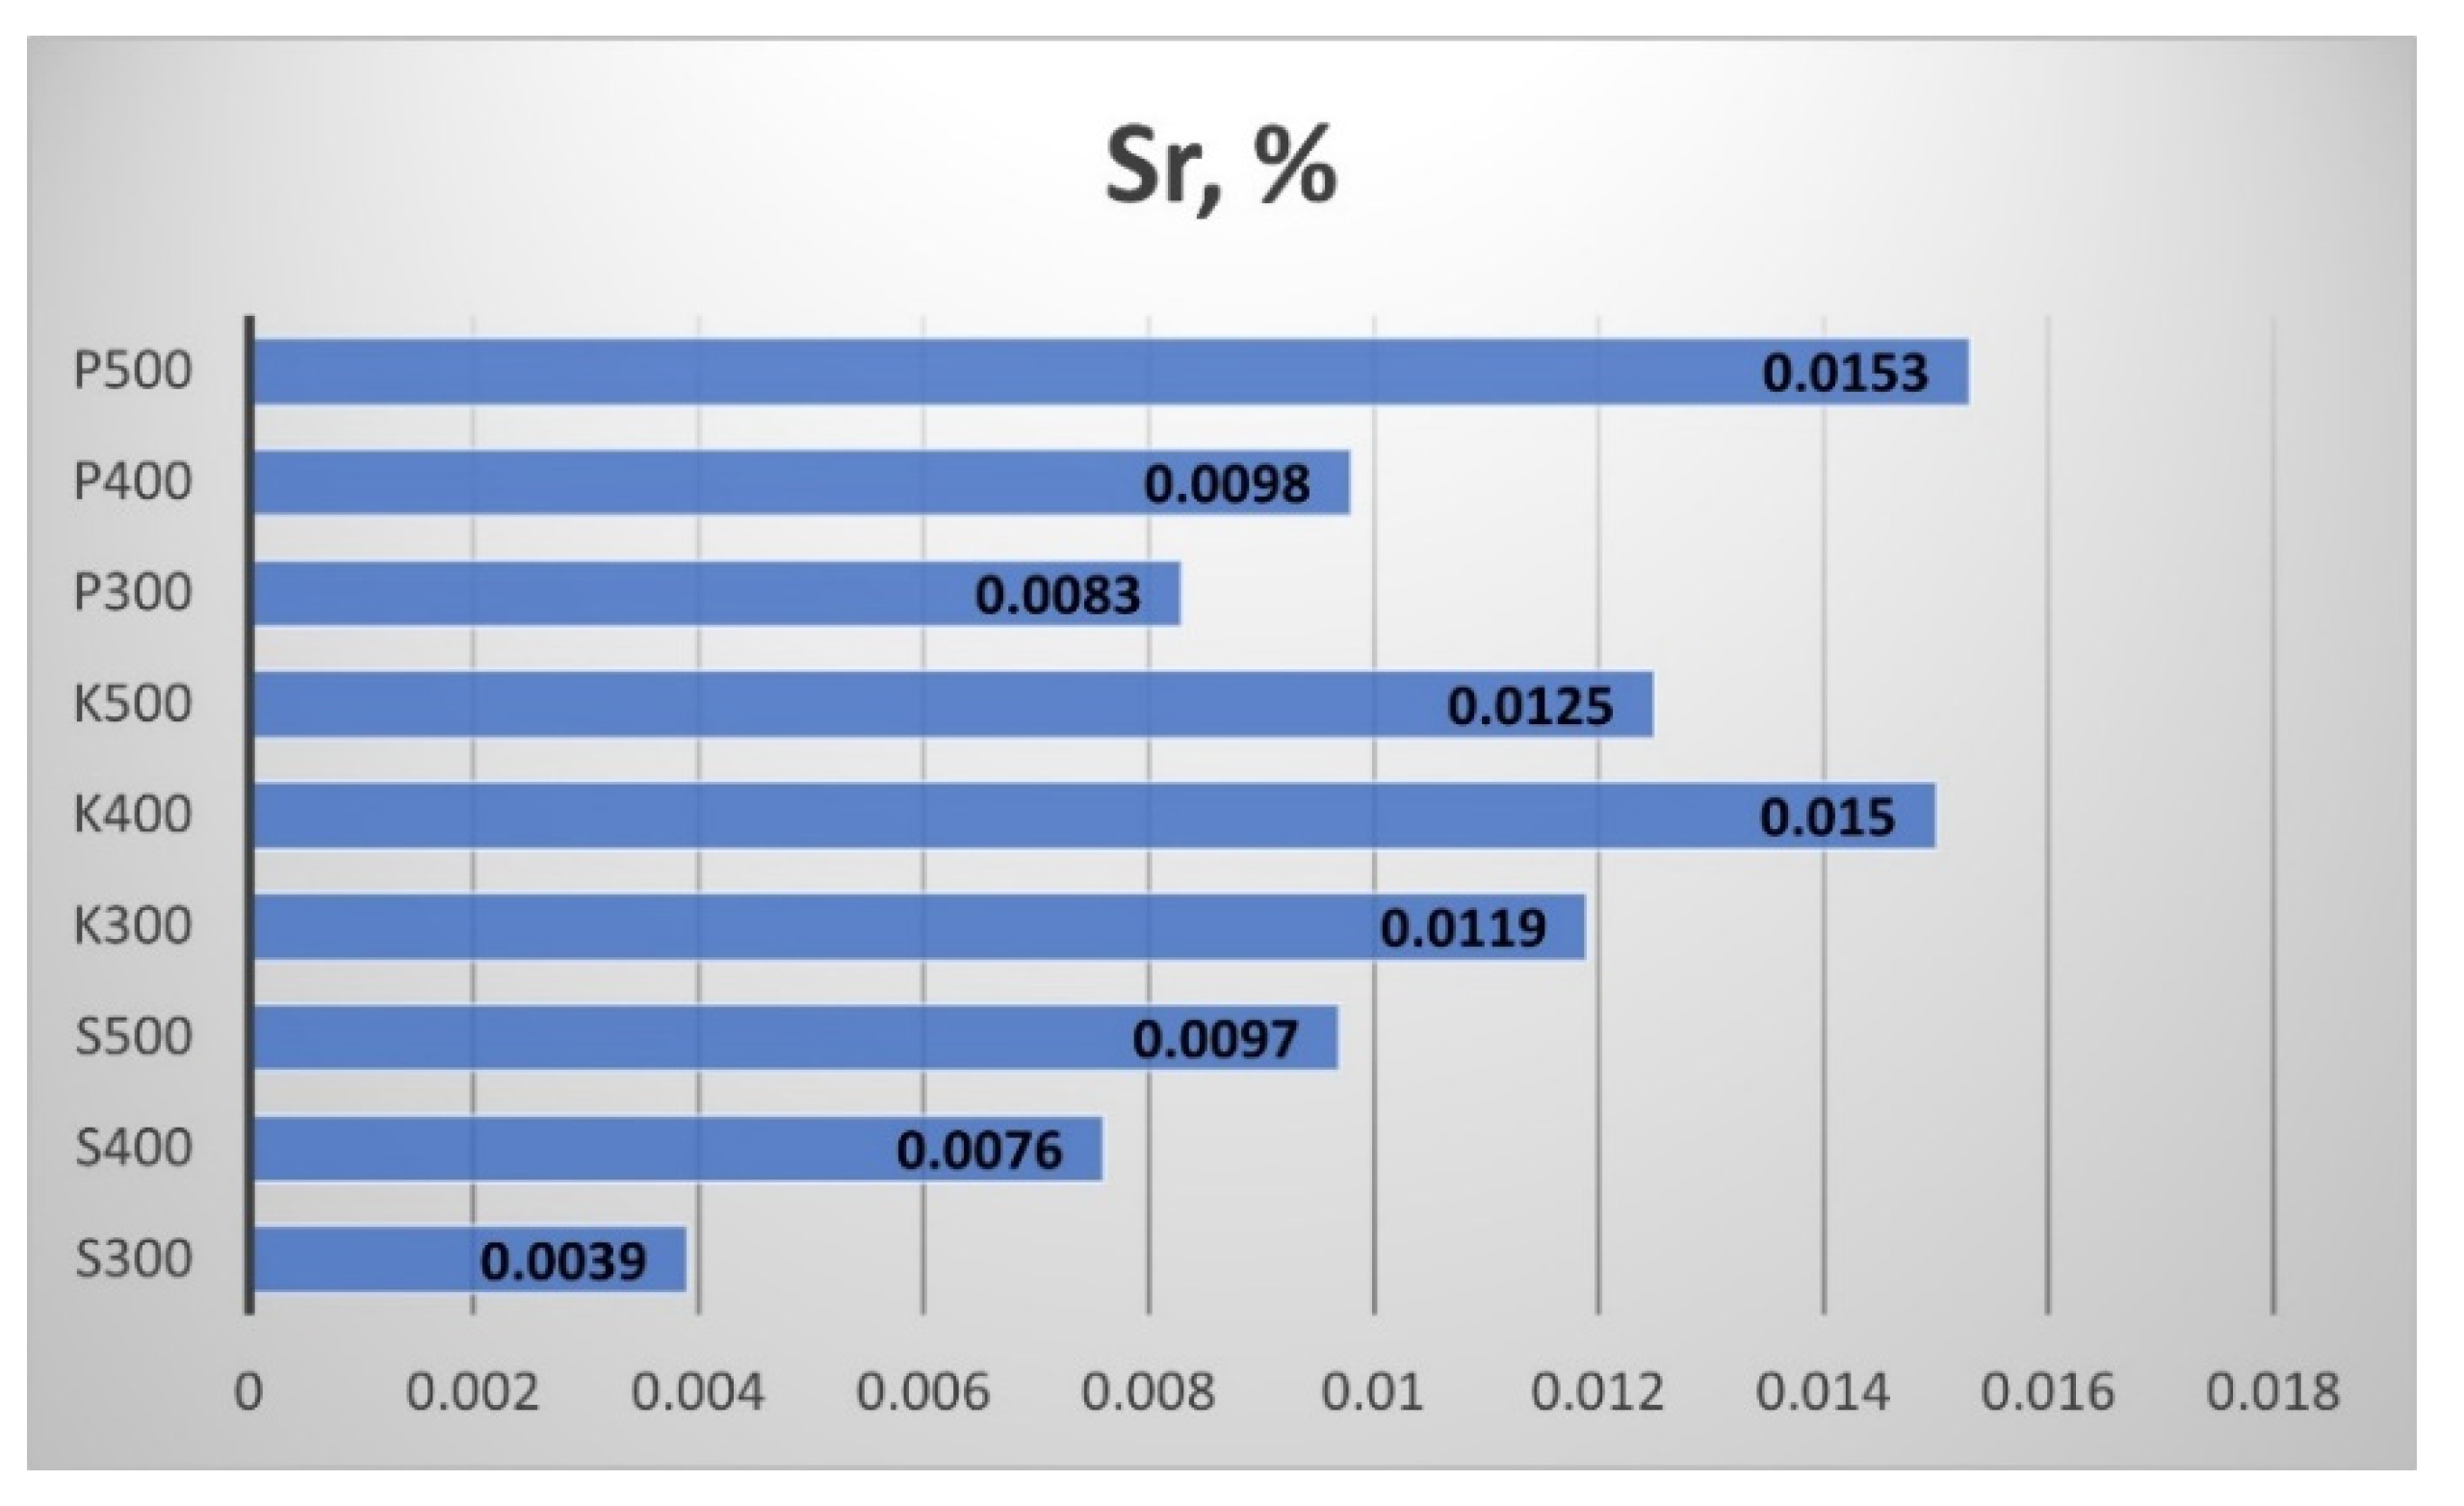
The content of Strontium (Sr) and Palladium (Pd) in the produced biochar are shown in
Figure 28 and
Figure 29, respectively. All samples contained Sr, even in small quantities, and the pyrolytic temperature influenced this amount. Three biochar samples had null Pd: two from Sandanski and one from Pazardzhik.
4. Discussion
The moisture content M
ad is important as it influences the dielectric characteristics of biochar. Due to the high degree of polarization of water molecules under electromagnetic radiation, the dielectric characteristics of biochar have been observed to increase with moisture content [
33]. The moisture in biochar also affects the erosion of the biochar particles. It was found that a gravimetric moisture content at or above 15% is needed to ensure adhesive effects between the small particles [
34]. Our biochar had less moisture content, which could lead to a faster erosion due to wind and would require more frequent fertilization
The presence of volatile compounds in the soil system can have mechanistic consequences by inducing a variety of plant and microbial responses [
35,
36]. The study in [
37] reported, for example, that lower pyrolytic temperatures (below 350 °C) resulted in biochar, where absorbed volatile compounds (furans, short carbon chain aldehydes, ketones) dominated. Temperatures above 350 °C lead to the production of biochar dominated by longer carbon chain hydrocarbons and absorbed aromatic compounds. Our samples were produced at a temperature below and above the suggested limit of 350 °C, but further investigation will be dedicated to the exact content of the main volatile compounds. Compared to the investigation in [
22], the content of volatile elements of our straw biochar is much higher (73 ÷ 48 wt. %) compared to their measurements (40 ÷ 13 wt. %).
A study [
38] has found that higher pyrolysis temperatures can lead to biochar production with ash content up to 80% of the biochar mass. In our case, all samples showed ash content below or around 10%. Deashing is a procedure for additional biochar treatment that could affect its activity and adsorption capacity, but the authors of [
39] assessed that it is improper to predict biochar environmental roles based on experiments with deashed biochar. However, the effect of the inorganic fraction of biochar on soils has been usually neglected except for a limited number of studies [
39].
The fixed carbon content C
fix is an important index for the biochar’s quality. The fixed carbon content depends on the heating rate and the holding time: while the increased heating rate decreases C
fix, the more extensive holding period decreases it [
40]. Our study showed that the temperature rise provoked higher values of C
fix in the biochar; however, our reference was not the holding time but the temperature.
The need to significantly increase soil productivity while minimising greenhouse gas emissions and protecting the environment necessitates the selection of suitable fertilizers for growing crops. The elemental analysis of the produced straw biochar showed that there was a suitable number of elements in the various samples necessary for soil fertility and plant development.
Al
2O
3 is needed by plants in relatively small quantities, which are taken from the soil. The presence of this chemical compound in the straw biochar would contribute to good plant development. Besides, biochar’s negative surface charge could be neutralied by the positively charged Al
2O
3 [
41].
The presence of SiO
2 in the soil or fertilizers is beneficial for the plants, as it supports their development and helps them cope with adverse external influences. The quantities available in our biochar samples are high, i.e., they would protect the health of the plants and would be beneficial to agriculture. Our findings correspond with [
42], where rice biochar production has been studied.
The P
2O
5 content of biochar is also helpful for the plants, as it is needed to build organic compounds. After ingestion, the P
2O
5 content in plants helps, in turn, the animals to build a healthier skeletal system. The same is valid for K
2O: its presence significantly improves plants’ health and development and their ability to protect themselves from harmful external influences. Recently, it has been found that the presence of N
2, P
2O
5, and K
2O in biochar additions could increase the abundance of several effective bacteria closely related to plant maturation [
43].
Our straw biochar also contained CaO, TiO
2, and Fe
2O
3 as chemical compounds. Calcium oxide plays an essential role in the production of plants’ tissues and helps activate certain enzymes important for good plant growth. CaO also affects the development of the root system, which increases the plant’s resistance to wind and erosion. TiO
2 helps to produce carbohydrates and, similarly to CaO, stimulates plant growth. Fe
2O
3 is needed for plant fertility, and to achieve the required amount of iron, watering with iron oxide water is applied [
44].
The presence of S, Zn, Sr, Ni, Cu, and Pd in the produced straw biochar is also useful for the plants’ growth. The sulphur helps build proteins, needed for plants development and fertility. Vanadium is helpful for plants in low concentrations; in large quantities, it is harmful. The values in our biochar samples were minimal and could be expected to be beneficial for the plants’ growth.


 ,
, 


