Article

Ten-Year Changes in Global Warming Potential of Dietary Patterns Based on Food Consumption in Ontario, Canada

School of Environment, Enterprise and Development, Faculty of Environment, University of Waterloo, 200 University Avenue West, Waterloo, ON N2L 3G1, Canada
*
Author to whom correspondence should be addressed.
Sustainability 2022, 14(10), 6290; https://doi.org/10.3390/su14106290
Submission received: 15 February 2022 / Revised: 17 May 2022 / Accepted: 18 May 2022 / Published: 21 May 2022

Abstract

:
Many studies have evaluated the life cycle environmental impacts of diets based on a single period, but few studies have considered how environmental impacts of diets change over time, even though dietary patterns (DPs) change due to policy and socio-demographic factors. This study evaluated changes in the global warming potential (GWP) of DPs in the province of Ontario, Canada, using a life cycle assessment. We quantified the farm-to-fork GWP of six DPs (Omnivorous, No Pork, No Beef, No Red Meat, Pescatarian, and Vegetarian), using dietary intake data from a 2014 and 2015 survey. Throughout this period, the biggest decrease in GWP was for DPs containing beef, even though these DPs still have the highest GWP (3203 and 2308 kg CO2e, respectively, based on the annual energy intake of one individual). Across all DPs, plant-based proteins contributed less than 5% to GWP, while meat and fish contributed up to 62% of the total GWP. Ten-year GWP reductions are insufficient to meet climate change and other sustainability goals, and major dietary shifts are needed, particularly substituting animal-based proteins with plant-based proteins. To design effective interventions for shifting towards sustainable diets, research is needed to understand how socio-demographic and regional differences influence individuals’ food choices.

1. Introduction

Globally, individual and societal dietary patterns (DPs) are negatively affecting human health, resulting in severe environmental impacts. The global food system is estimated to contribute to up to 34% of global warming [1]. The majority of global warming potential (GWP) associated with food systems is attributed to the production of animal-based foods and comprises emissions from feed production, manure management, and enteric emissions from ruminant animals [2]. In contrast, diets with plant-based proteins, non-starchy vegetables, whole grains, whole fruits, and unsaturated fat are considered healthier than animal-based proteins (particularly red meat), and have been found to contribute less to global warming compared to animal-based foods [3]. Furthermore, recent global modeling studies show that the potential gains in agricultural productivity by 2050 will not be enough to meet climate change targets without changing current consumption habits [4,5]. Thus, it is urgent to shift towards sustainable diets that are both healthy and low in embodied carbon.
A growing body of research is highlighting the environmental impacts of current diets in various countries and regions [6,7,8,9]. These studies have evaluated impacts based on a snapshot of food consumption, e.g., on one day, month, or year. However, society’s food consumption can change over time. Despite this, only a few studies have evaluated the changes in environmental impacts of dietary choices based on food consumption over time [10,11], representing a fundamental gap in the understanding of the environmental impacts of DPs over time and across regions. Prior work has largely focused on changes in the GWP of dietary choices relative to food intake without accounting for improved efficiencies in agricultural production or the reduced carbon intensity of the electricity grid. In addition, prior work has only evaluated the impacts considering a system boundary from cradle to gate. In a Swedish study, Hjorth et al. [12] concluded that there was no significant change in dietary GWP per capita based on a 10-year longitudinal dietary intake survey. In contrast, Gill et al. [13] showed a substantial increase in GWP of diets per capita in Brazil over 10 years, due to increased consumption of meat (the GWP increase in meat consumption is 2.5 kg CO2e/capita/day in Brazil while this was less than 0.5 kg CO2e/capita/day in India and China), and a slight increase in GWP per capita in China and India due to higher consumption of cereals. Therefore, it is important to understand, specific to the geographical context, what changes are occurring in the GWP of DPs and what drives these changes, to design effective interventions for shifting DPs towards more sustainable food choices.
Although there have been many studies on the environmental impacts of DPs globally [3,5,14], there are only three studies on the impacts of Canadians’ diets: two studies focused on Ontario, the most populous Canadian province; and one study focused on Canada. Auclair and Burgos [15] evaluated the GWP of Canadians’ daily food consumption for each participant in a 2015 food intake survey, and concluded that the cradle-to-farm gate GWP of the highest quintile was five times higher than that of the lowest quintile. However, this study used a global life cycle assessment (LCA) database that is not specific to Canadian agriculture practices. Veeramani et al. [16] created representative dietary baskets using Ontarians’ individual food intake data from 2004, and calculated the farm-to-fork GWP of these baskets based on a Canadianized LCA database. This study demonstrated that DPs with beef had the highest GWP while Pescatarian, Vegetarian, and Vegan DPs had the lowest. Veeramani et al. [17] also adjusted 2004 DPs to meet nutritional requirements based on Canada’s Food Guide, the national dietary guideline, by substituting a portion of high carbon-intensity foods with low-carbon alternatives (e.g., less beef and more chicken) and found that the GWP of DPs could be reduced by up to 30%. However, this is based on older data, and it is important to understand whether diets are changing over time and how these changes affect environmental impacts.
The aim of this study is to: (i) compare and evaluate the GWP of representative DPs based on food consumption using data from 2004 and 2015 in Ontario, Canada; and (ii) to identify which foods drive the GWP over this period, with the purpose of providing recommendations on what needs to shift in DPs to achieve climate change goals. This study uses the DPs defined by Veeramani et al. [16]. To our knowledge, this is the first study that compares impacts of DP across time considering a system boundary from farm-to-fork. This research adds to the growing knowledge on geographical and temporal aspects of the environmental impacts of DPs. The results are discussed in terms of how they can be used to develop strategies for shifting DPs to reduce GWP.

2. Materials and Methods

We used an ISO-compliant LCA (ISO 14040 [18]; ISO 14044 [19]) to quantify the GWP of Ontarians’ DPs, as described below (Scheme 1). Modeling of impacts was accomplished using SimaPro v.8.0.2 software and the IPCC 2007 GWP100 method.

2.1. Goal and Scope

The goal of the study is to quantify the GWP of Ontarians’ DPs, using data from both the 2004 and 2015 food intake surveys of Ontario residents. This analysis is expected to provide insights to researchers and policymakers about how changes in food consumption in the North American context contribute to climate change and how to develop incentives to shift towards low-carbon food consumption practices.

2.2. Function, Functional Unit, and Reference Flows

The functional unit (FU) is the basis for comparing the impact results of different products based on their primary function [18,19]. The primary function of diets is to provide nutrition. Currently, there is no consensus on what unit to use to measure nutrition, but caloric FUs are commonly used [20]. A caloric FU uses energy intake as the basis for comparison in food-related LCA studies, such as comparing food items or a meal. We used a FU of 985,500 kcal based on the weighted average caloric needs for one Ontario resident over a year. This FU was determined as follows. In Canada, there are 3494 daily calories per capita available at the retail gate [21]. We assumed that 23% of the calories are wasted in the household based on estimated food waste by the United States Department of Agriculture Loss Adjusted Food Availability (USDA LAFA) [22], and this resulted in an average of approximately 2700 energy intake over a day by one person.
The caloric FU can be met by any combination of foods; therefore, reference flows (the required amount of food to achieve the FU for each DP) were determined using actual food intake data as described in Section 2.4.1: Reference Flow of Dietary Patterns.

2.3. System Boundary

The system boundary is defined as farm-to-fork following Veeramani et al. [16]. This includes the following stages (Figure 1): (1) farm production including the upstream processes of raw materials; (2) processing and packaging; (3) household activities including home storage, cooking, and dishwashing; and (4) transportation across all stages from farm production to processing facilities and/or retail and consumer shopping. The following stages are excluded because they either make negligible contributions or have limited information: capital equipment (e.g., farm machinery, buildings) (except those included in ecoinvent), storage, and waste management activities (e.g., landfilling, composting) along the supply chain from farm to retail. Waste management activities are excluded because major changes in food consumption from 2004 to 2015 appear mostly in animal-based foods, which have less waste compared to other foods, e.g., vegetables and fruits, at the consumer level [22]; therefore, exclusion of waste management activities would not have greatly affected the differences in the 10-year changes in GWP of DPs.

2.4. Life Cycle Inventory

The life cycle inventory of this study was comprised of two types of data: (1) the amounts of each type of food consumed in each DP; and (2) the Canadianized database with farm-to-fork GWP impacts generated by Veeramani et al. [16] based on various published LCA studies of food products. This Canadianized database includes Ontario-specific transportation distances, electricity grid, etc., based on the data available by 2014. In this study, we updated the electricity grid to 2015. We used the same database for analyzing the GWP for both 2004 and 2015; therefore, changes that might have occurred from 2004 to 2015 in any of the life cycle stages were excluded (e.g., in the electricity grid, crop yields, etc.). This allows us to focus only on the changes in GWP due to the amounts of foods consumed between 2004 and 2015.

2.4.1. Foods for Dietary Patterns in Ontario

We calculated the average food consumption in Ontario for all participants using the 2004 Canadian Community Health Survey Cycle 2.2-Nutrition and the 2015 Canadian Community Health Survey-Nutrition, here referred to as 2004 CCHSN and 2015 CCHSN, respectively [23,24]. The 2004 and 2015 CCHSN are the most comprehensive and recent nutrition surveys available for Canadians. They consist of self-reported 24 h recall surveys in which each participant provides information about the amounts of individual foods and beverages consumed in one day, either as part of a meal or as a snack. For this study, we only used data from participants residing in Ontario who are older than 2 years old. There were 10,921 and 4229 data points for 2004 and 2015, respectively.
For each survey in 2004 and 2015, there are approximately 2500 individual food items that are grouped into 24 Canadian Nutrient Files (CNF) [24]. In the CNF grouping, some food items are not differentiated by the animal-based ingredients they contain. Therefore, we modified CNF groups into 20 high-level food categories (HLFC) by merging some groups with existing groups (Table 1). For example, in the CNF, soups included both vegetable-based soups and meat-based soups; therefore, food items included in the soup CNF were distributed to vegetable, beef, and chicken HLFCs. Similarly, under the CNF for sausage, there were mixed meat sausages, beef-only sausages, and pork-only sausages. These were respectively assigned to mixed meat, beef, and pork HLFC.
For average food consumption results (Tables S1–S4), the average amount of each HLFC was calculated. When calculating the weight of soups, which are typically liquid heavy dishes, we estimated that these dishes only had 20% of the main ingredient (e.g., beef) by weight. To evaluate based on the primary nutrient function of foods, we present HLFCs following the 2007 Canada’s Food Guide food categories [25] (Table 1): (i) “Meat and alternatives” (foods that are high in iron and protein (i.e., beef, pork, chicken, fish, pulses, and nuts)); (ii) “Milk and Alternatives” (foods that are mainly high in protein and calcium (i.e., dairy products such as milk, cheese)); (iii) “Fruits and Vegetables”; (iv) “Grain Products”; and (v) “Others” (includes beverages, snacks, sweets, spices and herbs, and oils and fats). For vegetables and fruits only, the mass of each food was converted into servings following the 2007 Canada’s Food Guide, since the density and nutrient value of vegetables and fruits vary widely; therefore, this approach provides a better understanding of how consumption changes, as presented in Table S4.
We assumed that participants’ 24 h recall responses in the 2004 and 2015 CCHSN surveys reflected their typical diets. A question on these surveys asked participants whether their one-day food intake was representative of their usual food intake, and about 70% of the participants stated that it was, so this assumption is reasonable. We grouped participants into six DPs (Omnivorous, No Pork, No Beef, No Red Meat, Pescatarian, and Vegetarian—Table 2) following the types of DPs determined by Veeramani et al. [16]. Note that Vegan DP, which excludes all animal-based foods including milk and eggs, was initially determined, but the results could not be published due to the small number of respondents in this category, and the associated confidentiality restrictions of Canadian Community Health Survey—Nutrition. We identified the DP of a participant using a decision tree, coded using SPSS, which is based on the presence and/or absence of five HLFCs in the participant’s intake: fish, poultry, mixed red meat, pork, and beef (Figure A1 and Figure A2). For example, if a participant excluded all five HLFCs, then the participant was categorized as Vegetarian. After labeling each participant with a DP, the percentage of DPs in Ontario was calculated.
To formulate representative DPs, we identified the most frequently consumed food items for each HLFC based on the number of people consuming these items. In the end, out of 2500 food items that appear in the CCHSN survey, we identified most of the frequently consumed food items for each HLFC and calculated the total mass of each item. In total, there were 50 different most frequently consumed food items for each DP. Reducing the number of food items was required because the life cycle inventory is only available for a relatively small number of food items. For example, in the 2015 Omnivorous DP, the most frequently consumed food items of milk products in ‘dairy and eggs’ HLFC was ‘2% milk’. Therefore, the sum of all milk products (e.g., 1% milk, 3.25% milk) was assigned to ‘2% milk’.
We calculated the daily protein intake of each DP by converting the weights of the most frequently consumed food items to their corresponding protein-grams following the USDA nutrition database [26]. The weighted average (by age and gender of Ontario residents) recommended daily protein intake was 51 protein-grams/capita/day as determined by Veeramani et al. [16].

Reference Flow of Dietary Patterns

The reference flows, i.e., the required amount of food to achieve the FU, are determined by using actual food intake data from CCHSN. Each DP resulted in a different yearly energy intake per person. To achieve the determined caloric FU, food items in each DP are multiplied with a constant adjustment factor (AFc). This constant AFc is determined by dividing the FU (985,500 calories) by the number of yearly energy intake (EI) of each DP per person, as follows.
FU = AF ci · EI i
therefore
AF ci = FU ÷ EI i
where
  • AFci is the constant adjustment factor for dietary pattern ‘i’;
  • FU is the functional unit (985,500 energy intake by the average Ontarian over a year);
  • EI is the average energy intake for one person over a year based on dietary pattern ‘i’.
For example, the foods identified for the 2015 Omnivorous DP, provided 821,250 calories over a year, therefore; the AFc is 985,500/821,250 = 1.20. The constant adjustment factors calculated for each DP are presented in Table 3.
In addition, self-reported surveys can have under-reporting issues due to forgotten or incorrectly estimated portions of consumed foods that can result in underestimation of energy and protein [27,28]. We mitigated this issue by evenly adjusting the amounts of each food type to yield the reference flows (the amount of food required to meet the FU for each DP).

Sensitivity Analysis on Reference Flows

Because 24 h recall self-reported studies can have under-reporting issues, we applied sensitivity analysis to the adjustment factors used to determine the reference flows (amounts of food in each diet). Studies using biomarkers, which help to detect levels of certain molecules in the blood, have investigated the magnitude of under-reporting in 24 h recall studies both for energy and protein intake. For energy intake, underestimation can range from 15% to 25%, whereas for protein intake, underestimation is around 5% [27,28].
Sensitivity analysis on the reference flows was conducted by using different reference flows for each DP, based on the uncertainty of which foods are under-reported. Instead of using the same adjustment factor for all food types in each DP (Table 3), we applied different adjustment factors to three food groups, as follows: (1) Animal-based foods—increased consumption by 5% based on [27,28] (i.e., adjustment factor is 1.05); (2) Plant-based proteins, vegetables, and fruits—no adjustment because these tend to be correctly reported [28] (i.e., no adjustment factor applied); (3) Remaining foods—adjusted by a DP specific adjustment factor (Table 4) to obtain the FU (985,500 calories for a person over a year).
The calculation of specific AF for each DP is as follows:
FU = 1.05 ( EI ai ) + ( EI pi ) + ( AF si · EI ri )
therefore
AF si = [ ( FU 1.05 ( EI ai ) ( EI pi ) ] ÷ ( EI ri )
where
  • AFsi is the DP-specific adjustment factor for remaining foods for dietary pattern ‘i’;
  • FU is the functional unit (985,500 energy intake by the average Ontarian over a year);
  • EIai is the energy intake of animal-based foods for dietary pattern ‘i’;
  • EIpi is the energy intake of plant-based foods for dietary pattern ‘i’;
  • EIri is the energy intake of remaining foods for dietary pattern ‘i’.

2.4.2. Canadianized Farm-to-Fork Database

The farm-to-fork database was generated based on LCA studies from journal articles, trade statistics—including domestic and imported foods—and food waste estimates along the food supply chain, as described in Veeramani [16]; Supplemental Information Table S1. From this database, we used 50 food items.
In this study, we updated food waste amounts in the Canadianized database [16], by using USDA LAFA [22], which is more representative for two reasons. First, the Agriculture Ministry, Agriculture and Agri-Food Canada uses the USDA LAFA source to estimate food waste in Canada. Second, USDA LAFA provides food waste information for various food products along 3 main stages, processing, retail, and household, of the food supply chain allowing a more realistic food waste estimation between different food categories. For each food item, we applied food waste at three levels: farm to retail (including processing), retail, and household (Table A1). We accounted for food waste using two sources: (1) USDA LAFA; and (2) FAO Cooking Yield report [29]. USDA LAFA is chosen based on the assumption that the United States and Canada have similar food losses along the food supply chain. Food waste percentages were used to calculate the amount of food needed to obtain the food consumed. For example, if 12% of broccoli is lost at retail, then 1.14 kg of broccoli would be needed at the retail store for 1 kg to be available to the consumer.
We considered the origin of production to better estimate the associated GWP. The environmental impacts of food production practices can vary based on the origin of production and agricultural practice applied (e.g., conventional, organic, and greenhouse-grown) [30,31]. The highest GWP contributors are animal-based foods. LCA data of animal-based foods are modelled considering the predominant practice in Canada (conventional agriculture) to better estimate the associated impacts. This is because almost all animal-based foods are produced in Canada. Specifically, Canada produces 80% of domestically consumed meat, dairy, and eggs, except domestically consumed fish, of which 50% is imported [32]. For example, beef production is dominant in the Canadian Prairies [33], and the selected LCA study reflects this Canadian beef production. Even for plant-based foods, which typically have lower GWP, the origin of production is determined using Canadian trade data as in Veeramani et al. [16]. Similar to animal-based foods, when selecting LCA published papers, the origin of production information is used, where data are available, to reflect an average estimate of the GWP of that particular food [16]. However, we also assumed that production practices were uniform for some food items. For example, we assumed that all fresh tomatoes are grown in greenhouses in Ontario. Although some fresh tomatoes are field grown either in Ontario or elsewhere, there was a lack of production data for these foods.

3. Results

The results are presented as follows: (i) Changes in Ontarians’ dietary preferences and GWP of Ontarians’ DPs from 2004 to 2015; (ii) Sensitivity Analysis on reference flows, and (iii) Sensitivity Analysis of salmon production and supply chain. All results are presented based on the FU, unless otherwise noted.

3.1. Dietary Pattern Shifts and Associated Global Warming Potential

Approximately 92% of the Ontarian DPs included meat and/or fish (Table 5) both in 2004 and 2015. However, there was a shift from red-meat-consuming DPs to those with No Red Meat and Pescatarian. Specifically, Ontarians that followed an Omnivorous DP decreased by 7%, while those following No Red Meat and Pescatarian DPs increased by 5% and 2%, respectively. There were no notable changes in the No Pork (decreased by 1%), No Beef (increased by 1%), and Vegetarian (no change) DPs.
Across Ontario (i.e., not at DP level), annual meat consumption decreased from 60.9 to 59.7 kg/capita/year between 2004 to 2015, while fish consumption increased from 7.2 to 9.2 kg/capita/year over the same time period (Table S1). Specifically, per capita consumption of beef and mixed red meat (beef and pork), decreased by 20% and 32%, respectively, while pork consumption decreased slightly by 3%. Consumption of poultry and fish increased by 18 and 28%, respectively, from 2004 amounts.
Ten-year changes in GWP varied across different DPs. The GWP of the following DPs decreased from 2004 to 2015: Omnivorous (−8%); No Pork (−6%); and No Red Meat (−5%) (Figure 2). In contrast, the GWP for No Beef and Pescatarian DPs increased by 9% and 5%, respectively. The higher GWP in 2015 for the No Beef DP is due to higher consumption of eggs, greenhouse-grown tomatoes, and salmon relative to 2004 values, while the higher GWP for the Pescatarian DP is due to higher consumption of salmon.
The DPs with the highest GWPs were similar in 2004 and 2015. Specifically, both in 2004 and 2015, No Pork DP had the highest GWP (Figure 2) and the Omnivorous DP had the second-highest GWP. Beef contributed to 36% and 60% of the total GWP of the Omnivorous and No Pork DPs, respectively, in 2015 (Tables S6 and S7). In both 2004 and 2015, the Pescatarian DP had the third-highest GWP. In 2015, salmon was the biggest contributor to GWP for the Pescatarian DP (Table S10) as the salmon consumption of Pescatarian DP increased by 67% from 2004 to 2015. In GWP terms, this corresponds to an increase of 305 kg CO2e. Interestingly, this is the highest absolute GWP increase observed among all food items across all DPs. Although the GWP contribution of salmon in other DPs is relatively low, it contributed to an increase in GWP of 53% to 102% across all DPs, except Vegetarian (Tables S6–S11). Finally, in both 2004 and 2015, the No Beef, No Red Meat, and Vegetarian DPs consistently have the lowest GWP, with the Vegetarian GWP being less than half of the No Pork DP.
Although specific food items made large contributions to the GWP of different DPs, it is also interesting to note the overall GWP of food categories based on protein type (Figure 2): ‘Other foods’, ‘Plant-based proteins’, ‘Animal-derived proteins’ (i.e., dairy and eggs), ‘Animal proteins (fish)’, and ‘Animal proteins (meat)’ (i.e., beef, pork, and poultry). In absolute terms, the GWP was similar across all DPs for ‘Other foods’, ‘Plant-based proteins’, and ‘Animal-derived proteins’. For example, the GWP of ‘Other foods’ ranged from 853 to 985 kg CO2e/FU in 2004, and 821 to 905 kg CO2e/FU in 2015, while the GWP of ‘Plant-based proteins’ ranged from 10 to 44 kg CO2e/FU in 2004, and 18 to 58 kg CO2e/FU in 2015.
Although we see similar absolute GWP contributions of these three food-protein groups across all DPs in both 2004 and 2015, their relative contributions vary significantly across DPs. For example, the relative GWP contribution of ‘Other foods’ ranged from 26% (No Pork) to 67% (Vegetarian) in 2004 and 27% (No Pork) to 63% (Vegetarian) in 2015 of the total GWP (Table S5). Animal-derived proteins (dairy and eggs) contributed between 10% (No Pork) and 30% (Vegetarian) of the GWP in 2004 and 9% (No Pork) and 33% (Vegetarian) of the GWP in 2015. For ‘Plant-based proteins’, the percent contribution ranged from 0.4% (No Pork) to 2.3% (Vegetarian) in 2004, and 0.8% (No Pork) and 4.1% (Vegetarian) in 2015, which is the lowest contribution of any of the food categories. This low contribution is due to both the low consumption of plant-based proteins, and their low GWP. In 2004, plant-based proteins of No Pork and Pescatarian were 9 and 21 kg/capita/year, respectively, while in 2015, plant-based proteins of No Pork and Pescatarian were 15 and 21 kg/capita/year, respectively (Tables S7 and S10).
In contrast, the GWP contribution of ‘Animal proteins (meat)’ ranged from 0 for Vegetarian, to as high as 2096 kg CO2e/FU for the No Pork DP in 2004 (Figure 2). In the ‘Animal proteins (meat)’ category, the No Pork DP had the highest contribution at 62% in 2004 and 61% in 2015, followed by the Omnivorous DP, at 50% in 2004 and 47% in 2015 (Table S5).

3.2. Sensitivity Analysis

The prior work by Veeramani et al. [16], on which this study is built, had already conducted a sensitivity analysis on: (i) functional unit (FU) (i.e., calorie vs. protein-based FU); and (ii) beef production systems. This work had concluded that the GWP ranking of DPs would be the same. We, therefore, did not repeat this sensitivity analysis in our work as our findings for at least 2004 are similar and instead focus on the sensitivity analysis on the reference flows and salmon production and supply chain.

3.2.1. Sensitivity Analysis on Reference Flows

A sensitivity analysis was conducted to determine the effect of a different approach to adjusting the amounts of food (i.e., reference flows) in each DP to account for under-reporting.
The sensitivity analysis shows that the percentage changes in GWP for sensitivity analysis vs. baseline decreases across all DPs, both in 2004 and 2015 (Table 6). This is because a lower adjustment factor (5%) was used for animal-based foods, resulting in lower amounts of animal-based foods, which have high GWP (note that the lowest constant adjustment factor applied is 15% to estimate baseline GWP of DPs as presented in Table 3).
Differences in the percentage changes in GWP for sensitivity analysis vs. baseline were highest for 2015 No Pork (−20%), Pescatarian (−24%), and Vegetarian (−21%) DPs. Nevertheless, the overall rank order for the DPs with the highest GWP remains the same regardless of the adjustment method. This means that the results are robust in terms of the relative GWP of the various DPs.

3.2.2. Sensitivity Analysis of Salmon Production and Supply Chain

In absolute terms, salmon in Pescatarian DPs contributed the most to GWP and its 10-year GWP change (305 kg CO2e) was the highest GWP increase across all DPs for any food item. Salmon was modeled based on available data of salmon farmed [34] and canned in British Columbia and then transported by truck to Ontario, as this was the most frequently consumed fish. Since there was large uncertainty in the combination of the supply chain processing, we conducted a sensitivity analysis on these factors (i.e., estimating the ten-year changes in GWP of Pescatarian DP by replacing original salmon with alternative salmon models), as follows (Table S13).
First, we introduced an alternative supply chain for farmed salmon in British Columbia, as fresh and frozen: (i) frozen farmed salmon in British Columbia [34,35], which is transported by refrigerated truck to Ontario; and (ii) fresh farmed salmon in British Columbia [34], which is transported by refrigerated air freight to Ontario. Second, we introduced wild-caught salmon, using the latest available GWP data of seafoods [30], and assuming that it is caught in Alaska, based on Canadian import data [36]; (iii) frozen wild-caught salmon in Alaska with average global GWP emissions [37], which is transported by refrigerated truck to Ontario.
The sensitivity analysis results showed that the magnitude of the 10-year changes in GWP of Pescatarian DP did not change substantially (Table 7). Specifically, 10-year changes in GWP of the Pescatarian DP with (ii) fresh farmed salmon in British Columbia, and (iii) frozen wild-caught salmon in Alaska increased by 7%. This is an increase of 2% from the 10-year changes in GWP observed in the original Pescatarian results (which is 5% as presented in Table 4). At the same time, the 10-year changes in GWP of Pescatarian DP with (i) frozen farmed salmon in British Columbia increased slightly by 1%, which is a decrease of 4% from that of original Pescatarian results (from 5% to 1%). This analysis suggested that the 10-year changes in GWP are not sensitive to the salmon production and supply chain, even in Pescatarian DP with the highest salmon share.

4. Discussion

The aim of this study was to: (i) compare and evaluate the changes in the GWP of representative DPs from 2004 to 2015 in Ontario, Canada; and (ii) to identify the food drivers of the GWP over this period, with the purpose of providing recommendations on what needs to shift in DPs to achieve climate change goals.
Ontarians’ meat consumption changed from 2004 to 2015; specifically, red meat consumption decreased by up to 32%. Beef consumption decreased by 20%, which may have been a result of beef prices increasing almost twofold between 2004 and 2015 [38]. Decreasing beef consumption also occurred across Canada [39]. The price of pork only increased by 28%, and pork consumption only went down by 3% [38]. In contrast, poultry, fish, and egg consumption increased by 18 to 31%. Poultry and salmon prices increased by up to 43% [38]. Fish consumption in Ontario increased by 28% from 2004 to 2015, but decreased by 10% across Canada [39]; however, salmon consumption in Canada increased by 32% [36,40,41]. Increased fish consumption was evident in all DPs, except the Vegetarian DP. The change in meat consumption could therefore be a result of both prices and health concerns, where poultry and fish, in particular, are seen to be healthier than red meat [42].
There was a reduction in GWP from 2004 to 2015 for all DPs except Pescatarian and No Beef. In contrast, Hjorth et al. [12] found almost no change (i.e., 3% reduction) in average Swedish dietary GWP per capita from the year 1996 to the year 2016. Gill et al. [13] showed a high increase in the per capita GWP of daily food consumption (2.5 kg CO2e) in Brazil, due to increasing consumption of meat, particularly red meat.
Nevertheless, the rank order of GWP of DP from highest to lowest remained the same, with DPs that contained high amounts of red meat having the highest GWP (No Pork, Omnivorous). DPs without red meat had the lowest GWP (No Red Meat, Vegetarian). The Pescatarian DP had the third-highest GWP, and had a higher GWP in 2015, due to increased fish consumption.
Consumption of plant-based proteins remains low in all diets, even the vegetarians, where protein sources are largely from dairy and egg products. The combination of low consumption and low GWP of these products [17], means that this food category only contributed between 0 and 4% of the total GWP.

4.1. Implications of Changing Dietary Patterns

Although the per capita GWP of DPs decreased by 10% from 2004 to 2015, Ontario’s population has increased by 11%; therefore, the total DP-based GWP of Ontarians remains the same (Table S12). Therefore, to meet Ontario’s climate targets, the per capita GWP of DP needs to decrease substantially. This becomes more important once Ontario’s population projections are considered for the next 25 years. It is estimated that the population will grow by 32% [43]. If the GWP of food consumption per capita remains the same, then Ontarians’ total food consumption GWP will increase by 32%. There may be several opportunities to reduce GWP.
Red meat-based DPs are still highly popular, making up almost two-thirds of the DPs in Ontario. In particular, beef and mixed red meat have high GWP, and reducing the amount of red meat in a DP, without eliminating it, was found to lower the GWP of DPs with red meat in Ontario [17]. It seems that reduced beef consumption was driven by large increases in the price of Canadian beef from 2004 to 2015, therefore increasing prices or putting carbon taxes could further reduce demand for beef. There could also be strategies that aim to get consumers to voluntarily reduce beef and red meat consumption, but this type of advanced messaging should also target consumption of other foods with relatively high GWP, such as certain types of seafood (e.g., shrimp) [30,44]. Additionally, the health benefits of red meat reduction could be emphasized.
Another opportunity is to find strategies to reduce the current average energy intake, estimated at 2700 kcal/capita/day, to the average recommended energy intake of 2300 kcal/capita/day (weighted average based on Ontario population demographics [45]. Much of the Ontario population is overweight or obese (57%) [46]. If Ontarians lowered their energy intake to recommended levels, even without changing any other consumption habits, the GWP of all DPs would decrease by 14% (Figure S1). Obtaining recommended energy intake would have positive impacts not only on the environment but also on Ontarians’ health by reducing excess calories that lead to increased body mass and associated non-communicable diseases. However, it has always been extremely challenging to get individuals to change their eating habits due to the influence of nutrition environments [47], which reflect consumer interactions with food outlets, such as restaurants or grocery stores, and their social environment, including family and social influencers [47]. For example, for low-income consumers, dietary choices are significantly impacted by cost compared to other factors [48,49]. Interventions, such as taxation, banning unhealthy food, and environmental interventions (i.e., changing the physical environment and food positionality or provision of information and food labeling), have been shown to change dietary choices [50,51]. Furthermore, retail food environments such as grocery stores can be assessed using a variety of assessment tools [52,53] to examine whether retail store characteristics support sustainable and healthy food choices. These tools focus on the availability, price, and quality of healthy and sustainable food choices, which are all significant factors impacting DPs.
A final opportunity for reducing the GWP of DPs is to reduce Ontarians’ protein intake, which has remained almost twice the recommended level of 51 g/capita/day, except for vegetarians (Figure S2). Similar excessive protein intake has also been observed across Canada [54]. Excessive protein intake might be due to consumers not accounting for protein in non-meat products, such as milk and cheese. Reducing protein intake from red-meat diets would reduce the GWP of these DPs because animal-based protein sources tend to have the highest GWP [17]. Although there was a 16% and 32% increase in pulses and nuts/seeds consumption by Ontarians, respectively, these plant-based proteins still make up only 15% of the total protein-based foods by mass. Since they have a much lower GWP (e.g., 0.016 kg/g protein compared to beef at 0.15 kg/g protein), consuming more of these protein sources in any DP, including the Vegetarian DP, could potentially reduce the GWP further.
Similar to reducing energy intake, reducing protein consumption could be challenging as it relates to the nutrition environment and food literacy, and is currently being driven by fad diets, such as Paleo and Keto diets [55,56]. The current ratio of animal-to-plant protein is around 70:30, compared to the ratio of 60:40 observed in European countries [57]. These ratios are classified as high-animal protein, and a 40:60 animal-to-plant protein ratio is recommended by some studies [3,57]. Although pulses, poultry, and eggs can be used to substitute animal protein sources that have higher environmental and health impacts [31,58], making these shifts is challenging, again due to the consumer nutrition environment. High consumption of animal-based proteins is also associated with higher health risks and non-communicable diseases [42], while plant proteins have higher health benefits [58,59]; therefore, reducing animal-based proteins could be more sustainable from a health and planetary perspective.

4.2. Limitations and Future Work

The goal of this study was to understand the GWP of different DPs, based on realistic and representative food intake. However, the DPs were based on food intake for only one day, so it does not necessarily show individuals’ usual intake over time, e.g., it does not capture the day to day, weekday to weekend, or season to season differences in an individual’s consumption; instead, it is a representation of the population average. Furthermore, self-reported surveys are known for underestimating energy intake [28]. To overcome this issue, all data were adjusted to a realistic energy intake of 2700 kcal/capita/day. This study also conducted a sensitivity analysis using an alternate approach to adjusting calories due to under-reporting, and this showed that the overall trends in GWP of different DPs do not change. In addition, formulating DPs based on most frequently consumed foods can result in under or over estimation of the nutritional content of food categories. For example, in the milk category, the weighted calorie average of different milk types (e.g., 1%, 2%, 3.25%, and others) resulted in 3% fewer calories compared to the calories based on assuming all the milk consumed was 2% milk. Nevertheless, some simplification is needed when dealing with a large number of foods, and when working with limited life cycle inventories, which may only exist for some foods. This is an issue for all LCAs of DPs, and more work is needed to improve on forming representative DPs.
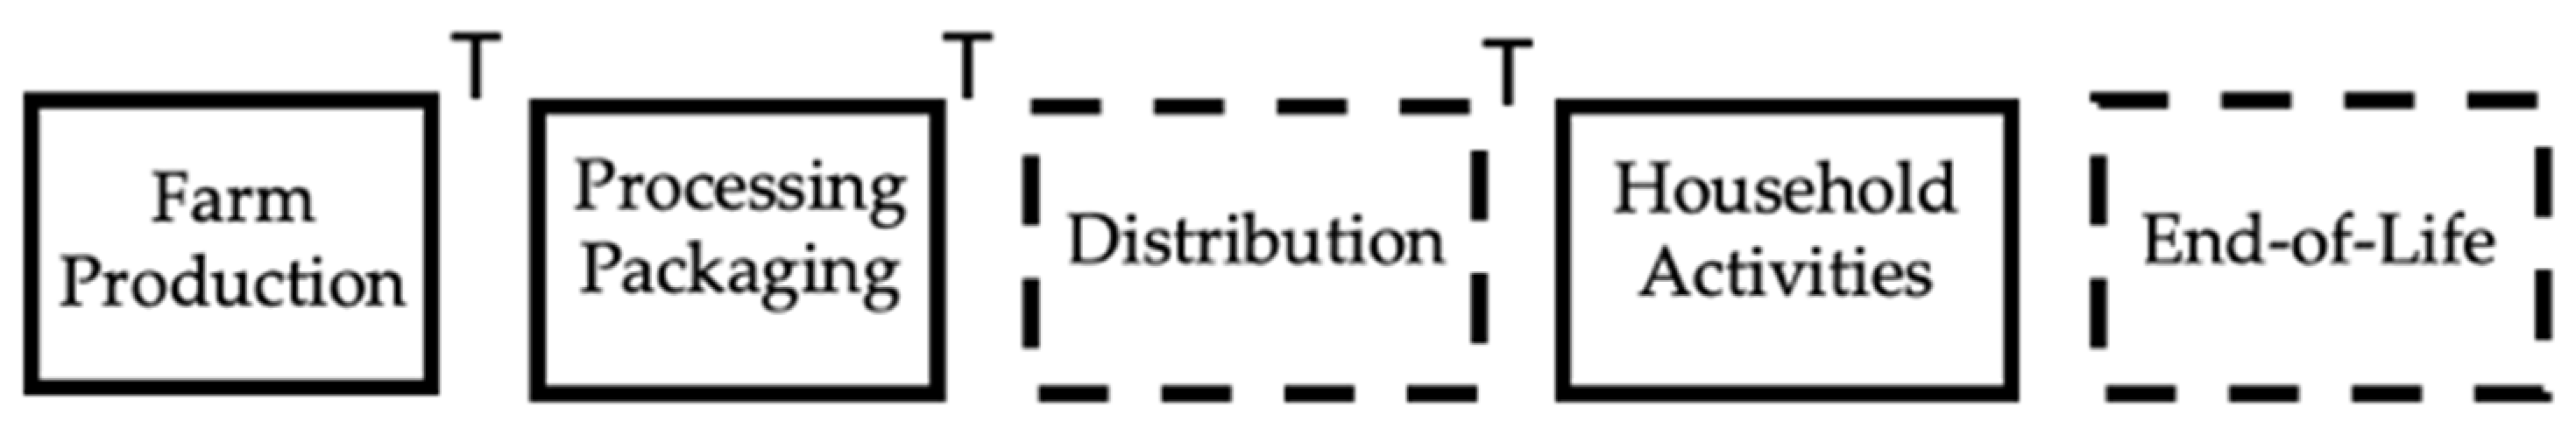
The chosen system boundary, which is cradle to consumption, excluded some stages, such as waste management across the supply chain, storage at retail, and refrigeration across the supply chain. Future work should try to include these stages and consider the effect of the cold chain, which could have considerable environmental implications [60,61].
There are also limitations related to the life cycle inventory for Canadian-specific foods. Data for high-carbon foods, such as fish, were limited. We modeled salmon as being aquaculture-sourced, based on available data, and canned, as this was the most frequently consumed fish, but this life cycle inventory had large uncertainties. Although the results of sensitivity analysis considering these factors showed that the magnitude of the 10-year changes in GWP of Pescatarian DP did not change substantially (Table 7), more information is required on the type of fish being consumed, such as how it is transported, how long it is frozen and stored, etc. This is particularly important because fish is one type of food that can be good for health but comes with high environmental impacts [30]. Similarly, data for various production methods for some food items were limited. For example, we modeled tomatoes as being grown in heated greenhouses due to limited data availability of field-grown tomatoes. This probably resulted in overestimating the GWP of tomatoes due to the high-carbon intensity of heated greenhouses [62]. Similarly, we did not model the organic production of any item due to a lack of data availability. However, organic agricultural production constitutes only 1.8% of total agricultural production in Canada [63]; therefore, we do not expect the lack of organic production data to impact the results of this study.
This study only evaluated GWP as environmental impact because the life cycle inventory did not include indicators to calculate other impacts for foods produced and consumed in Canada. Evaluating various environmental impacts simultaneously is important to consider trade-offs. For example, some food products can have high GWP but low water impacts (e.g., greenhouse tomatoes) [62], and pork has relatively lower GWP than beef but similar acidification and eutrophication levels [31].
In order to conduct more comprehensive studies, more detailed information on Canadian LCA data for agriculture and various production methods (e.g., organic, greenhouse, etc.) is needed. This is an important area of future work for LCA studies of food consumption and DPs. For example, information on production methods (organic, greenhouse), the origin of consumed foods (geography), and processing type of foods (frozen, fresh, and canned) were not modeled.
This study showed which foods were the drivers of high GWP, specifically high meat consumption. However, few studies provide insights on what socio-demographic-cultural factors lead to high meat consumption. Answering these questions can allow the development of more nuanced approaches to shift diets to be more sustainable.

5. Conclusions

This study evaluated the 10-year changes in food consumption and the GWP of DPs based on food consumption in Ontario, Canada. This contributes to the limited knowledge base on the impacts of regional and temporal aspects of food consumption on climate change. Among the few studies that compared dietary impacts across time, to our knowledge, no study has evaluated the impacts considering a system boundary from farm-to-fork.
There were some notable changes in Ontarians’ food consumption from 2004 to 2015. On average, Ontarians consumed less red meat and more poultry and fish. A similar shift was observed for Ontarians’ DPs, with a higher proportion of Ontarians consuming DPs with No Red Meat and Pescatarian compared to Omnivorous and No Pork. Although the highest decrease in the GWP of all DPs was observed in DPs that contain beef, those DPs continue to have the highest impact on climate change.
This study is limited to quantifying only the GWP of Ontarians’ DPs. There is a need to develop a comprehensive Canadian LCA database, which provides data to evaluate trade-offs between different environmental impacts (e.g., acidification and eutrophication) in Canadians’ food consumption. In addition, the 10-year changes in GWP of DPs could reflect more than the impact of food intake, and include the changes in other parts of the food system, such as yields, agricultural production practices, and electrical grid improvements from 2004 to 2015. Furthermore, these results only represent the GWP of DPs based on Ontarians’ food intake, but more research is needed on how the GWP differs in different provinces and territories in Canada. Finally, socio-demographic drivers of dietary impacts were not investigated. Therefore, further research is needed across Canadian provinces to account for socio-demographic aspects of dietary impacts to advance interventions that reduce environmental impacts.

Supplementary Materials

The following supporting information can be downloaded at: https://www.mdpi.com/article/10.3390/su14106290/s1, Table S1: Meat and alternatives category: 2004 and 2015 average yearly consumed amounts in Ontario; Table S2: Milk and alternatives category: 2004 and 2015 average yearly consumed amounts in Ontario; Table S3: Grain products & others category: 2004 and 2015 average yearly consumed amounts in Ontario; Table S4: Vegetables & fruits category: 2004 and 2015 average daily consumed servings in Ontario; Table S5: Global warming potential percentage contribution of dietary patterns in Ontario, for 2004 and 2015; Table S6: Annual global warming potential (GWP) of Omnivorous dietary pattern for 2004 and 2015 based on a functional unit (FU) of 985,500 kcal (average annual calorie consumption by an individual based on 2700 kcal/capita/day); Table S7: Annual global warming potential (GWP) of No Pork dietary pattern for 2004 and 2015 based on a functional unit (FU) of 985,500 kcal (average annual calorie consumption by an individual based on 2700 kcal/capita/day); Table S8: Annual global warming potential (GWP) of No Beef dietary pattern for 2004 and 2015 based on a functional unit (FU) of 985,500 kcal (average annual calorie consumption by an individual based on 2700 kcal/capita/day); Table S9: Annual global warming potential (GWP) of No Red Meat DP for 2004 and 2015 based on a functional unit (FU) of 985,500 kcal (average annual calorie consumption by an individual based on 2700 kcal/capita/day); Table S10: Annual global warming potential (GWP) of Pescatarian dietary pattern for 2004 and 2015 based on a functional unit (FU) of 985,500 kcal (average annual calorie consumption by an individual based on 2700 kcal/capita/day); Table S11: Annual global warming potential (GWP) of Vegetarian dietary pattern for 2004 and 2015 based on a functional unit (FU) of 985,500 kcal (average annual calorie consumption by an individual based on 2700 kcal/capita/day); Table S12: Absolute global warming potential (GWP) of average dietary pattern in Ontario, for 2004 and 2005 based on the functional unit (FU) of 985,500 kcal (average annual calorie consumption by an individual based on 2700 kcal/capita/day) and population of corresponding year; Table S13: Modified stages used for salmon sensitivity analysis and their estimated global warming potential per 1 kg consumed salmon; Figure S1: 2004 and 2015 average global warming potential in dietary patterns in Ontario; Figure S2: 2004 and 2015 daily protein intake of dietary patterns in Ontario, based on 2700 kcal/capita/day.

Author Contributions

B.T.: Conceptualization; Data curation; Formal analysis; Investigation; Methodology; Roles/Writing—original draft; Visualization. G.M.D.: Conceptualization; Writing, Reviewing, and Editing; Visualization. S.M.: Writing and Reviewing. All authors have read and agreed to the published version of the manuscript.

Funding

This research received no external funding.

Data Availability Statement

This research uses the dietary intake data from the 2004 Canadian Community Health Survey Cycle 2.2-Nutrition and the 2015 Canadian Community Health Survey-Nutrition, here referred to as 2004 CCHSN and 2015 CCHSN, respectively [23,24]. For the purposes of this research, the raw survey data were analyzed at the Southwestern Ontario Research Data Centre. The analyzed raw data are not publicly available due to these confidentiality regulations, and the vetted data are shared in supplementary documentation.

Acknowledgments

We thank Gudmundur Johannesson (University of Guelph) and Semih Salihoglu (University of Waterloo) for reviewing the manuscript and providing valuable recommendations.

Conflicts of Interest

The authors declare no conflict of interest.

Appendix A

Figure A1. Decision Tree for identifying the dietary pattern of a participant.
Sustainability 14 06290 g0a1
Figure A2. Decision tree code used in SPSS for identifying the dietary pattern of each participant.
Sustainability 14 06290 g0a2
Table A1. Food Loss along Food Supply Chain taken from USDA LAFA [22], except cooking yield factors taken from FAO Cooking Yield report [29] * Values from Veeramani et al. [16] ** Values assumed from similar food products in USDA LAFA.
% Losses in Frequently Consumed Food ItemsFarm to RetailRetailHousehold Non-Edible FoodHousehold Uneaten FoodHousehold Cooking Yield Factor
DAIRY and EGGS
Butter, regular-6-35-
Cheese, hard-6-11-
Egg, raw-1212119
Milk, partly skimmed-12-20-
SPICES and HERBS
Salt, table-----
FATS and OILS
Vegetable oil, olive-21-15-
Vegetable oil, canola-21-15-
Margarine-7-35-
POULTRY
Chicken, roasted404-1530
MIXED RED MEAT
Pepperoni, pork, beef42 *4-15
CEREALS
Cereal, ready to eat756-4-
Hot, oats-12-14-
FRUITS
Oranges, raw592735-
Grapes, raw89535-
Apples, raw591020-
Bananas, raw59513-
Melon, at farm8174813-
Pear, at farm5171020-
Strawberry89535-
FRUITS JUICE
Apple Juice276-10-
Grape Juice196-10-
Orange Juice356-10-
PORK
Pork, roasted274-128
VEGETABLES
Lettuce_greenhouse, raw79525-
Tomatoes, sauce, canned596-25-
Onions7101025
Broccoli boiled7123912plus ×1.1
Carrot45113310
Cauliflower714618-
Pepper781839-
Potatoes462516-
Tomato greenhouse71098-
VEGETABLE JUICE
tomato juice, canned596-10-
NUTS and SEEDS
Almonds, dried-6-21-
Walnuts, dried-6-18-
Cashew-6-20-
BEEF
Beef, medium, pan fried564-130
BEVERAGES *
Carbonated drinks, cola-----
Tea, brewed-----
Coffee, brewed-----
Beer-----
FISH
salmon, canned-6-17-
tuna, canned-6-17-
PULSES
peanut butter-6-4-
peas, green, boiled-6-10plus ×3.55
beans, snap, canned406-24-
soy beans, boiled72 *6-10-
tofu, fried2 *6 **-10 **-
split peas-6-10plus 2.5
BAKED PRODUCTS
bread, whiteplus ×1.43 *12-20-
SWEETS
sugars, granulated86 *11-34-
GRAINS
rice, long, cooked-12-33plus ×2.6
FLOUR
wheat flour, white20 *12-20
PASTA
spaghetti, cooked25 *12-33plus ×2.1
SNACKS
potato chips, plain756-4-

References

  1. Crippa, M.; Solazzo, E.; Guizzardi, D.; Monforti-Ferrario, F.; Tubiello, F.N.; Leip, A. Food Systems Are Responsible for a Third of Global Anthropogenic GHG Emissions. Nat. Food 2021, 2, 198–209. [Google Scholar] [CrossRef]
  2. Gerber, P.J.; Steinfeld, H.; Henderson, B.; Mottet, A.; Opio, C.; Dijkman, J.; Falcucci, A.; Tempio, G. Tackling Climate Change through Livestock: A Global Assessment of Emissions and Mitigation Opportunities; FAO: Rome, Italy, 2013.
  3. Willett, W.; Rockström, J.; Loken, B.; Springmann, M.; Lang, T.; Vermeulen, S.; Garnett, T.; Tilman, D.; DeClerck, F.; Wood, A.; et al. Food in the Anthropocene: The EAT–Lancet Commission on Healthy Diets from Sustainable Food Systems. Lancet 2019, 393, 447–492. [Google Scholar] [CrossRef]
  4. Chaudhary, A.; Gustafson, D.; Mathys, A. Multi-Indicator Sustainability Assessment of Global Food Systems. Nat. Commun. 2018, 9, 848. [Google Scholar] [CrossRef] [PubMed] [Green Version]
  5. Springmann, M.; Clark, M.; Mason-D’Croz, D.; Wiebe, K.; Bodirsky, B.L.; Lassaletta, L.; de Vries, W.; Vermeulen, S.J.; Herrero, M.; Carlson, K.M.; et al. Options for Keeping the Food System within Environmental Limits. Nature 2018, 562, 519–525. [Google Scholar] [CrossRef]
  6. Esteve-Llorens, X.; Martín-Gamboa, M.; Iribarren, D.; Moreira, M.T.; Feijoo, G.; González-García, S. Efficiency Assessment of Diets in the Spanish Regions: A Multi-Criteria Cross-Cutting Approach. J. Clean. Prod. 2020, 242, 118491. [Google Scholar] [CrossRef]
  7. Heller, M.C.; Willits-Smith, A.; Meyer, R.; Keoleian, G.A.; Rose, D. Greenhouse Gas Emissions and Energy Use Associated with Production of Individual Self-Selected US Diets. Environ. Res. Lett. 2018, 13, 044004. [Google Scholar] [CrossRef]
  8. Mertens, E.; Kuijsten, A.; van Zanten, H.H.E.; Kaptijn, G.; Dofková, M.; Mistura, L.; D’Addezio, L.; Turrini, A.; Dubuisson, C.; Havard, S.; et al. Dietary Choices and Environmental Impact in Four European Countries. J. Clean. Prod. 2019, 237, 117827. [Google Scholar] [CrossRef]
  9. Walker, C.; Gibney, E.R.; Hellweg, S. Comparison of Environmental Impact and Nutritional Quality among a European Sample Population–Findings from the Food4Me Study. Sci. Rep. 2018, 8, 2330. [Google Scholar] [CrossRef]
  10. Gerbens-Leenes, P.W.; Nonhebel, S.; Krol, M.S. Food Consumption Patterns and Economic Growth. Increasing Affluence and the Use of Natural Resources. Appetite 2010, 55, 597–608. [Google Scholar] [CrossRef]
  11. Popkin, B.M. Relationship between Shifts in Food System Dynamics and Acceleration of the Global Nutrition Transition. Nutr. Rev. 2017, 75, 73–82. [Google Scholar] [CrossRef] [Green Version]
  12. Hjorth, T.; Huseinovic, E.; Hallström, E.; Strid, A.; Johansson, I.; Lindahl, B.; Sonesson, U.; Winkvist, A. Changes in Dietary Carbon Footprint over Ten Years Relative to Individual Characteristics and Food Intake in the Västerbotten Intervention Programme. Sci. Rep. 2020, 10, 20. [Google Scholar] [CrossRef] [PubMed]
  13. Gill, M.; Feliciano, D.; Macdiarmid, J.; Smith, P. The Environmental Impact of Nutrition Transition in Three Case Study Countries. Food Secur. 2015, 7, 493–504. [Google Scholar] [CrossRef] [Green Version]
  14. Kc, K.B.; Dias, G.M.; Veeramani, A.; Swanton, C.J.; Fraser, D.; Steinke, D.; Lee, E.; Wittman, H.; Farber, J.M.; Dunfield, K.; et al. When Too Much Isn’t Enough: Does Current Food Production Meet Global Nutritional Needs? PLoS ONE 2018, 13, e0205683. [Google Scholar] [CrossRef] [Green Version]
  15. Auclair, O.; Burgos, S.A. Carbon Footprint of Canadian Self-Selected Diets: Comparing Intake of Foods, Nutrients, and Diet Quality between Low- and High-Greenhouse Gas Emission Diets. J. Clean. Prod. 2021, 316, 128245. [Google Scholar] [CrossRef]
  16. Veeramani, A.; Dias, G.M.; Kirkpatrick, S.I. Carbon Footprint of Dietary Patterns in Ontario, Canada: A Case Study Based on Actual Food Consumption. J. Clean. Prod. 2017, 162, 1398–1406. [Google Scholar] [CrossRef]
  17. Veeramani, A.; Dias, G.; Kirkpatrick, S.I. A Life Cycle Approach to Modeling Nutritionally Balanced, Climate-Friendly and Socially Viable Dietary Patterns in Ontario, Canada. In Proceedings of the Life Cycle Assessment Food, Dublin, Ireland, 19–21 October 2016. [Google Scholar]
  18. ISO 14040:2006; Environmental Management—Life Cycle Assessment—Principles and Framework. ISO: Geneva, Switzerland, 2006. Available online: https://www.iso.org/obp/ui/#iso:std:iso:14040:ed-2:v1:en (accessed on 7 April 2017).
  19. ISO 14044:2006; Environmental Management—Life Cycle Assessment—Requirements and Guidelines. ISO: Geneva, Switzerland, 2006. Available online: https://www.iso.org/standard/38498.html (accessed on 15 March 2018).
  20. Heller, M.C.; Keoleian, G.A.; Willett, W.C. Toward a Life Cycle-Based, Diet-Level Framework for Food Environmental Impact and Nutritional Quality Assessment: A Critical Review. Environ. Sci. Technol. 2013, 47, 12632–12647. [Google Scholar] [CrossRef] [PubMed]
  21. FAOSTAT. FAOSTAT: Food Balance Sheet. Available online: http://www.fao.org/faostat/en/#data/FBS (accessed on 9 October 2019).
  22. USDA. USDA ERS-Food Availability (Per Capita) Data System-Loss Adjusted Food Availability (LAFA). Available online: https://www.ers.usda.gov/data-products/food-availability-per-capita-data-system/ (accessed on 12 April 2018).
  23. Statistics Canada. Canadian Community Health Survey (CCHS) Cycle 2.2 Nutrition–General Health (Including Vitamin & Mineral Supplements) & 24-Hour Dietary Recall Components; Health Canada; Canadian Institute for Health Information; Statistics Canada: Ottawa, ON, Canada, 2008.
  24. Statistics Canada. 2015 Canadian Community Health Survey (CCHS)–Nutrition User Guide; Canadian Institute for Health Information; Statistics Canada: Ottawa, ON, Canada, 2017.
  25. Health Canada. Eating Well with Canada’s Food Guide. A Resource for Educators and Communicators. Available online: https://www.canada.ca/en/health-canada/services/food-nutrition/reports-publications/eating-well-canada-food-guide-resource-educators-communicators-2007.html (accessed on 17 May 2018).
  26. USDA. USDA National Nutrient Database for Standard Reference Release 28-Food Composition Databases Show Foods List. Available online: https://ndb.nal.usda.gov/ndb/search/list (accessed on 10 April 2018).
  27. Freedman, L.S.; Commins, J.M.; Moler, J.E.; Arab, L.; Baer, D.J.; Kipnis, V.; Midthune, D.; Moshfegh, A.J.; Neuhouser, M.L.; Prentice, R.L.; et al. Pooled Results From 5 Validation Studies of Dietary Self-Report Instruments Using Recovery Biomarkers for Energy and Protein Intake. Am. J. Epidemiol. 2014, 180, 172–188. [Google Scholar] [CrossRef] [Green Version]
  28. Subar, A.F.; Freedman, L.S.; Tooze, J.A.; Kirkpatrick, S.I.; Boushey, C.; Neuhouser, M.L.; Thompson, F.E.; Potischman, N.; Guenther, P.M.; Tarasuk, V.; et al. Addressing Current Criticism Regarding the Value of Self-Report Dietary Data12. J. Nutr. 2015, 145, 2639–2645. [Google Scholar] [CrossRef] [Green Version]
  29. Bognar, A. Tables on Weight Yield of Food and Retention Factors of Food Constituents for the Calculation of Nutrient Composition of Cooked Foods (Dishes); Berichte der Bundesforschungsanstalt für Ernährung: Karlsruhe, Germany, 2002. [Google Scholar]
  30. Gephart, J.A.; Henriksson, P.J.G.; Parker, R.W.R.; Shepon, A.; Gorospe, K.D.; Bergman, K.; Eshel, G.; Golden, C.D.; Halpern, B.S.; Hornborg, S.; et al. Environmental Performance of Blue Foods. Nature 2021, 597, 360–365. [Google Scholar] [CrossRef]
  31. Poore, J.; Nemecek, T. Reducing Food’s Environmental Impacts through Producers and Consumers. Science 2018, 360, 987–992. [Google Scholar] [CrossRef] [Green Version]
  32. Statistics Canada. Human Activity and the Environment: Annual Statistics: Section 1: Food in Canada. Available online: https://www150.statcan.gc.ca/n1/pub/16-201-x/2009000/part-partie1-eng.htm (accessed on 13 April 2020).
  33. Statistics Canada. Alberta Has the Most Beef Cattle in Canada and the Second Largest Total Farm Area. Available online: https://www150.statcan.gc.ca/n1/pub/95-640-x/2016001/article/14808-eng.htm (accessed on 21 March 2022).
  34. Ayer, N.W.; Tyedmers, P.H. Assessing alternative aquaculture technologies: Life cycle assessment of salmonid culture systems in Canada. J. Clean. Prod. 2009, 17, 362–373. [Google Scholar] [CrossRef]
  35. Canada Energy Regulator. Canada’s Renewable Power Landscape 2016—British Columbia. Available online: https://www.cer-rec.gc.ca/en/data-analysis/energy-commodities/electricity/report/2016-canadian-renewable-power/province/canadas-renewable-power-landscape-2016-energy-market-analysis-british-columbia.html (accessed on 25 March 2022).
  36. Government of Canada, S.C. Canadian International Merchandise Trade 2015. Available online: https://www150.statcan.gc.ca/n1/pub/71-607-x/71-607-x2021004-eng.htm (accessed on 22 March 2022).
  37. Ballotpedia Historical Alaska Energy Information, 2011–2015. Available online: https://ballotpedia.org/Historical_Alaska_energy_information,_2011-2015 (accessed on 25 March 2022).
  38. Statistics Canada Table 18-10-0002-01 Monthly Average Retail Prices for Food and Other Selected Products. Available online: https://www150.statcan.gc.ca/t1/tbl1/en/cv.action?pid=1810000201 (accessed on 12 January 2021).
  39. Statistics Canada Table 32-10-0054-01 Food Available in Canada. Available online: https://www150.statcan.gc.ca/t1/tbl1/en/tv.action?pid=3210005401 (accessed on 21 June 2021).
  40. Government of Canada. Commercial Fisheries Seafisheries Landings 2015 Canada Provincial Quantities. Available online: https://open.canada.ca/data/en/dataset/6e16f703-9c57-46c9-9194-6573398c17e6 (accessed on 22 March 2022).
  41. Government of Canada. 2015 Canadian Aquaculture Production Statistics Fisheries and Oceans. Available online: https://www.dfo-mpo.gc.ca/stats/aqua/aqua15-eng.htm (accessed on 22 March 2022).
  42. Harvard Health When It Comes to Protein, How Much Is Too Much? Available online: https://www.health.harvard.edu/diet-and-weight-loss/when-it-comes-to-protein-how-much-is-too-much (accessed on 13 December 2019).
  43. Government of Ontario. Ontario Population Projections Update. Available online: https://www.fin.gov.on.ca/en/economy/demographics/projections/ (accessed on 12 June 2018).
  44. Hallström, E.; Bergman, K.; Mifflin, K.; Parker, R.; Tyedmers, P.; Troell, M.; Ziegler, F. Combined Climate and Nutritional Performance of Seafoods. J. Clean. Prod. 2019, 230, 402–411. [Google Scholar] [CrossRef]
  45. U.S. Department of Health; Human Services; U.S. Department of Agriculture. 2015–2020 Dietary Guidelines for Americans, 8th Edition. 2015. Available online: https://health.gov/sites/default/files/2019-09/2015-2020_Dietary_Guidelines.pdf (accessed on 11 January 2021).
  46. Thielman, J.; Harrington, D.; Rosella, L.C.; Manson, H. Prevalence of Age-Specific and Sex-Specific Overweight and Obesity in Ontario and Quebec, Canada: A Cross-Sectional Study Using Direct Measures of Height and Weight. BMJ Open 2018, 8, e022029. [Google Scholar] [CrossRef] [PubMed]
  47. Glanz, K.; Sallis, J.F.; Saelens, B.E.; Frank, L.D. Healthy Nutrition Environments: Concepts and Measures. Am. J. Health Promot. 2005, 19, 330–333. [Google Scholar] [CrossRef]
  48. Cassady, D.; Jetter, K.M.; Culp, J. Is Price a Barrier to Eating More Fruits and Vegetables for Low-Income Families? J. Am. Diet. Assoc. 2007, 107, 1909–1915. [Google Scholar] [CrossRef]
  49. Jetter, K.M.; Cassady, D.L. The Availability and Cost of Healthier Food Alternatives. Am. J. Prev. Med. 2006, 30, 38–44. [Google Scholar] [CrossRef]
  50. Bauer, J.M.; Reisch, L.A. Behavioural Insights and (Un)Healthy Dietary Choices: A Review of Current Evidence. J. Consum. Policy 2019, 42, 3–45. [Google Scholar] [CrossRef] [Green Version]
  51. Belogianni, K.; Baldwin, C. Types of Interventions Targeting Dietary, Physical Activity, and Weight-Related Outcomes among University Students: A Systematic Review of Systematic Reviews. Adv. Nutr. 2019, 10, 848–863. [Google Scholar] [CrossRef]
  52. Lytle, L.A.; Sokol, R.L. Measures of the Food Environment: A Systematic Review of the Field, 2007–2015. Health Place 2017, 44, 18–34. [Google Scholar] [CrossRef]
  53. Mollaei, S.; Dias, G.M.; Minaker, L.M. Development and Testing of the Sustainable Nutrition Environment Measures Survey for Retail Stores in Ontario. Public Health Nutr. 2021, 24, 1962–1971. [Google Scholar] [CrossRef]
  54. Auclair, O.; Burgos, S.A. Protein Consumption in Canadian Habitual Diets: Usual Intake, Inadequacy, and the Contribution of Animal- and Plant-Based Foods to Nutrient Intakes. Appl. Physiol. Nutr. Metab. 2021, 46, 501–510. [Google Scholar] [CrossRef] [PubMed]
  55. Khawandanah, J.; Tewfik, I. Fad Diets: Lifestyle Promises and Health Challenges. J. Food Res. 2016, 5, 80. [Google Scholar] [CrossRef] [Green Version]
  56. Modi, N.; Priefer, R. Effectiveness of Mainstream Diets. Obes. Med. 2020, 18, 100239. [Google Scholar] [CrossRef]
  57. De Boer, J.; Aiking, H. Strategies towards Healthy and Sustainable Protein Consumption: A Transition Framework at the Levels of Diets, Dishes, and Dish Ingredients. Food Qual. Prefer. 2019, 73, 171–181. [Google Scholar] [CrossRef]
  58. Erbersdobler, H.F.; Barth, C.A.; Jahreis, G. Legumes in Human Nutrition. Nutrient Content and Protein Quality of Pulses. Ernährungs Umsch. 2017, 64, 134–139. [Google Scholar] [CrossRef]
  59. Fischer, S.; Glei, M. Potential Health Benefits of Nuts. Ernaehrungs Umsch. Int. 2013, 60, 206–215. [Google Scholar] [CrossRef]
  60. Heard, B.R.; Miller, S.A. Critical Research Needed to Examine the Environmental Impacts of Expanded Refrigeration on the Food System. Environ. Sci. Technol. 2016, 50, 12060–12071. [Google Scholar] [CrossRef]
  61. Hu, G.; Mu, X.; Xu, M.; Miller, S.A. Potentials of GHG Emission Reductions from Cold Chain Systems: Case Studies of China and the United States. J. Clean. Prod. 2019, 239, 118053. [Google Scholar] [CrossRef]
  62. Dias, G.M.; Ayer, N.W.; Khosla, S.; Van Acker, R.; Young, S.B.; Whitney, S.; Hendricks, P. Life Cycle Perspectives on the Sustainability of Ontario Greenhouse Tomato Production: Benchmarking and Improvement Opportunities. J. Clean. Prod. 2017, 140, 831–839. [Google Scholar] [CrossRef]
  63. Statistics Canada. Snapshot of Canadian Agriculture: Chapter 5. Available online: https://www150.statcan.gc.ca/n1/pub/95-640-x/2011001/p1/p1-05-eng.htm (accessed on 15 May 2022).
Scheme 1. Methodological approach used in life cycle assessment of global warming potential of Ontarians’ dietary patterns.
Sustainability 14 06290 sch001
Figure 1. System boundary, farm-to-fork, includes transportation (T) between the specified stages, and excludes distribution (i.e., retail), and end-of-life stages.
Sustainability 14 06290 g001
Figure 2. Global warming potential of dietary patterns in Ontario, for 2004 and 2015. ‘Other foods’ includes: grains, vegetables, fruits, oils, etc.; ‘Plant-based proteins’ are pulses and nuts; ‘Animal-derived proteins’ are dairy products (milk, cheese, etc.) and eggs. The functional unit (FU) is annual energy intake based on an average daily intake of 2700 calories.
Sustainability 14 06290 g002
Table 1. High-level food categories presented based on 2007 Canada’s Food Guide five food categories [25]: (i) Meat and alternatives, (ii) Milk and alternatives, (iii) Vegetables and Fruits, (iv) Grain products, and (v) Others.
Meat and AlternativesMilk and AlternativesOthers
BeefMilkBeverages
PorkCheeseSnacks
Mixed red meatVegetables and FruitsSweets
PoultryVegetablesSpices & Herbs
EggFruitsFats & Oils
FishGrain Products
PulsesBaked Products
Nuts and SeedsBreakfast Cereals
Grains Products
Table 2. Definitions of dietary patterns used to identify Ontarians’ dietary preferences.
Dietary Pattern Definitions
Vegetarianexcludes all animal-based food products except dairy and eggs
Pescatarianexcludes all meat products except fish
No Red Meatexcludes all red meat products, consumes fish and poultry as meat products
No Beefexcludes only beef-based products
No Porkexcludes only pork-based products
Omnivorousall-inclusive diet without any restrictions
Table 3. Factors used to adjust 2004 and 2015 dietary patterns reference flows to obtain the functional unit.
Adjustment Factors20042015
No Pork1.321.43
Omnivorous1.151.20
No Beef1.271.45
No Red Meat1.391.64
Pescatarian1.541.79
Vegetarian1.611.75
Table 4. Adjustment factors applied only to remaining foods for 2004 and 2015 dietary patterns to obtain the functional unit.
Adjustment Factors20042015
No Pork1.541.73
Omnivorous1.241.33
No Beef1.421.77
No Red Meat1.642.14
Pescatarian1.972.37
Vegetarian1.952.22
Table 5. Ten-year change in representative dietary patterns followed by Ontarians.
Dietary Patterns 2004 Share (%)2015 Share (%)10-Year Change (%)
Omnivorous31.124.6−7%
No Pork25.524.1−1%
No Beef15.716.71%
No Red Meat16.621.95%
Pescatarian3.35.02%
Vegetarian7.87.80%
Table 6. Sensitivity analysis of the effect of reference flows on global warming potential (GWP) per functional unit (FU) for 2004 and 2015 dietary patterns (DP). Results are reported as (i) absolute GWP (kg CO2e/FU) for each DP, and (ii) percentage change from the baseline GWP of each DP. GWP of 2004 and 2015 baseline DPs are presented in Figure 2.
Dietary PatternSA on 2004 Reference Flows (kg CO2e/FU)% Changes in GWP for SA vs. Baseline for 2004 Data SA on 2015 Reference Flows (kg CO2e/FU)% Changes in GWP for SA vs. Baseline for 2015 Data
No Pork2868−15%2561−20%
Omnivorous2356−7%2099−9%
No Beef1429−9%1470−14%
No Red Meat1352−13%1208−18%
Pescatarian1586−19%1568−24%
Vegetarian1189−19%1132−21%
Table 7. Sensitivity analysis of salmon production and supply chain presenting global warming potential per functional unit for 2004 and 2015 Pescatarian dietary pattern. Bolded values are the original results from Table 4. Ontario (ON), British Columbia (BC), and Alaska (AK).
Sensitivity Analysis of Salmon Production and Supply Chain in Pescatarian Dietary Pattern2004 Year2015 Year10-Year Changes
Farmed, canned, and transported by truck from BC to ON (This study)195720645%
Farmed, frozen, transported by refrigerated truck from BC to ON 183218541%
Farmed, fresh, transported by refrigerated air freight from BC to ON 201421587%
Average wild-caught, frozen, transported by refrigerated truck from AK to ON 200521437%
Publisher’s Note: MDPI stays neutral with regard to jurisdictional claims in published maps and institutional affiliations.

