Article

The Impact of Parental Migration on Offspring’s Education Investment: Evidence from Left-Behind Children in China

School of Agricultural Economics and Rural Development, Renmin University of China, Beijing 100872, China
*
Author to whom correspondence should be addressed.
Sustainability 2022, 14(10), 6257; https://doi.org/10.3390/su14106257
Submission received: 13 April 2022 / Revised: 9 May 2022 / Accepted: 18 May 2022 / Published: 20 May 2022

Abstract

:
Educational investment of families in their children is related to the sustainable development of both individuals and society. This paper uses data from China Family Panel Studies to study the impact of rural parents’ internal migration on education investment in left-behind children in China. The results show that parental internal migration has a significant negative impact on educational investment in left-behind children. The results persisted after further treatment for endogeneity and multiple robustness tests. Mechanism analysis shows that while increasing the family income, rural to urban migration reduces parents’ recognition of children’s education, thus reducing the family’s investment in left-behind children’s education. Heterogeneity analysis reveals that the negative impact of both parents’ going out was the largest, followed by only the father going out, while only the mother going out was no longer significant. The negative effect of inter-provincial out-going is greater than that of intra-provincial out-going. Girls were negatively affected more than boys; middle school students were more affected than primary school students. Our findings suggest it is necessary to further eliminate labor market discrimination caused by household registration and improve educational quality of rural public schools. The lessons learned from China are valuable for other developing countries with large numbers of rural citizens migrating to cities.

1. Introduction

Education is a basic human right, and it is central to achieving sustainable development. For individuals, education can increase the probability of employment, increase labor productivity and income, and reduce poverty [1,2,3]. Furthermore, education has non-monetary benefits. Education can bring about better health, more engaged citizenship, as well as better life choices [4,5,6]. For society, first, education generates material benefits by increasing productivity, boosting economic growth, and promoting poverty reduction and long-term development [7,8,9]. Second, education brings non-material benefits to social development through increasing social mobility, citizen participation, better institutional provision, and social cohesion [10,11]. Hence, improving the level of individual education is crucial to sustainable development, both for individuals and society.
Family education investment plays an important role in improving the educational levels of offspring. The public sector is undoubtedly an important provider of educational investment [12], but for the vast number of developing and less developed countries, the public sector has limited financial resources and mainly invests in areas that promote rapid economic growth in the short term [13]. Often, it can only guarantee the universalization of basic education and education fairness. Therefore, family education investment from the private sector is important for high-quality human capital accumulation [14]. It is the parents who have the right to decide whether to invest in their children’s education when the children are young. The children themselves are more in a passive position. If parents pay attention to children’s education, increase their investment in their children’s education, and let their children receive high-quality education, the final education level of children will be higher; on the contrary, less investment in education will affect the quality of education children receive and ultimately have a negative impact on the children’s educational achievement.
Internal rural–urban migration is considered one of the main ways to escape poverty and a primary feature of economic development in developing countries [15]. Migration out of agriculture is generally associated with improved living standards of migrant families. Increases in out-migration can lead to increased investment in assets related to agricultural production and other investments in source communities [16]. The study of migration as an economic process has a long history [17,18].
However, the effects of migration on source households and family members can be complex. For instance, it is common in developing countries for one or both parents to migrate out for work while leaving their children home with one parent or other relatives [19,20]. When children are left behind, they risk facing negative consequences for their education [21]. In recent years, researchers have raised concerns about the potential negative effects of migration on the education of the children who are left behind in rural areas [22].
In China, with the continuous increase in the scale of rural migrant workers, the number of left-behind children has also increased rapidly [21]. In China, left-behind children are children under the age of 18, who live in their original domicile, but do not live together with their parents, as either one parent or both parents have migrated. They are also called LBC [23]. Data show that the number of rural residents who went out to work has increased from 20 million in 1990 to 174.3 million in 2019 in China (Data in 1990 come from the National Population Census. Data in 2019 come from the Monitoring Reports of Rural Migrant Workers. The National Bureau of Statistics (NBS) of China), and the rural–urban migration population has increased by nearly 8eight times in less than 30 years. The number of left-behind children also increased from 26.99 million in 2000 to 40.51 million in 2015 in China (Data in 2000 come from Population Censuses. Data in 2015 come from the 1% National Population Sample Survey (also called “mini-census”). The National Bureau of Statistics (NBS) of China). As a vulnerable group, the education and health of LBC have received extensive attention from the government, media, and academic researchers.
Existing studies on the education of LBC mainly focus on academic performance and academic achievement, but there is a lack of research on the educational investment behavior of parents of LBC. For example, studies have shown that rural–urban migration has a negative impact on LBC’s academic performance in Uganda and China. Some studies also found that rural–urban migration has a negative impact on children’s years of education in Mexico and China [21,23]. However, little attention has been paid to how migration affects parents’ educational investment in LBC. Research on this issue can further deepen the understanding the reasons behind the impact on children’s educational outcomes.
China is a compelling place to study internal migration and its consequences for LBC in rural areas for two reasons. First, China has unprecedented labor migration, with dramatic increases in the number of migrants in the past decades. Second, the left-behind population in China is to a large extent an outcome of institutional processes [24], in particular, the long-standing bifurcated social institution, which is usually called hukou (the residential registration system). The system categorizes all citizens into a rural–urban dichotomy (rural residents are registered with rural hukou; urban residents are registered with urban huko), which has led to various structural and social barriers in migrants’ access to public services and the labor market in urban areas.
So, the overall goal of this study is to examine the effect of internal migration on LBC’s educational investment in China. This paper uses the 2012 data from Peking University Chinese Family Panel Studies (CFPS) to answer the above questions. On the basis of theoretical analysis, the paper first uses the OLS model for benchmark regression, and then uses the double robust model to solve possible endogeneity problems. Additionally, the article tests the robustness of its results by replacing the control variable, replacing the dependent variable, and replacing the estimate model. This paper not only provides empirical support for a deep understanding of the impact of internal rural–urban migration on educational investment in LBC, but also helps to understand how urbanization influences people’s perceptions and behaviors. In addition, this study has significance for formulating relevant policies to improve the level of rural human capital, expand the middle-income group, and achieve the goal of common prosperity for China. In the end, the lessons learned from China are valuable for other developing countries with large numbers of rural citizens migrating to cities.
The remainder of the paper is organized as follows: Section 2 first analyzes family educational investment theoretically and then develops our hypothesis. Section 3 presents the research design, and Section 4 reports the estimated results with primary regression, endogeneity treatment with Inverse Probability Weighted Regression Adjustment model (IPWRA) and Augmented Inverse Probability Weighting model (AIPW), robustness test, impact mechanism analysis, and heterogeneity discussion. Section 5 provides the conclusion, possible policy recommendations, as well as research limitations.

2. Literature Review and Hypotheses Development

2.1. Theoretical Analysis of Family Education Investment

As an important channel that affects the accumulation of human capital, family educational investment is closely related to the family’s income level, and it is also one of the core factors that many researchers focus on. Ideally, if there are no credit constraints, each household would make an optimal investment in education, eventually achieving an equal return on educational investment and a return on other investments [25,26]. This means that household investment in education is independent of income. However, the reality is that poor families are often faced with borrowing constraints, and the level of educational investment cannot reach the optimal level. In this context, family income is closely related to the level of educational investment. Taking Guangdong Province in China as an example, Li Puliang and Jia Weili found that family income has a significant positive impact on rural residents’ willingness to invest in their children’s education [27]. Research by Zhou Chunfang and others also shows that families with abundant economic capital invest more in their children’s education [28,29].
Apart from credit constraints, perceptions of the need to invest in children also influence family educational investment. Ideas influence behavior, and if parents perceive the importance of investing in their children’s education, they will increase their investment. Conversely, if parents find it unimportant to invest in children’s education, they may further reduce their investment [30,31]. From an investment perspective, whether to invest in children depends on the comparison of the costs and benefits. If the expected benefit of investing in children’s education is greater than the cost, then the value of investing in children’s education is greater, and parents will believe that investing in their children’s education is more important. However, if the cost of investment is less than the expected return, the value of investing in children’s education will be weakened, parents’ perception of the necessity of investing in their children’s education will be weakened, and there will be a lack of motivation to invest in their children’s education, thus reducing investment [32].

2.2. Hypotheses Development of Parents’ Internal Migration on Education Investment of LBC

Parental migrant out-work may have a positive impact on educational investment in LBC by easing family budget constraints (see Figure 1). Due to more employment opportunities and higher wage levels in cities, migration increases household income and eases economic constraint on households, thus allowing them to invest in children’s education [18,19,20]. As mentioned above, household income status is closely related to the level of educational investment. Therefore, rural parents’ migration has a positive impact on educational investment in LBC by increasing family income.
At the same time, internal migration may also have a negative impact on the educational investment in LBC by reducing awareness of the importance of investing in children’s education. First, it increases the education’s opportunity cost. Migrant workers can increase family income, indicating an increase in the opportunity cost of receiving education as well. Rural parents may reduce their investment in children’s education, allowing their children to enter the labor market earlier to support the family [33]. Secondly, the gap in education return also leads to parents not paying attention to their children’s education. Due to the existence of the household registration system in the urban labor market, there is an education return gap between rural migrant workers and the local labor force in cities (under the long-standing hukou system in China, without proper urban household registration status, they face difficulties finding jobs, especially jobs with high wages) [34,35], which changes parents’ expectations of the return of children’s education, thereby reducing the family’s investment in LBC’s education. Lastly, it will decrease parents’ perception of the need to invest in children’s education. Therefore, under the combined effect of increased opportunity costs of education for LBC and the gap of returns of education caused by household registration, parents’ motivation has weakened, which reduces their actual investment in the education of LBC.
The final impact of internal migration on LBC’s educational investment depends on the net effect of migration. If the positive impact of parents’ migration on educational investment in LBC is greater than the negative impact, then parents’ internal migration will ultimately have a positive impact on LBC’s educational investment. However, if the positive impact of internal migration cannot offset the negative impact, then parental migration will eventually have a negative impact on LBC’s educational investment.
Based on the analysis above, our hypotheses can therefore be stated as follows:
Hypothesis 1 (H1).
The net effect of parental rural–urban migration on LBC’s educational investment is uncertain.
Hypothesis 2 (H2).
Internal migration will have a positive impact on LBC’s educational investment by increasing household income.
Hypothesis 3 (H3).
Internal migration will have a negative impact on LBC’s educational investment by reducing parents’ awareness of the importance of children’s education.

3. Empirical Design

3.1. Data Resources

The data in this paper are mainly from the 2012 data of the China Family Panel Studies (CFPS) conducted by the China Social Science Survey Center of Peking University. The survey covers 25 provinces across China (excluding Hong Kong, Macao and Taiwan, Xinjiang, Tibet, Qinghai, Inner Mongolia, Ningxia, and Hainan) and adopts implicit stratification of multi-stage, multi-level, and three-stage probability sampling methods in proportion to population size with three-stage probability sampling methods (PPS); therefore, this survey is a national social survey project. The database collects information on topics such as economic activity and educational outcomes at individual, household, and community levels. A total of 13,315 families and 55,014 individuals were surveyed in 2012. Compared with surveys in other years, this round of surveys can accurately identify the specific circumstances of parents’ migrant situation and match with village-level questionnaire data in a 2010 survey, so it is an ideal data base for our research question. After data cleaning, this paper finally obtained 1894 samples with both parents registered as agricultural households, the nature of the community is a village committee, and the main population of the community is engaged in agricultural production.

3.2. Econometric Model

3.2.1. Baseline Regression

Since investment in children’s education is a continuous variable, this paper first constructs an OLS model to explore the impact of parents’ migrant work on educational investment in LBC:
L n ( e d u e x p ) i = β 0 + β 1 m i g r a t i o n i + γ X i + ε i
L n ( e d u e x p ) i is the logarithm of the family’s educational investment expenditure on individual i,   m i g r a t i o n i is a binary dummy variable, indicating whether the child’s parents migrate to an urban areas or not.   X i   are control variables, including five aspects: child characteristics, parent characteristics, family characteristics, village characteristics, and the province where the family is located. Specifically, characteristics of children include child’s gender, age, Chinese scores, math scores, key school, and boarding status; parent characteristics include parents’ education level, age, ethnic status, and political status; family characteristics include family size and logarithm of per capita net income of family; and village characteristics refer to the logarithm of distance from the village committee to nearby towns.

3.2.2. Double Robust Model

Although this article attempts to control variables that may affect parents’ decision to go out and invest in children’s education at the same time, the model may still have endogeneity problems caused by self-selection and omitted variables, which will make estimated results of baseline regression likely to be biased. This paper draws on the practice of existing research and comprehensively uses IPWRA and AIPW models to solve possible endogeneity problems [36,37].
IPWRA and AIPW are doubly robust. Both models are a combination of Regression Adjustment (RA) and Inverse Probability Weighting (IPW). The model corrects for the non-randomness of parents’ out-migration by correcting outcome model (in this paper, this refers to the education investment expenditure of children) and the selection model (in this paper, this refers to whether the parents migrate to cities to work or not). The advantage of this model is that it does not require that the settings of the selection model and outcome model are accurate at the same time. As long as one of the two settings is accurate, the estimated result is robust, so it has double robustness. Furthermore, the estimation error is relatively small even if both the selection model and outcome model specifications are wrong [38,39].
Specifically, the IPWRA model is divided into three steps: First, using the Logit model to estimate the selection equation (see Equation (2)) and calculate inverse probability weight. Second, using the inverse probability weight calculated in the first step to estimate the outcome equation (see Equation (3)) and calculate the predicted educational investment in children. Third, calculating the educational expenditure of offspring under different treatments. The mean difference between the two treatment groups is the impact of parent’s migration on LBC’s human capital investment.
When estimating the selection model, we add a control variable to act as an instrumental variable (IV) referring to existing research [40,41], which is the proportion of rural migrant labor force two years ago (2010), in order to make the model more accurate. In addition, the control variables of the selection model also include children’s gender, age, boarding status, father’s years of education, age, ethnic status, and political affiliation, mother’s years of education, age, ethnic status, and political affiliation, family size and family Logarithm of per capita net income, logarithm of distance from village committees to nearby towns, and provincial fixed effects. The control variables of the outcome model include children’s gender, age, Chinese scores, math scores, key school status, father’s characteristic variables, mother’s characteristic variables, family’s characteristic variables, village’s characteristic variables, and provincial fixed effects.
P r ( m i g r a t i o n ) i = β 2 + β 3 X i + ε i
L n ( e d u e x p ) i = β 4 + β 5 X i + ε i
Using the proportion of migrant labor at the village level two years ago as an instrumental variable is mainly based on the following two considerations: First, rural society is a typical network society, in which the social network can transmit employment information and reduce search costs. So, IV is closely related to the independent variable. Secondly, the proportion of migrant labor at the village level two years ago will not directly affect the educational investment in children in the current period, nor will it affect educational investment in the current period through other channels, which logically satisfies the requirements of correlation and exogeneity. For this paper, whether the correlation conditions are satisfied can be examined from the estimation results of the selection equation. Regarding whether the exogenous conditions are satisfied, this paper refers to the practice of Zhu Zhongkun [42] and Ashraf and Galor [43], replacing core independent variables as tools in baseline regression. The variable is regressed on the dependent variable, and the result shows that the instrumental variable has no significant effect on the dependent variable; then, the core independent variable and the instrumental variable are put into the baseline model at the same time. The result shows that the influence of IV is also not significant; therefore, it can be seen that IV is exogenous.

3.3. Variable Selection

3.3.1. Dependent Variable

Children’s shadow education spending over the past year is calculated according to the following question in questionnaire: “What is the cost of extra-curricular tutoring in the past year?” This is a continuous variable, and we take the logarithmic value of this variable when estimating since extra-curricular tutoring is similar to the projection of formal school education. Therefore, it is also called shadow education. Considering the huge difference between compulsory education and preschool, this paper restricts itself to children in compulsory education. It is reasonable to select children’s shadow education expenditure as a proxy variable of family investment in children’s education. Compared with in-school education expenditure, parents have more decision-making autonomy in child’s shadow education expenditures, which can better reflect parents’ behavior regarding the child’s educational investment and can also be more effective. It is also a good way to reflect students’ access to off-campus educational resources.

3.3.2. Independent Variable

Whether parents migrate from rural area to urban areas to work is defined according to the following questions: “Does family member XXX live in this home?” and “Why does family member XXX not live in this home?”. In this paper, we regard at least one of the parents who will not come back within three months, whose reason for going out is “going out to work/work”, as a migrant worker and assign the value 1, and a sample living at home without going out as non-migrant and assign the value 0. When processing the data, we deleted samples that did not live at home for reasons such as becoming a monk, visiting relatives and friends, running away from home, and serving a prison sentence. The definition of the concept is clear and accurate. In addition, we only retain the sample of children with agricultural hukou and married parents, thus excluding the influence of family structure differences such as single parents and divorce.

3.3.3. Control Variable

In order to better identify the impact of parental internal migration on educational investment expenditures for LBC, this paper selects control variables from five aspects: child characteristics, parent characteristics, family characteristics, village-level characteristics, and provincial fixed effects. Child characteristics include the child’s gender, age, Chinese scores, math scores, key school, and boarding. Parent characteristics include father’s years of education, age, ethnicity, and political status, and the mother’s years of education, age, ethnicity, and political identity. Family characteristics include the family size and logarithm of per capita income. Village-level characteristics refer to logarithm of the distance from countryside to nearby towns. Detailed descriptions of each variable are shown in Table 1.

3.3.4. Descriptive Statistics

It can be seen from Table 1 that there are 398 children with at least one parent who migrates out for work, accounting for 21.0% of the total sample, and 1496 children whose parents do not migrate out, accounting for 79.0%. The average spending on shadow education for children is about 95 yuan. The average age of children is about 11 years old, with the oldest being 15 and the youngest being 6. The average education status of fathers is between primary and junior high schools, with the highest being undergraduate education and the lowest being no schooling. Mothers’ average education level is slightly lower than that of fathers, at the primary level, the highest education is junior college, and the lowest is no schooling. The average family size is about 5 people, and the average per capita net income of a family in the past year was about 7433 yuan.

4. Results Report and Discussion

4.1. Does Internal Migration Have an Effect on LBC’s Edcucation Investment?

4.1.1. Baseline Result

The empirical results show that without controlling for other variables, parental migration has a significant negative impact on shadow education expenditures of LBC. After further controlling for child characteristics (see Table 2 column (2)), parent and family characteristics (see Table 2 column (3)), village characteristics (see Table 2 column (4)), and provincial fixed effects (see Table 2 column (5)), although the effects become weaker, the significance remains unchanged at the 1% significance level. This preliminarily shows that internal migration has a negative impact on the educational investment of LBC.

4.1.2. Endogenous Discussion

In order to solve the possible endogenous problem, we use a double robust model for estimation. For the selection equation, whether it is the IPWRA model or the AIPW model, results show that the proportion of migrant labor in the village two years ago is positively correlated with whether the parents have gone out at a significant level of 5% (see Table 3). For the outcome model, families whose parents go out have lower expenditures on shadow education than those whose parents do not go out (see Table 4). Further regression results show that internal migration significantly reduces LBC’s shadow education expenditure(see Table 5). Whether it is the significance level or size of the estimated coefficient, estimated results of the double robust model are consistent with baseline regression. To a certain extent, it shows the robustness of the estimated results in this paper.

4.1.3. Robust Test

  • Change Main Control Variable
In order to test the robustness of the results, this article replaces the main control variables for estimation. First, we assumed that the father is the head of household, and the relevant indicators of the father are used to represent the relevant indicators of both parents (see column (1) in Table 6). Then, we assumed that the mother is the head of household, and the relevant indicators of the mother are used to replace the relevant indicators of both parents (see column (2) of Table 6). If the estimation results are quite different when replacing the control variables, then the estimations results are not robust enough; otherwise, the estimated results have good robustness. The estimation results show that regardless of controlling the related variables of the father or mother, parents’ out-migration has a significant negative impact on LBC’s shadow education expenditure. The OLS estimation results are basically consistent with the estimation results of the treatment effect model (see Table 7).
2.
Replace Dependent Variable
Next, the article attempts to replace the dependent variable for robustness testing. We select two variables as the replaced dependent variables for estimation. One is the family’s total expenditure on children’s education in the past year, and the other is child’s school choice/sponsorship expenses in the past year. Similarly, the article takes both the natural logarithm of the two variables to reduce fluctuation between the samples. Theoretically, since the total education expenditure covers school uniform fees, reference books, and other expenses required by the school, it cannot fully reflect the family’s subjective investment willingness and behavior regarding children’s education. Therefore, the estimation result using this variable as the dependent variable should be not significant or significantly less. School choice/sponsorship fees are similar to shadow education expenditures to some extent and can better reflect parents’ willingness to invest in children’s education. Therefore, theoretically, after using this variable as a dependent variable for estimation, the result should still be significant. It is found that the parents’ internal migration does not have a significant impact on the total education expenditure of offspring but has a significant negative impact on offspring’s school choice/sponsorship expenses(see Table 8). This conclusion is still reliable after using the treatment effect model to estimate (see Table 9).
3.
Change Estimate Models
In addition to changing the control and dependent variables to check the robustness of results. We also replace the estimation method to test the robustness of the estimate results again. This paper refers to the practice of existing research [44,45] and uses the CMP estimation method suitable for endogenous dummy variables for estimation (see Table 10). Results also show that parental internal migration has a significant negative impact on LBC’s shadow education spending.

4.2. How Does Internal Migration Affect LBC’s Education Investment?

4.2.1. The Test of Household Income

For this part, we test the mechanism by which internal migration affects the shadow education expenditure of LBC. First, internal migration with an easing of family’s investment constraints on children’s education by improving family income may have a positive impact on LBC’s shadow education spending. This article uses logarithm of household per capita net income to test. Results showed that without adding the per capita net income of the family, internal migration did have a negative impact on children’s shadow education expenditure (see column (1) in Table 11), and internal migration also increased the family’s per capita net income (see column (2) in Table 11). After being put into migration and lnfaminco at the same time, results show that migration still has an impact on the shadow education expenditure of LBC, and lnfaminco has a positive impact (see column (3) of Table 11), which shows that household income has a mediating effect.

4.2.2. The Test of Parents’ Awareness of the Importance of Children’s Education

Next, we examine the mechanism of parents’ perception of the importance of investing in their children’s education. We use whether households have already saved for children’s education as a proxy variable. Since parents’ migration increases family income, it also increases the opportunity cost of children’s education; coupled with the gap in the return to education caused by the household registration system, parents’ migration may reduce their awareness of the importance of investing in their children’s education. Results show that, without adding the mediating variable, internal migration has a negative impact on children’s shadow education expenditure (see column (1) of Table 12). We found that parental out-migration significantly reduces the possibility of households saving for their children’s education as well (see column (2) of Table 12). From the regression results of adding the mediating mechanism variables and independent variables at the same time, the mediating effect of whether to save for children’s education has been verified (see column (3) in Table 12), which indicates that parents’ migrant work affects families’ perceptions of investing in their children’s education. This channel has a negative impact on children’s shadow education spending.

4.3. Heterogeneity Analysis

  • Migration Pattern Heterogeneity Analysis
According to different patterns of parents’ migration, this paper divides internal migration into three types: both parents go out, the father goes out and the mother stays behind, and the mother goes out and the father stays behind. The estimated results show that both parents going out has the greatest impact on the shadow education expenditures of LBC, followed by only the father going out. When only the mother goes out, the negative impact is no longer significant(see Table 13).
2.
Migration Distance and Gender Heterogeneity Analysis
Dividing the migration distance into intra-provincial migration and out-of-province migration, the negative impact of out-of-province migration is greater, and the level of significance is also high. The negative impact of intra-provincial migration is smaller than that of out-of-province migration and is only significant at the 5% significance level. In terms of gender, the negative impact of parental migration on girls is greater than on boys(see Table 14). This may be related to the concept of son preference in rural families.
3.
Different Educational Stages Heterogeneity Analysis
Due to the differing needs of families for shadow education at different education stages, the impact of parents’ going out on shadow education expenditures for LBC may also be different. The results show that no matter at which stage, internal migration has a significant negative impact on the shadow education expenditures of LBC, and the negative impact in the junior high school stage is greater than that in the primary school stage (see Table 15).

5. Conclusions and Policy Recommendations

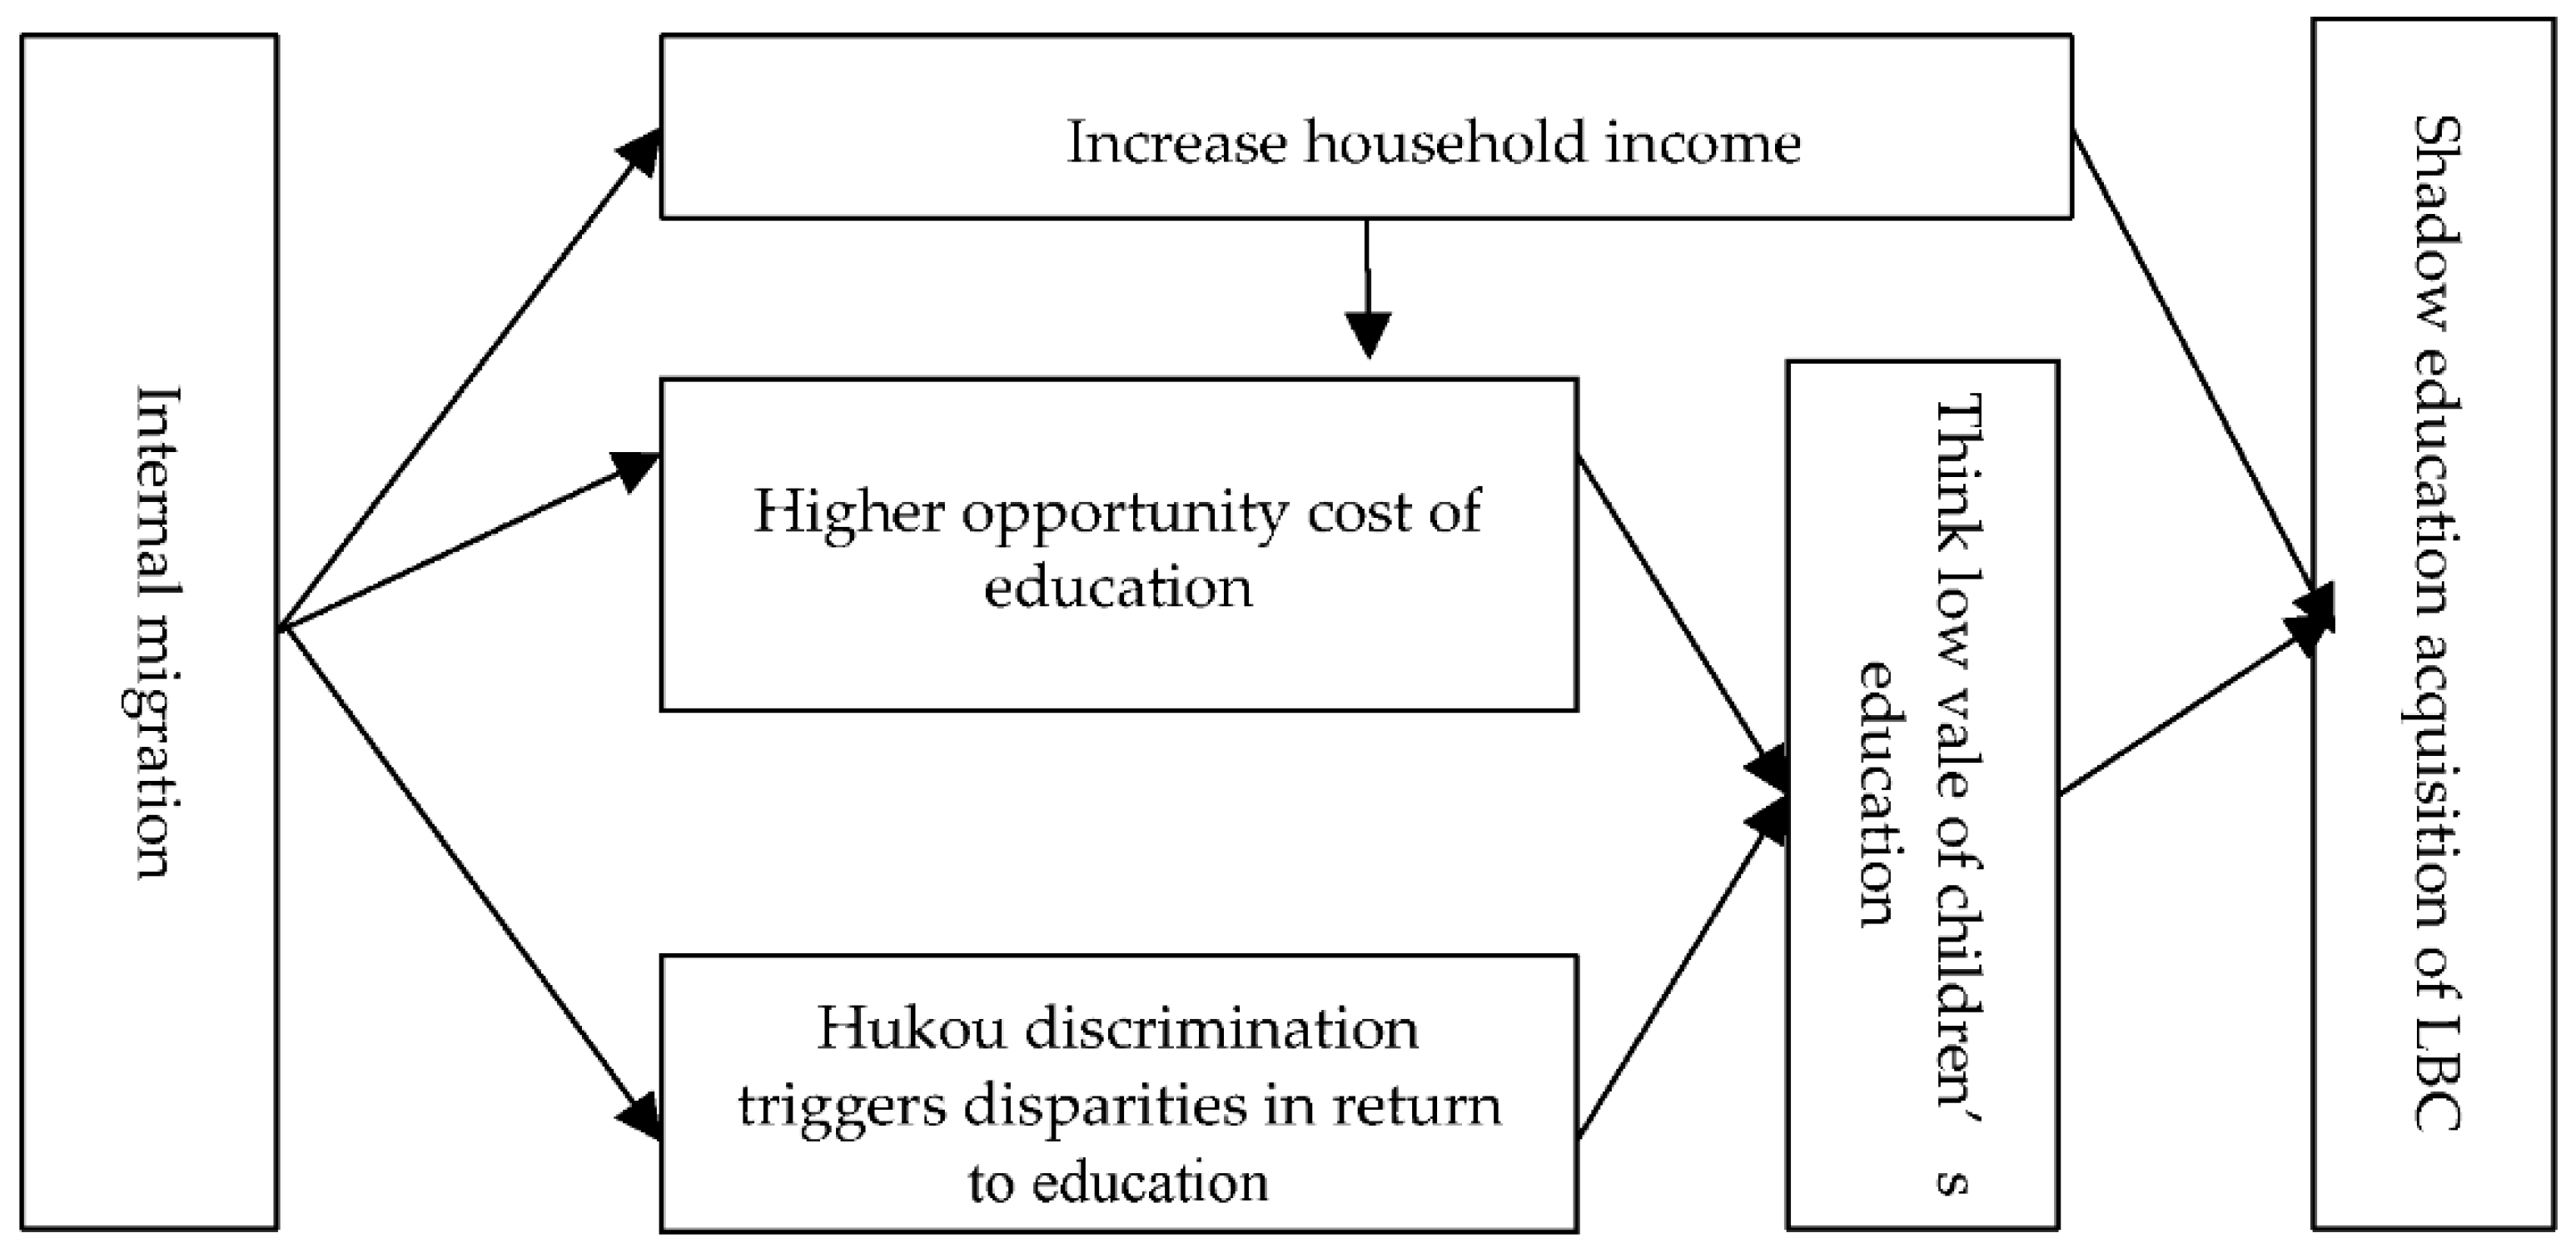
Based on the data from the China Family Panel Studies in 2012, this article uses the IPWRA model and AIPW model to solve possible endogeneity problems on the basis of the OLS model. Then, we conduct a series of robust tests. The estimated results show that internal migration significantly reduces the level of educational investment for LBC in China. Mechanism analysis shows that, on the one hand, internal migration increases family income, so that the family has more resources to invest in the children’s education, but at the same time, it reduces family’s awareness of the necessity of investing in children’s education, thereby reducing the need for investing in children’s education. The result of the combined effect of these two factors is that internal migration significantly reduces the level of children’s educational investment. Heterogeneity analysis found that LBC in families with both parents going out had the greatest negative impact, followed by only fathers going out, and families in which only mothers going out had no significant impact; the negative impact of going out across provinces was greater than that of going out inside the province. The negative impact on girls is greater than on boys. The negative impact on children in junior high school is greater than that on children in primary school.
Different from existing research, this paper answers the question of how rural–urban population migration affects the educational investment behavior of parents toward their children. This provides a channel for thinking about the impact of rural–urban migration on the results of offspring human capital accumulation, and further enriches the research on the impact of migration on human capital accumulation and investment. At the same time, it also provides evidence from China for understanding the impact of migration on human capital accumulation from the perspective of international comparison.
From a practical point of view, the results of this paper show that, on the one hand, it is necessary to see the short-term positive effect of increasing rural household income and improving material welfare for internal migration. However, the possible long-term negative effects cannot be ignored—that is, internal migration may further lead to a decrease in educational investment in children and thus have a negative impact on children’s human capital accumulation. For China, this will undoubtedly challenge the goal of achieving common prosperity. Therefore, further eliminating discrimination in the labor market caused by household registration status and improving the quality of education in rural public schools are optimal policy tools to promote educational equity and achieve common prosperity. The research in this paper also provides a reference for other developing countries to assess the impact of rural–urban migration on human capital accumulation in their own countries.
There are some limitations which require further research. First, the endogeneity problem can be further improved. Although we adopt the IPWRA and AIPW model to solve endogeneity problems as well as a series of robust tests to test the robustness of our results, this could be achieved better with panel data. In this paper, due to the limitations, we can only use data from 2012. Therefore, there may be bias due to unobservable variables that do not change over time. Hence, future researchers are advised to use a panel data to better deal with endogeneity problems. Secondly, this study only uses data from China. It would be interesting to use data from other developing countries for future research to make a comparison analysis.Lastly, for a more detailed study, future research can analyze heterogeneity influence with different migration durations and different city hierarchies.

Author Contributions

Writing—original draft, Z.L.; Writing—review and editing, X.P. All authors have read and agreed to the published version of the manuscript.

Funding

This research received no external funding.

Institutional Review Board Statement

Not applicable.

Informed Consent Statement

Not applicable.

Data Availability Statement

All data included in the paper or could be openly achieved.

Acknowledgments

The authors would like to thank the constructive comments and engagement with the paper from our reviewers regarding significance to the global context.

Conflicts of Interest

The authors declare no conflict of interest.

References

  1. Becker, G. Human Capital; Columbia University Press: New York, NY, USA, 1964. [Google Scholar]
  2. Montenegro, C.E.; Patrinos, H.A. Comparable Estimates of Returns to Schooling around the World; Policy Research Working Paper 7020; World Bank: Washington, DC, USA, 2017. [Google Scholar]
  3. Duflo, E. Schooling and Labor Market Consequences of School Construction in Indonesia: Evidence Rom an Unusual Policy Experiment; NBER Working Paper wp7860; National Bureau of Economic Research: Cambridge, MA, USA, 2000. [Google Scholar]
  4. Vogl, T.S. Education and Health in Developing Economies; Working Paper 1453, Research Program in Development Studies, Woodrow Wilson School of Public and International Affairs; Princeton University: Princeton, NJ, USA, 2012. [Google Scholar]
  5. Solon, G. Intergenerational Mobility in the Labor Market. In Handbook of Labor Economics; Ashenfelter, O., Card, D., Eds.; Handbooks in Economics Series; Elsevier: Amsterdam, The Netherlands, 1999; Volume 3A, pp. 1761–1800. [Google Scholar]
  6. Chetty, R.; Nathaniel, H.; Lawrence, F. The Effects of Exposure to Better Neighborhoods on Children: New Evidence from the Moving to Opportunity Experiment. Am. Econ. Rev. 2016, 106, 855–902. [Google Scholar] [CrossRef] [Green Version]
  7. Chong, A.; Gradstein, M. On Education and Democratic Preferences. Econ. Politics 2015, 27, 362–388. [Google Scholar] [CrossRef] [Green Version]
  8. Romer, P. Endogenous Technological Change. J. Political Econ. 1990, 98, 71–102. [Google Scholar] [CrossRef] [Green Version]
  9. Younger, S.D. Benefits on the Margin: Observations on Marginal Benefit Incidence. World Bank Econ. Rev. 2003, 17, 89–106. [Google Scholar] [CrossRef] [Green Version]
  10. Larreguy, H.A.; John, M. The Effect of Education on Civic and Political Engagement in Non-consolidated Democracies: Evidence from Nigeria. Rev. Econ. Stat. 2017, 99, 387–401. [Google Scholar] [CrossRef]
  11. Blimpo, M.P.; David, K.E.; Nathalie, L. Parental Human Capital and Effective School Management; Policy Research Working Paper 7238; World Bank: Washington, DC, USA, 2015. [Google Scholar]
  12. Li, L.; Zhou, G. Famliy Credit Constraint, Public Rducation Expenditure, and Social Mobility in China. China Econ. Q. 2014, 1, 65–82. (In Chinese) [Google Scholar]
  13. Fan, Z. Financial transfer payments and the intergenerational mobility of human capital. Soc. Sci. China 2020, 9, 48–67. (In Chinese) [Google Scholar]
  14. Yu, J.; Wang, M.; Gong, L. Locus of Control and Human Capital Investiment. China Econ. Q. 2021, 6, 2195–2216. (In Chinese) [Google Scholar]
  15. Todaro. Economic Development in the Third World; Longman: New York, NY, USA, 1989. [Google Scholar]
  16. De Brauw, A.; Rozelle, S. Migration and household investment in rural China. China Econ. Rev. 2008, 19, 320–335. [Google Scholar] [CrossRef]
  17. Lewis, W.A. Economic development with unlimited supplies of labor. Manch. School 1954, 28, 139–191. [Google Scholar] [CrossRef]
  18. Fei, J.C.H.; Ranis, G. Development of the Labor Surplus Economy: Theory and Policies; R. D. Irwin: Homewood, IL, USA, 1964. [Google Scholar]
  19. Reyes, M.M. Migration and Filipino Children Left behind: A Literature Review; Miriam College, UNICEF: Quezon City, Philippines, 2008. [Google Scholar]
  20. Tarroja and Fernando. Providing psychological services for children of overseas Filipino workers (OFWs): A challenge for school psychologists in the Philippines. Sch. Psychol. Int. 2013, 34, 202–212. [Google Scholar] [CrossRef]
  21. Zhao, Q.; Yu, X.; Wang, X.; Glauben, T. The impact of parental migration on children’s school performance in rural China. China Econ. Rev. 2014, 31, 43–54. [Google Scholar] [CrossRef]
  22. National Bureau of Statistics of China; UNICEF China; UNFPA China. Population Status of Children in China in 2015: Facts and Figures. Available online: https://www.unicef.cn/en/reports/population-status-children-china-2015 (accessed on 20 January 2017).
  23. McKenzie, D.; Rapoport, H. Can migration reduce educational attainment? Evidence from Mexico. J. Popul. Econ. 2011, 24, 1331–1358. [Google Scholar] [CrossRef] [Green Version]
  24. Xiang, B. How Far are the Left-Behind Left Behind? A Preliminary Study in Rural China. Popul. Space Place 2007, 13, 179–191. [Google Scholar]
  25. Becker, G. Investment inhuman capital: A theoretical analysis. J. Political Econ. 1962, 70, 9–49. [Google Scholar] [CrossRef]
  26. Ben-Porath, Y. Theproduction of human capital and the life cycle of earnings. J. Political Econ. 1967, 75, 352–365. [Google Scholar] [CrossRef]
  27. Li, P.; Jia, W. An Empirical Analysis on Children’s Education Investment of Rural Families—Taking Guangdong Province as An Example. China Rural. Surv. 2010, 3, 73–85. (In Chinese) [Google Scholar]
  28. Zhou, C.; Su, Q.; Wang, L. Empirical Study on Heterogeneity of Children’s Education Investment under the Background of Social Stratification in Rural China. Educ. Econ. 2017, 2, 62–68. (In Chinese) [Google Scholar]
  29. Zhang, N.; Lin, J.; Li, J. Research on Inequality of Opportunity in Basic Education. China Ind. Econ. 2020, 6, 2195–2216. (In Chinese) [Google Scholar]
  30. Swidler, A. Culture in Action: Symbols and Strategies. Am. Sociol. Rev. 1986, 51, 273–286. [Google Scholar] [CrossRef] [Green Version]
  31. Schwartz, S.H.; Bilsky, W. Toward A Universal Psychological Structure of Human Values. J. Personal. Soc. Psychol. 1987, 3, 555–562. [Google Scholar] [CrossRef]
  32. Nordblom, K. Is increased public schooling really a policy for equality? J. Public Econ. 2003, 87, 1943–1965. [Google Scholar] [CrossRef]
  33. Ye, J.; Wang, Y.; Zhang, K.; Lu, J. A review of research on left-behind children. Issues Agric. Econ. 2005, 10, 68–76. (In Chinese) [Google Scholar]
  34. Sun, J. Changes to Hukou Discrimination in China’s Labor Market: Employment and Wages of Rural Migrant Workers. Econ. Res. J. 2017, 8, 171–186. (In Chinese) [Google Scholar]
  35. Xing, C. The Income Gap Between Migrant Workers and Urban Workers. Manag. World 2008, 5, 55–64. (In Chinese) [Google Scholar]
  36. Kang, L.; Peng, F.; Zhu, Y. Returns to higher education subjects and tiers in China- evidence from the China Family Panel Studies. Stud. High. Educ. 2019, 46, 1682–1695. [Google Scholar] [CrossRef] [Green Version]
  37. Long, W.; Pan, X.; Dong, X.; Zeng, J. Is rented accommodation a good choice for primary school students’ academic performance?–Evidence from rural China. China Econ. Rev. 2020, 62, 101459. [Google Scholar] [CrossRef]
  38. Derya Uysal, S. Doubly robust estimation of causal effects with multivalued treatments: An application to the returns to schooling. J. Appl. Econom. 2015, 30, 763–786. [Google Scholar] [CrossRef]
  39. Qin, J.; Zhang, B.; Leung, D.H. Efficient augmented inverse probability weighted estimation in missing data problems. J. Bus. Econ. Stat. 2017, 35, 86–97. [Google Scholar] [CrossRef]
  40. Wang, H.; Cheng, Z.; Zhe Wang, B.; Chen, Y. Childhood left-behind experience and labour market outcomes in China. J. Bus. Res. 2021, 132, 196–207. [Google Scholar] [CrossRef]
  41. Mu, R.; de Brauw, A. Migration and young child nutrition: Evidence from rural China. J. Popul. Econ. 2015, 28, 631–657. [Google Scholar] [CrossRef] [Green Version]
  42. Zhu, Z. Public Health Services and Migrant Workers’Willingness to Settle in Cities: Evidence from China Migrants Dynamic Survey. Chin. Rural. Econ. 2021, 10, 125–144. (In Chinese) [Google Scholar]
  43. Ashraf, Q.; Galor, O. The ‘Out of Africa’ Hypothesis, Human Genetic Diversity, and Comparative Economic Development. Am. Econ. Rev. 2013, 103, 151–184. [Google Scholar] [CrossRef] [Green Version]
  44. Deng, R. An empirical study on the influence of trade union membership on the subjective well-being of migrant workers. World Econ. Pap. 2021, 4, 23–40. (In Chinese) [Google Scholar]
  45. Yin, Z.; Yue, P.; Chen, X. Financial Market Participation, Risk Heterogeneity, and Household Well-Being. J. Financ. Res. 2019, 4, 168–187. (In Chinese) [Google Scholar]
Figure 1. Mechanism of internal migration affecting education investment of LBC.
Sustainability 14 06257 g001
Table 1. Descriptive statistics for variables (N = 1894).
VariablesMeanS.DMinMaxDefinition of Variables
Independent variable
migration0.2100.40801At least one of both parents migrate out = 1, otherwise = 0
Dependent variables
eduexp94.794439.90108000Child shadow education spending
lneduexp0.8212.0650.0108.987Logarithm of child shadow education spending
Mechanism test variables
faminco7432.8156836.5650.20074,333.340Per capita net income of households in the past year
lnfaminco8.4731.1260.19111.216Log of per capita net income of households in the past year
edusave0.1520.35901Children’s education savings
IV
migper35.67521.1030100Proportion of labor force working outside in village level two years ago
Control variables
ch_gender0.5250.50001Boy = 1, girls = 0
ch_age10.7392.624615The age of child
ch_chiscore
excellent0.2350.42401Excellent = 1, otherwise = 0
good0.3180.46601Good = 1, otherwise = 0
middle0.3250.46801Middle = 1, otherwise = 0
poor0.1300.32701Poor = 1, otherwise = 0
ch_matscore
excellent0.2450.43001Excellent = 1, otherwise = 0
good0.2930.45501Good = 1, otherwise = 0
middle0.3090.46201Middle = 1, otherwise = 0
poor0.1530.36001Poor = 1, otherwise = 0
ke-school0.1880.39101Key school = 1, non-key school = 0
board0.2540.43501Board = 1, non board = 0
fa_eduyear6.3123.721016Father’s years of education
fa_age39.2605.5882565The age of father
fa_ethnicity0.8810.32401Han = 1, otherwise = 0
fa_polsta0.0590.23501Political status of father
mo_eduyear4.4813.995015Mother’s years of education
mo_age37.4395.3032452The age of mother
mo_ethnicity0.8850.31901Han = 1, otherwise = 0
mo_polsta0.0590.23501Political status of mother
famsize5.2431.725317Family size
lnfaminco8.4731.1260.19111.216Log of per capita net income of households in the past year
lndistance7.8841.6540.69811.736Log of the distance from the village to the nearby market town
Table 2. The impact of internal migration on LBC’s shadow education expenditure.
VariablesShadow Education Spending
(1)(2)(3)(4)(5)
migration−0.4917 ***−0.4640 ***−0.5182 ***−0.5143 ***−0.4054 ***
(0.0954)(0.0940)(0.1022)(0.1022)(0.1060)
ch_gender −0.1319−0.1833 **−0.1885 **−0.1884 **
(0.0959)(0.0929)(0.0927)(0.0905)
ch_age 0.0487 ***0.0733 ***0.0724 ***0.0726 ***
(0.0184)(0.0205)(0.0206)(0.0202)
ch_chiscore (excellent as reference)
good −0.0095−0.0134−0.0151−0.0031
(0.0246)(0.0233)(0.0236)(0.0215)
middle −0.0384−0.0310−0.0342−0.0120
(0.0265)(0.0262)(0.0263)(0.0245)
poor −0.0512−0.0297−0.0335−0.0000
(0.0347)(0.0356)(0.0355)(0.0352)
ch_matscore (excellent as reference)
good −0.3035 *−0.2098−0.2034−0.1440
(0.1550)(0.1538)(0.1539)(0.1515)
middle −0.2248−0.0909−0.0967−0.0640
(0.1578)(0.1587)(0.1583)(0.1547)
poor −0.4384 **−0.2773−0.2924−0.2426
(0.1832)(0.1813)(0.1819)(0.1845)
ke_school 0.3108 **0.3869 ***0.3823 ***0.4316 ***
(0.1338)(0.1308)(0.1301)(0.1271)
board −0.2504 **−0.4041 ***−0.3902 ***−0.3140 ***
(0.1130)(0.1155)(0.1150)(0.1155)
fa_eduyear 0.0272 **0.0259 **0.0250 **
(0.0128)(0.0128)(0.0125)
fa_age −0.0089−0.00790.0099
(0.0149)(0.0149)(0.0148)
fa_ethnicity −0.2509−0.2702−0.3832
(0.3081)(0.3123)(0.2991)
fa_plosta −0.3836−0.3285−0.3175
(0.5431)(0.5375)(0.5009)
mo_eduyear 0.0668 ***0.0659 ***0.0430 ***
(0.0132)(0.0132)(0.0136)
mo_age −0.0002−0.0014−0.0194
(0.0147)(0.0148)(0.0147)
mo_ethnicity 0.5797 **0.6147 **0.4535
(0.2890)(0.2925)(0.2764)
mo_plosta 0.39870.35460.3875
(0.5686)(0.5619)(0.5231)
famsize −0.1392 ***−0.1383 ***−0.0864 ***
(0.0243)(0.0243)(0.0245)
lnfaminco 0.1650 ***0.1598 ***0.1431 ***
(0.0399)(0.0398)(0.0398)
lndistance −0.0590 **−0.0765 ***
(0.0266)(0.0262)
constant0.9241 ***0.8825 ***−0.48620.03600.1188
(0.0562)(0.2195)(0.5440)(0.5799)(0.6247)
province Yes
Observations18941894189418941894
R20.0090.0330.0900.0930.158
Note: Robust standard errors in parentheses; ***, **, * denote the significance at 1%, 5% and 10% level, respectively.
Table 3. Select equation estimate results.
VariablesMigration (IPWRA)Migration (AIPW)
migper0.0063 **0.0063 **
(0.0030)(0.0030)
ch_gender0.11690.1169
(0.1280)(0.1280)
ch_age0.04410.0441
(0.0311)(0.0331)
board0.22400.2240
(0.174)(0.1740)
fa_eduyear0.0418 **0.0418 **
(0.0190)(0.0190)
fa_age−0.0706 ***−0.0706 ***
(0.0246)(0.0246)
fa_ethnicity0.54950.5495
(0.4203)(0.4203)
fa_polsta−1.7984 **−1.7984 **
(0.7445)(0.7445)
mo_eduyear0.01100.0110
(0.0200)(0.0200)
mo_age−0.0280−0.0280
(0.0242)(0.0242)
mo_ethnicity−0.7462 *−0.7462 *
(0.4099)(0.4099)
mo_polsta0.71870.7187
(0.7828)(0.7828)
famsize0.0862 **0.0862 **
(0.0367)(0.0367)
lnfaminco0.7357 ***0.7357 ***
(0.0709)(0.0709)
lndistance0.00300.0030
(0.0385)(0.0385)
constant−5.9668 ***−5.9668 ***
(0.9634)(0.9634)
provinceYesYes
Observations18941894
Note: Robust standard errors in parentheses; ***, **, * denote the significance at 1%, 5% and 10% level, respectively.
Table 4. Select equation estimate results.
Variables(Lneduexp) IPWRA(Lneduexp) AIPW
migration0.47820.5195
non migration0.91190.9096
Table 5. Treatment effect estimates.
ModelsATES.E
IPWRA−0.4337 ***0.1455
AIPW−0.3901 **0.1603
Note: Robust standard errors in parentheses; ***, ** denote the significance at 1% and 5% level, respectively.
Table 6. Robust test -baseline regression.
Variables(1)(2)
Father Is Head of HouseholdMother Is Head of Household
LneduexpLneduexp
migration−0.3982 ***−0.4002 ***
(0.1052)(0.1049)
child characteristicsYesYes
father characteristicsYes
mother characteristicsYes
family characteristicsYesYes
village characteristicsYesYes
constantYesYes
provinceYesYes
Observations18941894
R20.1510.155
Note: Robust standard errors in parentheses; *** denote the significance at 1% level.
Table 7. Robust test -treatment effect.
Models(1)(2)
Father Is Head of HouseholdMother Is Head of Household
IPWRA−0.4255 ***−0.4255 ***
(0.1453)(0.1453)
AIPW−0.3789 ***−0.3769 **
(0.1470)(0.1610)
Note: Robust standard errors in parentheses; ***, ** denote the significance at 1% and 5% level, respectively.
Table 8. Effects on total education expenditure and school choice cost-baseline regression.
Variables(1)(2)
Total Education ExpenditureSchool Choice Cost
migration−0.0723−0.1286 **
(0.0945)−0.1286 **
Other variablesYesYes
Observations18941894
R20.3230.032
Note: Robust standard errors in parentheses; ** denote the significance at 5% level.
Table 9. Effects on total education expenditure and school choice cost-treatment effect regression.
Models(1)(2)
Total Education ExpenditureSchool Choice Cost
IPWRA−0.0357−0.1541 ***
(0.0939)(0.0351)
AIPW−0.0651−0.1495 ***
(0.1011)(0.0392)
Note: Robust standard errors in parentheses; *** denote the significance at 1% level.
Table 10. Robust test—CMP model.
VariablesFirst StageSecond Stage
MigrationLmeduexp
migper0.0039 **
(0.0018)
migration−1.0178 ***
(0.3701)
Other variablesYesYes
constantYesYes
Observations18941894
Note: Robust standard errors in parentheses; ***, ** denote the significance at 1% and 5% level, respectively.
Table 11. Mechanism analysis—Household income.
Variables(1)(2)(3)
LneduexpLnfamincoLneduexp
migration−0.3233 ***0.5739 ***−0.4054 ***
(0.1017)(0.0467)(0.1060)
lnfaminco0.0173 **
(0.0082)
Other variablesYesYesYes
constantYesYesYes
Observations189418941894
R20.1530.1290.158
Note: Robust standard errors in parentheses; ***, ** denote the significance at 1% and 5% level, respectively.
Table 12. Mechanism analysis—Edusave.
Variables(1)(2)(3)
LneduexpEdusaveLneduxexp
migration−0.4054 ***−0.0648 ***−0.3860 ***
(0.1060)(0.0212)(0.1056)
edusave0.0457 **
(0.0188)
Other variablesYesYesYes
constantYesYesYes
Observations189418941894
R20.1580.160
Note: Column (2) is marginal effects; Robust standard errors in parentheses; ***, ** denote the significance at the 1% and 5% levels, respectively.
Table 13. Results of different migration patterns.
Variables(1)(2)(3)
Both Parents MigrationOnly Father MigrationOnly Mother Migration
LneduexpLneduexpLneduexp
migration−0.4667 ***−0.4197 ***−0.2725
(0.1553)(0.1260)(0.2595)
Other variablesYesYesYes
constantYesYesYes
Observations163017061550
R20.1660.1590.159
Note: Robust standard errors in parentheses; *** denote the significance at 1% level.
Table 14. Results of different migration distance and gender.
Variables(1)(2)(3)(4)
Out-of-Province vs. Non MigrationIntra-Province vs. Non MigrationBoyGirl
LneduexpLneduexpLneduexpLneduexp
migration−0.4404 ***−0.3799 **−0.3999 ***−0.4118 ***
(0.1210)(0.1587)(0.1442)(0.1588)
Other variablesYesYesYesYes
constantYesYesYesYes
Observations17741620994900
R20.1570.1640.1820.171
Note: Robust standard errors in parentheses; ***, ** denote the significance at the 1%, and 5% levels, respectively.
Table 15. Results of different education stages.
Variables(1)(2)
Primary SchoolJunior High School
LneduexpLneduexp
migration−0.3768 ***−0.4592 *
(0.1155)(0.2494)
Other variablesYesYes
constantYesYes
Observations1424470
R20.1800.146
Note: Robust standard errors in parentheses; ***, * denote the significance at 1% and 10% level, respectively.
Publisher’s Note: MDPI stays neutral with regard to jurisdictional claims in published maps and institutional affiliations.

