Sustainable Network by Enhancing Attribute-Based Selection Mechanism Using Lagrange Interpolation
Abstract
:1. Introduction
2. Related Work
3. Building Blocks of ABSM
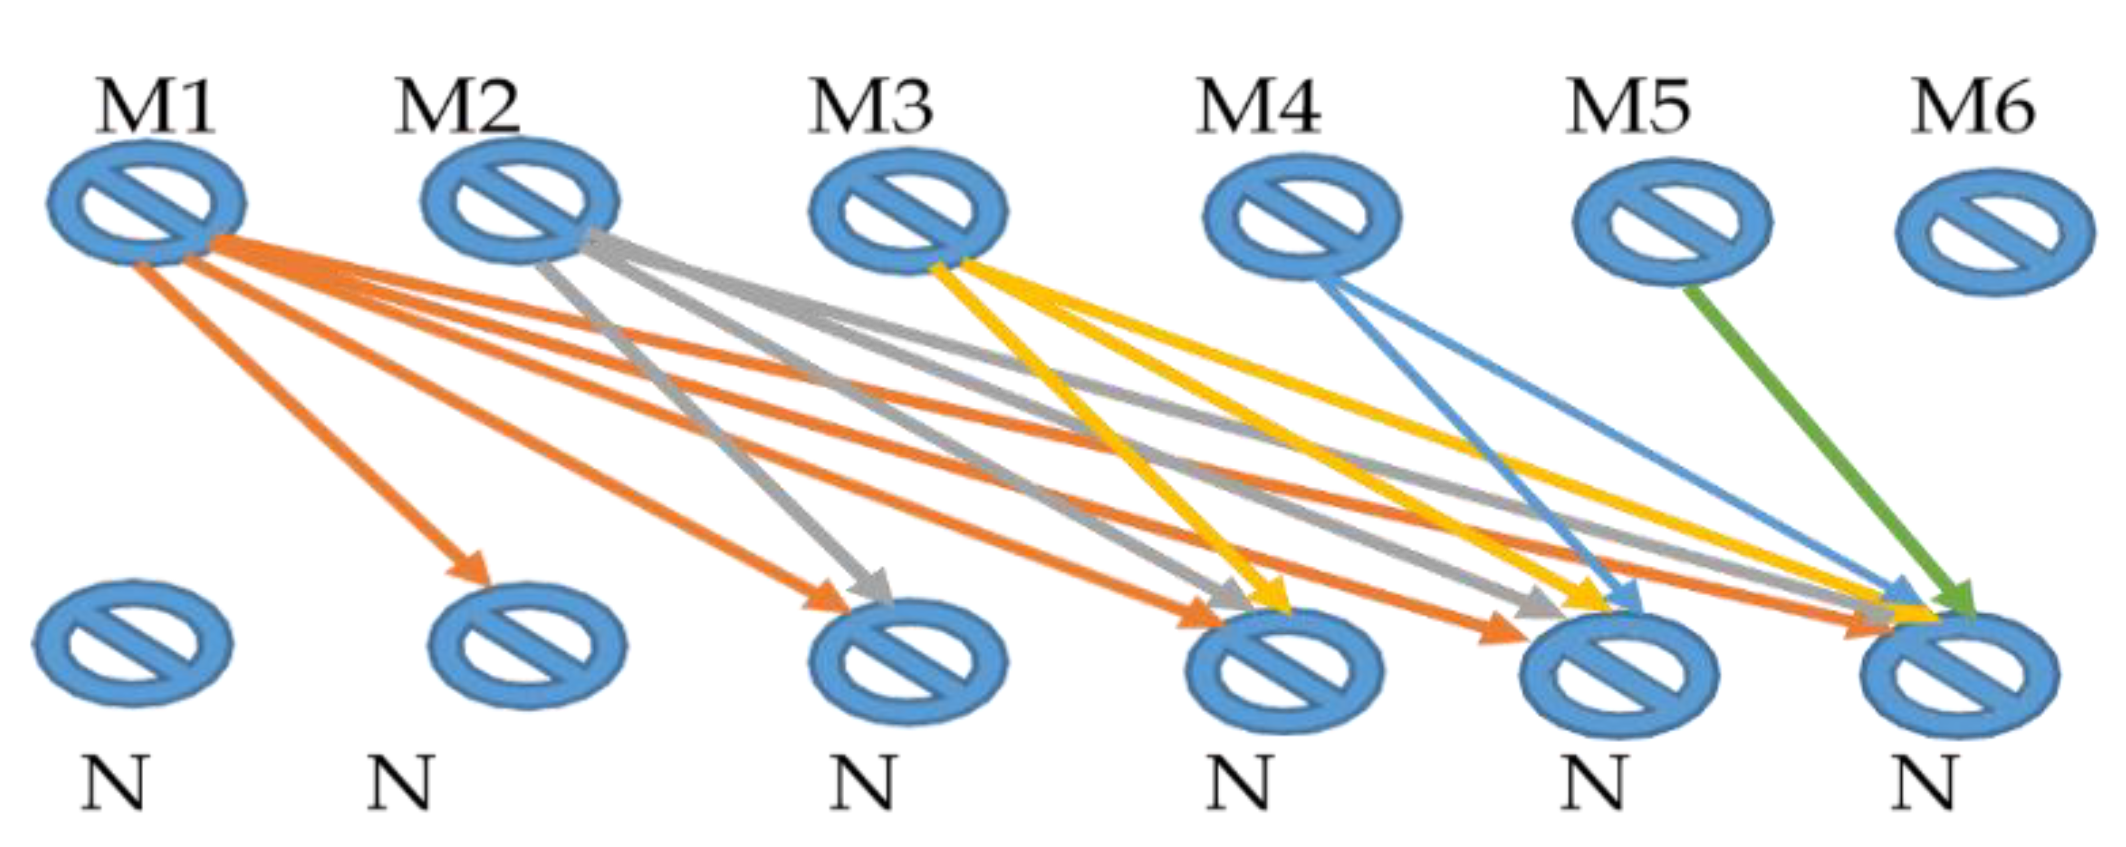
| Algorithm 1 Share Verification Pseudo Code |
| (1) Order = 2; // order of Interpolation |
| (2) MyVALUE = [ ] // Empty value be initialized |
| (3) For x = 1: 3 // For 3 nodes |
| token = 1; |
| Current1 = NodeIDI // Using the first node as a starting point |
| (4) for y=1: Nodes; |
| Current = Vehiclesj; // There would be two Rest Nodes for each interpolation. |
| if Current1~ = Current // If nodes are not equal |
| Rest(token) = current; |
| Token = token + 1; |
| End If |
| (5) End |
| (6) For Deno = 0 |
| (7) Deno = Current1 − Rest1 ∗ Current1 − Rest2 // The denominator value |
| (8) Num = Rest1 ∗ Rest2 |
| (9) Myvalue[x] = Num/ Deno |
| (10) Sharedkey = ShareCurrent1 * Myvalue[x] |
| (11) End For |
4. Curve Fitting
4.1. Fourier Series Fitting (FST)
4.1.1. Computation Complexity
4.1.2. Randomness
4.2. Moving Average (Simple)
4.2.1. Computation Intricacy
4.2.2. Randomness
4.2.3. Setup
| Algorithm 2 Communication range prediction (Nodes, m, n, Nodeid) |
| CommunicationPrediction = [] |
| For node 1 in environment |
| For node 2 in environment |
| When node 𝜕 = node 1 |
| D = √ [(node) − M(node1)]2 + [N(node) − N(node1)]2 |
| Predict the coverage (node, node1) = Nodei(node1) |
| End_For |
| End_For |
| End Algorithm 1 |
4.2.4. Route Discovery
| Algorithm 3 Route Dicovery |
| Input: Source at Transmission and Destination at Receiving end |
| Send Message = Send (‘Hi’) |
| For each responder of Send Message |
| Compute Requirements of the route = (); |
| Choose Node (Hi); |
| If reply comes back then |
| Add Route |
| EndIF |
| Repeat the step until destination dose not found |
| EndFor |
| End Algorithm |
5. Results and Discussion
- Throughput: Throughput is known as the ratio of total packets received at the destination end per unit time. In mathematical terms, it is written as follows:
- PDR: defined as the ratio of the total number of packets received from targets to packets generated by source nodes on the transmission side, the PDR is calculated using the following mathematical formula:
6. Limitation and Future Directions
7. Conclusions
Author Contributions
Funding
Institutional Review Board Statement
Informed Consent Statement
Data Availability Statement
Acknowledgments
Conflicts of Interest
References
- Badawy, A.; Khattab, T.; El-Fouly, T.; Mohamed, A.; Trinchero, D.; Chiasserini, C.-F. Secret Key Generation Based on AoA Estimation for Low SNR Conditions. In Proceedings of the 2015 IEEE 81st Vehicular Technology Conference (VTC Spring), Glasgow, Scotland, 11–14 May 2015; pp. 1–7. [Google Scholar]
- Muhammad, G.; Hossain, M.S. Deep-Reinforcement-Learning-Based Sustainable Energy Distribution for Wireless Communication. IEEE Wirel. Commun. 2021, 28, 42–48. [Google Scholar] [CrossRef]
- Balaji, N.A.; Sukumar, R.; Parvathy, M. Enhanced dual authentication and key management scheme for data authentication in vehicular ad hoc network. Comput. Electr. Eng. 2019, 76, 94–110. [Google Scholar] [CrossRef]
- Muhammad, G.; Alhussein, M. Security, Trust, and Privacy for the Internet of Vehicles: A Deep Learning Approach. IEEE Consum. Electron. Mag. 2022; Early Access. [Google Scholar] [CrossRef]
- Cho, J.H.; Chen, R.; Chan, K.S. Trust threshold based public key management in mobile ad hoc networks. Ad Hoc Netw. 2016, 44, 58–75. [Google Scholar] [CrossRef] [Green Version]
- Cui, H.; Deng, R.H.; Wang, G. An attribute-based framework for secure communications in vehicular ad hoc networks. IEEE/ACM Trans. Netw. 2019, 27, 721–733. [Google Scholar] [CrossRef]
- Das, A.K.; Kumari, S.; Odelu, V.; Li, X.; Wu, F.; Huang, X. Provably secure user authentication and key agreement scheme for wireless sensor networks. Secur. Commun. Netw. 2016, 9, 3670–3687. [Google Scholar] [CrossRef]
- Datta, P.; Sharma, B. A Survey on IoT Architectures, Protocols, Security and Smart City Based Applications. In Proceedings of the 2017 8th International Conference on Computing, Communication and Networking Technologies (ICCCNT), Delhi, India, 3–5 July 2017; pp. 1–5. [Google Scholar]
- Yuliana, M. A simple secret key generation by using a combination of pre-processing method with a multilevel quantization. Entropy 2019, 21, 192. [Google Scholar] [CrossRef] [Green Version]
- Alshehri, F.; Muhammad, G. A Comprehensive Survey of the Internet of Things (IoT) and AI-Based Smart Healthcare. IEEE Access 2021, 9, 3660–3678. [Google Scholar] [CrossRef]
- Robinson, Y.H.; Julie, E.G. MTPKM: Multipart trust based public key management technique to reduce security vulnerability in mobile ad-hoc networks. Wirel. Pers. Commun. 2019, 109, 739–760. [Google Scholar] [CrossRef]
- Haroun, M.F.; Gulliver, T.A. Secret key generation using chaotic signals over frequency selective fading channels. IEEE Trans. Inf. Forensics Secur. 2015, 10, 1764–1775. [Google Scholar] [CrossRef]
- Hassan, M.U.; Shahzaib, M.; Shaukat, K.; Hussain, S.N.; Mubashir, M.; Karim, S.; Shabir, M.A. DEAR-2: An energy-aware routing protocol with guaranteed delivery in wireless ad-hoc networks. In Recent Trends and Advances in Wireless and IoT-Enabled Networks; Springer: Cham, Switzerland, 2019; pp. 215–224. [Google Scholar]
- Huang, Y.; Jin, L.; Wei, H.; Zhong, Z.; Zhang, S. Fast secret key generation based on dynamic private pilot from static wireless channels. China Commun. 2018, 15, 171–183. [Google Scholar] [CrossRef]
- Alam, T.M.; Shaukat, K.; Hameed, I.A.; Khan, W.A.; Sarwar, M.U.; Iqbal, F.; Luo, S. A novel framework for prognostic factors identification of malignant mesothelioma through association rule mining. Biomed. Signal Process. Control 2021, 68, 102726. [Google Scholar] [CrossRef]
- Javed, I.; Tang, X.; Shaukat, K.; Sarwar, M.U.; Alam, T.M.; Hameed, I.A.; Saleem, M.A. V2X-based mobile localization in 3D wireless sensor network. Secur. Commun. Netw. 2021, 2021, 6677896. [Google Scholar] [CrossRef]
- Jose, R.T.; Poulose, S.L. Ontology Based Privacy Preservation over Encrypted Data using Attribute-Based Encryption Technique. Adv. Sci. Technol. Eng. Syst. J. 2021, 6, 378–386. [Google Scholar] [CrossRef]
- Zeng, K. Physical layer key generation in wireless networks: Challenges and opportunities. IEEE Commun. Mag. 2015, 53, 33–39. [Google Scholar] [CrossRef]
- Muhammad, G.; Alshehri, F.; Karray, F.; El Saddik, A.; Alsulaiman, M.; Falk, T.H. A comprehensive survey on multimodal medical signals fusion for smart healthcare systems. Inf. Fusion 2021, 76, 355–375. [Google Scholar] [CrossRef]
- Moara-Nkwe, K.; Shi, Q.; Lee, G.M.; Eiza, M.H. A novel physical layer secure key generation and refreshment scheme for wireless sensor networks. IEEE Access 2018, 6, 11374–11387. [Google Scholar] [CrossRef]
- Rathore, S.; Agrawal, J.; Sharma, S.; Sahu, S. Efficient Decentralized Key Management Approach for Vehicular Ad Hoc Network. In Data, Engineering and Applications; Springer: Singapore, 2019; pp. 147–161. [Google Scholar]
- Shaukat, K.; Luo, S.; Chen, S.; Liu, D. Cyber threat detection using machine learning techniques: A performance evaluation perspective. In Proceedings of the 2020 International Conference on Cyber Warfare and Security (ICCWS), Norfolk, VA, USA, 12–13 March 2020; pp. 1–6. [Google Scholar]
- Shaukat, K.; Luo, S.; Varadharajan, V.; Hameed, I.A.; Chen, S.; Liu, D.; Li, J. Performance comparison and current challenges of using machine learning techniques in cybersecurity. Energies 2020, 13, 2509. [Google Scholar] [CrossRef]
- Shehadeh, Y.E.H.; Hogrefe, D. A survey on secret key generation mechanisms on the physical layer in wireless networks. Secur. Commun. Netw. 2015, 8, 332–341. [Google Scholar] [CrossRef]
- Strauss, M.A.; Yahil, A.; Davis, M.; Huchra, J.P.; Fisher, K. A redshift survey of IRAS galaxies. V-The acceleration on the Local Group. Astrophys. J. 1992, 397, 395–419. [Google Scholar] [CrossRef]
- Wang, T.; Liu, Y.; Vasilakos, A.V. Survey on channel reciprocity based key establishment techniques for wireless systems. Wirel. Netw. 2015, 21, 1835–1846. [Google Scholar] [CrossRef]
- Xiao, S.; Guo, Y.; Huang, K.; Jin, L. Cooperative group secret key generation based on secure network coding. IEEE Commun. Lett. 2018, 22, 1466–1469. [Google Scholar] [CrossRef]
- Zaman, S.; Chakraborty, C.; Mehajabin, N.; Mamun-Or-Rashid, M.; Razzaque, M.A. A Deep Learning based device authentication scheme using channel state information. In Proceedings of the 2018 International Conference on Innovation in Engineering and Technology (ICIET), Dhaka, Bangladesh, 27–28 December 2018; pp. 1–5. [Google Scholar]
- Zhan, F.; Yao, N. On the using of discrete wavelet transform for physical layer key generation. Ad Hoc Netw. 2017, 64, 22–31. [Google Scholar] [CrossRef]
- Majid, M.; Habib, S.; Javed, A.R.; Rizwan, M.; Srivastava, G.; Gadekallu, T.R.; Lin, J.C.W. Applications of wireless sensor networks and internet of things frameworks in the industry revolution 4.0: A systematic literature review. Sensors 2022, 22, 2087. [Google Scholar] [CrossRef] [PubMed]
- Kanwal, S.; Rashid, J.; Kim, J.; Juneja, S.; Dhiman, G.; Hussain, A. Mitigating the Coexistence Technique in Wireless Body Area Networks by Using Superframe Interleaving. IETE J. Res. 2022, 1–15. [Google Scholar] [CrossRef]
- Shao, C.; Yang, Y.; Juneja, S.; Gseetharam, T. IoT data visualization for business intelligence in corporate finance. Inf. Process. Manag. 2022, 59, 102736. [Google Scholar] [CrossRef]
- Upadhyay, H.K.; Juneja, S.; Maggu, S.; Dhingra, G.; Juneja, A. Multi-criteria analysis of social isolation barriers amid COVID-19 using fuzzy AHP. World J. Eng. 2022, 19, 195–203. [Google Scholar] [CrossRef]
- Roy, A.K.; Nath, K.; Srivastava, G.; Gadekallu, T.R.; Lin, J.C.W. Privacy Preserving Multi-Party Key Exchange Protocol for Wireless Mesh Networks. Sensors 2022, 22, 1958. [Google Scholar] [CrossRef]
- Dev, K.; Maddikunta, P.K.R.; Gadekallu, T.R.; Bhattacharya, S.; Hegde, P.; Singh, S. Energy Optimization for Green Communication in IoT Using Harris Hawks Optimization. IEEE Trans. Green Commun. Netw. 2022. [Google Scholar] [CrossRef]
- Hasan, M.K.; Akhtaruzzaman, M.; Kabir, S.R.; Gadekallu, T.R.; Islam, S.; Magalingam, P.; Hassan, R.; Alazab, M.; Alazab, M.A. Evolution of Industry and Blockchain Era: Monitoring Price Hike and Corruption using BIoT for Smart Government and Industry 4.0. IEEE Trans. Ind. Inform. 2022. [Google Scholar] [CrossRef]
- Juneja, A.; Juneja, S.; Bali, V.; Mahajan, S. Multi-Criterion Decision Making for Wireless Communication Technologies Adoption in IoT. Int. J. Syst. Dyn. Appl. 2020, 10, 1–15. [Google Scholar] [CrossRef]


| Sr. No. | References | Technique Used |
|---|---|---|
| 1 | [14] | RSS |
| 2 | [15] | RSS |
| 3 | [16] | two-level execution using CIR and RSS |
| 4 | [17] | Blocks and a two-level quantifier |
| 5 | [18] | Key generation ranking mechanisms and interpolation |
| 6 | [19] | Technique based on the KLT (Karhunen-Loeve Transform) |
| 7 | [20] | CSI (channel state information) |
| 8 | [21] | Angle-of-arrival for signature key extraction |
| 9 | [22] | Chaotic signals |
| Number of Iterations | Throughput without LI | Throughput with LI |
|---|---|---|
| 50 | 11,000 | 22,000 |
| 100 | 11,500 | 22,500 |
| 150 | 12,000 | 23,000 |
| 200 | 12,500 | 23,500 |
| 250 | 13,000 | 23,800 |
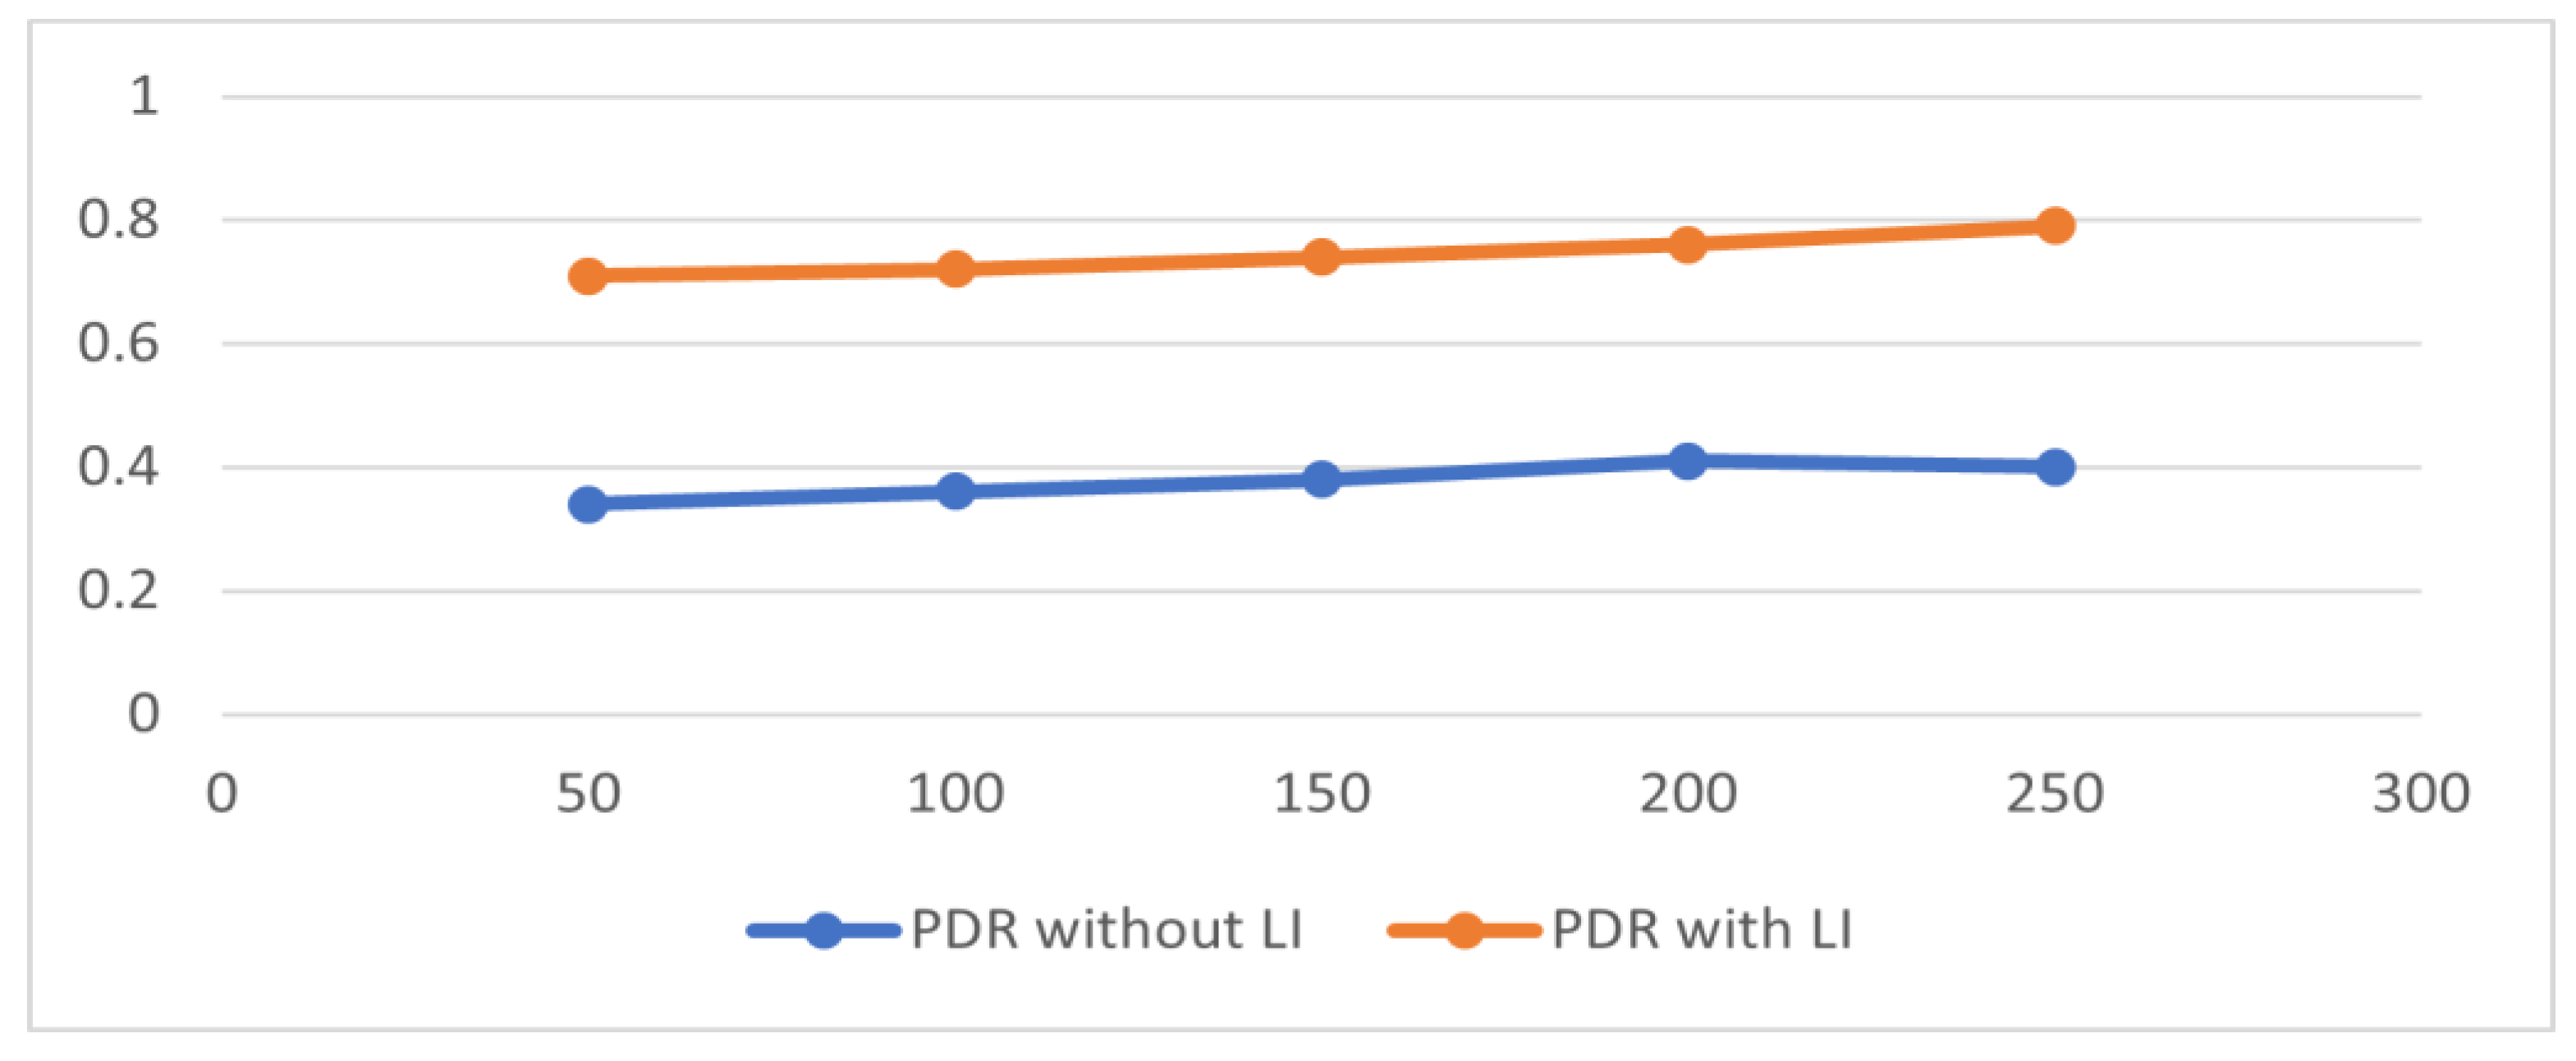
| Total Number of Iterations | PDR without LI | PDR with LI |
|---|---|---|
| 50 | 0.34 | 0.71 |
| 100 | 0.36 | 0.72 |
| 150 | 0.38 | 0.74 |
| 200 | 0.41 | 0.76 |
| 250 | 0.4 | 0.79 |
| Total Number of Simulations | Noise without LI | Noise with Proposed Methodology Incorporating LI |
|---|---|---|
| 50 | 0.26 | 0.16 |
| 100 | 0.25 | 0.22 |
| 150 | 0.31 | 0.24 |
| 200 | 0.36 | 0.26 |
| 250 | 0.39 | 0.27 |
| 300 | 0.4 | 0.27 |
| 350 | 0.41 | 0.23 |
| 400 | 0.42 | 0.21 |
| 450 | 0.42 | 0.21 |
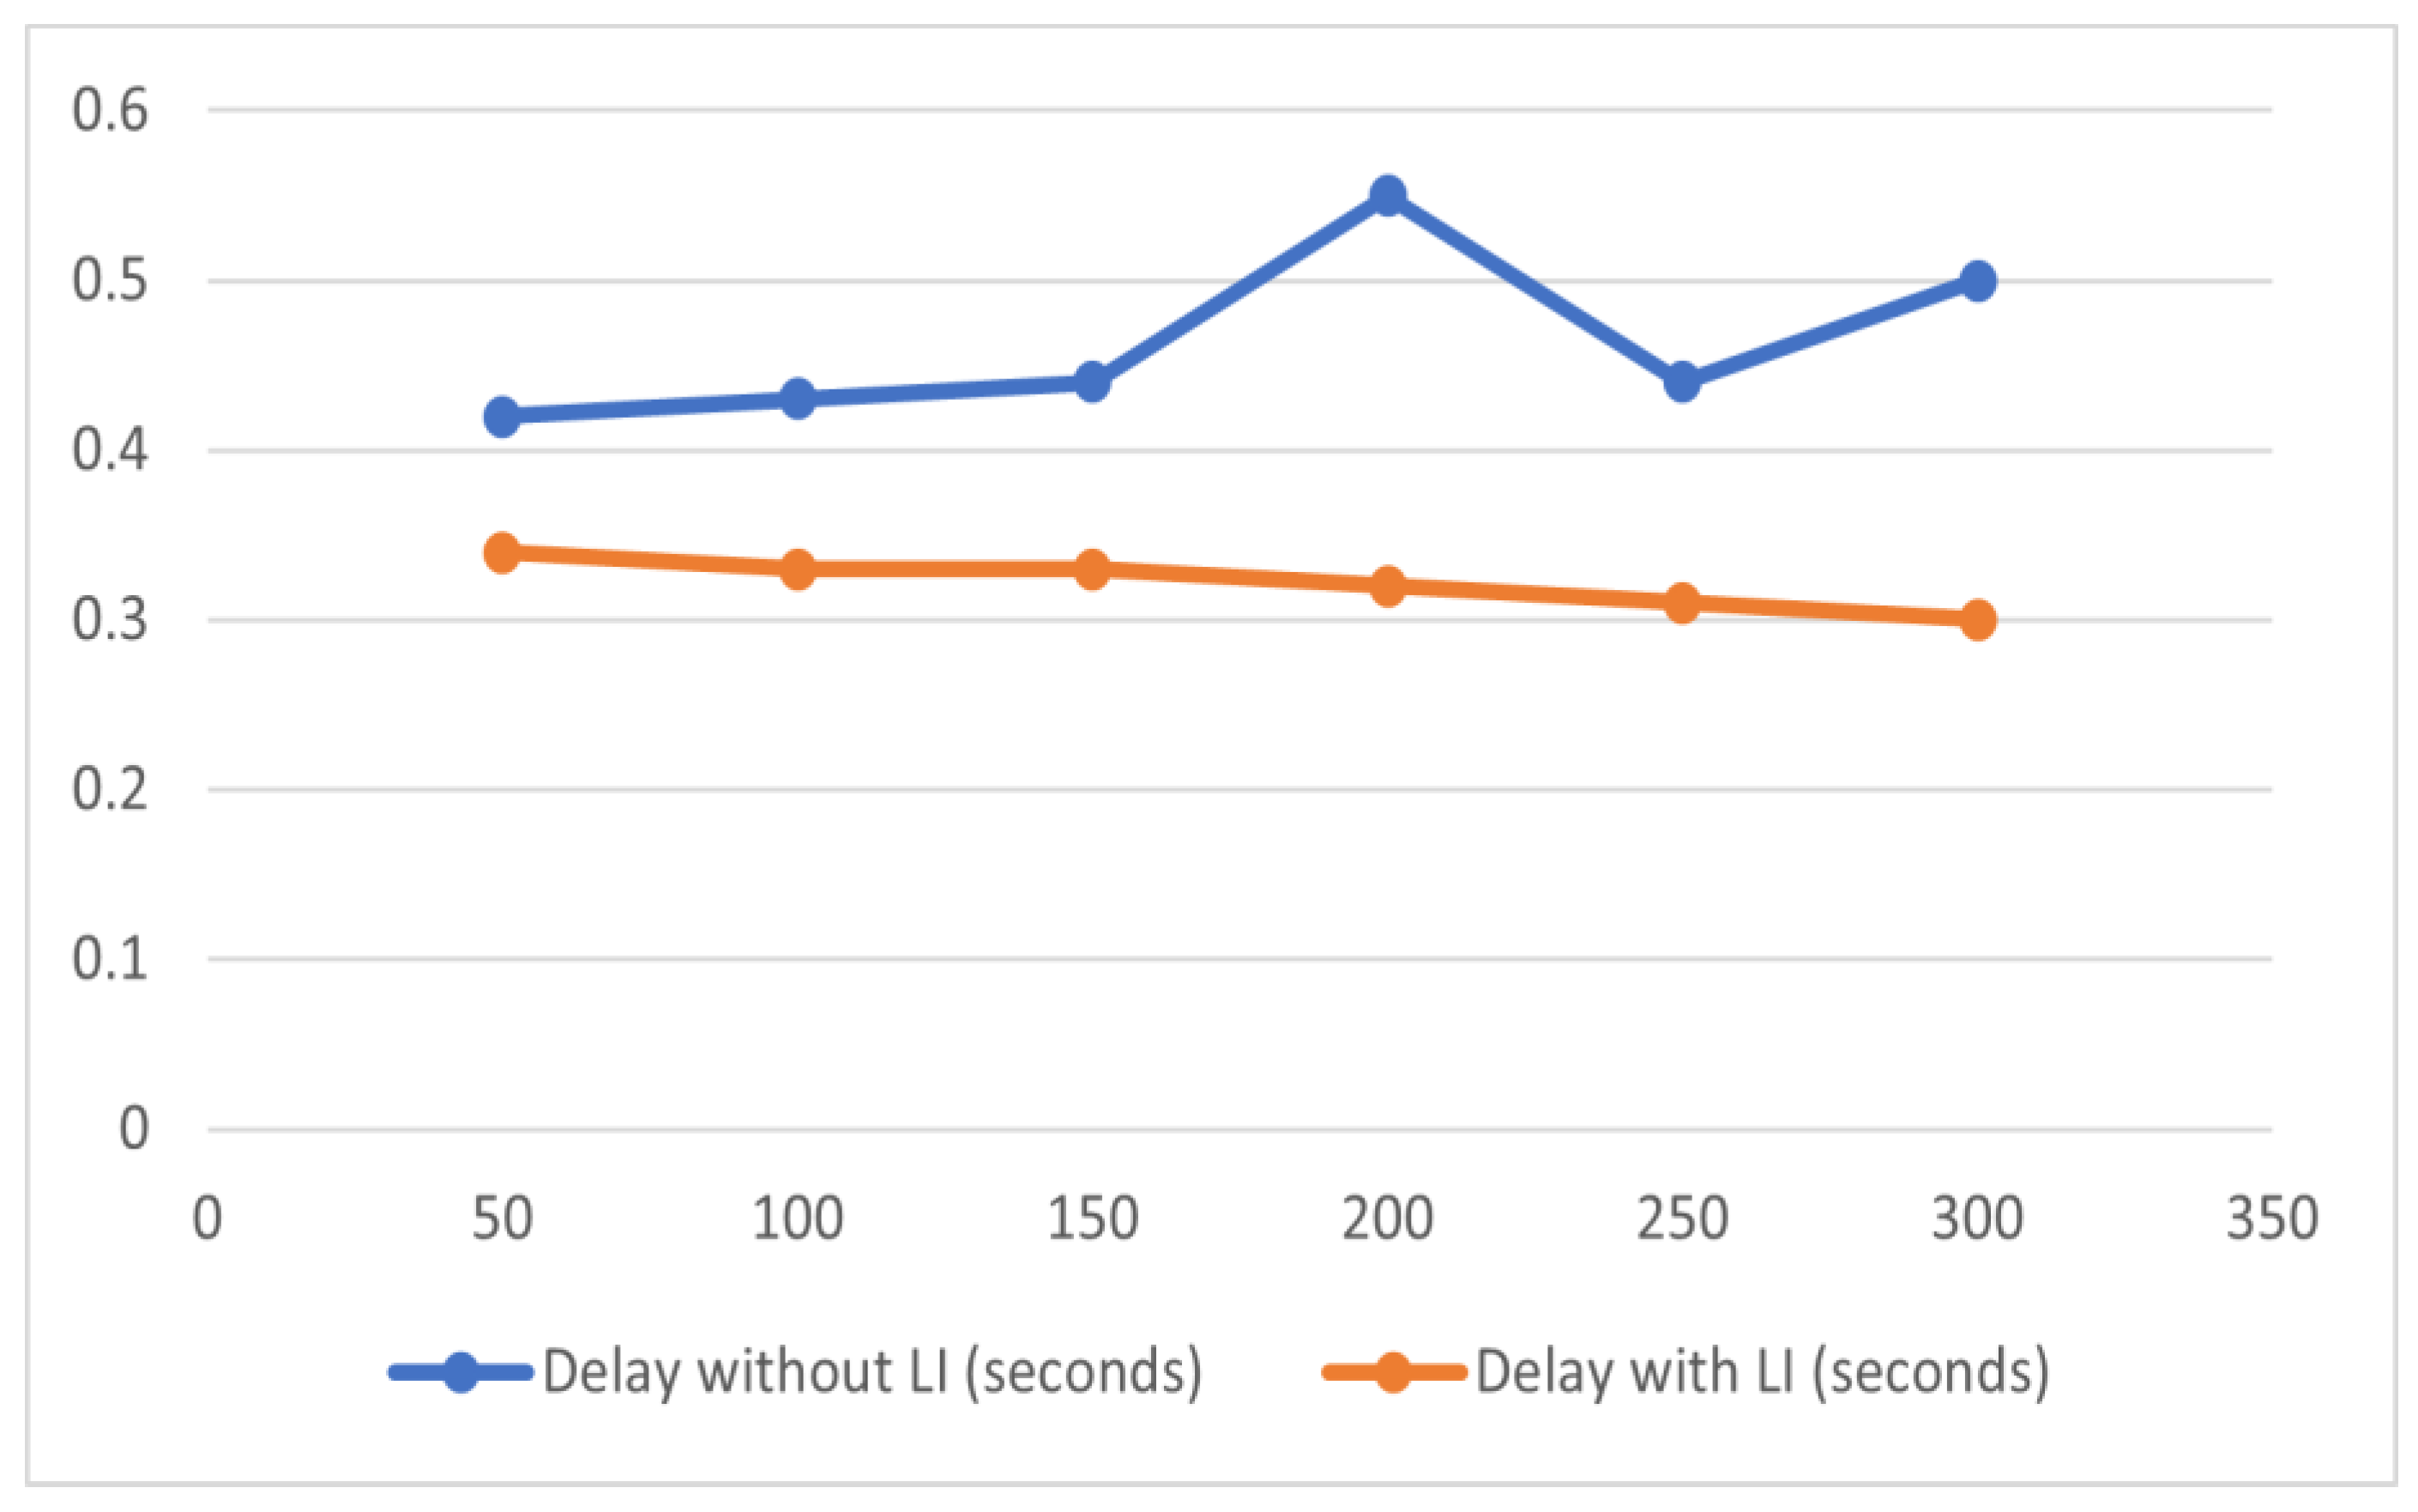
| Iterations | Delay without LI (Seconds) | Delay with LI (Seconds) |
|---|---|---|
| 50 | 0.42 | 0.34 |
| 100 | 0.43 | 0.33 |
| 150 | 0.44 | 0.33 |
| 200 | 0.55 | 0.32 |
| 250 | 0.44 | 0.31 |
| 300 | 0.5 | 0.3 |
Publisher’s Note: MDPI stays neutral with regard to jurisdictional claims in published maps and institutional affiliations. |
© 2022 by the authors. Licensee MDPI, Basel, Switzerland. This article is an open access article distributed under the terms and conditions of the Creative Commons Attribution (CC BY) license (https://creativecommons.org/licenses/by/4.0/).
Share and Cite
Monga, C.; Gupta, D.; Prasad, D.; Juneja, S.; Muhammad, G.; Ali, Z. Sustainable Network by Enhancing Attribute-Based Selection Mechanism Using Lagrange Interpolation. Sustainability 2022, 14, 6082. https://doi.org/10.3390/su14106082
Monga C, Gupta D, Prasad D, Juneja S, Muhammad G, Ali Z. Sustainable Network by Enhancing Attribute-Based Selection Mechanism Using Lagrange Interpolation. Sustainability. 2022; 14(10):6082. https://doi.org/10.3390/su14106082
Chicago/Turabian StyleMonga, Chetna, Deepali Gupta, Devendra Prasad, Sapna Juneja, Ghulam Muhammad, and Zulfiqar Ali. 2022. "Sustainable Network by Enhancing Attribute-Based Selection Mechanism Using Lagrange Interpolation" Sustainability 14, no. 10: 6082. https://doi.org/10.3390/su14106082
APA StyleMonga, C., Gupta, D., Prasad, D., Juneja, S., Muhammad, G., & Ali, Z. (2022). Sustainable Network by Enhancing Attribute-Based Selection Mechanism Using Lagrange Interpolation. Sustainability, 14(10), 6082. https://doi.org/10.3390/su14106082


