Abstract
In view of the nitrogen and phosphorus non-point source pollution caused by paddy field drainage in southern China, two paddy fields in Nanjing and Yuyao cities were selected to study the effect of plant buffer zone–antifouling curtain walls on reducing non-point source pollution. The results showed that the designed plant buffer zone–antifouling curtain wall systems could significantly reduce the concentration of total nitrogen (TN) and total phosphorus (TP) in drainage of the two paddy fields. Compared with paddy field drainage in Nanjing, the interception rate of TN in the plant buffer zone and antifouling curtain wall were 33.0% and 59.3%, respectively; the removal rates of TP were about 18.4% and 40.3%, respectively. In addition, the contents of ammoniacal nitrogen (NH3-N), nitrate nitrogen (NO3-N) and Chemical Oxygen Demand (COD) were also significantly reduced. For the Yuyao experimental area, compared to the paddy field without the soil plant buffer zone (the control), the concentration of each indicator in the discharge water of the paddy fields with the soil plant buffer system operation mode was significantly reduced, the rejection rate of the TP, TN, total dissolved phosphorus (TDP), NO3-N and NH3-N were 64.28%, 70.66%, 83.73%, 65.22% and 80.69%, respectively. In summary, the construction of a plant buffer zone–antifouling curtain wall (soil plant buffer zone) has an obvious effect on the reduction of non-point source pollution in paddy fields, which could improve yield and fertilizer utilization. The plant buffer zone–antifouling curtain wall could be popularized and applied in local areas and southern China.
1. Introduction
China’s rice cultivation area is about 30 million ha, accounting for about 28% of the total area of grain crops in China, and rice water consumption accounts for more than 45% of the total water consumption. Southern China has a large sowing area of rice and a high level of nitrogen fertilizer application, in addition, the rainfall mostly occurs in the form of rainstorms during the main growth period of rice [1,2,3,4,5]. Due to unreasonable irrigation and drainage, a considerable amount of the chemical fertilizer dissolved in the water in the rice fields leaches with lateral or vertical leakage of drainage, causing serious pollution to groundwater, rivers and lakes, as well as the spread of a large number of aquatic diseases [6,7,8,9]. Carrying out research on prevention and control technology of non-point source pollution in southern rice growing areas is an inevitable requirement to protect the ecological agricultural environment of irrigation areas and realize the sustainable development of agriculture. It is of great practical significance to improve the farmland ecological environment and prevent and control agricultural non-point source pollution.
Constructed wetland technology can effectively remove nitrogen, phosphorus and other pollutants from agricultural non-point source pollution, based on the actions of bacteria to remove contaminants from wastewater [10,11,12,13]. In the late 1960s, after the German scholar Kickuth put forward the theory of the root zone method (The Root-Zone Method, or RZM for short), there was an upsurge in research and application of constructed wetlands [14,15,16,17]. Woltemade et al. [18,19,20,21] restored or built wetlands around watersheds in Maryland, Illinois, Iowa and other places in the United States to receive agricultural drainage, so as to improve the water quality of watersheds. The results showed that all wetlands in the experimental area could reduce the concentration of nitrogen and phosphorus, but there were great differences between them. The factors that have the greatest impact on the performance of the wetland are the size of the wetland, the catchment area and the retention time of water in the wetland. When the ratio between the catchment area of the wetland and the watershed is large, or the retention time of water in the wetland is long (at least 1–2 weeks), wetland has a high absorption rate of nutrients. At the same time, the combination of wetland and riparian buffer forest is the best way to improve water quality. There have also been related studies in China. Xiong et al. [22,23,24] designed a new system combining wetland systems with paddy eco-ditches based on the characteristics of the irrigated rice district and evaluated its effects on nutrient losses in the Gaoyou irrigation district in eastern China. The results showed that it significantly decreased N and P losses from paddy fields. Yang et al. [25,26,27] constructed an aquatic vegetable wetland–ecological ditch system (AWDS) to purify the drainage from paddy fields in a field experiment in the Taihu Lake Region of South China, and found that TN and TP concentrations in the outflow of the AWDS significantly decreased compared to those in the inflow. A study in the Ganfu Plain Area indicated that the eco-channel–pond wetland system reduced total nitrogen (TN) and total phosphorus (TP) pollutant levels in rice paddy drainage water, and the pond wetland system showed reductions of 8.6% and 22.9%, respectively [28,29,30,31]. Existing studies show that the plant buffer zone constructed by ecological wetland and ecological ditch has a good effect on reducing pollutants in water. However, the design of the buffer zone should consider many factors, including the size of the buffer zone, vegetation type, management mode, etc. These factors depend on site conditions of the buffer zone including pollution type and load, the ability of the buffer zone to intercept and transform pollutants, and the degree of reducing pollution. The objectives of this study are: (1) To design the plant buffer zone–antifouling curtain wall system for paddy fields in two main rice producing areas, Nanjing and Yuyao city, respectively; (2) To study the reduction effects of the above two systems on no-point source pollution in paddy fields.
2. Materials and Methods
2.1. Overview of the Study Area
The experiments were located in Nanjing, Jiangsu province and Yuyao, Zhejiang province.
The first experiment was carried out in Hengxi town, Jiangning district, Nanjing (30°38′ ~ 32°13′ N, 118°31′ ~ 119°04′ E). The annual evaporation is 1472.5 mm, and the evaporation from July to August in midsummer is significantly higher than that in other seasons. The minimum value of the annual evaporation is in winter, with the maximum evaporation in late July and mid-January. The annual rainfall is 1106.5 mm, the annual average temperature is 15.7 °C, the maximum average humidity is 81%, the maximum wind speed is 19.8 m/s, and the frost-free period is 237 d.
The Yuyao experimental zone is located in the town of Hemudu, in the center/east of Yuyao city and the lower reaches of the Yao River. The terrain is high in the south and low in the north. It is 9.5 km wide from east to west and 10.5 km long from north to south, with a total area of 64.92 square kilometers. It belongs to the north subtropical monsoon climate zone, and the annual average temperature for many years is 16.5 °C. The annual frost-free period is about 228 days. The annual rainfall is between 1263–1987 mm, and the average annual evaporation for many years is about 900–950 mm. The average sunshine for many years is 2061 h, and the annual sunshine rate is 47%. The annual average relative humidity is 80%. The whole territory of Hemudu has fertile land and rich products.
The planting crop was rice, which was cultivated in a greenhouse and transplanted to fields. The transplanting time in the Nanjing experimental area was 16 June 2011. The whole growth period lasted 138 days and was harvested on 30 October. The late rice planted in Yuyao was transplanted on 14 July 2011. The irrigation method is as follows: after transplanting the seedlings, the field surface retained a thin water layer of 5~30 mm and turned green. After turning green, the field surface will not establish an irrigation water layer at each growth stage. In the case of heavy rain, the field surface can store water (except in the late tillering stage), but the water storage should not exceed 70 mm in depth and the water storage duration should not exceed 3 days. Taking the soil moisture of rice root layer as the control index, the irrigation time and irrigation quota were determined.
2.2. Design of Plant Buffer Zone–Antifouling Curtain Wall
Plant buffer zone, ditch plant slope protection and soil plant buffer zone–antifouling curtain wall were set successively from the drainage outlet of the experimental field community. The farmland plant buffer zone of the Nanjing experimental site (Figure 1) was set based on the experimental community as 3 m × 1 m, 12 in total. The ditch plant slope protection was divided into two sections, the first section was 1:0.5, 0.67 m long; the second section was 1:1, 0.85 m long, and the bottom width of the catchment area was 0.70 m; the antifouling curtain wall was 25 m long, 0.6 m high, 1 m wide at the upper bottom and 1.6 m wide at the lower bottom. Two sections A and B are set, the lower bottom of the antifouling curtain wall of section A was padded with about 0.008 m gravel with a thickness of 0.30 m, and the upper part of the gravel was filled with a soil layer of about 0.30 m. The antifouling curtain wall of section B was a full soil structure. The aquatic plant combination of water spinach + celery was adopted.
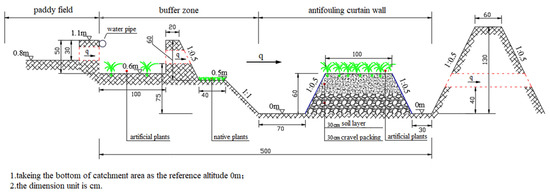
Figure 1.
Design of plant buffer zone–antifouling curtain wall in Nanjing.
At the experimental site in Yuyao city, a soil plant buffer zone was set at the drainage side of the paddy field. The buffer zone is the same width as the paddy field plot, and the length is about 1/10 of the total length of the paddy field. Gate valves were set at the water inlet and outlet disposal, which were connected with the paddy field and drainage ditch through the water level control device (Figure 2 and Figure 3). When selecting the planting plants in the soil plant buffer zone, considering that the local Zizania latifolia planting technology is mature and produces certain economic benefits, the aquatic plants chosen were Zizania latifolia + duckweed, and the plant roots were used to absorb the nutrients in the sewage and degrade the agricultural non-point source pollutants flowing through the ditch to the river. When circumstances permitted, the drainage speed could be appropriately reduced through adjustment of the drainage gate valve, and the duckweed in the drainage ditch could be used to play the role of a plant buffer.
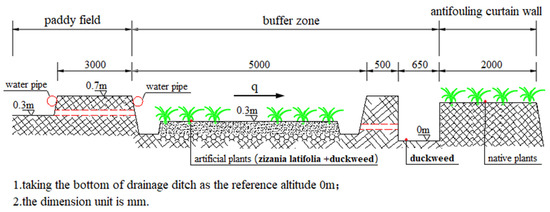
Figure 2.
Design of plant buffer zone–antifouling curtain wall in Yuyao.
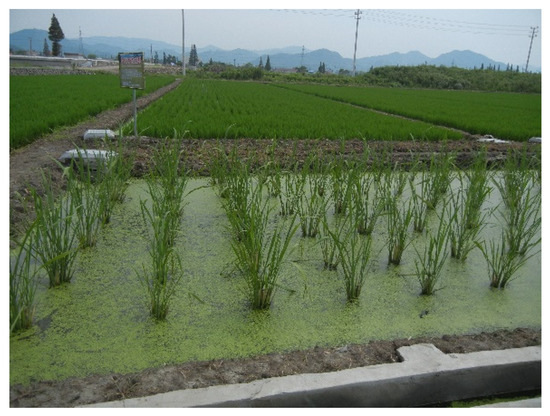
Figure 3.
Buffer belt demonstration belt in Yuyao.
2.3. Measurement of Antifouling Effect of Plant Buffer Zone–Antifouling Curtain Wall
(1) Water sample collection: Set up water weirs (gates) at the field drainage outlet and buffer zone outlet, measuring the amount of water when there was drainage after rainfall, and used 1000 mL plastic bottles in the early, middle and late periods of drainage after the start of drainage. Water sample collection location and frequency is shown in Table 1. Sampling was used to analyze the concentration of each water quality indicator in the runoff in each period, and the average value was taken as the current measurement value of the sampling point. The monitoring sampling points were shown in Figure 4 and Figure 5.

Table 1.
Water sample collection location and frequency.
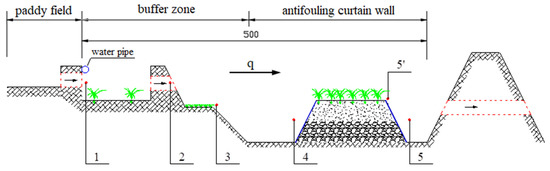
Figure 4.
Schematic diagram of sampling points in plant buffer zone–antifouling curtain wall in Nanjing.
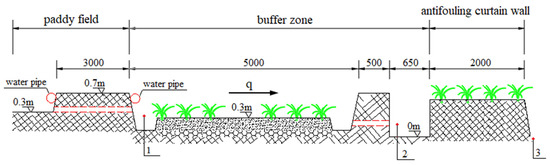
Figure 5.
Schematic diagram of sampling points in plant buffer zone–antifouling curtain wall in Yuyao.
(2) Measurement items and methods. The measurement items of the water samples included: total nitrogen (TN), total phosphorus (TP), total dissolved phosphorus (TDP), nitrate nitrogen (NO3-N), ammoniacal nitrogen (NH3-N), and Chemical Oxygen Demand (COD). The water samples were stored in the refrigerator, refrigerated, and tested and analyzed within 48 h. The determination method of items is shown in Table 2, and the detailed measurement methods referred to were the “Analytical Methods for Water and Wastewater Monitoring” prepared by the State Environmental Protection Administration [32].
Table 2.
Measurement items and methods.
2.4. Date Processing and Analysis
Measured the water quality index values at the outlet of farmland discharge, the outlet of soil plant buffer zone and the outlet of soil antifouling curtain wall after each drainage. Based on the index concentration of farmland discharge at the outlet, calculated the concentration change at the outlet of the soil plant buffer zone and soil anti-pollution curtain wall, and evaluated the interception effect. Excel 2010 was used for data recording and organizing. SPSS26.0 software was used for the analysis of variance, in which the Duncan method was used for multiple comparisons (p = 0.05).
3. Results and Analysis
3.1. Purification Effect of Experimental Demonstration Area in Nanjing
The soil in the experimental area was paddy soil developed from yellow brown soil, with texture and viscosity, organic matter content of 14.209 g/kg, total nitrogen of 1.303 g/kg, alkali hydrolyzable nitrogen of 0.1299 g/kg, total phosphorus of 0.363 g/kg, available phosphorus of 0.0272 g/kg, pH value of 5.87, 0–60 cm soil bulk density of 1.35 g/cm3 and 0–60 cm soil field capacity of 28.0%. The fertilization method adopted the method of base fertilizer + topdressing, in which the fertilization amount for base fertilizer was 375 kg/ha (nitrogen content was 56.25 kg), and the topdressing after returning to green is urea (fertilization amount was 136.5 kg/ha, nitrogen content was 63.3 kg). The tillering fertilizer adopts the same compound fertilizer as the base fertilizer (the fertilization amount was 800 kg/ha, and the nitrogen content was 120 kg).
Table 3 shows the water quality of paddy field drainage water measured in different sections of soil plant buffer zone and soil antifouling curtain wall during rice growth in the Nanjing experimental demonstration area. Since the soil antifouling curtain wall accepted the drainage of different treatments, the test was mainly to observe the average water quality of two series of soil plant buffer belts and the water inlet and outlet of the soil antifouling curtain wall at different times, so as to estimate the contribution of the soil plant buffer belt and soil antifouling curtain wall in reducing various agricultural non-point source pollutants in paddy field drainage at different times. It can be seen from Table 2 that the concentration of TN decreased after passing through the soil plant buffer zone and soil antifouling curtain wall at different times during the growth period of rice. During the period from 5 July to 25 September, the average content of TN was 10.3 mg/L at paddy drainage, and 6.9 mg/L and 4.2 mg/L at the outlet of the soil plant buffer zone and soil antifouling curtain wall. Compared with the drainage outlet of the paddy field, the TN concentration in the soil plant buffer zone and the outlet of the soil antifouling curtain wall was reduced by 3.4 mg/L and 6.1 mg/L on average. The interception rates of total nitrogen were about 33.0% and 59.26%, and the removal effect was very obvious.
Table 3.
Concentration of water quality indicators at different sections of the system.
As shown in Table 3, there was a certain difference in the concentration of total phosphorus between the import and export of soil plant buffer zone and soil antifouling curtain wall. Although there were water losses, such as evaporation and transpiration, the concentration of total phosphorus was also reduced after passing through the soil plant buffer zone and soil antifouling curtain wall. From 5 July to 25 September, the average content of total phosphorus at paddy drainage was 0.52 mg/L, soil plant buffer zone and soil antifouling curtain wall were 0.42 mg/L and 0.37 mg/L, the average concentration decreased by 0.10 mg/L and 0.14 mg/L, and the removal rates of total phosphorus were about 18.4% and 40.3%, respectively.
Chemical oxygen demand is the amount of oxygen consumed during chemical oxidation of substances that can be oxidized in the water body. The greater the COD value, the more serious the water body is polluted. During the period from 5 July to 25 September, the average import COD of paddy drainage was 64.7 mg/L, and the export COD of soil plant buffer zone and soil antifouling curtain wall was 41.4 mg/L and 26.38 mg/L. Compared with the drainage outlet of the paddy field, the average interception rate of soil plant buffer zone and soil antifouling curtain wall was 36.0% and 59.2%.
It can be seen from Table 3 that during the growth period of the paddy, the concentrations of NH3-N and NO3-N after passing through the soil plant buffer zone and soil antifouling curtain wall were also reduced. From 5 July to 25 September, compared to the drainage outlet of the paddy field, the average removal rates of ammonia nitrogen and nitrate nitrogen after passing through the soil plant buffer zone and soil antifouling curtain wall were 23.8% and 51.9%, and the average removal rates of nitrate nitrogen were 29.7% and 61.2%. The removal effect was also very obvious.
The above results fully show that in the southern rice field water cycle self-purification system, the drainage water quality of the paddy field is purified and water quality is significantly improved after passing through the combination of soil plant buffer belt and soil antifouling curtain wall.
3.2. Purification Effect of Soil Plant Buffer Zone in Yuyao Experimental Demonstration Area
The soil in the test area was clay loam. The fertilization method was the same as that in the Nanjing experimental area. Table 4 shows the analysis and determination results of water quality index concentration in discharged water under different operation modes. Under the two operation modes, there was a significant difference in each water quality index of farmland discharge water. Compared with the operation without soil plant buffer belt in farmland (the control), the concentration of various indicators in the discharged water of the paddy field under the operation mode of the soil plant buffer system was significantly reduced, in which the concentration of TP was reduced by 0.27 mg/L (reduction range was 64.28%), the concentration of TDP was reduced by 0.211 mg/L (reduction range was 83.73%), and the concentration of TN was reduced by 8.89 mg/L (reduction range was 70.66%). The average concentration of ammonia nitrogen decreased by 6.06 mg/l, with a reduction range of 80.69%, and the average concentration of nitrate nitrogen decreased by 1.80 mg/L, with a reduction range of 65.22%. The effects of the constructed soil plant buffer zone on reducing pollutants are very obvious.
Table 4.
Concentration of water quality indicators in drainage under different operation modes.
4. Conclusions
The research results showed that the establishment of ecological plant anti-pollution measures can effectively reduce agricultural non-point source pollution. Compared to not setting any interception measures, setting soil plant buffer zones could significantly reduce nitrogen and phosphorus concentration in paddy field drainage (the removal rates of total nitrogen, ammonia nitrogen, nitrate nitrogen and total phosphorus were 33.0%, 23.8%, 29.7%, 18.4% in Nanjing and 70.66%, 80.69%, 65.22%, 64.28% in Yuyao) and also reduced the COD content. On the basis of the plant buffer zone, the soil anti-fouling curtain wall was installed in series, and the pollution reduction effect was more significant (the removal rates of total nitrogen, ammonia nitrogen, nitrate nitrogen and total phosphorus in the Nanjing test area reached 59.2%, 51.9%, 61.2% and 40.3%). It can be seen that, when conditions permit, the construction area of the plant buffer zone-antifouling curtain wall can be enlarged, which can expand the reduction effect of non-point source pollutants in paddy fields.
Peifang Wang et al. [33] found that since nitrogen and phosphorus could be removed by physical filtration, matrix adsorption, microbial metabolism, and plant absorption and utilization of interception facilities, the removal rate of pollutants in farmland wetlands was closely related to the form and material of interception facilities [34,35,36]. In this study, the removal rate of ammonia nitrogen, nitrate nitrogen and total phosphorus by the antifouling curtain wall was 4.3%, 1.8% and 3.5% higher on average than that of the plant buffer zone; the removal rate of total nitrogen by the plant buffer zone was higher than that of the plant buffer zone. The average height of dirty curtain wall was 6.8%. The decontamination effect of the plant buffer zone in the Yuyao experimental area was different from that in the Nanjing experimental area, which may be related to the different types of plants and different growth stages of plants to absorb pollutants and microbial degradation. Further research was needed on the purification and interception mechanisms of pollutants in runoff water by different plants and different growth stages.
In addition, scientific management was very important to maintain the decontamination effect of the plant buffer zone-anti-fouling curtain wall. Wu Xinyu et al. [37] found that the removal rates of TN, NH4+-N, TP and PO43--P in the constructed wetland system were 5.4%, 5.6%, 6.6% and 9.9% higher, respectively, than those of the non-constructed wetland. This was due to unscientific management and untimely harvesting of plants leading to excessive increases in biomass, which causes problems such as the blockage of drainage channels, affecting hydraulic transmission, and reducing the performance of wetland systems [38,39]. It was necessary to scientifically design many elements, such as plant types and management methods of plant buffer zone-anti-fouling curtain walls in combination with the law of plant growth, so as to maximize the effect of pollution reduction.
Author Contributions
X.S. conceived and designed the experiment idea; J.T. and J.C. performed the experiments; B.J. and X.L. analyzed the data and wrote the paper. All authors have read and agreed to the published version of the manuscript.
Funding
This work was funded by the Key Project of Water Conservancy Science and Technology Plan of Zhejiang Province (Grant No. RB2114), Fundamental Research Funds of Zhejiang Tongji Vocational College of Science and Technology (Grant No. FRF21PY003), Special Funding Project for Public Welfare Industry (Water Conservancy) Scientific Research (Grant No. 201001040).
Institutional Review Board Statement
Not applicable.
Informed Consent Statement
Not applicable.
Data Availability Statement
Not applicable.
Conflicts of Interest
The authors declare no conflict of interest.
References
- Zhang, S.; Lu, J.; Zhu, Y.; Fang, Y.; Cong, R.; Li, X.; Ren, T. Rapeseed as a previous crop reduces rice N fertilizer input by improving soil fertility. Field Crop. Res. 2022, 281, 108487. [Google Scholar] [CrossRef]
- Yang, X.; Vancov, T.; Peñuelas, J.; Sardans, J.; Singla, A.; Alrefaei, A.F.; Song, X.; Fang, Y.; Wang, W. Optimal biochar application rates for mitigating global warming and increasing rice yield in a subtropical paddy field. Exp. Agric. 2022, 57, 283–299. [Google Scholar] [CrossRef]
- Liang, S.; Wu, W.; Sun, J.; Li, Z.; Sun, X.; Chen, H.; Chen, S.; Fan, L.; You, L.; Yang, P. Climate-mediated dynamics of the northern limit of paddy rice in China. Environ. Res. Lett. 2021, 16, 064008. [Google Scholar] [CrossRef]
- Xia, L.L.; Li, X.B.; Ma, Q.Q.; Lam, S.K.; Wolf, B.; Kiese, R.; Butterbach-Bahl, K.; Chen, D.; Li, Z.; Yan, X. Simultaneous quantification of N-2, NH3 and N2O emissions from a flooded paddy field under different N fertilization regimes. Glob. Change Biol. 2020, 26, 2292–2303. [Google Scholar] [CrossRef] [PubMed]
- Jiang, Y.; Qian, H.Y.; Wang, L.; Feng, J.; Huang, S.; Hungate, B.A.; van Kessel, C.; Horwath, W.R.; Zhang, X.; Qin, X.; et al. Limited potential of harvest index improvement to reduce methane emissions from rice pad-dies. Glob. Change Biol. 2019, 25, 686. [Google Scholar] [CrossRef]
- Darzi-Naftchali, A.; Mokhtassi-Bidgoli, A. Saving environment through improving nutrient use efficiency under intensive use of agrochemicals in paddy fields. Sci. Total Environ. 2000, 822, 153487. [Google Scholar] [CrossRef]
- Wei, J.; Guo, S.F.; Zhai, L.M.; Liu, H.; Sun, B.; Hua, L.; Wang, H.; Yang, B. Effects of Combined Application of Organic Manure and Different Levels of Chemical Fertiliz-ers on Nitrogen Use Efficiency and Nitrogen Loss Risk in Rice Growing System. Soils 2018, 50, 874–880. [Google Scholar]
- Choudhury, A.T.M.A.; Kennedy, I.R. Nitrogen Fertilizer Losses from Rice Soils and Control of Environmental Pollution Problems. Commun. Soil Sci. Plant Anal. 2005, 36, 1625–1639. [Google Scholar] [CrossRef]
- Yang, S.; Peng, S.; Xu, J.; He, Y.; Wang, Y. Effects of water saving irrigation and controlled release nitrogen fertilizer managements on nitrogen losses from paddy fields. Paddy Water Environ. 2015, 13, 71–80. [Google Scholar] [CrossRef]
- Wang, J.; Yao, X.; Jia, Z.; Zhu, L.; Zheng, P.; Kartal, B.; Hu, B. Nitrogen input promotes denitrifying methanotrophs’ abundance and contribution to methane emission reduction in coastal wetland and paddy soil. Environ. Pollut. 2022, 302, 119090. [Google Scholar] [CrossRef]
- Wang, W.; Zhang, Y.; Li, M.; Wei, X.; Wang, Y.; Liu, L.; Wang, H.; Shen, S. Operation mechanism of constructed wetland-microbial fuel cells for wastewater treatment and electricity generation: A review. Bioresour. Technol. 2020, 314, 123808. [Google Scholar] [CrossRef] [PubMed]
- Doherty, L.; Zhao, Y.; Zhao, X.; Hu, Y.; Hao, X.; Xu, L.; Liu, R. A review of a recently emerged technology: Constructed wetland—Microbial fuel cells. Water Res. 2015, 85, 38–45. [Google Scholar] [CrossRef] [PubMed]
- Lu, L.; Xing, D.; Ren, Z.J. Microbial community structure accompanied with electricity production in a constructed wetland plant microbial fuel cell. Bioresour. Technol. 2015, 195, 115–121. [Google Scholar] [CrossRef] [PubMed]
- Doan, Q.T.; Nguyen, T.M.L.; Quach, T.T.T.; Tran, A.P.; Nguyen, C.D. Assessment of water quality in coastal estuaries under the impact of an industrial zone in Hai Phong, Vietnam. Phys. Chem. Earth 2019, 113, 100–114. [Google Scholar] [CrossRef]
- Chen, Z.; Cuervo, D.P.; Müller, J.A.; Wiessner, A.; Köser, H.; Vymazal, J.; Kästner, M.; Kuschk, P. Hydroponic root mats for wastewater treatment—A review. Environ. Sci. Pollut. Res. 2016, 23, 15911–15928. [Google Scholar] [CrossRef]
- Munch, C.; Kuschk, P.; Roske, I. Root stimulated nitrogen removal: Only a local effect or important for water treatment? Water Sci. Technol. 2005, 51, 185–192. [Google Scholar] [CrossRef] [PubMed]
- Rivera, F.; Warren, A.; Curds, C.R.; Robles, E.; Gutierrez, A.; Gallegos, E.; Calderón, A. The application of the root zone method for the treatment and reuse of high-strength abattoir waste in Mexico. Water Sci. Technol. 1997, 35, 271–278. [Google Scholar] [CrossRef]
- Woltemade, C.J. Ability of restored wetlands to reduce nitrogen and phosphorus concentrations in agricultural drainage water. J. Soil Water Conserv. 2000, 55, 303–309. [Google Scholar]
- Ling, Z.; Li, J. Study on removal efficiency of nitrogen and phosphorus from agricultural wastewater by subsurface flow constructed wetland. Adv. Energy Proc. 2018, 1944, 020069. [Google Scholar] [CrossRef]
- Zhou, X.W.; Shen, M.X.; Jin, M.J.; Wang, H.; Shi, L.; Lu, C.; Tao, Y. Purification Effect on Aquaculture Wastewater by Multi-series Surface Flow Constructed Wetland. Wetl. Sci. 2017, 15, 774–780. [Google Scholar]
- Fisher, J.; Acreman, M.C. Wetland nutrient removal: A review of the evidence. Hydrol. Earth Syst. Sci. 2004, 8, 673–685. [Google Scholar] [CrossRef] [Green Version]
- Xiong, Y.; Peng, S.; Luo, Y.; Xu, J.; Yang, S. A paddy eco-ditch and wetland system to reduce non-point source pollution from rice-based production system while maintaining water use efficiency. Environ. Sci. Pollut. Res. 2015, 22, 4406–4417. [Google Scholar] [CrossRef] [PubMed]
- Sun, H.; Zhang, H.; Yu, Z.; Wu, J.; Jiang, P.; Yuan, X.; Shi, W. Combination system of full-scale constructed wetlands and wetland paddy fields to remove nitrogen and phosphorus from rural unregulated non-point sources. Environ. Geochem. Health 2013, 35, 801–809. [Google Scholar] [CrossRef] [PubMed]
- Tang, W.; Zhang, W.; Zhao, Y.; Wang, Y.; Shan, B. Nitrogen removal from polluted river water in a novel ditch–wetland–pond system. Ecol. Eng. 2013, 60, 135–139. [Google Scholar] [CrossRef]
- Yang, S.; Xu, J.; Zhang, J.; Wang, Y.; Peng, S. Reduction of Non-Point Source Pollution from Paddy Fields through Controlled Drainage in an Aquatic Vegetable Wetland-Ecological Ditch System. Irrig. Drain. 2016, 65, 734–740. [Google Scholar] [CrossRef]
- Liu, F.; Xiao, R.; Wang, Y.; Li, Y.; Zhang, S.; Luo, Q.; Wu, J. Effect of a novel constructed drainage ditch on the phosphorus sorption capacity of ditch soils in an agricultural headwater catchment in subtropical central China. Ecol. Eng. 2013, 58, 69–76. [Google Scholar] [CrossRef]
- Takanose, Y.; Ishida, S.; Kudo, N.; Kamitani, T. Effects of tillage and irrigation on the occurrence and establishment of native wetland plant species in fallow paddy fields. Paddy Water Environ. 2011, 11, 45–58. [Google Scholar] [CrossRef]
- Cai, S.; Shi, H.; Pan, X.; Liu, F.; Cui, Y.; Xie, H. Integrating Ecological Restoration of Agricultural Non-Point Source Pollution in Poyang Lake Basin in China. Water 2017, 9, 745. [Google Scholar] [CrossRef] [Green Version]
- Zhao, P.; Hu, Y.F.; Lin, J.Y. Reduction rate of nitrogen and phosphorus non-point source pollution under different riparian buffer restoring strategies. China Environ. Sci. 2015, 35, 2160–2170. [Google Scholar]
- Liu, F.X.; Song, X.F.; Zou, G.Y.; Fu, Z.; Liu, Y.; Xue, L.; Yang, L. Reduce-Retain-Reuse-Restore Technology for the Controlling the Agricultural Non-point Source Pollution in Countryside in China:Eco-Restoration Technology. J. Agro-Environ. Sci. 2013, 32, 2105–2111. [Google Scholar]
- Tao, K.; Quan, X.C.; Yang, Z.F.; Guo, W.; Ma, N. On the integrated manipulation strategy for Baiyangdian Lake restoration of water conserva-tion and pollution-source purification. J. Saf. Environ. 2011, 11, 126–132. [Google Scholar]
- State Environmental Protection Administration. Analytical Methods for Water and Wastewater Monitoring, 4th ed.; China Environmental Science Press: Beijing, China, 2002; pp. 243–348.
- Wang, P.F.; Lou, M.Y.; Qian, J.; Hu, B. Analysis of purification effect and mechanism of pollutant by the farmland drainage wet-land. Water Resour. Prot. 2020, 36, 1–10. [Google Scholar]
- Zhang, Y.; Li, Y.; Wang, J.; Wang, X.; Liu, Y.; Wang, S.; Kong, F. Interactions of chlorpyrifos degradation and Cd removal in iron-carbon-based constructed wetlands for treating synthetic farmland wastewater. J. Environ. Manag. 2021, 299, 113559. [Google Scholar] [CrossRef] [PubMed]
- He, S.; Li, Y.; Yang, W.; Huang, J.; Hou, K.; Zhang, L.; Song, H.; Yang, L.; Tian, C.; Rong, X.; et al. A comparison of the mechanisms and performances of Acorus calamus, Pontederia cordata and Alisma plantagoaquatica in removing nitrogen from farmland wastewater. Bioresour. Technol. 2021, 332, 125105. [Google Scholar] [CrossRef] [PubMed]
- Yan, L.; Xie, C.; Liang, A.; Jiang, R.; Che, S. Comprehensive Management of Rural Water Pollution in Polder Wetland: A Case Study of the Chenhai Wei Polder Wetland in the Taihu Basin of China. Wetlands 2021, 41, 32. [Google Scholar] [CrossRef]
- Wu, X.Y.; Wang, X.N.; Guo, J.; Zhao, Y.Q. Effects of plants harvesting in constructed wetland on pollutants removal and their utilization status. In Proceedings of the 2021 Annual Scientific and Technical Conference of the Chinese Society of Environmental Sci-ence—Environmental Engineering Technology Innovation and Application Session (I), Tianjin, China, 20 October 2021; pp. 113–119. [Google Scholar] [CrossRef]
- Barya, M.P.; Kumar, A.; Thakur, T.K. Utilization of constructed wetland for the removal of heavy metal through fly ash bricks manufactured using harvested plant biomass. Ecohydrology 2022. [Google Scholar] [CrossRef]
- Wu, S.; Zhou, Z.; Hua, J.; Yin, Y.; Xue, J. Study on the N Purification of Eutrophic Water by Floating Plant-sediment-microbial System. J. Ecol. Rural. Environ. 2021, 37, 1341–1351. [Google Scholar]
Publisher’s Note: MDPI stays neutral with regard to jurisdictional claims in published maps and institutional affiliations. |
© 2022 by the authors. Licensee MDPI, Basel, Switzerland. This article is an open access article distributed under the terms and conditions of the Creative Commons Attribution (CC BY) license (https://creativecommons.org/licenses/by/4.0/).