1. Introduction
Corporate Social Responsibility (CSR) is a concept that has gained steam around the world. Moreover, globalization has opened the door to a variety of challenges for governments all over the world. This has resulted in a growing visibility and corporate citizenship, as well as the opening of the door for an abstraction known as Corporate Social Responsibility, which requires companies to play a part in the advancement of society. CSR has become unavoidable in today’s environment, and it plays a critical part in the efficacy of corporate branding.
Corporate branding has been a critical concern for many businesses in recent years. Each organization’s most valuable asset is its brand, which is evaluated in terms of Brand Equity. Companies can better their Brand Equity by marketing their products in more unique and easily recognizable ways, charging higher prices and maintaining high quality standards. Branding is more than just assigning a product a name; it also allows businesses to differentiate themselves from their competition. A brand is a firm’s mirror, since it portrays every action that the company engages in. Companies’ efforts engage consumers in developing a picture of a brand, which leads to Brand Building [
1].
Branding aids in the formation of a good image of the organization, allowing for effective customer relationship management, which is a critical predictor of brand equity [
2]. Customers in today’s world are concerned about more than just the cost and quality of the products; they are also concerned about their environment and the society in which they live, and want to be a part of the program that benefits the globe (Battistoni et al. [
3]). As a result, modern firms have realized that CSR builds brand equity and that it is now as vital as the manufacturing of their goods. In light of this, the purpose of this study is to investigate the role of corporate social responsibility in the development of firm-based brand equity (FBBE) [
4]. Furthermore, the current research makes recommendations to businesses on how to include CSR into their overall company plan [
5].
2. Review of Literature and Gap Identification
In modern times, CSR has become one of the most talked about subjects in business and politics. To ensure the sustainability and growth of business, CSR has become indispensable in today’s capitalist economy. Against such a backdrop, this section reviews the available literature on CSR. It also attempts to derive some hypotheses from the review of literature to be tested in order to fulfil the objectives of this study.
Shafi and Madhavaiah [
6] opined that integrated Marketing Communication plays a vital role in building Brand Equity. According to them, if companies will adopt appropriate integrated Marketing Communication components and use them judiciously in the right place, this will increase Brand Equity. Building and accessing an energetic and influential Brand is one of the important priorities of the companies, as it offers them many privileges and status.
Brunello [
7] examined the essence of ‘Marketing Communication’ between customers and businesses. In today’s worldwide culture, the usage of an ‘Integrated Marketing Communication Strategy’ (IMC) is critical in persuading people to purchase a specific organization’s products or services. To be sure, IMC serves a useful purpose in that it contributes to the establishment of an organization’s ‘Brand Equity.’ The researcher has examined the notion of ‘Brand Equity’ and has arrived at a conclusion that there is a deep-rooted relationship between IMC and ‘Brand Equity’.
Alexander et al. [
8] discovered the effect of CSR on building future brands in an organization. Some communities of beneficiaries have been segmented into focus groups for discussions on the ramifications of CSR. The discussions led to three main ramifications for CSR, namely stakeholder’s expectations, collaborations, research and development, which eventually led to the discovery of a good effect.
Dapi and Phiri [
9], in their study, described corporate social responsibility (CSR) as an organizational tool whose successful implementation can be used to gain brand loyalty. The benefits of CSR to society have been well documented to a great extent. However, there is very little information on the benefits of it to the actual corporations that practice it. The findings of the study concluded that most consumers did not correctly understand the concept of CSR and believed that companies should be socially responsible. However, the major takeaway of the study was regarding the awareness of a company’s CSR initiatives as it could lead to better ‘Brand Image’ and ‘Brand Loyalty’. This study recommends that companies should take a more proactive rather than reactive approach to social and environmental problems.
Esmaeilpour and Barjoei [
10] examined that corporate social responsibility is an important issue for most organizations and their managers. One of the most valuable assets of any company is its brand. The brand equity is an asset which in its light the company can obtain many benefits and maintains the value of the company. The authors conducted this study to analyze the influence of corporate social responsibility and Brand Image on ‘Brand Equity’. The results revealed that corporate social responsibility has a significant positive impact on ‘Brand Image’ and ‘Brand Equity’. Furthermore, ‘Brand Image’ positively influences ‘Brand Equity’. Corporate social responsibility efforts are more strategically related to product differentiation and brand differentiation. This relationship is significant, especially in the case of competitive markets and differentiated products.
Jyothsna et al. [
11] highlighted the significance of building a brand in their research. The researchers underscored ‘brand’ as an organization’s most valuable asset. The findings of the research signified that “high levels of ‘Brand Equity’ lead to higher purchasing preferences and intentions”. Moreover, in their study, the ‘Brand Equity’ measures such as ‘Brand Awareness’, ‘Perceived Quality’, ‘Price’ and ‘Brand Association’, accompanied with ‘Brand Identity’ measures such as culture, self-image and personality, are taken into consideration. When customers perceive a high brand value, they are ready to pay higher prices and defend such a brand on the grounds of excellent product quality (Zhang et al. [
12]). The self-image constitutes the attributions that customers make. The personality traits, on the other hand, are related to the characteristics of an individual. For building robust customer loyalty, it is essential to formulate a high quality perceived by the customer. This is because the ‘Brand Loyalty’ and ‘Perceived Quality’ are intertwined (Mohammed Arshad Khan). The researchers asserted that “strong brands have a substantial ‘Brand Equity’, to which customers associate the brand to be strong”.
Singh and Verma [
13] in their study, observed that corporate social responsibility indeed affects brand performance. Their findings indicate that a company’s CSR activities have a positive effect on the value of its brand. The study’s findings will encourage businesses to shift their management techniques away from the old profit-driven strategy and toward a more socially responsible approach to long-term corporate performance.
Caracuel and Guerrero-Villegas [
14] revealed that advanced social activities and management techniques can help businesses improve their brands. These companies frequently establish their operations in developing countries to take advantage of environmental and social standards while also lowering their operational expenses. Corporations, on the other hand, can use corporate social responsibility (CSR) efforts to directly influence the development of those nations. The findings show that companies operating in underdeveloped regions can improve their corporate reputation by implementing CSR efforts that fulfil the expectations of certain stakeholders regarding the firm’s actions in these locations (Ali et al. [
15]). Furthermore, the authors contend that Multinational Enterprises (MNEs) with operations in many regions enhance the impact of corporate social performance on brand equity.
Wisdom et al. [
16], in their study, found that CSR is inevitably an important issue for business agents across the globe because attention is paid repeatedly to all components of a business. Furthermore, in expanding economies, the number of companies that take part in CSR intentionally (for example, support relationships, natural relationships, ecological and social relations or reports on corporate social obligations) is underway expansion. They suggested that investment in CSR will benefit the shareholders and promote an effective overall performance in phases of funding in the company, leading to a better performance of the company. They came to the conclusion that CSR practices should be linked to organizational processes of value generation, or they should be developed only as a tool to improve overall performance.
Salehzadeh et al. [
17] said that corporate social responsibility has a strong impact on brand image since participation in CSR activities generates a positive reputation and improves brand image. The findings of the study conclude that the development of a brand requires a long-term effort, but its destruction can take place quickly due to a CSR scandal. Therefore, for improving the ‘Brand Image’, as well as for enhancing ‘Brand Equity’, it is essential for companies to include CSR activities in their business practices.
Yaw Simpson and Aprim [
18] analyzed the various CSR practices to attract potential workers in developing economies. The outcomes of the research exhibit a deficient degree of awareness of CSR. Respondents recognized that elements of an organization’s CSR practice, be they financial, social or environmental, had a vital role in their final preference for a particular business enterprise (employer). Besides, the disclosure of CSR practices by an organization is relevant in their choice of an employer. The findings suggest the need for organizations to take cognizance of the growing interest of prospective employees in working for organizations that engage in CSR activities and disclosures.
Abdul Azid and Tahir [
19] suggested that CSR, one of the crucial factors for an organization, is here to stay in the commercial game. Numerous CSR activities can help a business in achieving its organizational objectives as well as assist in the furtherance of the business enterprise. The popularity of a business enterprise is based on its relationship with employees, consumers, suppliers and the community in which it functions. These are several stakeholders that take part in CSR activities. CSR may now not be fashionable, but it is nevertheless an essential aspect for better performance and requires devoted leaders.
Mahmood and Bashir [
20] concluded that brand reputation is a significant predictor of brand equity and its predictive power is boosted in the presence of CSR activities. It was also ascertained that CSR initiatives related to ethics, the economy and philanthropy expedite the process of conversion from brand reputation to brand equity. The findings of the study indicated that the most effective dimensions are philanthropic, ethical, economic and legal, respectively. All dimensions of CSR except the legal aspect positively moderated the relationship to form brand equity. It could be construed that customers of McDonald’s and KFC are not abreast of their legal activities related to CSR. Therefore, it is essential to channelize fast-food’s marketing programs to publicize legal aspects through in-store bulletins and websites. On the other hand, marketers should devise plans and formulate strategies by considering all significant dimensions of CSR.
Wang et al. [
1] concluded that Brand Credibility, Brand Equity and Brand Reputation serve as powerful mediators. Brand Credibility mediates the relationship between CSR perceptions and Purchase Intention fully. When CSR initiatives and messages are communicated properly, customers believe the promises of the company and consider purchasing its products. Brand Credibility also mediates the relationship between CSR perceptions and BR partially. When customers observe CSR activities, they are far more likely to believe that the company is reliable and trustworthy, which improves the reputation of its brand. As far as Brand Equity is concerned, it was found that it acts as a powerful mediator that influences the path from CSR perceptions to PI directly, as well as the path from CSR perceptions to BR partially. CSR can contribute to the formation of an ethical, sustainable and reliable image, therefore improving perceived brand loyalty. Moreover, communicating CSR activities well can raise customer awareness. When a company succeeds in building a sustainable BE, it can maintain a positive reputation and encourage customers to purchase its products.
On the basis of the aforesaid discussed extensive literature review, we can say that a few research studies have been undertaken so far to examine the perception of executives towards their respective companies CSR initiatives. A close look at the review of the literature indicates a clear research gap. Thus, the present work is an endeavor by the researchers to determine the impact of CSR activities implemented by companies on their Brand Equity. It is obvious that there are many studies available on CSR and its impact on brand equity in the context of various regions, but there are hardly any studies that have been undertaken to analyze the interface between CSR and Firm-based Brand Equity with the moderating effect of Marketing Communication and Brand Identity particularly in the context of Delhi-NCR, India.
3. Conceptual Model of the Study
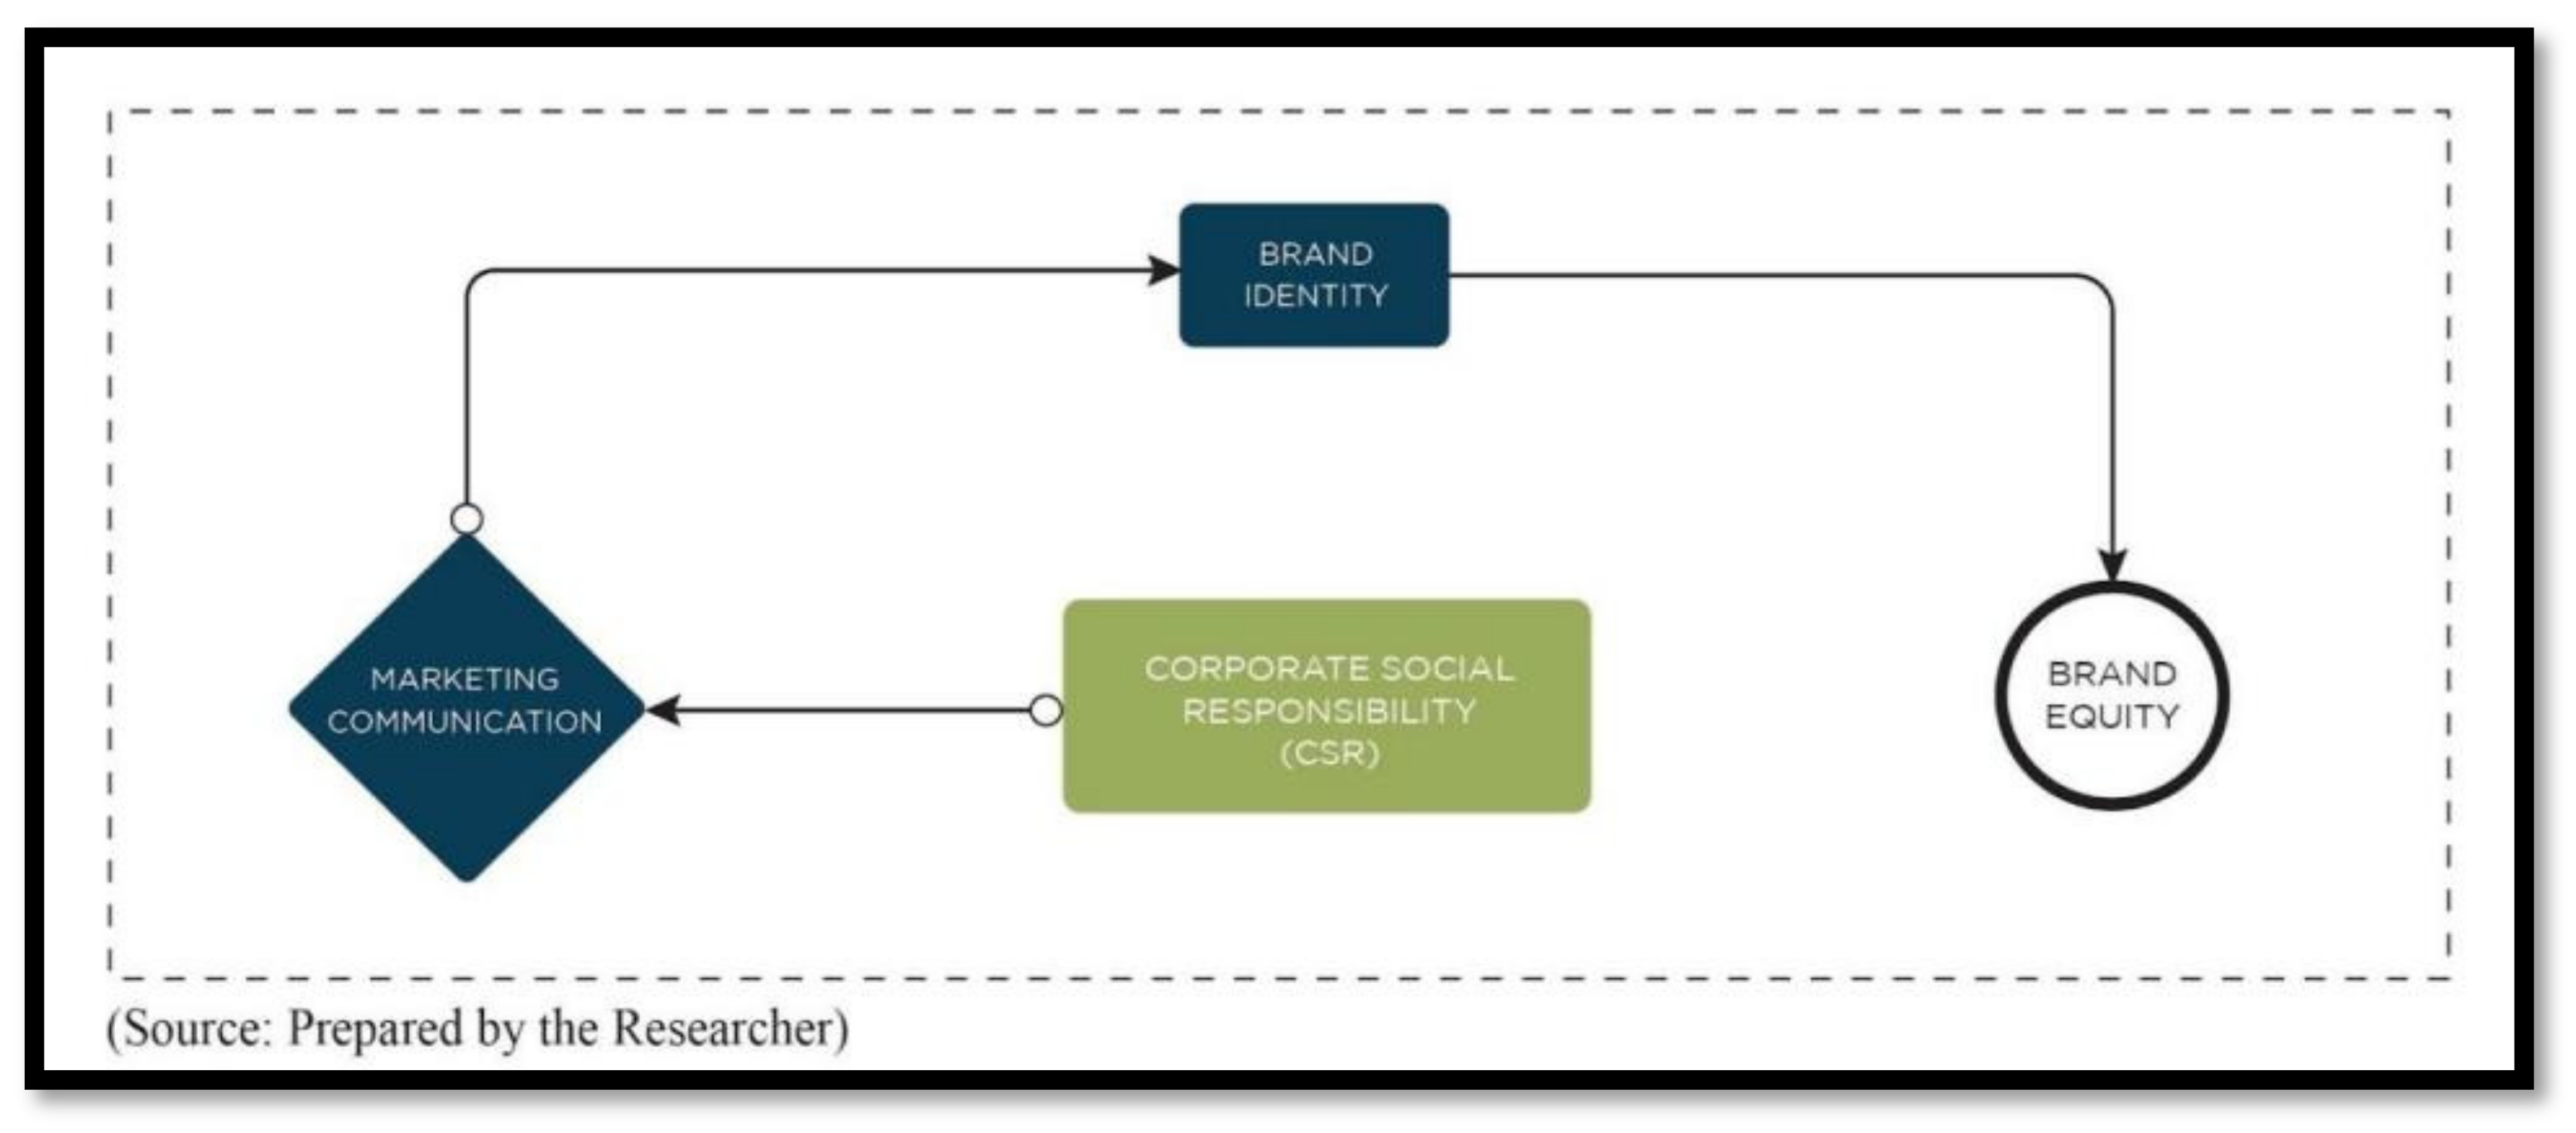
The conceptual model used in the study articulates the relationship between Corporate Social Responsibility and Brand Equity, through the perspectives of companies. Companies promote CSR activities through various Marketing communication techniques to make customers aware of their brands at large. CSR activities. when communicated effectively, enhance Corporate Brand Identity and reputation, leading to Firm-Based Brand Equity. No direct relation as such is expressed in between CSR and Brand Equity. Instead, the process of how an independent variable affects the dependent variable is depicted in the figure given below. The below
Figure 1 of conceptual model depicts that there is only one independent variable, namely Corporate Social Responsibility, and three dependent variables, i.e., Marketing Communication, Brand Identity and Brand Equity.
The overall brand building is influenced by Corporate Social Responsibility (CSR). Brand building is achieved through CSR, as the association of the brand with a good cause leads to better brand recognition among competitors. The proposed input model (
Figure 1) was developed, tested and verified using the following indices: Chi-square (χ2), normed chi-square (CMIN/DF), “GFI”, “AGFI”, “NFI”, “TLI”, “CFI” and “RMSEA”. To assess the suitability of a measurement model, several suitability indices reflect the adaptability of the model. At least one index should be reported by the researcher of absolute fit, one of incremental fit and one of parsimonious fit among all the category of indices Hair [
21]. Kline [
22] has recommended that at least the following indices should be reported:
- (1)
Chi-square
- (2)
CFI
- (3)
RMSEA
- (4)
SRMR
The model fit indices are classified into three categories, which are, Absolute Fit, Incremental Fit and Parsimonious Fit. Selection of a particular index from each category of indices depends on the literature that has been referred to in the study. Therefore, to reach the acceptable suitability of the model and also validate the measurement model, the redundant elements that exist in a model must be eliminated or constrained as “free parameters”.
5. Methodology of the Study
This research study is descriptive-cum-cross sectional in nature. A cross-sectional research design connotes a distinctive category of descriptive research design, which is systematic and exact to enfold the properties established in a research question. Such a system is usually formed from the construction and examination of hypotheses derived out of a theory Hair [
23]. For the purpose of determining the sample size of executives, a multi-stage sampling technique was used by the researchers in the study. A list of Indian companies was obtained firstly from the data of
CSRBOX (
https://csrbox.org/list-companies-india, accessed on 12 November 2021) and it had 1094 companies in aggregate. In the second stage, CSR-practicing companies operating in various sectors located in the Delhi-NCR region were selected randomly. In the third stage, only those companies were selected that regularly conducted CSR activities for the last five years.
According to Cochran [
24] “the required sample size should not exceed 5% of the finite population”. Therefore, for a population of 1094 companies, the required sample size is 55, i.e., 1094 × 5%. However, 109 executives of the selected companies were chosen randomly as a sample, out of which 74 were willing to participate in the survey. Therefore, the required sample size for the present study was 74, which is more than 5% of the finite population of 1094. formula for revising the finite population was used to determine the final sample size as given below:
where,
N = Finite Population Size = 1094
n = Required Return Sample Size for finite population = 74
n = Final Required Return Sample Size for finite population is 69 because sample size of 74 exceeds 5% of the population (i.e., 1094 × 5% = 55).
It is also essential to choose an accurate method of data collection for answering the research questions. A survey method is used in the study for the purpose of collection of primary data. The survey took place in India’s National Capital Region from January to June 2021.
5.1. Development of the Survey Instrument
For this study, the data was collected from the sample executives via a self-administered web-based questionnaire. Accordingly, a web-based questionnaire was prepared and administered with the help of Google Forms among the executives of companies that were located in NCR. This online survey comprises two sections: Section-A encompasses the distribution of sample companies with respect to their individual profiles, i.e., type of organization, nature of industry to which the company belongs to, implementation of CSR practices and the legal compliance of corporate social responsibility as per the guidelines of the Companies Act, 2013. Section-B of the Questionnaire assesses Executives’ perceptions and attitudes toward how CSR initiatives are implemented in a company’s brand-building process and how this is useful in building their Brand Equity, i.e., Firm-Based Brand Equity (FBBE). This “survey” was based on a “Five-Point Likert Scale” ranging from Strongly Disagree (1) to Strongly Agree (5). For the validity and reliability testing of the survey instrument, the modified questionnaire was evaluated by the experts, and a pilot survey was conducted among 28 company executives, according to the results of which appropriate changes were made prior to circulating it finally in the target population. On account of reliability, to specify how the items are precisely correlated “Cronbach’s alpha” technique has been used in the present study with the help of SPSS (version 25) software.
5.2. Methods for Data Analysis
The collected sample dataset has been brought into SPSS (v-25) software through Microsoft excel in order to analyze the collected data by the researchers. Exploratory factor analysis (EFA) is a set of statistical processes for determining the number and types of constructs needed to account for the pattern of correlations between a set of variables (Frey [
25]). Accordingly, the researcher performed an Exploratory Factor Analysis (EFA) on 9 items of Marketing Communication method, 8 items of Brand Identity and 10 items of Brand Equity to group the variables.
The statistical technique that is used in marketing to examine the causal association between two or more variables and is exclusively used for testing the theorized/hypothetical models developed by the researcher himself or by the other researchers is called as Structural Equation Modeling (SEM) Bagozzi [
26]. An SEM model is used by the researchers through AMOS (version 24) software to analyze the relationship between CSR, Marketing Communication, Brand Identity and Brand Equity from the perspective of companies.
6. Results and Findings
In order to collect primary data from the sample company executives, the questionnaire was distributed online via Google Docs through various social media platforms. The web-based questionnaire was specially planned with the variables under study. Closed-ended questions were included in the survey. A summated five-point rating scale, i.e., “Strongly Disagree (1)” to “Strongly Agree (5)”, was used to collect information from responders. The researchers received 69 responses that qualified for data analysis. By using SPSS (version-25) and AMOS (version-24) software, the collected sample dataset from the executives of companies engaged in CSR activities were analyzed quantitatively.
6.1. Profile of the Sample Companies
This section presents some basic information of the sample companies.
Table 1 depicts the profile of the sample companies, i.e., type of organization, nature of industry to which the company belongs to, principles adopted for implementation and execution of CSR activities and the legal compliance of “Corporate Social Responsibility” (CSR) as per the guidelines of the Companies Act, 2013. Based on these parameters, a summary table of the sample companies has been prepared.
Table 2 reveals that a majority of the sample companies (84 per cent) belong to the Private Sector and the rest (16 per cent) belong to Public Sector. Thus, it signifies that a large number of sample companies belong to the private sector.
It is also evident from
Table 3 that a majority of the companies (45 per cent) have executed CSR activities through CSR committees, followed by 22 per cent companies via a marketing department, whereas 19 per cent implemented it with the help of top management, and 13 per cent executed CSR activities through their human resources department. However, only 1 per cent of sample companies were found to be managing their CSR activiities with the help of a third party.
6.2. Reliability Analysis
According to Hair et al., “Cronbach’s alpha is the standard measure of internal correspondence between items in a scale, facilitating its widespread use with Likert scale-based questions used in the survey (Cronbach [
27]). The fundamental objective of reliability testing was to examine the attributes of the scales of measurement and the items for getting the overall index of internal consistency of the scales.” The outcome of this test is depicted in
Table 4.
The average reliability is denoted through the value of a coefficient alpha between ±0.41 and ±0.70. The alpha value, on the other hand, suggests high reliability (Sekaran [
28]) by being greater than ±0.71. Surpassing the acceptable level of 0.70 (Tabachnick and Fidell [
29]), all measurements had high reliability, with alpha coefficients between 0.70 and 0.90. This threshold limit indicates the level of testing of the internal consistency of the five-point Likert scale and thus provides an in-depth analysis.
6.3. Exploratory Factor Analysis (EFA)
The EFA method is a well-known method for scale refinement. It entails the following steps: finding relevant content from the literature, constructing a survey instrument to assess these items, executing a field survey, running EFA (sometimes with varimax rotation) on the item responses and determining the primary factors based on item factor loading (Samuels [
30]). It is a data-driven approach to identify the latent variables from a set of variables. Accordingly, the researcher performed an exploratory factor analysis on 9 items of Marketing Communication method, 8 items of Brand identity and 10 items of Brand Equity to group the variables. The items of both the variables were analyzed using a Principal Component Analysis (PCA) method through SPSS (version-25). The adequacy of data for factor analysis was checked prior to performing PCA.
6.3.1. KMO (Kaiser-Meyer-Olkin) and Bartlett’s Test
To test the precision of the sampling, and to determine the requirement for reducing the large number of statements into a smaller number of factors, a KMO and Bartlett’s test was used. EFA was performed after obtaining the positive results of the KMO and Bartlett test. The test results are presented in
Table 3.
As per
Table 5, the Sphericity test of Bartlett is significant, with the
p-value being <0.001 and the measures of KMO sample adequacy for all the constructs being 0.757 in the case of CSR activities, 0.793 in case of Marketing Communication and Brand Identity and 0.804 in case of Brand Equity, which are greater than the minimum value of 0.6. The Sphericity test of Bartlett is significant in all cases since the
p-value is less than 0.001. The values shown in the aforesaid table reveal that the data is appropriate for the detection of structures. High values of KMO (KMO > 0.6) and low values of the Bartlett test, i.e., less than 5% alpha level in all cases, indicate that the sampling is adequate.
6.3.2. EFA–Marketing Communication Methods (MCM)
Table 6 shows all the 9 items of Marketing Communication methods adopted by the companies to communicate their CSR activities to customers. To obtain a meaningful interpretation from these factors, the Varimax rotation was applied. The concept rotation refers to the process of rotating the reference axes of the factors around the origin until they reach a new point. There are different rotation methods, such as Varimax, Quartimax, Equamax, Promax etc. However, in the present study, we have used the Varimax method. Varimax attempts to simplify the factor loadings by forcing them to be close to 0 or 1. Varimax is a robust procedure that typically enhances the interpretability of factors and is consequently the most popular orthogonal rotation scheme.
The Rotated Component Matrix in the
Table 6 presents the “Rotated Factor Loadings”, which are the magnitudes of these vertical projections, or the correlations of the variables with the new factors. When a variable is highly correlated, the factor loading is close to 1 or, say, greater than 0.5, and we rely on that interpreted variable and comprehend the factor.
On the basis of an extensive literature review and the results of exploratory factor analysis, the researcher has extracted two components of Marketing Communication Methods, i.e., “Indoor Advertising” and “Outdoor Advertising”.
Factor-1 explains 40.126% of the total variance, which contains the variables related to Indoor Advertising, such as communication of CSR activities through television, newspapers and brochures. On the other hand, the Factor-2 accounts for 26.882% variance of the total variance, which contains the variables related to Outdoor Advertising such as CSR activities communicated by companies through hoardings, poster/wall paintings, window displays, kiosks, trade shows, FM radio etc. The aforementioned
Table 4 shows that MCM2, MCM3 and MCM5 were grouped as Indoor Advertising (IA), and MCM1, MCM4, MCM6, MCM7, MCM8 and MCM9 were grouped as Outdoor Advertising (OA).
6.3.3. EFA–Brand Identity (BI)
Table 7 depicts the communalities values of all the 8 items pertaining to measures adopted by the companies to develop a strong Brand Identity.
On the basis of an extensive literature review and the results of factor analysis, the researchers have extracted two components of Brand Identity, i.e., “Brand Personality” and “Brand Positioning”.
Factor-1 accounted for 34.020% of the total variance, which comprises the variables related to Brand Personality such as “Company identifies the target customers and then undertakes CSR activities accordingly”, “Company promotes CSR activities through celebrities”, “Company has an emotional connection with customers” and “Company’s brand name is easily recognized by the customers because of their CSR activities”. On the other hand, Factor-2 accounted for 25.926% of the total variance, which consist of variables related to Brand Positioning such as “Company uses slogans to communicate its CSR activities to customers”, “Company conducts different advertisement campaigns to promote CSR activities”, “Company uses logo/mascots to propagate its CSR initiatives” and “Company has an online communication system which helps company in maintaining cordial relationship with the customers”.
Table 5 depicts the grouping of Brand Identity. BI1, BI3, BI4 and BI8 were grouped as Brand Personality (BP), and BI2, BI5, BI6 and BI7 were grouped as Brand Positioning (BPo).
6.3.4. EFA–Brand Equity (BE)
Table 8 depicts all 10 components of the brand-building process undertaken by the companies to build strong Brand Equity.
Through an extensive review of the literature and the results of factor analysis, researchers have extracted two factors of Brand Identity, i.e., “Brand Association” and “Brand Loyalty”. Factor-1 accounted for 27.533% of the total variance, which comprises the variables related to Brand Association such as honest implementation of CSR activities, CSR activities leading to an increase in profits, CSR based ads being in the mind of customers and companies propagating their CSR initiatives to gain brand recognition.
On the other hand, Factor-2 accounted for 26.860% of the total variance, which consists of the variables related to Brand Positioning such as CSR activities leading to long lasting relationship with the customers/customer loyalty, propagation of CSR activities through celebrities having a significant impact on sales, customers preferring brands because of CSR activities and huge investment by the companies on CSR campaigns to build strong Brand Equity.
Table 8 explains the factor loadings of Brand Equity. BE6, BE7, BE8, BE9 and BE10 were grouped as Brand Association (BA), and BE1, BE2, BE3, BE4 and BE5 were grouped as Brand Loyalty (BL).
6.4. Pooled-CFA Measurement Model-Validity and Reliability
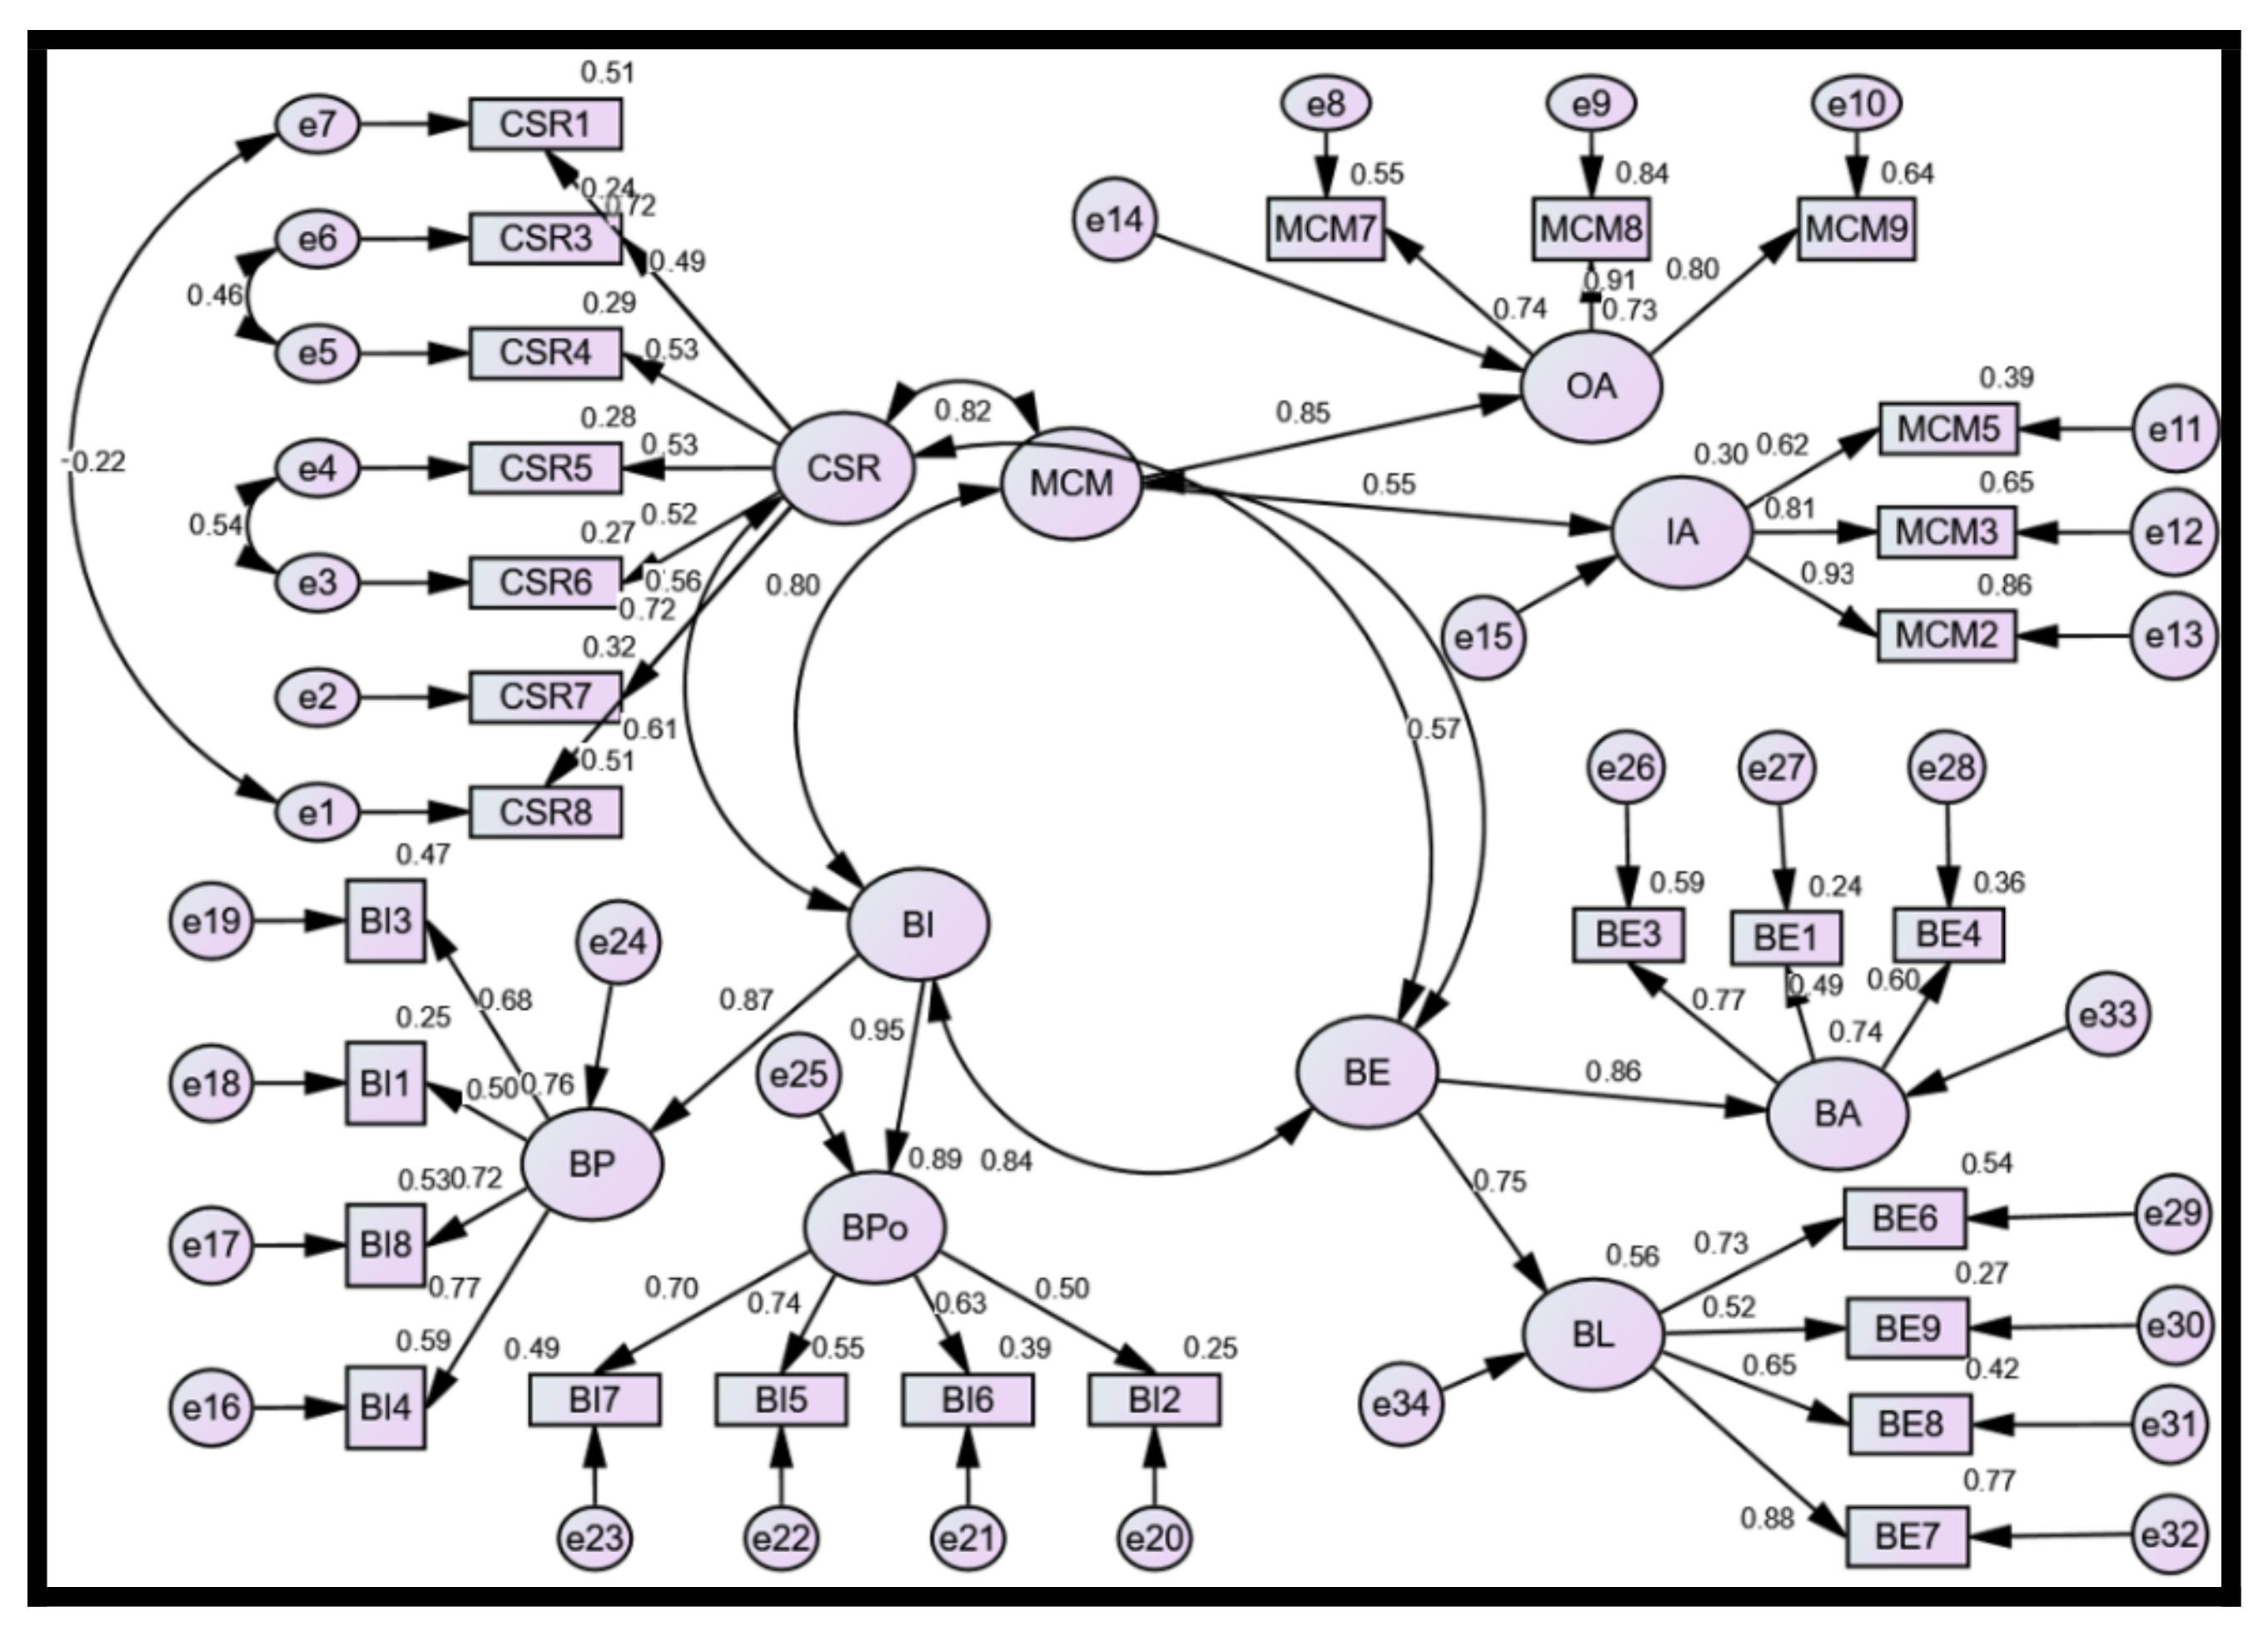
For the purpose of calculating the reliability and validity of the measurement model, all the latent variables were assessed simultaneously. To validate the measurement model, there should be a correlation in the specified model among all the unobserved variables (latent constructs). This method is called Pooled-CFA. The representation of all the latent constructs in a schematic diagram is exhibited in
Figure 2.
As shown in
Figure 2, all the latent constructs, i.e., Corporate Social Responsibility (CSR), Marketing Communication (MCM), Brand Identity (BI) and Brand Equity (BE), are correlated with each other. The model consists of one First-Order Construct, i.e., CSR (measured through eight items), and three Second-Order Constructs, namely Marketing Communication, Brand Identity and Brand Equity. Second-Order Constructs are measured through their sub-constructs such as Marketing Communication (MCM), which is measured through two sub-constructs, namely Indoor Advertising (IA) & Outdoor Advertising (OA); Brand Identity (BI), which is measured by Brand Personality (BP) & Brand Positioning (BPo) and Brand Equity (BE) is measured by Brand Association (BA) & Brand Loyalty (BL). Each of the aforesaid sub-constructs is measured through various manifest variables presented in boxes. To address the issue of item redundancy and improve the outcomes of model fit indices, various items were deleted due to the low values of their standardized regression weights. As a matter of fact, six redundant items were constrained as a “free parameter” in the model.
Table 9 depicts the analysis summary of the aforementioned pooled measurement model produced by AMOS 24.
As per the validity and reliability analysis (
Table 9), the Composite Reliability (CR) of each latent variable in the Pooled-CFA model is more than the acceptable limit, i.e., 0.70, and the AVE value of each latent construct affirms that the aforementioned Pooled-CFA has strong convergent validity since it exceeds the recommended limit, i.e., 0.5. As far as the discriminant validity is concerned, the diagonal values shown in the bold font are the square root of AVE of the construct, while the correlation between the respective latent constructs is depicted by the other values (R
2C
6 → R
5C
9). These diagonal values are an indication that discriminant validity is achieved for all the latent constructs, since these values are greater than the values that exist in their respective row and column (R
2C
6 → R
5C
9).
6.5. The Structural Equation Modeling (SEM)
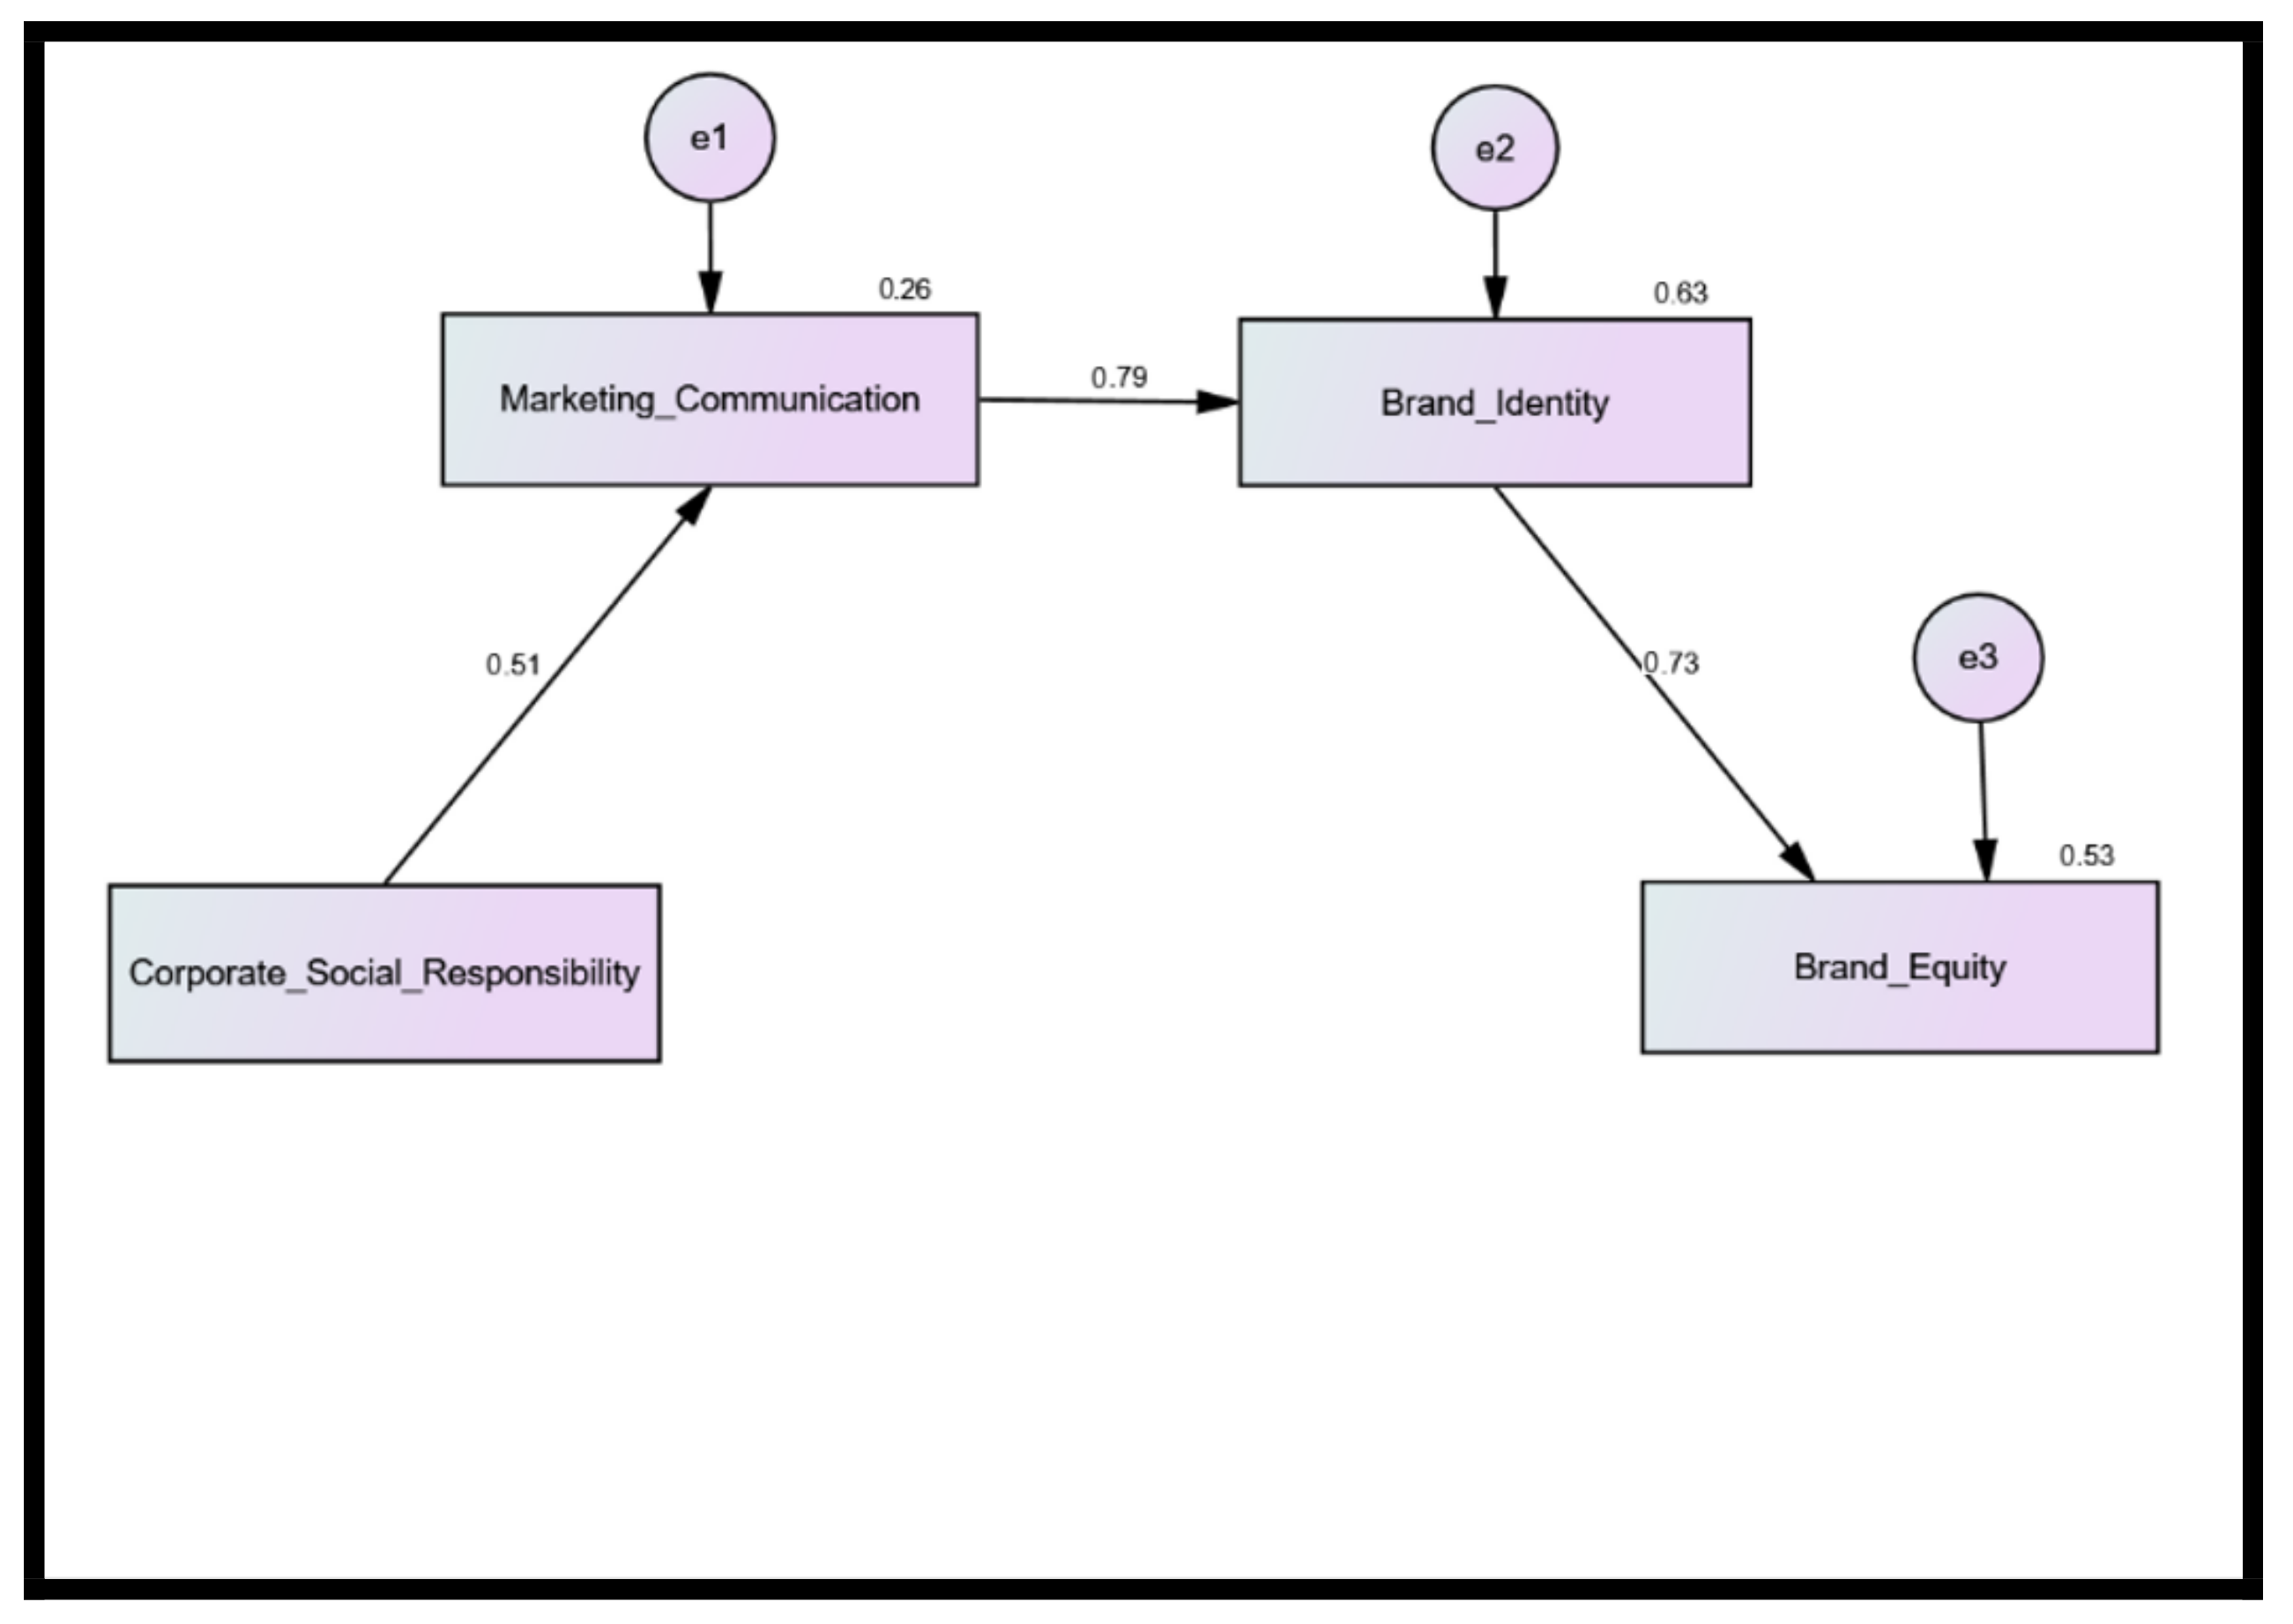
In this section, an SEM model is used to analyze the relationship between CSR, Marketing Communication, Brand Identity and Brand Equity from the perspective of companies. To make the Pooled-CFA model more comprehensive, a Data Imputation method (
Figure 3) was used via AMOS (version 24) software, which shows how CSR affects Brand Equity with the mediating effect of Marketing Communication and Brand Identity through the Path Model of companies.
Figure 3 reveals that an increase in the units of each variable increases Brand Equity. The figure further explains that CSR, Marketing Communication, Brand Identity and Brand Equity are positively associated. Thus, we can conclude that CSR affects Brand Equity with the mediating effect of Marketing Communication and Brand Identity. The analysis summary of the aforesaid model provided by AMOS 24 is exhibited in
Table 10 and
Table 11.
Table 10 shows that the value of discrepancy χ
2 is 0.181, which is greater than 5% of
p-value, and the “CMIN/DF” value is 1.182 (less than 3), which affirms that the data is suitable for the model fit. The model has also generated other indices of goodness, i.e., “GFI” = 0.923, “AGFI” = 0.810, “CFI” = 0.975 and “NFI” = 0.934, all of which exceed their acceptable range, indicating that this model is well-fitted, and two indices of badness, i.e., “RMSEA” = 0.052 (less than 0.10) and “SRMR” = 0.056 (less than 0.09), prove that the model is a good fit because the lesser values of “RMSEA” and “SRMR” indicate a better fit. A “TLI” value of 0.965 reveals that the model has very strong convergent validity since it exceeds the recommended limit of 0.9. Thus, it can be concluded that Pooled-CFA measurement model for combining all the variables simultaneously is a well-fitted model.
Table 11 reveals that each of the aforementioned paths exhibited in the table are significant since their
p-values are less than 5% alpha level. It further explains that convergent validity of the above Structural Equation Model of sample companies is achieved because the standardized regression weight of each path is greater than 0.4. As a result of this, each manifest variable is strongly correlated with its assumed theoretical construct (Abbott [
31]). From the above analysis, it is observed that CSR activities affect Marketing Communication, Marketing Communication affects Brand Identity and Brand Identity affects Brand Equity, which can be symbolically written as:
CSR activities = 0.515 Marketing Communication
Marketing Communication = 0.795 Brand Identity
Brand Identity = 0.727 Brand Equity
The aforementioned equations explain that CSR activities significantly lead to Marketing Communication with a standardized regression coefficient of 0.515, and this positive value of standardized regression weight implies that Marketing Communication is significantly affected by the CSR. The standardized regression weight of Marketing Communication towards Brand Identity is 0.795, which signifies the change in Brand Identity on account of a change in the Marketing Communication, and this estimated positive value of regression coefficient implies that Marketing Communication is significantly influencing the Brand Identity, and the beta value is also significant at 5% alpha level. The standardized regression weight of Brand Identity towards Brand Equity is 0.727, which indicates that Brand Identity is significantly related to Brand Equity. This positive value of standardized regression weight signifies the positive change and further explains that CSR is indirectly influencing Brand Equity, and the value of standardized beta is significant at a 5% level too. Thus, it can be concluded that CSR affects Brand Equity with the mediating effect of Marketing Communication and Brand Identity.
Table 12 exhibits the direct effects of each exogenous variable on the endogenous variable. Corporate Social Responsibility is directly related to Marketing Communication with the standardized beta value of 0.515, but there is no direct effect of CSR on Brand Identity and Brand Equity. It further explains that Brand Identity is directly affected by the Marketing Communication with the regression coefficient of 0.795. The standardized regression weight of Brand Identity towards Brand Equity is 0.727, which depicts the direct association between Brand Identity and Brand Equity, and the Brand Identity is the only factor which directly affects the Brand Equity.
Table 13 exhibits the indirect effects of each exogenous variable on the endogenous variable. The equations given below determine the indirect effect between the variables:
- (1)
Corporate Social Responsibility and Brand Identity:
=β value of Marketing Comm. × β value of Brand Identity
=0.515 × 0.795
=0.409
- (2)
Marketing Communication and Brand Equity:
=β value of Brand Identity × β value of Brand Equity
=0.795 × 0.727
=0.578
- (3)
Corporate Social Responsibility and Brand Equity:
=β value of Marketing Communication × β value of Brand
Identity × β value of Brand Equity
=0.515 × 0.795 × 0.727
=0.298
Table 14 depicts the total effects of each exogenous variable on the endogenous variable. The below equations determine the total effect between the variables:
- (1)
Corporate Social Responsibility and Marketing Communication:
=Direct effect + Indirect effect
=0.515 + NIL
=0.515
- (2)
Corporate Social Responsibility and Brand Identity:
=Direct effect + Indirect effect
=NIL + 0.409
=0.409
- (3)
Corporate Social Responsibility and Brand Equity:
=Direct effect + Indirect effect
=NIL + 0.298
=0.298
- (4)
Marketing Communication and Brand Identity:
=Direct effect + Indirect effect
=0.795 + NIL
=0.795
- (5)
Marketing Communication and Brand Equity:
=Direct effect + Indirect effect
=NIL + 0.578
=0.578
- (6)
Brand Identity and Brand Equity:
=Direct effect +Indirect effect
=0.727 + NIL
=0.727
Table 15 depicts that the standardized indirect effect of a variable on another variable is measured with the mediating effect of other variables. From the aforesaid analysis, we can say that there is a mediating role of Marketing Communication in creating the association between Corporate Social Responsibility and Brand Identity, and there is also a mediating effect of Brand Identity in the context of Marketing Communication’s relationship with Brand Equity, since in both the cases the
p-value is less than 5% significance level. As far as the relationship between CSR and Brand Equity is concerned, the calculated probability value is 0.001, which is less than the 5% alpha level. Hence, we can say that CSR affects Brand Equity positively but with the mediating effects of Marketing Communication and Brand Identity. Thus, the aforesaid analysis reveals that there is an indirect association between CSR and Brand Equity.
7. Conclusions
CSR has scaled a new height in the recent past. Companies disseminate information pertaining to their CSR activities through various mass media. CSR activities communicated through mass media create awareness about the brand; this awareness instils an image of the brand among the customers, and when an image is created, customers prefer and finally purchase that brand. The present study revealed that CSR activities are significantly associated with Marketing Communication and Brand Identity, leading to Firm-Based Brand Equity (FBBE) (Shafi and Madhavaiah [
6]). With regard to H1 i.e., “There is no significant relationship between CSR activities and Marketing Communication”; as per the results of the SEM model, we can infer that the dissemination of information pertaining to CSR activities undertaken by the companies concerned through marketing communication is very effective. Hence, it can be concluded that the customers’ attention towards CSR brands can be drawn through proper Marketing Communication. Thus, a null hypothesis (H1) is rejected and an alternative hypothesis is accepted. With regard to H2, i.e., “There is no significant relationship between Marketing Communication and Brand Identity”, the results of structural equation modeling reveal that the coefficient of Marketing Communication towards Brand Identity is 0.795, which indicates the effect of Marketing Communication on Brand Equity, and the estimated positive sign implies that Marketing Communication significantly influences Brand Equity. Thus, we can say that H2 is rejected, and thereby an alternative hypothesis is accepted. Lastly, H3 is concerned, i.e., “There is no significant relationship between Brand Identity and Brand Equity”; the coefficient of Brand Identity towards Brand Equity depicted in the SEM model is found to be 0.727 which shows that Brand Identity is significantly related to Brand Equity. Consequently, we can say the third null hypothesis (H3) is rejected. Hence, on the basis of an analysis of the above three null hypotheses, we can reveal that CSR activities undertaken by the companies have positive effects on their Brand Equity with the mediating effect of Marketing Communication and Brand Identity Brunello [
7]. The findings of the study discern that CSR activities affect Marketing Communication, that Marketing Communication affects Brand Identity and that Brand Identity affects Brand Equity. Thus, companies promote CSR activities through various marketing communication techniques to make aware the customers of their brands at large. CSR activities, when communicated effectively, enhance Corporate Brand Identity and reputation, leading to Firm-Based Brand Equity (Jyothsna et al. [
11]). Finally, it can be concluded that CSR initiatives undertaken by the companies play a decisive role in building Firm-Based Brand Equity (Salehzadeh et al., 2018).


