
Effect of Crop Establishment Methods and Microbial Inoculations on Augmenting the Energy Efficiency and Nutritional Status of Rice and Wheat in Cropping System Mode

 , , and
Abstract
:1. Introduction
2. Material and Methods
2.1. Experimental Site
2.2. Experimental Details
2.3. Crop Establishment Methods (CEMs)
2.4. Application of Microbial Inoculation and Fertilizers
2.5. Energy Calculation
2.6. Calculation of Grain Yield, Protein Yield and Micronutrient Uptake
2.7. Statistical Analysis
3. Results
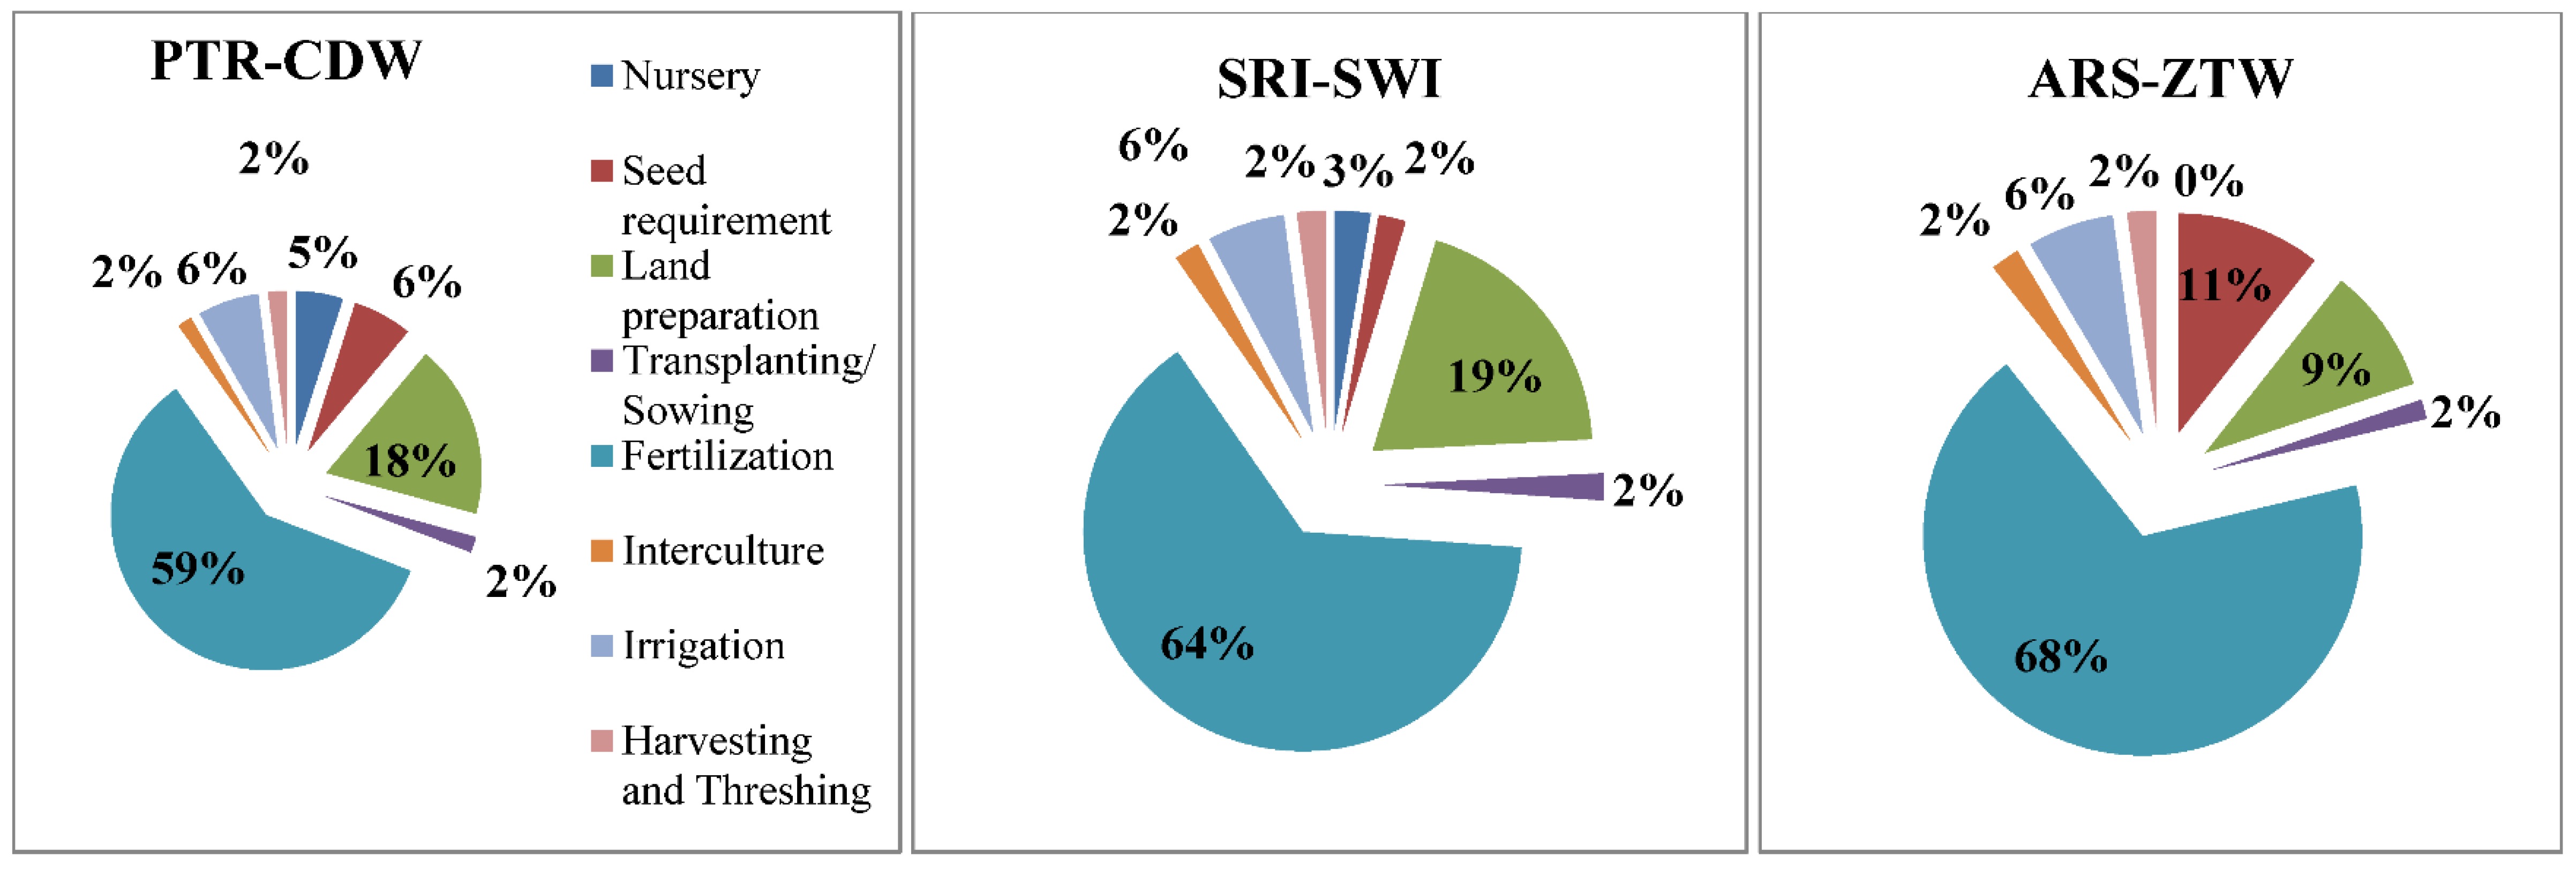
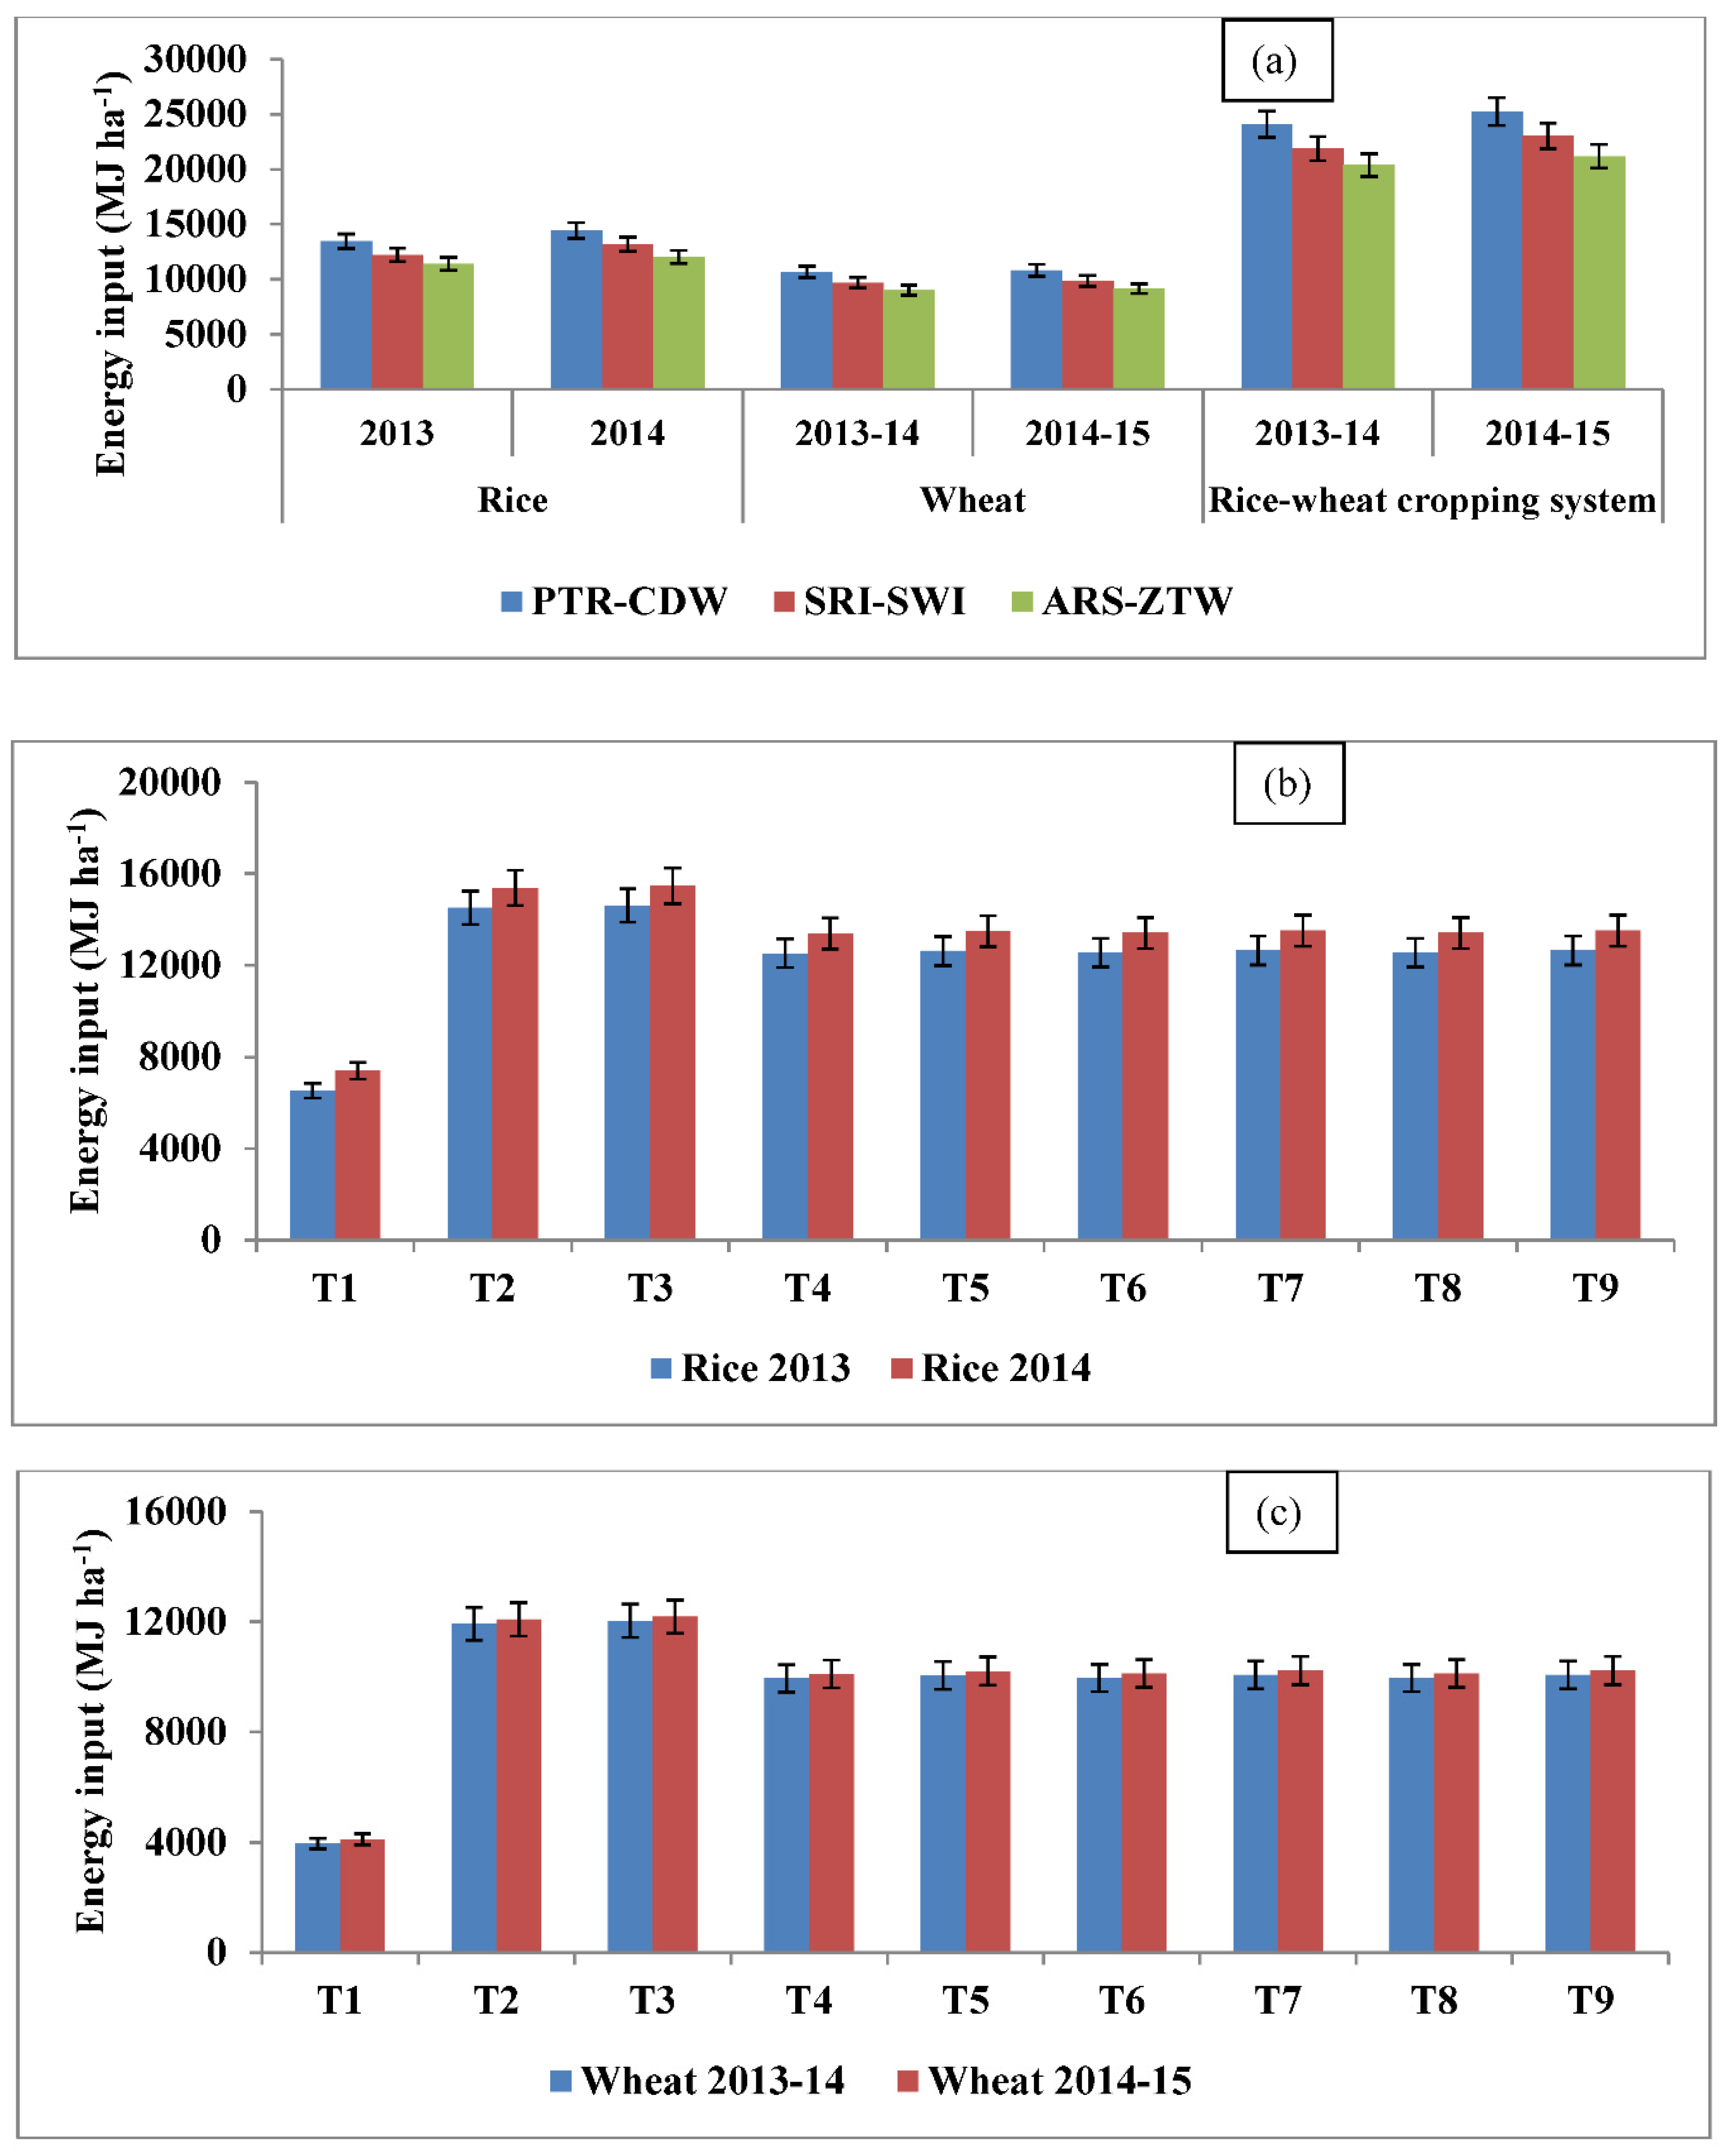
3.1. Energy Input
3.2. Energy Production
3.3. Grain Yield, Protein Yield and Micronutrient Uptake
4. Discussion
4.1. Energy Input and Type of Energy
4.2. Energy Production
4.3. Grain Yield, Protein Yield and Micronutrient Uptake
5. Conclusions
Supplementary Materials
Author Contributions
Funding
Institutional Review Board Statement
Informed Consent Statement
Data Availability Statement
Acknowledgments
Conflicts of Interest
References
- Rampal, P. An analysis of protein consumption in India through plant and animal sources. Food Nutr. Bull. 2016, 39, 564–580. [Google Scholar] [CrossRef] [PubMed]
- Sautter, C.; Poletti, S.; Zhang, P.; Gruissem, W. Biofortification of essential nutritional compounds and trace elements in rice and cassava. Proc. Nutr. Soc. 2006, 65, 153–159. [Google Scholar] [CrossRef] [PubMed] [Green Version]
- Annual Report 2020–21, Department of Agriculture, Cooperation & Farmers’ Welfare, Ministry of Agriculture & Farmers’ Welfare, Government of India, Krishi Bhawan, New Delhi. 2022. Available online: https://agricoop.nic.in/sites/default/files/Web%20copy%20of%20AR%20%28Eng%29_7.pdf (accessed on 26 January 2022).
- Agricultural Statistics at a Glance 2020, Department of Agriculture, Co-Operation and Farmers’ Welfare, Ministry of Agriculture and Farmers’ Welfare, Government of India. 2020, p. 147. Available online: eands.dacnet.nic.in/ (accessed on 4 February 2022).
- Bohra, J.S.; Kumar, R. Effect of crop establishment methods on productivity, profitability and energetic of rice (Oryza sativa)-wheat (Triticum aestivum) system. Indian J. Agric. Sci. 2015, 85, 217–223. [Google Scholar]
- Gathala, M.K.; Laing, A.M.; Tiwari, T.P.; Timsina, J.; Islam, S.; Bhattacharya, P.M.; Dhar, T.; Ghosh, A.; Sinha, A.K.; Chowdhury, A.K.; et al. Energy efficient, sustainable crop production practices benefit for small holder farmers and the environment across three countries in the eastern Gangetic plains, South Asia. J. Clean. Prod. 2020, 246, 118982. [Google Scholar] [CrossRef]
- Erenstein, O.U.; Farooq, R.K.; Malik, M.; Sharif. On-farm impacts of zero tillage wheat in South Asia’s rice-wheat systems. Field Crops Res. 2008, 105, 240–252. [Google Scholar] [CrossRef]
- Prasad, R.; Shivay, Y.S.; Kumar, D. Textbook of Field Crops Production—Foodgrain Crops; Prasad, R., Ed.; Directorate of Knowledge Management in Agriculture, Indian Council of Agricultural Research, Krishi Anuasandhan Bhavan I: Pusa, New Delhi, India, 2012; Volume I, pp. 1–65. [Google Scholar]
- Thakur, A.K.; Rath, S.; Mandal, K.G. Differential responses of system of rice intensification and conventional flooded rice management methods to applications of nitrogen fertilizer. Plant Soil 2013, 370, 59–71. [Google Scholar] [CrossRef]
- Gathala, M.K.; Ladha, J.K.; Kumar, V.; Saharawat, Y.S.; Kumar, V.; Sharma, P.K.; Sharma, S.; Pathak, H. Tillage and crop establishment affects sustainability of south Asian rice-wheat system. Agron. J. 2011, 103, 961–971. [Google Scholar] [CrossRef]
- Jat, A.L.; Srivastava, V.K.; Singh, R.K. Effect of crop establishment methods and integrated nutrient management on productivity of hybrid rice (Oryza sativa) and wheat (Triticum aestivum) cropping system. Indian J. Agron. 2015, 60, 341–346. [Google Scholar]
- Erenstein, O.; Laxmi, V. Zero tillage impacts in India’s rice-wheat system: A review. Soil Tillage Res. 2008, 100, 1–14. [Google Scholar] [CrossRef]
- Bruckner, T.; Bashmakov, I.A.; Mulugetta, Y.; Chum, H.; de la Vega Navarro, A.; Edmonds, J.; Faaij, A.; Fungtammasan, B.; Garg, A.; Hertwich, E.; et al. Energy Systems. In Climate Change 2014: Mitigation of Climate Change. Contribution of Working Group III to the Fifth Assessment Report of the Intergovernmental Panel on Climate Change; Edenhofer, O., Pichs-Madruga, R., Sokona, Y., Farahani, E., Kadner, S., Seyboth, K., Adler, A., Baum, I., Brunner, S., Eickemeier, P., Eds.; Cambridge University Press: Cambridge, UK; New York, NY, USA, 2014; Available online: https://www.ipcc.ch/site/assets/uploads/2018/02/ipcc_wg3_ar5_chapter7.pdf (accessed on 4 February 2022).
- Gangwar, K.S.; Chaudhary, V.P.; Gangwar, B.; Pandey, D.K.; Singh, K.K. Mechanization practices in rice-wheat cropping systems in upper Indo-Gangetic plains India. Agric. Mech. Asia Afr. Lat. Am. 2012, 43, 66–74. [Google Scholar]
- Borah, N.; Dutta, S.; Barua, P. Soil resource management under diversified rice-based cropping systems and increasing farm mechanization in Assam. Proceedings 2017, 225–232. [Google Scholar]
- Devasenapathy, P.; Senthilkumar, G.; Shanmugam, P.M. Energy management in crop production. Indian J. Agron. 2009, 54, 80–90. [Google Scholar]
- Kumar, V.; Saharawat, Y.S.; Gathala, M.K.; Jat, A.S.; Singh, S.K.; Chaudhary, N.; Jat, M.L. Effect of different tillage and seeding methods on energy use efficiency and productivity of wheat in the Indo-Gangetic Plains. Field Crop Res. 2013, 142, 1–8. [Google Scholar] [CrossRef]
- Singh, R.J.; Ghosh, B.N.; Sharma, N.K.; Patra, S.; Dadhwal, K.S.; Mishra, P.K. Energy budgeting and energy synthesis of rainfed maize-wheat rotation system with different soil amendment applications. Ecol. Indic. 2016, 61, 753–765. [Google Scholar] [CrossRef]
- Cakmak, I. Enrichment of cereal grains with zinc: Agronomic or genetic biofortification? Plant Soil 2008, 302, 1–17. [Google Scholar] [CrossRef]
- Prasad, R.; Shivay, Y.S.; Kumar, D. Agronomic biofortification of cereals grains with iron and zinc. In Advances in Agronomy; Elsevier Inc.: Amsterdam, The Netherlands, 2014; pp. 55–91. [Google Scholar]
- Bhutia, D.T. Protein energy malnutrition in India: The plight of our under five children. J. Fam. Med. Fam. Care 2014, 3, 63–67. [Google Scholar] [CrossRef]
- Alsulami, S.; Bodhini, D.; Sudha, V.; Shanthi Rani, C.S.; Pradeepa, R.; Anjana, R.M.; Radha, V.; Lovegrove, J.A.; Gayathri, R.; Mohan, V.; et al. Lower dietary intake of plant protein is associated with genetic risk of diabetes-related traits in urban Asian Indian adults. Nutrients 2021, 13, 3064. [Google Scholar] [CrossRef]
- Bouyoucos, G. Hydrometer method for making particle size analysis of soils. J. Agron. 1962, 54, 464–465. [Google Scholar] [CrossRef]
- Walkley, A.J.; Black, I.K. An examination of the Degtjareff method for determination of soil organic matter and a proposed modification of the chromic acid titration method. Soil Sci. 1934, 37, 29–38. [Google Scholar] [CrossRef]
- Subbiah, B.V.; Asija, G.L. A rapid procedure for assessment of available nitrogen in rice soils. Curr. Sci. 1956, 25, 259–260. [Google Scholar]
- Jackson, M.L. Soil Chemical Analysis; Prentice Hall of India Pvt Ltd.: New Delhi, India, 1973. [Google Scholar]
- Hanway, J.J.; Heidel, H. Soil Analysis Methods as Used in IOWA State College Soil Testing Laboratory; Iowa State College of Agriculture: Ames, IA, USA, 1952; Volume 57, p. 131. [Google Scholar]
- Lindsay, W.L.; Norvell, W.A. Development of DTPA soil test for zinc, iron, manganese and copper. Soil Sci. Soc. Am. J. 1978, 42, 421–428. [Google Scholar] [CrossRef]
- Piper, C.S. Soil and Plant Analysis; The University of Adelaide: Adelaide, SA, Australia, 1950; p. 286. [Google Scholar]
- Uphoff, N.; Randriamiharisoa, R. Reducing water use in irrigated rice production with the Madagascar System of Rice Intensification (SRI). In Water-Wise Rice Production, Proceedings of the a Thematic Workshop on Water-Wise Rice Production, IRRI Headquarters, Los Banos, Philippines, 8–11 April 2002; Bouman, B.A.M., Hengsdijk, H., Hardy, B., Bindraban, P.S., Toung, T.P., Ladha, J.K., Eds.; International Rice Research Institute: Los Banos, Philippines, 2003. [Google Scholar]
- Dobermann, A. A critical assessment of the system of rice intensification. Agric. Syst. 2004, 79, 261–281. [Google Scholar] [CrossRef]
- Uphoff, N.; Kassam, A.; Thakur, A. Challenges of increasing water saving and water productivity in the rice sector: Introduction to the system of rice intensification (SRI) and this issue. Taiwan Water Conserv. 2013, 61, 1–13. [Google Scholar]
- Prasad, R. Aerobic rice systems. Adv. Agron. 2011, 111, 208–233. [Google Scholar]
- Dhar, S.; Barah, B.C.; Vyas, A.K.; Uphoff, N.T. Comparing of system of wheat intensification (SWI) with standard recommended practices in north western plain zone of India. Arch. Agron. Soil Sci. 2016, 62, 994–1006. [Google Scholar] [CrossRef] [Green Version]
- Rana, L.; Banerjee, H.; Ray, K.; Sarkar, S. System of wheat intensification- A new approach for enhancing wheat yield in small farming system. J. Appl. Natur. Sci. 2017, 9, 1453–1464. [Google Scholar] [CrossRef]
- Adhikari, P.; Araya, H.; Aruna, G.; Balamatti, A.; Banerjee, S.; Baskaran, P.; Barah, B.C.; Behera, D.; Berhe, T.; Boruah, P.; et al. System of crop intensification for more productive, resource-conserving, climate-resilient, and sustainable agriculture: Experience with diverse crops in varying agroecologies. Int. J. Agric. Sustain. 2018, 16, 1–28. [Google Scholar] [CrossRef]
- Prasanna, R.; Joshi, M.; Rana, A.; Shivay, Y.S.; Nain, L. Influence of co-inoculation of bacteria-cyanobacteria on crop yield and C–N sequestration in soil under rice crop. World J. Microbiol. Biotech. 2012, 28, 1223–1235. [Google Scholar] [CrossRef]
- Nain, L.; Rana, A.; Joshi, M.; Jadhav, S.D.; Kumar, D.; Shivay, Y.S.; Paul, S.; Prasanna, R. Evaluation of synergistic effects of bacterial and cyanobacterial strains as bio-fertilizers for wheat. Plant Soil 2010, 331, 217–230. [Google Scholar] [CrossRef]
- Piper, C.S. Soil and Plant Analysis; Hans Publishers: Bombay, India, 1966; pp. 197–201. [Google Scholar]
- Prasad, R.; Shivay, Y.S.; Kumar, D.; Sharma, S.N. Learning by Doing Exercises in Soil Fertility (A Practical Manual for Soil Fertility); Division of Agronomy, Indian Agricultural Research Institute: New Delhi, India, 2006; p. 68. [Google Scholar]
- Keil, A.; D’souza, A.; McDonald, A. Zero-tillage is a proven technology for sustainable wheat intensification in the Eastern Indo-Gangetic Plains: What determines farmer awareness and adoption? Food Secur. 2017, 9, 723–743. [Google Scholar] [CrossRef] [Green Version]
- Jha, M.; Chourasia, S.; Sinha, S. Microbial consortia for sustainable rice production. Agroecol. Sustain. Food Syst. 2013, 37, 340–362. [Google Scholar] [CrossRef]
- Ghoghari, N.; Bharwad, K.; Champaneria, A.; Rajkumar, S. Microbial consortia for augmentation of plant growth–Revisiting the promising approach towards sustainable agriculture. In New and Future Developments in Microbial Biotechnology and Bioengineering; Elsevier publication: Amsterdam, The Netherlands, 2022; pp. 231–256. [Google Scholar] [CrossRef]
- Shivay, Y.S.; Kumar, D.; Prasad, R. Effect of zinc enriched urea on productivity, zinc uptake and efficiency of an aromatic rice-wheat cropping system. Nutr. Cycl. Agroecosyst. 2008, 81, 229–243. [Google Scholar] [CrossRef]
- Shivay, Y.S.; Prasad, R.; Rahal, A. Relative efficiency of zinc oxide and zinc sulphate-enriched urea for spring wheat. Nutr. Cycl. Agroecosyst. 2008, 82, 259–264. [Google Scholar] [CrossRef]
- Biswas, B.; Ghosh, D.C.; Dasgupta, M.K.; Trivedi, N.; Timsina, J.; Dobermann, A. Integrated assessment of cropping systems in the Eastern Indo-Gangetic plain. Field Crop Res. 2006, 99, 35–47. [Google Scholar] [CrossRef]
- Parihar, C.M.; Jat, S.L.; Singh, A.K.; Majumdar, K.; Jat, M.L.; Saharawat, Y.S.; Pradhan, S.; Kuri, B.E. Bio-energy, water-use efficiency and economics of maize-wheat-mungbean system under precision-conservation agriculture in semi-arid agro-ecosystem. Energy 2017, 119, 245–256. [Google Scholar] [CrossRef]
- Govindarasu, R.; Paramasivam, K.; Nadaradjan, S.; Shashidhara, N.; Vengatesh, M. Aerobic rice: A production system for water scarceness. AE Int. J. Sci. Tech. 2015, 3, 1–4. [Google Scholar]
- Peng, Z.; Wang, L.; Xie, J.; Li, L.; Coulter, J.A.; Zhang, R.; Luo, Z.; Kholova, J.; Choudhary, S. Conservation tillage increases water use efficiency of spring wheat by optimizing water transfer in a semi-arid environment. Agronomy 2019, 9, 583. [Google Scholar] [CrossRef] [Green Version]
- Xu, L.; Li, X.; Wang, X.; Xiong, D.; Wang, F. Comparing the grain yields of direct-seeded and transplanted rice: A meta-analysis. Agronomy 2019, 9, 767. [Google Scholar] [CrossRef] [Green Version]
- Thakur, A.K.; Mohanty, R.K.; Patil, D.U.; Kumar, A. Impact of water management on yield and water productivity with system of rice intensification (SRI) and conventional transplanting system in rice. Paddy Water Environ. 2014, 12, 413–424. [Google Scholar] [CrossRef]
- Keil, A.; D’souza, A.; McDonald, A. Zero-tillage as a pathway for sustainable wheat intensification in the Eastern Indo-Gangetic Plains: Does it work in farmers’ fields? Food Secur. 2015, 7, 983–1001. [Google Scholar] [CrossRef] [Green Version]
- Saharawat, Y.S.; Singh, B.; Malik, R.K.; Ladha, J.K.; Gathala, M.; Jat, M.L.; Kumar, V. Evaluation of alternative tillage and crop establishment methods in a rice-wheat rotation in North Western IGP. Field Crop Res. 2010, 116, 260–267. [Google Scholar] [CrossRef]
- Nandan, R.; Poonia, S.P.; Singh, S.S.; Nath, C.P.; Kumar, V.; Malik, R.K.; McDonald, A.; Hazra, K.K. Potential of conservation agriculture modules for energy conservation and sustainability of rice-based production systems of Indo-Gangetic Plain region. Environ. Sci. Pollut. Res. 2021, 28, 246–261. [Google Scholar] [CrossRef] [PubMed]
- Rattan, R.K.; Kumar, M.; Narwal, R.P.; Singh, A.P. Soil health and nutritional security—Micronutrients. In Soil Science in the Service of Nation, Proceedings of the Platinum Jubilee Symposium, New Delhi, India, 22–25 December 2009; Goswami, N.N., Bijay-Singh, Pal, D.K., Rao, D.L.N., Rattan, R.K., Eds.; Indian Society of Soil Science: New Delhi, India, 2009; pp. 249–265. [Google Scholar]
- Rattan, R.K. Soil—A Precious Resource; ISSS Newsletter No. 33–35; Indian Society of Soil Science: New Delhi, India, 2013. [Google Scholar]
- Yadava, D.K.; Choudhury, P.R.; Firoz, H.; Kumar, D. Biofortified Varieties: Sustainable Way to Alleviate Malnutrition; Indian Council of Agricultural Research: New Delhi, India, 2017; p. 19. [Google Scholar]
- Yadava, D.K.; Choudhury, P.R.; Hossain, F.; Kumar, D.; Mohapatra, T. Biofortified Varieties: Sustainable Way to Alleviate Malnutrition, 3rd ed.; Indian Council of Agricultural Research: New Delhi, India, 2020; p. 86. [Google Scholar]
- Ishfaq, M.; Akbar, N.; Anjum, S.A.; Anwar-Ijl-Haq, M. Growth, yield and water productivity of dry direct seeded rice and transplanted aromatic rice under different irrigation management regimes. J. Integr. Agric. 2020, 19, 2656–2673. [Google Scholar] [CrossRef]
- Singh, M.; Kumar, M.; Kumar, V.; Solanki, I.S.; McDonald, A.J.; Kumar, A.; Poonia, S.P.; Kumar, V.; Ajay, A.; Kumar, A.; et al. Inter-comparison of crop establishment methods for improving yield and profitability in the rice-wheat system of Eastern India. Field Crop Res. 2020, 250, 107776. [Google Scholar] [CrossRef]
- Jehangir, I.A.; Hussain, A.; Sofi, N.R.; Wani, S.H.; Ali, O.M.; Abdel Latef, A.A.H.; Raja, W.; Bhat, M.A. Crop establishment methods and weed management practices affect grain yield and weed dynamics in temperate rice. Agronomy 2021, 11, 2137. [Google Scholar] [CrossRef]
- Singh, V.P.; Singh, A.P.; Dhyani, V.C.; Banga, A.; Kumar, K.; Satyawali; Bisht, N. Weed management in direct seeded rice. Indian J. Weed Sci. 2016, 48, 233–246. [Google Scholar] [CrossRef]
- Bamji, M.S.; Nair, K.M. Food-based approach to combat micronutrient deficiencies. Proc. Indian Natl. Sci. Acad. 2016, 82, 1529–1540. [Google Scholar] [CrossRef]
- Prasad, R.; Shivay, Y.S. Agronomic biofortification of plant foods with minerals, vitamins and metabolites with chemical fertilizers and liming. J. Plant Nutr. 2020, 43, 1534–1554. [Google Scholar] [CrossRef]
- Lonnerdal, B. Dietary factors influencing zinc absorption. J. Nutr. 2000, 130, 1378S–1383S. [Google Scholar] [CrossRef]
- Sharma, P.K.; Ladha, J.K.; Bhushan, L. Soil physical effects of puddling in rice-wheat cropping systems. In Improving the Productivity and Sustainability of Rice-Wheat Systems: Issues and Impacts; Ladha, J.K., Hill, J.E., Duxbury, J.M., Gupta, R.K., Buresh, R.J., Eds.; ASA Special Publications: Madison, WI, USA, 2003; Volume 65. [Google Scholar] [CrossRef]


| Method of Cultivation | Method of Sowing | Seed Rate (kg ha−1) | Spacing (cm) | Age of Seedling | Seedling hill−1 | Land Preparation | Water Management | Number of Irrigation | Depth of Irrigation | Weed Management | Nutrient Application Method and Timing |
|---|---|---|---|---|---|---|---|---|---|---|---|
| PTR | Transplanting (manual) | 20 | 20 × 15 | 23–25 days old | 2–3 | One ploughing, one harrowing and puddling twice | 5 cm water applied at each irrigation; puddled and saturated | 11 in first year and 18 in second year | 5 cm puddled saturated | Two hand weeding in each crop | Broadcasting; 1/3 at 5 DAT, 1/3 at 25 days after transplanting (DAT) and 1/3 at 55 DAT for N; All dose of P, K and Zn at 5 DAT |
| SRI | Transplanting (manual) | 5 | 20 × 20 | 13–14 days old | 1 | One ploughing, one harrowing and puddling twice | 2 cm up to panicle initiation and 5 cm thereafter | 11 in first year and 20 in second year | 2 cm up to panicle initiation and 5 cm thereafter | Two hand weeding in each crop | Broadcasting; 1/3 at 5 DAT, 1/3 at 25 DAT and 1/3 at 55 DAT for N; All dose of P, K and Zn at 5 DAT |
| ARS | Direct sowing of seed in main field | 60 | 20 cm row to row | Direct sowing of seed in field | - | One ploughing followed by harrowing | 2 cm to maintain field capacity moisture level, non-saturated and non-puddled | 10 in first year and 24 in second year | 2 cm to maintain field capacity moisture level, non-saturated and non-puddled | Three hand weeding in each crop | Broadcasting; 1/3 at sowing, 1/3 at 30 days after sowing (DAS) and 1/3 at 60 DAS for N; All dose of P, K and Zn at sowing |
| Method of Cultivation | Method of Sowing | Seed Rate (kg ha−1) | Spacing | Land Preparation | Water Management | Weed Management | Nutrient Application Method and Timing |
|---|---|---|---|---|---|---|---|
| CDW | Sowing through seed drill | 100 | 22.5 cm row to row | One ploughing followed by one harrowing and planking | Four and six irrigations at critical growth stages in first and second year, respectively, in all CEMs | Two hand weeding in each crop at 20 and 40 days after sowing (DAS) in all CEMs | Broadcasting; 1/3 at sowing, 1/3 at 30 DAS and 1/3 at 60 DAS for N; All dose of P, K and Zn at sowing |
| SWI | Dibbling of seeds (manual) | 30 | 20 cm × 20 cm | One ploughing followed by one harrowing and planking | |||
| ZTW | Sowing through seed drill | 120 | 22.5 cm row to row | Direct sowing without cultivation |
| S. No. | Input Used | Energy Equivalent (MJ Unit−1) |
|---|---|---|
| 1. | Human labour | 1.96 |
| 2. | Diesel (per litre) | 56.31 |
| 3. | Farm machinery | 62.7 |
| 4. | Fertilizer (Nitrogen MJ kg−1 N) | 60.60 |
| 5. | Fertilizer (Phosphorus MJ kg−1 N) | 11.2 |
| 6. | Fertilizer (Potassium MJ kg−1 N) | 6.7 |
| 7. | Fertilizer (Zinc Sulphate Heptahydrate MJ kg−1 N) | 20.2 |
| 8. | Electricity (per unit) | 11.93 |
| 9. | Rice and wheat grain (MJ kg−1) | 14.7 |
| 10. | Rice and wheat straw (MJ kg−1) | 12.5 |
| Particular | Direct Energy (MJ ha−1) | Total Direct Energy | Indirect Energy (MJ ha−1) | Total Indirect Energy (MJ ha−1) | Grand Total (MJ ha−1) | ||||||
|---|---|---|---|---|---|---|---|---|---|---|---|
| Renewable | Non-Renewable | Renewable | Non-Renewable | ||||||||
| Human Labour | Diesel | Electricity | Total | Seed | Fertilizers | Machinery | Total | ||||
| Energy requirement in puddled transplanted rice (PTR) for RDN + Zn | |||||||||||
| Field preparation | 139.2 | 3350.4 | - | 3350.4 | 3489.6 | - | - | 328.9 | 328.9 | 328.9 | 3818.5 |
| Seed and sowing | 341 | - | - | - | 341.0 | 294 | - | - | - | 294 | 635 |
| Fertilization | 41.2 | - | - | - | 41.2 | - | 9047 | - | 9047 | 9047 | 9088.2 |
| Inter-cultural operation | 270.5 | - | - | - | 270.5 | - | - | - | - | - | 270.5 |
| Irrigation | 173.5 | - | 1371.9 | 1371.9 | 1545.4 | - | - | 34.02 | 34.02 | 34.02 | 1579.4 |
| Harvesting | 305.8 | - | - | - | 305.8 | - | - | - | - | - | 305.8 |
| Total | 1271.2 | 3350.4 | 1371.9 | 4722.3 | 5993.5 | 294 | 9047 | 362.9 | 9409.9 | 9703.9 | 15,697.4 |
| Energy requirement in system of rice intensification (SRI) for RDN + Zn | |||||||||||
| Field preparation | 100.9 | 3054.8 | - | 3054.8 | 3155.7 | - | - | 299.9 | 299.9 | 299.9 | 3455.6 |
| Seed and sowing | 341.0 | - | - | - | 341.0 | 88.2 | - | - | - | 88.2 | 429.2 |
| Fertilization | 41.2 | - | - | - | 41.2 | - | 8744 | - | 8744 | 8744 | 8785.2 |
| Inter-cultural operation | 270.5 | - | - | - | 270.5 | - | - | - | - | - | 270.5 |
| Irrigation | 109.4 | - | 1085.6 | 1085.6 | 1195.0 | - | - | 26.9 | 26.9 | 26.9 | 1221.9 |
| Harvesting | 305.8 | - | - | - | 305.8 | - | - | - | - | - | 305.8 |
| Total | 1168.8 | 3054.8 | 1085.6 | 4140.4 | 5309.2 | 88.2 | 8744 | 326.8 | 9070.8 | 9159 | 14,468.2 |
| Energy requirement in aerobic rice system (ARS) for RDN + Zn | |||||||||||
| Field preparation | 101.9 | 1970.8 | - | 1970.8 | 2072.7 | - | - | 191.2 | 191.2 | 191.2 | 2263.9 |
| Seed and sowing | 176.4 | - | - | - | 176.4 | 882 | - | - | - | 882 | 1058.4 |
| Fertilization | 35.28 | - | - | - | 35.28 | - | 8441.0 | - | 8441.0 | 8441.0 | 8475.3 |
| Inter-cultural operation | 329.3 | - | - | - | 329.3 | - | - | - | - | - | 329.3 |
| Irrigation | 94.1 | - | 1145.3 | 1145.3 | 1239.4 | - | - | 28.4 | 28.4 | 28.4 | 1267.8 |
| Harvesting | 258.7 | - | - | - | 258.7 | - | - | - | - | - | 258.7 |
| Total | 995.7 | 1970.8 | 1145.3 | 3116.1 | 4111.8 | 882 | 8441 | 219.6 | 8660.6 | 9542.6 | 13,654.4 |
| Particular | Direct Energy | Total Direct Energy | Indirect Energy | Total Indirect Energy | Grand Total | ||||||
|---|---|---|---|---|---|---|---|---|---|---|---|
| Renewable | Non-Renewable | Renewable | Non-Renewable | ||||||||
| Human Labour | Diesel | Electricity | Total | Seed | Fertilizers | Machinery | Total | ||||
| Energy requirement in conventional drill-sown wheat (CDW) for RDN + Zn | |||||||||||
| Field preparation | 76.44 | 1773.8 | - | 1773.8 | 1850.2 | - | - | 169 | 169 | 169 | 2019.2 |
| Seed and sowing | 176.4 | - | - | - | 176.4 | 1470 | - | - | - | 1470 | 1646.4 |
| Fertilization | 35.3 | - | - | - | 35.3 | - | 8441 | - | 8441 | 8441 | 8476.3 |
| Inter-cultural operation | 188.2 | - | - | - | 188.2 | - | - | - | - | - | 188.2 |
| Irrigation | 23.5 | - | 286.3 | 286.3 | 309.8 | - | - | 7.1 | 7.1 | 7.1 | 316.9 |
| Harvesting | 258.7 | - | - | - | 258.7 | - | - | - | - | - | 258.7 |
| Total | 758.5 | 1773.8 | 286.3 | 2060.1 | 2818.6 | 1470 | 8441 | 176.1 | 8617.1 | 10,087.1 | 12,905.7 |
| Energy requirement in system of wheat intensification (SWI) for RDN + Zn | |||||||||||
| Field preparation | 76.4 | 1773.7 | - | 1773.7 | 1850.2 | - | - | 169 | 169 | 169 | 2019.2 |
| Seed and sowing | 199.9 | - | - | - | 199.9 | 441 | - | - | - | 441 | 640.9 |
| Fertilization | 35.3 | - | - | - | 35.3 | - | 8441 | - | 8441 | 8441 | 8476.3 |
| Inter-cultural operation | 223.4 | - | - | - | 223.4 | - | - | - | - | - | 223.4 |
| Irrigation | 23.5 | - | 286.3 | 286.3 | 309.8 | - | - | 7.1 | 7.1 | 7.1 | 316.9 |
| Harvesting | 258.7 | - | - | - | 258.7 | - | - | - | - | - | 258.7 |
| Total | 817.2 | 1773.7 | 286.3 | 2060 | 2877.3 | 441 | 8441 | 176.1 | 8617.1 | 9058.1 | 11,935.4 |
| Energy requirement in zero-tillage wheat (ZTW) for RDN + Zn | |||||||||||
| Field preparation | 35.3 | - | - | - | 35.3 | - | - | - | - | - | 35.3 |
| Seed and sowing | 176.4 | - | - | - | 176.4 | 1764 | - | - | - | 1764 | 1940.4 |
| Fertilization | 35.3 | - | - | - | 35.3 | - | 8441 | - | - | 8441 | 8476.3 |
| Inter-cultural operation | 199.9 | - | - | - | 199.9 | - | - | - | - | - | 199.9 |
| Irrigation | 23.5 | - | 286.3 | 286.3 | 309.8 | - | - | 7.1 | 7.1 | 7.1 | 316.9 |
| Harvesting | 282.2 | - | - | - | 282.2 | - | - | - | - | - | 282.8 |
| Total | 752.6 | 00 | 286.3 | 286.3 | 1038.9 | 1764 | 8441 | 7.1 | 8448.1 | 10,212.1 | 11,251.6 |
| Treatment | Gross Energy (×103 MJ ha−1) | Net Energy (×103 MJ ha−1) | Energy tonne−1 of Grain (MJ tonne−1) | Protein Yield (kg ha−1) | ||||
|---|---|---|---|---|---|---|---|---|
| 2013 | 2014 | 2013 | 2014 | 2013 | 2014 | 2013 | 2014 | |
| Rice | ||||||||
| Puddled transplanted rice (PTR) | 151.2a | 149.4a | 137.8b | 134.9b | 3276a | 3629a | 246.5a | 229.1a |
| System of rice intensification (SRI) | 151.5a | 149.6a | 139.2a | 136.4a | 2961b | 3304b | 247.3a | 229.6a |
| Aerobic rice system (ARS) | 145.5b | 143.7b | 134.1c | 131.6c | 2875c | 3137c | 221.2b | 206.0b |
| Wheat | ||||||||
| Conventional drill-sown wheat (CDW) | 140.4b | 142.7b | 129.8b | 131.9b | 2421a | 2497a | 552.3b | 535.1b |
| System of wheat intensification (SWI) | 139.8b | 142.0b | 130.1b | 132.2b | 2208b | 2281b | 550.8b | 533.1b |
| Zero-tillage wheat (ZTW) | 148.4a | 150.2b | 139.4a | 141.1a | 1933c | 2007c | 639.1a | 621.4a |
| Rice–wheat cropping system | ||||||||
| Puddled transplanted rice (PTR)–conventional drill-sown wheat (CDW) | 291.7a | 292.1a | 267.6b | 266.8b | 2834a | 3039a | 798.8b | 764.3b |
| System of rice intensification (SRI)–system of wheat intensification (SWI) | 291.3a | 291.6a | 269.4b | 268.6b | 2573b | 2773b | 798.2b | 762.7b |
| Aerobic rice system (ARS)–zero-tillage wheat (ZTW) | 293.9a | 293.9a | 273.5a | 272.7a | 2366c | 2523c | 860.2a | 827.3a |
| Treatment | Gross Energy (×103 MJ ha−1) | Net Energy (×103 MJ ha−1) | Energy tonne−1 of Grain (MJ tonne−1) | Protein Yield (kg ha−1) | ||||
|---|---|---|---|---|---|---|---|---|
| 2013 | 2014 | 2013 | 2014 | 2013 | 2014 | 2013 | 2014 | |
| Puddled transplanted rice (PTR) | ||||||||
| Control | 129.6j | 127.0j | 121.9l | 118.4p | 2395l | 2842j | 161.0j | 144.2i |
| RDN * | 154.3cd | 152.0d | 138.7efg | 135.5ghij | 3704a | 4089a | 258.2de | 240.3d |
| RDN + Zn ** | 160.4a | 159.3a | 144.7ab | 142.6a | 3604ab | 3897b | 292.6a | 274.9a |
| 75% RDN | 144.9h | 144.0gh | 131.3i | 129.4m | 3515bc | 3825bc | 215.5gh | 202.7f |
| 75% RDN + Zn | 149.3f | 147.2e | 135.6h | 132.5kl | 3402cd | 3783c | 220.4fgh | 204.5ef |
| 75% RDN + MC1 | 153.2d | 150.8d | 139.6def | 136.2fghi | 3262efg | 3642d | 258.2de | 235.3d |
| 75% RDN + MC1 + Zn | 157.8ab | 156.3b | 144.1abc | 141.6abc | 3167gh | 3476e | 283.3ab | 267.6ab |
| 75% RDN + MC2 | 153.3d | 151.2d | 139.7def | 136.5efgh | 3262efg | 3623d | 254.6de | 235.1d |
| 75% RDN + MC2 + Zn | 158.1ab | 156.6b | 144.4ab | 141.9ab | 3174gh | 3487e | 274.6bcd | 257.7bc |
| System of rice intensification (SRI) | ||||||||
| Control | 131.4j | 128.7j | 125.0k | 121.3o | 1881m | 2293k | 172.6j | 155.5i |
| RDN * | 154.9cd | 152.6d | 140.6dc | 137.3defg | 3421cd | 3797bc | 259.8cde | 241.8d |
| RDN + Zn ** | 156.5bc | 155.4bc | 142.0bcd | 139.9bcd | 3324def | 3613d | 290.7ab | 273.1a |
| 75% RDN | 145.3gh | 144.5fg | 132.9i | 131.1lm | 3202fgh | 3510e | 208.8ghi | 196.4fg |
| 75% RDN + Zn | 150.0ef | 147.8e | 137.5fgh | 134.4hijk | 3096hi | 3467e | 222.1fg | 206.2ef |
| 75% RDN + MC1 | 153.8cd | 151.4d | 141.4cde | 138.0defg | 2972j | 3342f | 255.6de | 232.9d |
| 75% RDN + MC1 + Zn | 158.3ab | 156.8b | 145.8a | 143.3a | 2894jk | 3199gh | 276.4abc | 257.3bc |
| 75% RDN + MC2 | 153.9cd | 151.8d | 141.5cde | 138.4def | 2979ij | 3333f | 253.0de | 233.6d |
| 75% RDN + MC2 + Zn | 159.0ab | 157.4ab | 146.5a | 143.9a | 2876jk | 3181gh | 286.9ab | 269.5ab |
| Aerobic rice system (ARS) | ||||||||
| Control | 122.0k | 119.3k | 116.4m | 113.1q | 1737n | 2049l | 154.1k | 138.5j |
| RDN * | 149.2f | 146.9ef | 135.7h | 132.8kl | 3341de | 3637d | 232.8f | 216.1e |
| RDN + Zn ** | 154.6cd | 153.5cd | 140.9de | 139.2cde | 3269efg | 3484e | 261.9cde | 245.5cd |
| 75% RDN | 139.1i | 138.3i | 127.6j | 126.1n | 3118h | 3340f | 193.0i | 181.2h |
| 75% RDN + Zn | 143.8h | 141.7h | 132.2i | 129.4m | 2996ij | 3282fg | 204.2hi | 189.1gh |
| 75% RDN + MC1 | 147.8fg | 145.4efg | 136.2gh | 133.2jkl | 2900jk | 3191gh | 218.5fgh | 198.1fg |
| 75% RDN + MC1 + Zn | 152.4de | 150.9d | 140.7de | 138.6def | 2810k | 3037i | 251.0de | 243.3d |
| 75% RDN + MC2 | 148.0f | 145.9efg | 136.4gh | 133.6ijkl | 2894jk | 3168h | 220.9fgh | 203.3ef |
| 75% RDN + MC2 + Zn | 152.6de | 151.1d | 140.9de | 138.7def | 2814k | 3045i | 254.5de | 238.5d |
| Nutrient management | * | * | * | * | * | * | * | * |
| Interaction | * | * | * | * | * | * | * | * |
| Treatment | Gross Energy (×103 MJ ha−1) | Net Energy (×103 MJ ha−1) | Energy tonne−1 of Grain (MJ tonne−1) | Protein Yield (kg ha−1) | ||||
|---|---|---|---|---|---|---|---|---|
| 2013–2014 | 2014–2015 | 2013–2014 | 2014–2015 | 2013–2014 | 2014–2015 | 2013–2014 | 2014–2015 | |
| Conventional drill–wheat (CDW) | ||||||||
| Control | 119.9l | 120.2m | 115.1i | 115.2i | 1358m | 1439m | 340.7h | 312.6k |
| RDN * | 143.8defgh | 145.5defghi | 131.0defg | 132.5efgh | 2858a | 2956a | 583.3de | 561.5fg |
| RDN + Zn ** | 150.0abcde | 151.4abcdef | 137.1cde | 138.3cde | 2756b | 2858b | 647.8b | 624.9bcd |
| 75% RDN | 134.3jk | 138.0jkl | 123.5gh | 127.1h | 2590c | 2643d | 498.5f | 486.7i |
| 75% RDN + Zn | 135.6ijk | 139.4ijkl | 124.7fgh | 128.3gh | 2589c | 2641d | 503.3f | 496.2hi |
| 75% RDN + MC1 | 141.0fghijk | 144.3fghij | 130.1efg | 133.3efgh | 2469d | 2528e | 560.5e | 546.0g |
| 75% RDN + MC1 + Zn | 148.7cdefg | 150.2cdefg | 137.8cde | 139.2cde | 2360efg | 2449efg | 633.4bc | 612.0bcde |
| 75% RDN + MC2 | 142.1efghij | 145.3defghi | 131.2defg | 134.3defg | 2450de | 2510ef | 565.8e | 555.9g |
| 75% RDN + MC2 + Zn | 148.6cdefg | 149.9cdef | 137.6cde | 138.8cde | 2360efg | 2453efg | 637.8b | 620.4bcd |
| System of wheat intensification (SWI) | ||||||||
| Control | 123.8l | 124.2m | 119.9hi | 120.2i | 1028n | 1103n | 355.3h | 326.0k |
| RDN * | 143.0defghi | 144.6efghij | 131.2defg | 132.7efgh | 2656c | 2750c | 580.1e | 557.9g |
| RDN + Zn ** | 148.5cdefg | 149.7cdefgh | 136.5cde | 137.7cde | 2575c | 2675cd | 642.8b | 619.4bcd |
| 75% RDN | 133.3k | 137.0kl | 123.4gh | 127.0h | 2376ef | 2428fg | 497.0f | 484.8i |
| 75% RDN + Zn | 135.4ijk | 139.2ijkl | 125.5fgh | 129.1gh | 2362efg | 2413gh | 505.0f | 497.5hi |
| 75% RDN + MC1 | 139.3hijk | 142.6hijk | 129.4efg | 132.5efgh | 2275gh | 2333hij | 554.7e | 539.7gh |
| 75% RDN + MC1 + Zn | 147.2defgh | 148.7defgh | 137.3cde | 138.6cde | 2172i | 2258j | 628.9bcd | 607.0bcdef |
| 75% RDN + MC2 | 140.6ghijk | 143.8ghijk | 130.7defg | 133.8defgh | 2254hi | 2312ij | 560.8e | 550.5g |
| 75% RDN + MC2 + Zn | 147.2defgh | 148.5defgh | 137.3cde | 138.4cde | 2170i | 2260j | 632.8bc | 615.0bcde |
| Zero-tillage wheat (ZTW) | ||||||||
| Control | 133.2k | 133.3l | 130.1efg | 130.0fgh | 786o | 853o | 436.3g | 405.5j |
| RDN * | 150.8abcd | 152.1abcd | 139.7abc | 140.7bcd | 2373ef | 2466efg | 666.1b | 643.6bc |
| RDN + Zn ** | 157.3a | 158.2a | 146.1ab | 146.8ab | 2291fgh | 2388ghi | 737.2a | 713.4a |
| 75% RDN | 141.5fghij | 144.8defghij | 132.3cdef | 135.5cdefg | 2082j | 2139k | 583.0de | 571.3efg |
| 75% RDN + Zn | 143.0defghi | 146.4defghi | 133.8cde | 137.0cdef | 2083j | 2139k | 589.2cde | 582.5defg |
| 75% RDN + MC1 | 148.2cdefg | 151.1bcdefg | 139.0bcd | 141.7abc | 1991k | 2052l | 642.6b | 628.1bc |
| 75% RDN + MC1 + Zn | 155.6abc | 156.7abc | 146.3ab | 147.2ab | 1914kl | 1998l | 719.8a | 697.7a |
| 75% RDN + MC2 | 148.9bcdef | 151.8abcde | 139.7abc | 142.4abc | 1980kl | 2042l | 647.0b | 637.3bc |
| 75% RDN + MC2 + Zn | 156.6ab | 157.6ab | 147.3a | 148.1ab | 1900l | 1986l | 730.8a | 712.8a |
| LSD (p= 0.05) | 4.05 | 3.58 | 4.05 | 3.58 | 48.4 | 45.4 | 47.6 | 45.5 |
| Nutrient management | * | * | * | * | * | * | * | * |
| Interaction | * | * | * | * | * | * | * | * |
| Treatment | Gross Energy (×103 MJ ha−1) | Net Energy (×103 MJ ha−1) | Energy tonne−1 of Grain (MJ tonne−1) | Protein Yield (kg ha−1) | ||||
|---|---|---|---|---|---|---|---|---|
| 2013 | 2014 | 2013 | 2014 | 2013 | 2014 | 2013–2014 | 2014–2015 | |
| PTR–CDW | ||||||||
| Control | 249.5k | 247.2g | 237.0j | 233.6l | 1847k | 2092o | 501.7l | 456.7m |
| RDN * | 298.2cdef | 297.5c | 269.8def | 268.0fghi | 3268a | 3500a | 841.5fgh | 801.8ghi |
| RDN + Zn ** | 310.4a | 310.7a | 281.8abc | 280.9abc | 3164b | 3360b | 940.5abcd | 899.9bcd |
| 75% RDN | 279.2j | 282.1f | 254.7h | 256.5j | 3035c | 3209cd | 714.0j | 689.5k |
| 75% RDN + Zn | 284.9ij | 286.6f | 260.3gh | 260.8ij | 2986c | 3190cd | 723.6ij | 700.7jk |
| 75% RDN + MC1 | 294.2fgh | 295.1cd | 269.7def | 269.5efgh | 2856de | 3063ef | 818.7ghi | 781.3hi |
| 75% RDN + MC1 + Zn | 306.5abc | 306.6a | 281.8abc | 280.8abc | 2750efg | 2945ghi | 916.7cde | 879.6def |
| 75% RDN + MC2 | 295.4fg | 296.5c | 270.9def | 270.9defgh | 2844def | 3043efg | 820.3ghi | 791.0ghi |
| 75% RDN + MC2 + Zn | 306.7abc | 306.5a | 282.0abc | 280.7abc | 2753efg | 2952ghi | 912.4cde | 878.1def |
| SRI–SWI | ||||||||
| Control | 255.2k | 252.9g | 244.9ij | 241.5k | 1433l | 1662p | 527.9l | 481.5m |
| RDN * | 297.9cdef | 297.3c | 271.7def | 269.9defgh | 3027c | 3254c | 839.9fhg | 799.7ghi |
| RDN + Zn ** | 304.9abcde | 305.1ab | 278.5bcd | 277.6bcd | 2938cd | 3131de | 933.6bcd | 892.5cde |
| 75% RDN | 278.6j | 281.4f | 256.3h | 258.1j | 2775efg | 2947ghi | 705.8j | 681.2k |
| 75% RDN + Zn | 285.4hij | 287.0ef | 263.0fgh | 263.4hij | 2721g | 2920hi | 727.1ij | 703.6jk |
| 75% RDN + MC1 | 293.1fghi | 294.0cde | 270.8def | 270.5defgh | 2617h | 2820j | 810.3ghi | 772.7hi |
| 75% RDN + MC1 + Zn | 305.5cdef | 305.5ab | 283.0abc | 281.9ab | 2522h | 2714kl | 905.4de | 864.3def |
| 75% RDN + MC2 | 294.5fg | 295.6c | 272.2def | 272.2defg | 2607h | 2803jk | 813.8ghi | 784.1hi |
| 75% RDN + MC2 + Zn | 306.2abcd | 305.9ab | 283.7abc | 282.3ab | 2514hi | 2708kl | 919.7cde | 884.5def |
| ARS–ZTW | ||||||||
| Control | 255.2k | 252.6g | 246.5i | 243.1k | 1207m | 1376q | 590.4k | 544.1l |
| RDN * | 300.1bcdef | 299.0bc | 275.4cde | 273.5cdefg | 2821efg | 3005fgh | 898.9def | 859.7defg |
| RDN + Zn ** | 311.9a | 311.7a | 287.0ab | 286.0a | 2740fg | 2894j | 999.1a | 958.9a |
| 75% RDN | 280.6j | 283.1f | 259.9gh | 261.6ij | 2556h | 2687l | 776.0i | 752.5ij |
| 75% RDN + Zn | 286.9ghij | 288.1def | 265.9efg | 266.4ghi | 2509hi | 2664m | 793.4h | 771.6hi |
| 75% RDN + MC1 | 296.0def | 296.5c | 275.2cde | 274.9bcdef | 2413ij | 2572n | 861.1efg | 826.2fgh |
| 75% RDN + MC1 + Zn | 308.0ab | 307.6a | 287.0ab | 285.9a | 2328j | 2478n | 970.9abc | 941.0abc |
| 75% RDN + MC2 | 296.9def | 297.6c | 276.2cd | 276.1bcde | 2404j | 2557n | 867.9efg | 840.5efg |
| 75% RDN + MC2 + Zn | 309.2ab | 308.7a | 288.3a | 286.9a | 2320j | 2473n | 985.3ab | 951.4ab |
| LSD (p = 0.05) | 4.77 | 3.93 | 4.77 | 3.93 | 58.6 | 54.2 | 61.3 | 55.7 |
| Nutrient management | * | * | * | * | * | * | * | * |
| Interaction | * | * | * | * | * | * | * | * |
| Treatment | Zn Uptake (g ha−1) | Fe Uptake (g ha−1) | Cu Uptake (g ha−1) | Mn Uptake (g ha−1) | ||||
|---|---|---|---|---|---|---|---|---|
| 2013 | 2014 | 2013 | 2014 | 2013 | 2014 | 2013 | 2014 | |
| Rice | ||||||||
| Puddled transplanted rice (PTR) | 38.3a | 30.2a | 206.0a | 184.9a | 17.0a | 12.5a | 21.4a | 17.1a |
| System of rice intensification (SRI) | 38.8a | 30.3a | 208.1a | 187.8a | 17.1a | 12.8a | 21.5a | 17.2a |
| Aerobic rice system (ARS) | 32.8b | 25.8b | 182.5b | 165.3b | 13.8b | 10.1b | 18.0a | 15.1b |
| LSD (p = 0.05) | 0.55 | 0.45 | 3.09 | 4.86 | 0.80 | 0.70 | 0.57 | 0.63 |
| Wheat | ||||||||
| Conventional drill-sown wheat (CDW) | 154.5b | 138.1b | 418.7b | 400.6b | 21.6b | 18.5b | 126.3b | 115.2b |
| System of wheat intensification (SWI) | 154.3b | 138.7b | 418.3b | 401.2b | 22.2b | 18.9b | 127.1b | 116.3b |
| Zero-tillage wheat (ZTW) | 183.6a | 167.1a | 475.8a | 451.0a | 31.1a | 26.8a | 155.1a | 143.4a |
| LSD (p = 0.05) | 1.96 | 1.82 | 8.93 | 7.74 | 1.88 | 1.67 | 5.07 | 4.90 |
| Treatment | Zn Uptake (g ha−1) | Fe Uptake (g ha−1) | Cu Uptake (g ha−1) | Mn Uptake (g ha−1) | ||||
|---|---|---|---|---|---|---|---|---|
| 2013 | 2014 | 2013 | 2014 | 2013 | 2014 | 2013–2014 | 2014–2015 | |
| PTR–CDW | ||||||||
| Control | 18.94k | 15.15o | 133.3kl | 113.7n | 5.70k | 4.23j | 9.18l | 6.69j |
| RDN * | 40.66cd | 31.77ef | 216.1cd | 194.7def | 18.35abc | 13.49abcde | 22.86abcde | 18.29abcde |
| RDN + Zn ** | 42.22ab | 35.96a | 232.2a | 210.5ab | 19.89a | 14.95a | 25.03a | 20.15a |
| 75% RDN | 34.22gh | 27.05ij | 189.6fgh | 171.9hij | 15.95efgh | 12.04cdefg | 20.26efghi | 16.31efghi |
| 75% RDN + Zn | 35.67fg | 27.72i | 194.0fgh | 175.0hi | 16.19defgh | 11.69efg | 20.44defgh | 16.21efghi |
| 75% RDN + MC1 | 41.32c | 32.61de | 219.5bc | 195.6def | 18.97abc | 13.91ab | 23.51abcd | 18.81abcd |
| 75% RDN + MC1 + Zn | 44.58ab | 35.40ab | 228.2ab | 207.1abc | 19.89a | 14.57a | 24.54ab | 20.01ab |
| 75% RDN + MC2 | 40.60c | 32.20ef | 217.0bcd | 194.9def | 18.49abc | 13.56abcd | 23.21abcd | 18.44abcde |
| 75% RDN + MC2 + Zn | 43.55b | 33.84cd | 223.8abc | 200.6cd | 19.14ab | 14.01ab | 23.66abcd | 18.98abcd |
| SRI–SWI | ||||||||
| Control | 20.7k | 16.44n | 144.1k | 124.5m | 6.74k | 5.16j | 10.19l | 7.45j |
| RDN * | 41.11cd | 31.85ef | 219.4bc | 199.1cd | 18.26abcd | 13.63abcd | 22.95abcde | 18.34abcde |
| RDN + Zn ** | 45.15ab | 35.63a | 231.9a | 211.7a | 19.66a | 15.03a | 24.78ab | 19.93ab |
| 75% RDN | 33.45h | 26.22jk | 184.5hi | 168.5ij | 15.52ghi | 11.95defg | 19.69ghijk | 15.84fghi |
| 75% RDN + Zn | 37.67e | 29.31h | 197.8efg | 179.8gh | 17.80abcdef | 13.43abcde | 22.08bcdefg | 17.73bcdefg |
| 75% RDN + MC1 | 41.03cd | 32.09ef | 218.8bc | 196.3de | 18.54abc | 13.80abc | 23.05abcd | 18.40abcde |
| 75% RDN + MC1 + Zn | 43.92ab | 34.15bc | 224.1abc | 201.8bcd | 19.51a | 14.27ab | 24.06abcd | 19.34abc |
| 75% RDN + MC2 | 40.38c | 31.72ef | 217.1bcd | 196.4de | 18.04abcde | 13.41abcde | 22.76abcdef | 18.02abcdef |
| 75% RDN + MC2 + Zn | 45.42a | 35.00abc | 235.0a | 212.5a | 19.54a | 14.48a | 24.28abc | 19.43abc |
| ARS–ZTW | ||||||||
| Control | 16.86l | 13.54p | 123.5l | 106.1n | 5.02k | 3.65j | 8.19l | 6.49j |
| RDN * | 35.76fg | 27.84i | 194.3fgh | 176.1hi | 15.72fgh | 11.43fg | 20.05fghij | 16.79defgh |
| RDN + Zn ** | 39.41d | 31.25efg | 206.2de | 188.0efg | 16.86cdefg | 12.56bcdef | 21.67cdefg | 18.23abcde |
| 75% RDN | 28.45j | 22.73m | 166.1j | 151.5l | 12.99j | 9.64hi | 16.99k | 14.29i |
| 75% RDN + Zn | 31.01i | 23.91lm | 175.6ij | 159.4kl | 13.36j | 9.39i | 17.45jk | 14.44i |
| 75% RDN + MC1 | 32.44hi | 25.24kl | 183.6hi | 164.2jk | 13.58ij | 9.49i | 17.63ijk | 14.55hi |
| 75% RDN + MC1 + Zn | 37.38ef | 30.25gh | 199.7ef | 187.3fg | 15.61fghi | 11.36fgh | 19.93ghij | 17.36cdefg |
| 75% RDN + MC2 | 33.61h | 26.45ijk | 187.2gh | 168.9ij | 14.48hij | 10.33ghi | 18.80hijk | 15.52ghi |
| 75% RDN + MC2 + Zn | 39.74cd | 30.84fg | 206.0de | 185.9g | 17.25bcdefg | 12.59bcdef | 21.63cdefg | 18.21abcde |
| LSD (p = 0.05) | 1.84 | 1.45 | 11.4 | 8.7 | 2.13 | 1.83 | 2.73 | 2.32 |
| Nutrient management treatments | * | * | * | * | * | * | * | * |
| Interactions | * | * | * | * | * | * | * | * |
| Treatment | Zn Uptake (g ha−1) | Fe Uptake (g ha−1) | Cu Uptake (g ha−1) | Mn Uptake (g ha−1) | ||||
|---|---|---|---|---|---|---|---|---|
| 2013–2014 | 2014–2015 | 2013–2014 | 2014–2015 | 2013–2014 | 2014–2015 | 2013–2014 | 2014–2015 | |
| PTR–CDW | ||||||||
| Control | 81.6k | 70.5k | 263.9k | 249.0j | 61.5j | 55.4h | 12.5j | 10.4j |
| RDN * | 163.0fgh | 145.1g | 442.3fg | 422.4efgh | 137.9fg | 125.1cd | 23.1fgh | 19.9fgh |
| RDN + Zn ** | 186.1cde | 163.4d | 469.8de | 446.1d | 148.7ef | 133.9cd | 25.0def | 21.5de |
| 75% RDN | 173.3i | 127.8i | 394.0b | 381.4i | 114.3h | 106.8f | 19.9hi | 17.2gh |
| 75% RDN + Zn | 140.1i | 128.9i | 401.9h | 386.7i | 115.2h | 107.3f | 19.9hi | 16.7hi |
| 75% RDN + MC1 | 158.8gh | 142.2gh | 432.0g | 416.8h | 133.8g | 122.8cd | 22.7fgh | 19.4fgh |
| 75% RDN + MC1 + Zn | 181.1e | 160.2def | 463.7ef | 441.4de | 144.4fg | 130.1cd | 24.3defgh | 21.4def |
| 75% RDN + MC2 | 160.1gh | 143.7g | 435.8g | 420.7fgh | 136.1g | 123.7cd | 22.9fgh | 19.1fh |
| 75% RDN + MC2 + Zn | 182.8de | 161.2de | 465.1e | 441.3de | 145.3fg | 131.6cd | 24.2efgh | 21.3defg |
| SRI–SWI | ||||||||
| Control | 86.5k | 75.6k | 273.3j | 258.9j | 66.3j | 60.4h | 15.5i | 13.0ij |
| RDN * | 162.0fgh | 145.1g | 442.9fg | 423.9efgh | 137.9fg | 125.6cd | 23.0fgh | 19.5fgh |
| RDN + Zn ** | 184.5de | 162.8d | 467.3e | 444.7d | 148.3ef | 134.0c | 25.0def | 21.4def |
| 75% RDN | 136.8i | 128.2i | 394.7h | 383.0i | 114.8h | 107.7f | 20.2gh | 17.4fgh |
| 75% RDN + Zn | 142.7i | 132.3i | 403.8h | 389.5i | 118.7h | 111.1ef | 22.6fgh | 19.3fgh |
| 75% RDN + MC1 | 156.9h | 141.3gh | 429.1g | 414.8h | 133.2g | 122.5de | 22.4fgh | 18.9fgh |
| 75% RDN + MC1 + Zn | 179.9e | 160.1def | 458.8e | 437.7defg | 144.5fg | 130.6cd | 24.7defg | 21.5ef |
| 75% RDN + MC2 | 158.3gh | 142.9g | 433.6g | 419.5gh | 135.4g | 123.4cd | 22.5fgh | 18.5fgh |
| 75% RDN + MC2 + Zn | 180.8e | 160.3def | 461.6ef | 438.8def | 144.5fg | 131.3cd | 23.7fgh | 20.5efgh |
| ARS–ZTW | ||||||||
| Control | 111.6j | 99.8j | 320.8i | 299.8i | 90.5i | 83.4g | 23.2fgh | 19.7fhg |
| RDN * | 192.6c | 174.6c | 501.3bc | 474.5bc | 167.5bcd | 154.1ab | 33.4ab | 28.9ab |
| RDN + Zn ** | 217.9a | 194.8a | 528.2a | 497.2a | 179.9a | 164.3a | 35.7a | 30.9a |
| 75% RDN | 164.4fg | 155.4f | 450.5efg | 431.8defgh | 141.4fg | 133.7cd | 28.9bcd | 25.1bcd |
| 75% RDN + Zn | 167.3f | 156.4ef | 458.8f | 437.2defg | 142.2fg | 134.0c | 28.6cde | 24.3cde |
| 75% RDN + MC1 | 185.2de | 163.7d | 490.3cd | 468.5c | 160.2cde | 148.7b | 29.8bc | 25.3bcd |
| 75% RDN + MC1 + Zn | 209.9b | 188.9b | 515.8ab | 486.6abc | 172.8abc | 157.8ab | 32.9abc | 28.8ab |
| 75% RDN + MC2 | 187.9cd | 171.6c | 493.4c | 471.8c | 164.0cd | 151.1b | 31.6abc | 26.6bc |
| 75% RDN + MC2 + Zn | 216.1ab | 194.1ab | 522.9ab | 491.8ab | 177.8ab | 163.3a | 35.8a | 31.6a |
| Nutrient management treatments | * | * | * | * | * | * | * | * |
| Interactions | * | * | * | * | * | * | * | * |
Publisher’s Note: MDPI stays neutral with regard to jurisdictional claims in published maps and institutional affiliations. |
© 2022 by the authors. Licensee MDPI, Basel, Switzerland. This article is an open access article distributed under the terms and conditions of the Creative Commons Attribution (CC BY) license (https://creativecommons.org/licenses/by/4.0/).
Share and Cite
Shahane, A.A.; Shivay, Y.S.; Prasanna, R.; Kumar, D.; Bana, R.S. Effect of Crop Establishment Methods and Microbial Inoculations on Augmenting the Energy Efficiency and Nutritional Status of Rice and Wheat in Cropping System Mode. Sustainability 2022, 14, 5986. https://doi.org/10.3390/su14105986
Shahane AA, Shivay YS, Prasanna R, Kumar D, Bana RS. Effect of Crop Establishment Methods and Microbial Inoculations on Augmenting the Energy Efficiency and Nutritional Status of Rice and Wheat in Cropping System Mode. Sustainability. 2022; 14(10):5986. https://doi.org/10.3390/su14105986
Chicago/Turabian StyleShahane, Amit Anil, Yashbir Singh Shivay, Radha Prasanna, Dinesh Kumar, and Ram Swaroop Bana. 2022. "Effect of Crop Establishment Methods and Microbial Inoculations on Augmenting the Energy Efficiency and Nutritional Status of Rice and Wheat in Cropping System Mode" Sustainability 14, no. 10: 5986. https://doi.org/10.3390/su14105986
APA StyleShahane, A. A., Shivay, Y. S., Prasanna, R., Kumar, D., & Bana, R. S. (2022). Effect of Crop Establishment Methods and Microbial Inoculations on Augmenting the Energy Efficiency and Nutritional Status of Rice and Wheat in Cropping System Mode. Sustainability, 14(10), 5986. https://doi.org/10.3390/su14105986