1. Introduction
As industrialization and urbanization in China keep expanding, more and more old buildings are demolished, leading to the generation of a large amount of construction waste and worsening of environmental pollution. Sung et al. [
1] believed that building demolition is one of the most common activities in the construction industry. Several demolition techniques are commonly used, including mechanical demolition, deconstruction, and hybrid demolition. Although deconstruction has been advocated for its environmentally friendly approaches, it is very rarely practical. Demolition of buildings creates a pile of waste that is mainly destined to landfills [
2]. Dust is often a headache during quarrying and construction demolition, and the best strategy for dealing with it today is to turn it into a usable resource for recycling. One of the most common waste disposal methods is to use the waste concrete as bulk fill material. Statistics in China show that construction waste has currently reached an alarming scale, which accounts for at least 30% to 40% of the total urban waste. With the acceleration of urbanization, urban construction waste will keep growing, which will have an impact on air pollution. Though recent years have witnessed a gradual improvement of China’s air quality, in regional areas, air pollution is still prevalent, of which particle pollution has become an increasingly severe problem. According to statistics of the environmental status report in 2020, a total number of 338 prefecture-level cities in China suffered from 2311 days of heavy pollution and 752 days of serious pollution, with PM2.5 and PM10 as the major pollutants, accounting for 74.2% and 20.4%, respectively. The current dust removal methods and processes include ventilation dust removal, dust suppression, and wet dust removal, among which ultrasonic fogging in wet dust removal is the most effective in reducing the health risk of workers. As a major source of particle pollution, construction dust, if well controlled, can most effectively control the atmospheric dust pollution.
Buildings emit a large amount of dust in the whole life cycle. Among them, construction dust accounts for more than 10% of the concentration of PM2.5 and PM10. The concentration of airborne suspended particulates in a demolition site is seven times higher that of a normal area. Therefore, reducing dust from demolition works is an important task in dealing with the haze weather experienced by many Chinese cities. With the worsening of environmental problems in China and the growing number of construction projects, environmental pollution treatment has been a top priority for the construction industry, as well as the government. Complying with such regulations comes with a huge cost tag as demonstrated by this study: within an eight-year period, dust treatment costs tripled in Nanchang City.
To accelerate the improvement of environmental air quality and return to blue skies in China, control of construction dust pollution has been one of the top priorities. In the recent past, Chinese governments at different levels, from national to local authority, introduced several regulations to improve air quality and overcame the notorious haze pollution problem faced by some of their major cities. Haze pollution control became a national priority due to widespread media attention and growing concerns among citizens regarding poor urban air quality. To comply with these stringent regulations, demolition contractors used various dust treatment measures in their sites. These measures undoubtedly impacted the cost of the demolition projects. Nevertheless, due to fierce competition in the current construction market and the meager profits from demolition projects, demolition contractors found it very hard to cope with the increasing regulatory pressure. Therefore, the cost of dust treatment should be considered very seriously by demolition contractors, as well as the government agencies who are very keen to see the regulatory measures become successful.
In the above context, China lacks not only in-depth research into the control and treatment of construction dust caused by ever increasing building demolition, but also research into dust treatment costs. On the premise that demolition contractors internalize their cost of regulatory compliance, and at the basis of relevant construction dust control standards, this study presents a comprehensive construction dust treatment cost analysis of building demolition. The single function residual identifiability (SFRI) GM (1, 1) prediction model is used to predict the average unit area dust treatment cost of demolition operations, and the prediction accuracy is decomposed through statistical and quantitative analysis to establish a comprehensive dust treatment cost prediction model to achieve effective control of treatment costs. This will help to plan future demolition operations and help the government understand the financial impact of regulation.
2. Literature Review of Construction Dust Pollution Treatment Cost
Construction dust pollution refers to pollution caused by the discharge of dust particles during construction and demolition operations into the surrounding environment, thus influencing the atmospheric environment. In recent years, studies on haze based on the influence of inorganic aerosols, metal elements, and nitrogen components have been increasing [
3]. There are many comprehensive academic studies on the formation mechanism of haze and the treatment technology. At present, many studies use decomposition technology to decompose the influencing factors of atmospheric pollution emission, emission intensity, and reduction [
4]. Inorganic dust can be used as a photocatalyst for the formation of secondary inorganic aerosols [
5]. In the season of high haze occurrence, building construction dust should be restricted, and urban air spray or road water spraying has a significant effect on the removal of fogging, which have been widely used in large- and medium-sized cities.
Lu et al. [
6]. found that unreasonable disposal of materials is mainly attributable to pollution, and that other factors, including lack of urban monitoring and citizens’ lack of awareness of environmental protection, have also aggravated urban dust pollution. In order to fully implement measures that prevent and control raised dust, multi-agency cooperation is necessary to ensure joint law enforcement. In most Chinese cities, however, many agencies have not yet geared toward joint law enforcement. The phenomenon that agencies pass the buck to each other has impeded the efforts to prevent and control dust pollution caused by construction and demolition activities [
7]. In 2018, Xuancheng City established a ledger for construction site inspection in order to maintain quality and safety, which also included standardizing construction dust treatment. Water suppression to mitigate the spread of dust is the most popular and a universal method to deal with construction dust [
8]. However, countries or regions that experience water shortage find this technique to be expensive and morally incorrect. Maintaining standard heights for stockpiling, wetting objects before cutting or grinding, and wetting while sweeping are very simple methods to control some of the dust generated at sites. The use of chemical agents, electrical sweepers, dust screens, local exhaust ventilation, etc., are some technologies that are available for construction companies to manage dust pollution [
9,
10,
11].
The above dust control measures impose a huge financial burden on the demolition contractor. In view of the ever-increasing competition and very small profit margins of contractors, Lin [
12] adopted a more reasonable management model and method to achieve the unification of responsibilities, rights, and interests by improving the management efficiency to bring down the management cost of a project. Cost management and control strategies of construction companies have been playing an increasingly important role in the construction process, and the project cost management of construction companies is an organically connected and mutually restricted process. It is necessary to build a documented project cost management model for enhanced decision-making. Based on the grey theory and fitting consistency, Shao et al. [
13] established the GM-Verhulst-SCGM combined grey prediction model to predict the business cost. In view of the complex nonlinear relationship among engineering construction factors, it is rather hard to accurately predict the engineering construction cost. Fan et al. [
14] built a model to reflect the fluctuation process of the unit product manufacturing cost, verified whether the unit product manufacturing cost was found with abnormal deviation, and used the model to predict the deviation process when the regular deviation appeared for any reason. Liu et al. [
15,
16] studied the spatial distribution and dispersion characteristics of construction dust based on CFD simulations and investigated the formation and dispersion mechanisms of dust. Zhang et al. [
17] studied the effectiveness and recycling of mixed recycled aggregates. Sojobi et al. [
18] investigated how to optimize the conditions of gas-solid carbonation of recycled aggregates using the linear weighted sum method.
The GM (1, 1) model can be used to conduct cost prediction and control of the fitting curve, thus obtaining more ideal statistical effects. In response to problems with the construction quality–cost prediction, Sun et al. [
19] established the radial-direction neural network prediction model for the construction quality–cost relationship and used the root-mean-square error to verify the model’s prediction accuracy. The prediction results coincide with the practical situations, and the prediction accuracy is high, so the model is suitable for construction quality–cost prediction. In a bid to effectively improve the company’s operation cost management under an uncertain environment, Liang et al. [
20] combined prediction technologies and fuzzy theory to build a fuzzy estimation model, which can quickly and accurately identify the reasonable engineering cost and develop the corresponding operation procedures. The construction quality and the environmental pollution prevention cost constitute a pair of autocorrelation models involving in a mutual game and using the correlated equilibrium game for cost analysis and engineering price control of environmental pollution prevention is of vital importance to the promotion of environmental protection [
21]. This study refers to the radial neural network prediction model of the construction quality–cost relationship established by Sun, further divides the prediction accuracy into four levels, and combines the fuzzy estimation model to establish a comprehensive dust control cost prediction model. Through statistical analysis and quantitative analysis, the treatment cost can be effectively controlled.
3. Model Building and Data
3.1. Dust Treatment Cost Prediction Model
Demolition construction dust cost prediction is to forecast the cost based on the historical data, and by using an experience summary, statistical analysis, and mathematical model. The dust pollution treatment cost is predicted and analyzed via scientific methods, and the dust treatment cost prediction model is built accordingly. Assume that the original sequence is as below:
Generally, the time sequence of original data cannot avoid many random factors, thus it is necessary to process the original data and weaken the random factors to facilitate model-building using the differential fitting method. Add
cumulatively to generate the sequence,
. According to
, differential equation of the GM (1, 1) model can be written as below:
where
b and
c are parameters to be confirmed, which can be identified using the least square method, and the parameter vector can be written as below:
where:
The prediction model can be obtained after the accumulation of differential equations:
Conduct derivation of the above equation to restore the prediction model of the original sequence:
When comparing the predicted value,
, of the original data array with the original data array,
, it is found that the accuracy is inadequate, and the prediction term is short. To improve the prediction accuracy, Single Function Residual Identifiability (SFRI) is carried out. The original data array,
, and the predicted array,
, constitute the following residual sequence:
The residual model GM (1, 1) can be obtained according to the above model-building method:
The residual model should modify numbers near the original point rather than modify all numbers; thus, generally, not all residuals are adopted for model-building. Instead, the residual that is larger in value and close to the original point is used. Hence, the prediction model after modification can be written as below:
where
, the modified model stands for the differential equation. The results after modification are related to the selection of
.
In this paper, the prediction accuracy is divided into four grades: unqualified, unsatisfactory, qualified, and good. The smaller the posteriori ratio and the larger the small error probability value is, the higher the prediction accuracy grade is. When the posterior difference ratio is
H ≥ 0.65 and the probability of small error is
p ≤ 0.75, the prediction accuracy can be considered as unqualified. When the posteriori ratio is
H < 0.65 and the small error probability is
p > 0.75, the prediction accuracy level can be considered as unsatisfactory. When the posterior difference ratio is
H < 0.50 and the small error probability is
p > 0.85, the prediction accuracy can be considered as qualified. When the posterior difference ratio is
H < 0.35 and the small error probability is
H > 0.95, the prediction accuracy level can be considered as good. In summary, the dust treatment cost prediction accuracy grades are shown in
Table 1.
Note: The posterior difference ratio is , and the small error probability is where the average of is , the variance is ; the average of the residual is , and the variance is .
3.2. Demolition Site Survey and Cost Data
In recent years, with the renovation of old buildings and the promotion of urbanization in Nanchang, the number of demolition projects has increased substantially. To remove haze, Nanchang government has adopted mandatory pollution control measures, requiring demolition projects to increase the frequency of sprinkling water to suppress dust on sites. The demolition sites selected for the survey meet the requirements of dust control expected from demolition projects without being warned or punished by the Environmental Protection Agency. To study the dust treatment costs in demolition projects, a total of 20 demolition sites in Nanchang city were taken as case studies, and details on demolition activities, the implementation of dust control measures, and the implementation costs were extracted (see
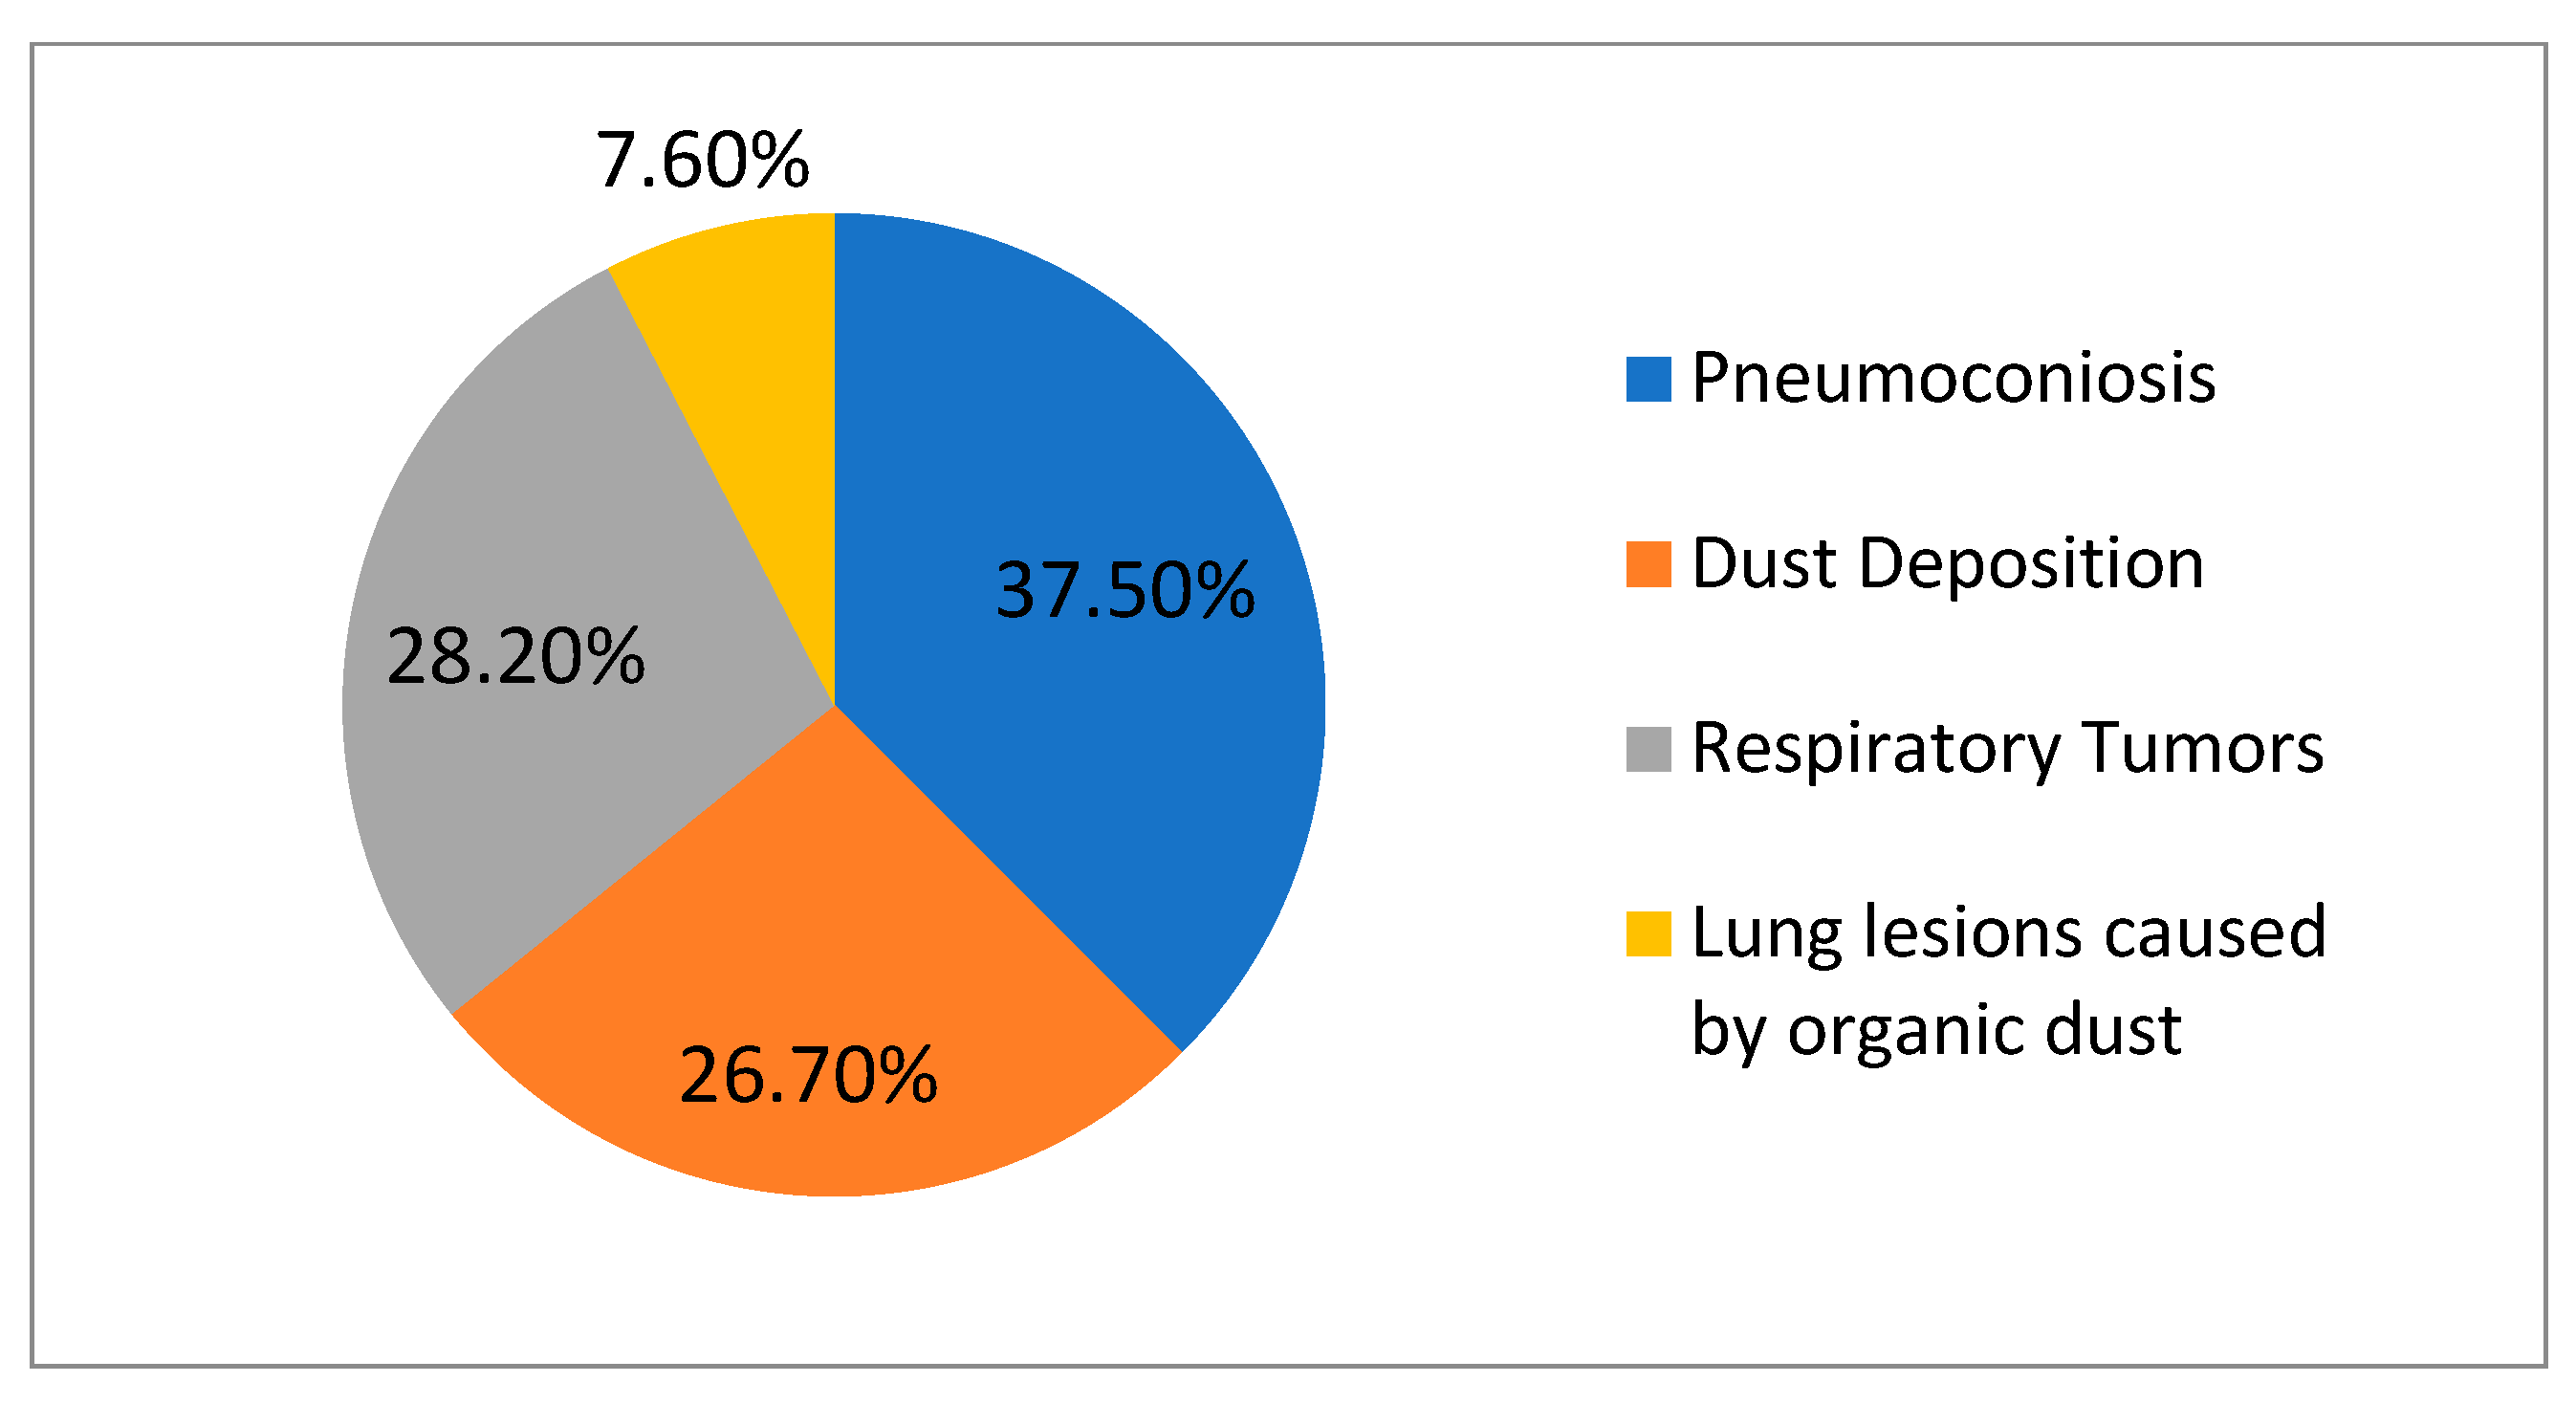
Table 2 for the profile of these case studies), and the impact of dust on the health of workers on site is shown in
Figure 1.
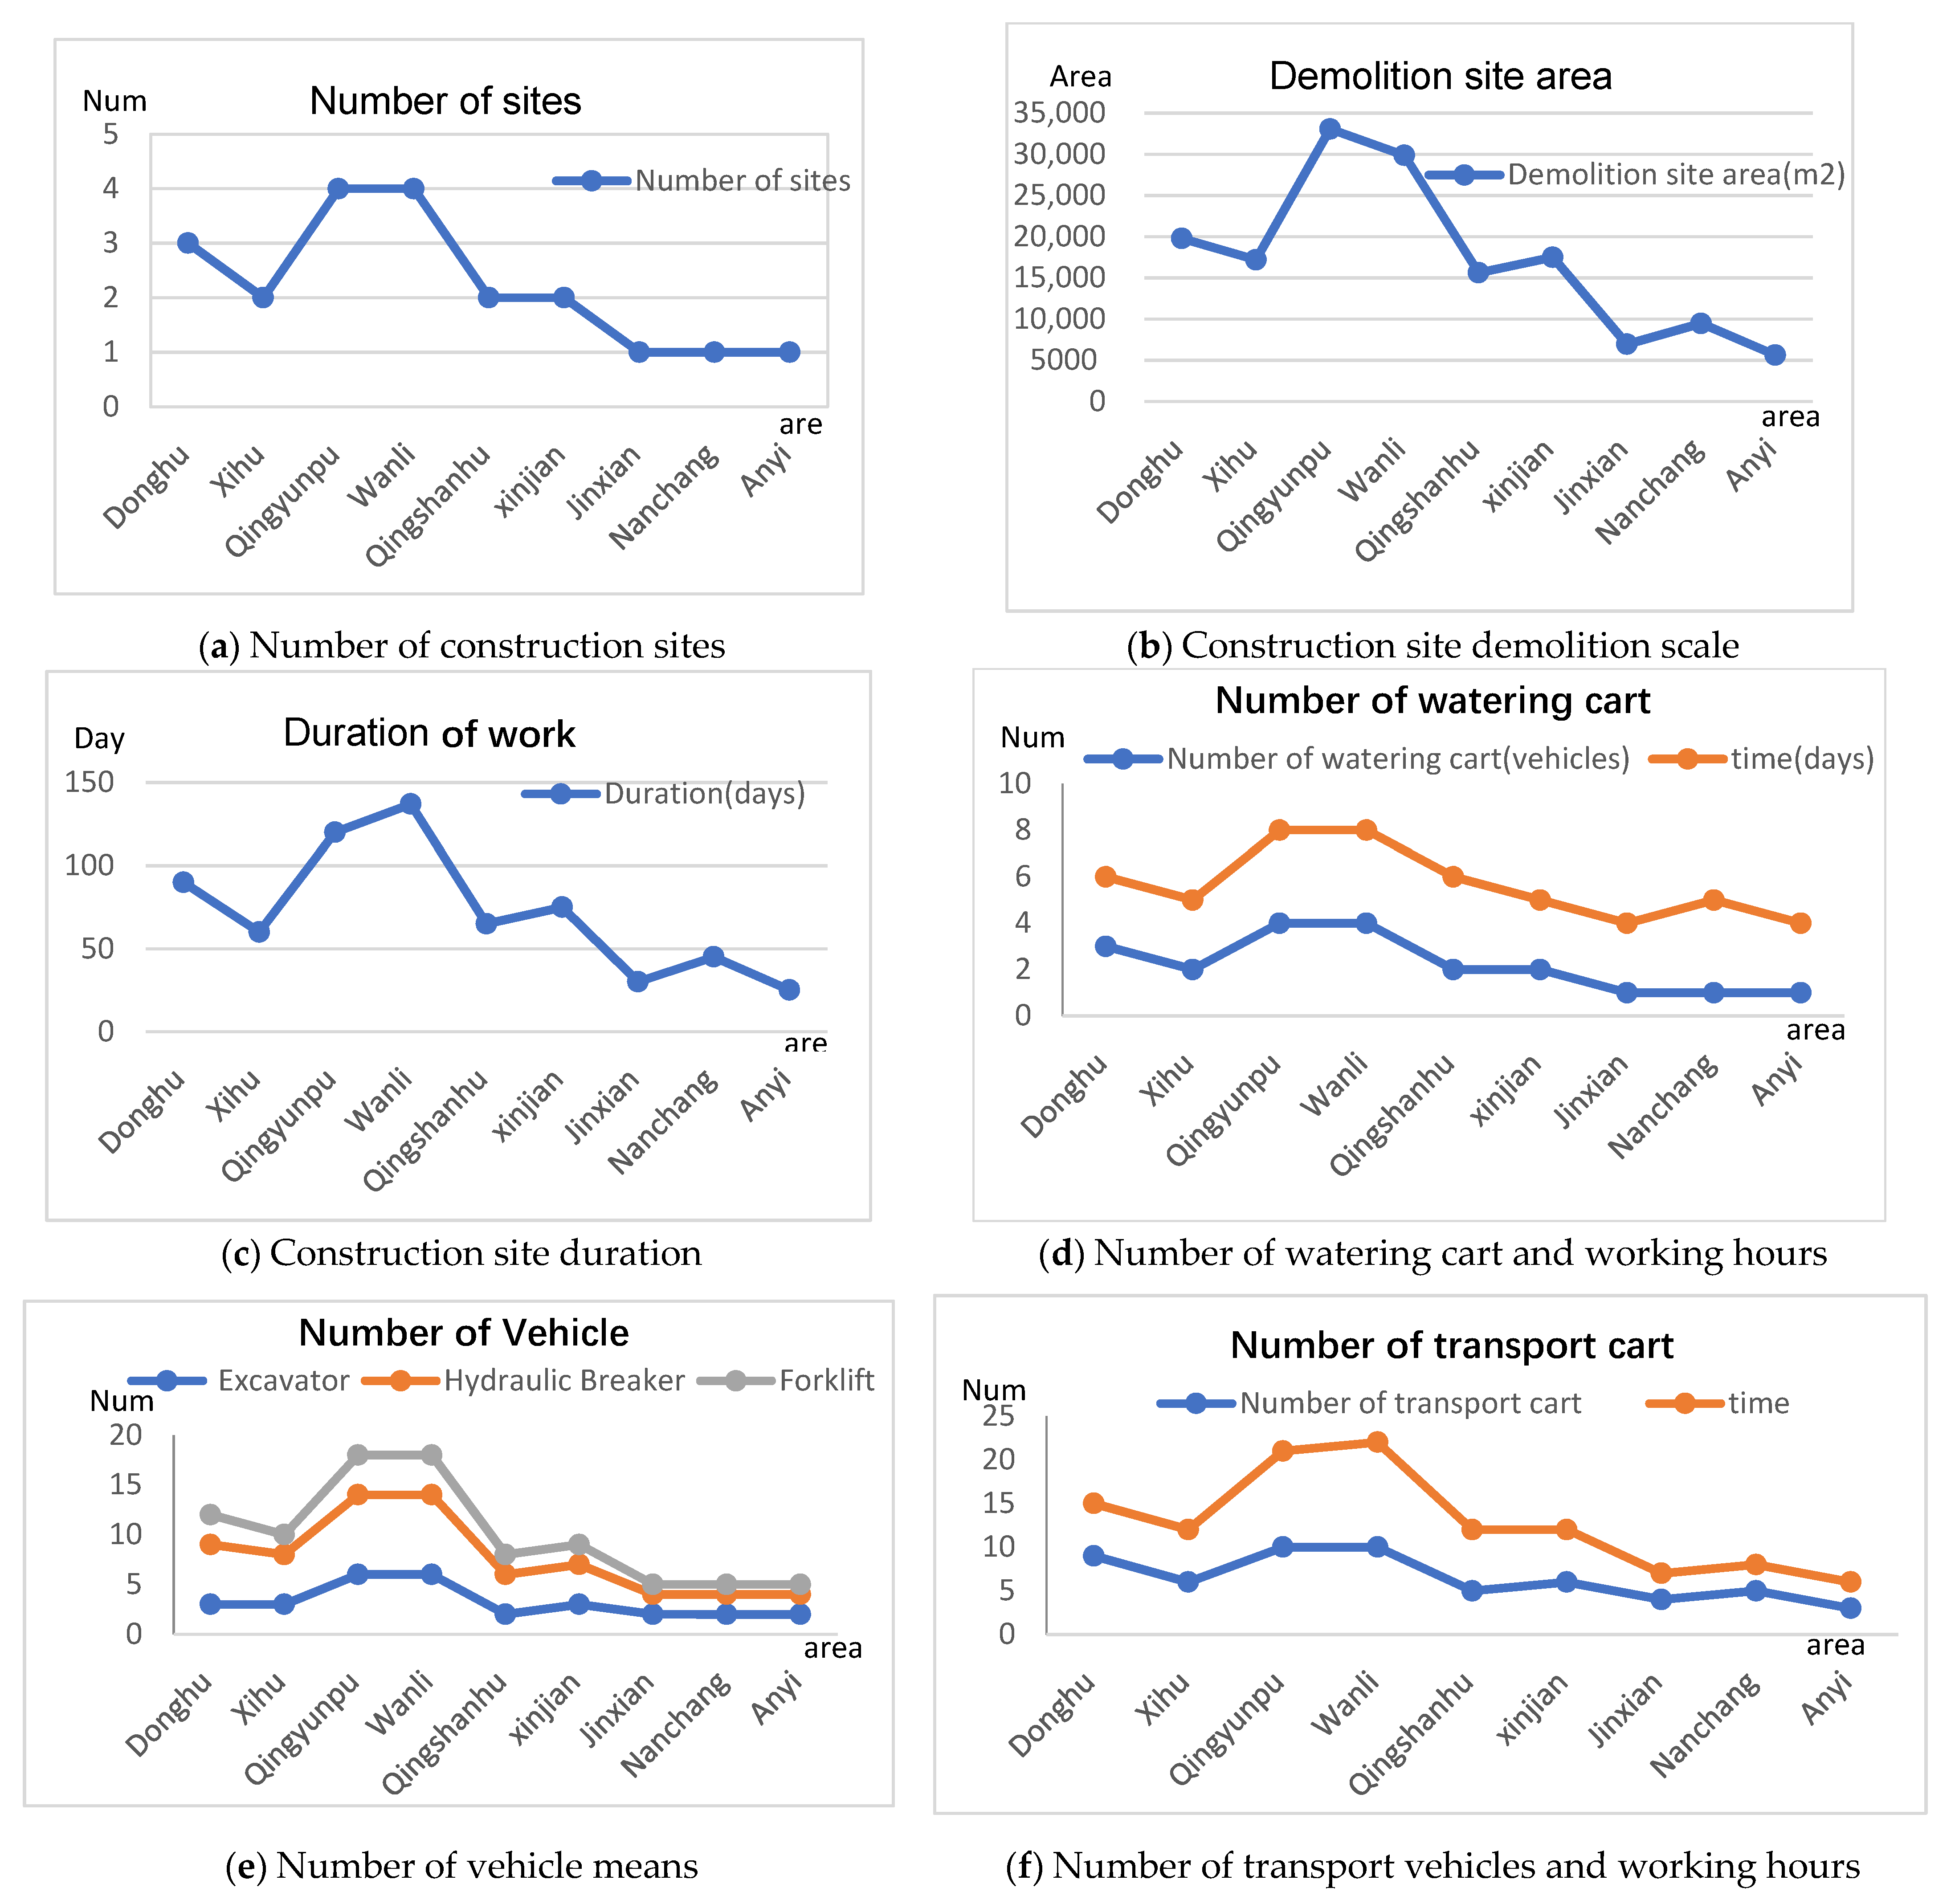
The survey includes the basic information of each construction site: location, scale, duration, investment, machinery, the level of transportation vehicles, and the frequency of their entering and leaving the site. Some basic information from the 20 demolition sites investigated in this study are shown in
Table 2 and
Figure 2. The duration of the demolition operation is relatively short, generally less than 5 months, and the use of heavy machinery and tools are closely related to the area of demolition. The larger the area, the more diverse types and quantities of machinery are involved. Each demolition site has an average of four machines and three transport trucks. The sites that use water for dust suppression have, on average, one sprinkler, and those using water sprinkling on roads have an average of three times a day.
According to China’s and Nanchang City’s regulations on the prevention and control of atmospheric pollution, construction companies should implement control measures to prevent dust pollution from their sites. The common control measures include: sprinkling water on temporary roads and hardstands within the site; erection of a boundary fence; ground cover; cover construction waste prone to dust with a dust net; continuous water sprinkling to suppress dust; and transport vehicle washing.
Table 3 presents the number of sites among the 20 surveyed that use the above methods for dust suppression.
In the 20 demolition projects surveyed, 19 used walls and enclosures to prevent dust; 18 used the artificial sprinkling method, 17 used vehicle flushing equipment to prevent dust; and 16 used a dust net to cover. In addition, one site used planted turf to prevent dust from spreading.
Table 4 shows the average unit cost (yuan/m
2) of dust control measures from the years 2013–2021, obtained from the 20 companies involved in the case study sites. These values represent the average cost of dust treatment during this period considering their involvement in a large number of projects.
According to the investigation, the budget for dust prevention and control at each site mainly comes from the “construction dust pollution prevention and control cost” stipulated by the competent construction authority, which accounts for less than 3% of the total demolition cost. The budget for dust control is seriously insufficient (as shown in
Table 5). Almost all sites have clearly developed dust control implementation plans, nevertheless, their content and coverage are relatively inadequate. Among the dust protection measures, boundary enclosure and vehicle washing are implemented relatively well. Though sprinkling water on roads and hardstands is carried out as planned, there is a lot of dust on the hardened road at the site. The materials used for the boundary enclosure are diverse, and the enclosure tightness is generally poor.
4. Results
4.1. Model Prediction Results
According to the average dust control cost per unit area obtained from the demolition companies in Nanchang City, there is a threefold increase in costs during the nine-year period under consideration.
After one accumulation of = {7.56,8.37,9.57,10.64,11.68,14.45,17.86,20.37,24.53}, the sequence thus obtained is shown below:
a(1)(t) = {a(1)(1),a(1)(2),…,a(1)(9)} = {7.56,15.93,25.5,36.14,47.82,62.27,80.13,100.5,125.03}
The GM (1, 1) model can be obtained according to the above-stated theoretical basis:
The calculated results of the model after a reduction test are shown in
Table 6. According to the calculated results, the residual error of the model in these 9 years ranges from −1 to 3.27, and the relative error ranges from 0.072% to 0.28%. The model has a large error; thus, the cost prediction model needs to be further optimized. The comparison between calculated values and observed values is shown in
Figure 3.
After the posterior difference verification, the small error probability,
, can be obtained. According to the accuracy grade in
Table 1, the accuracy grade obtained is classified as qualified. To further improve the prediction precision, the residual value
is adopted as the original data to build the residual model (modify after
t = 3). This model’s posterior difference ratio is
H ≤ 0.35, and the small error probability is
p > 0.95. Therefore, the model prediction grade after modification has improved, namely
The model after residual modification is expressed as:
where:
The results after the reduction test are shown in
Table 7.
4.2. Case Study of Dust Treatment Cost
As a part of the “Beautiful Nanchang: Happy Homeland” environment treatment project, Nanchang Municipal Government published the “Nanchang Construction Site Dust Treatment Plan”. With the overarching principle of “whoever causing pollution is responsible for treatment, and whoever in charge is responsible for the dust treatment”, the construction site dust treatment project was launched. Thanks to above initiative, dust prevention and control on construction sites got institutionalized and standardized. This policy has been fully implemented on construction sites, which became a long-term management mechanism for dust pollution. One such project was selected as a case study to demonstrate the dust treatment methods and their cost implications. This project uses four treatment types, akin to a multi-pronged attack on dust, which could comply with the regulations imposed by the government agencies in Nanchang.
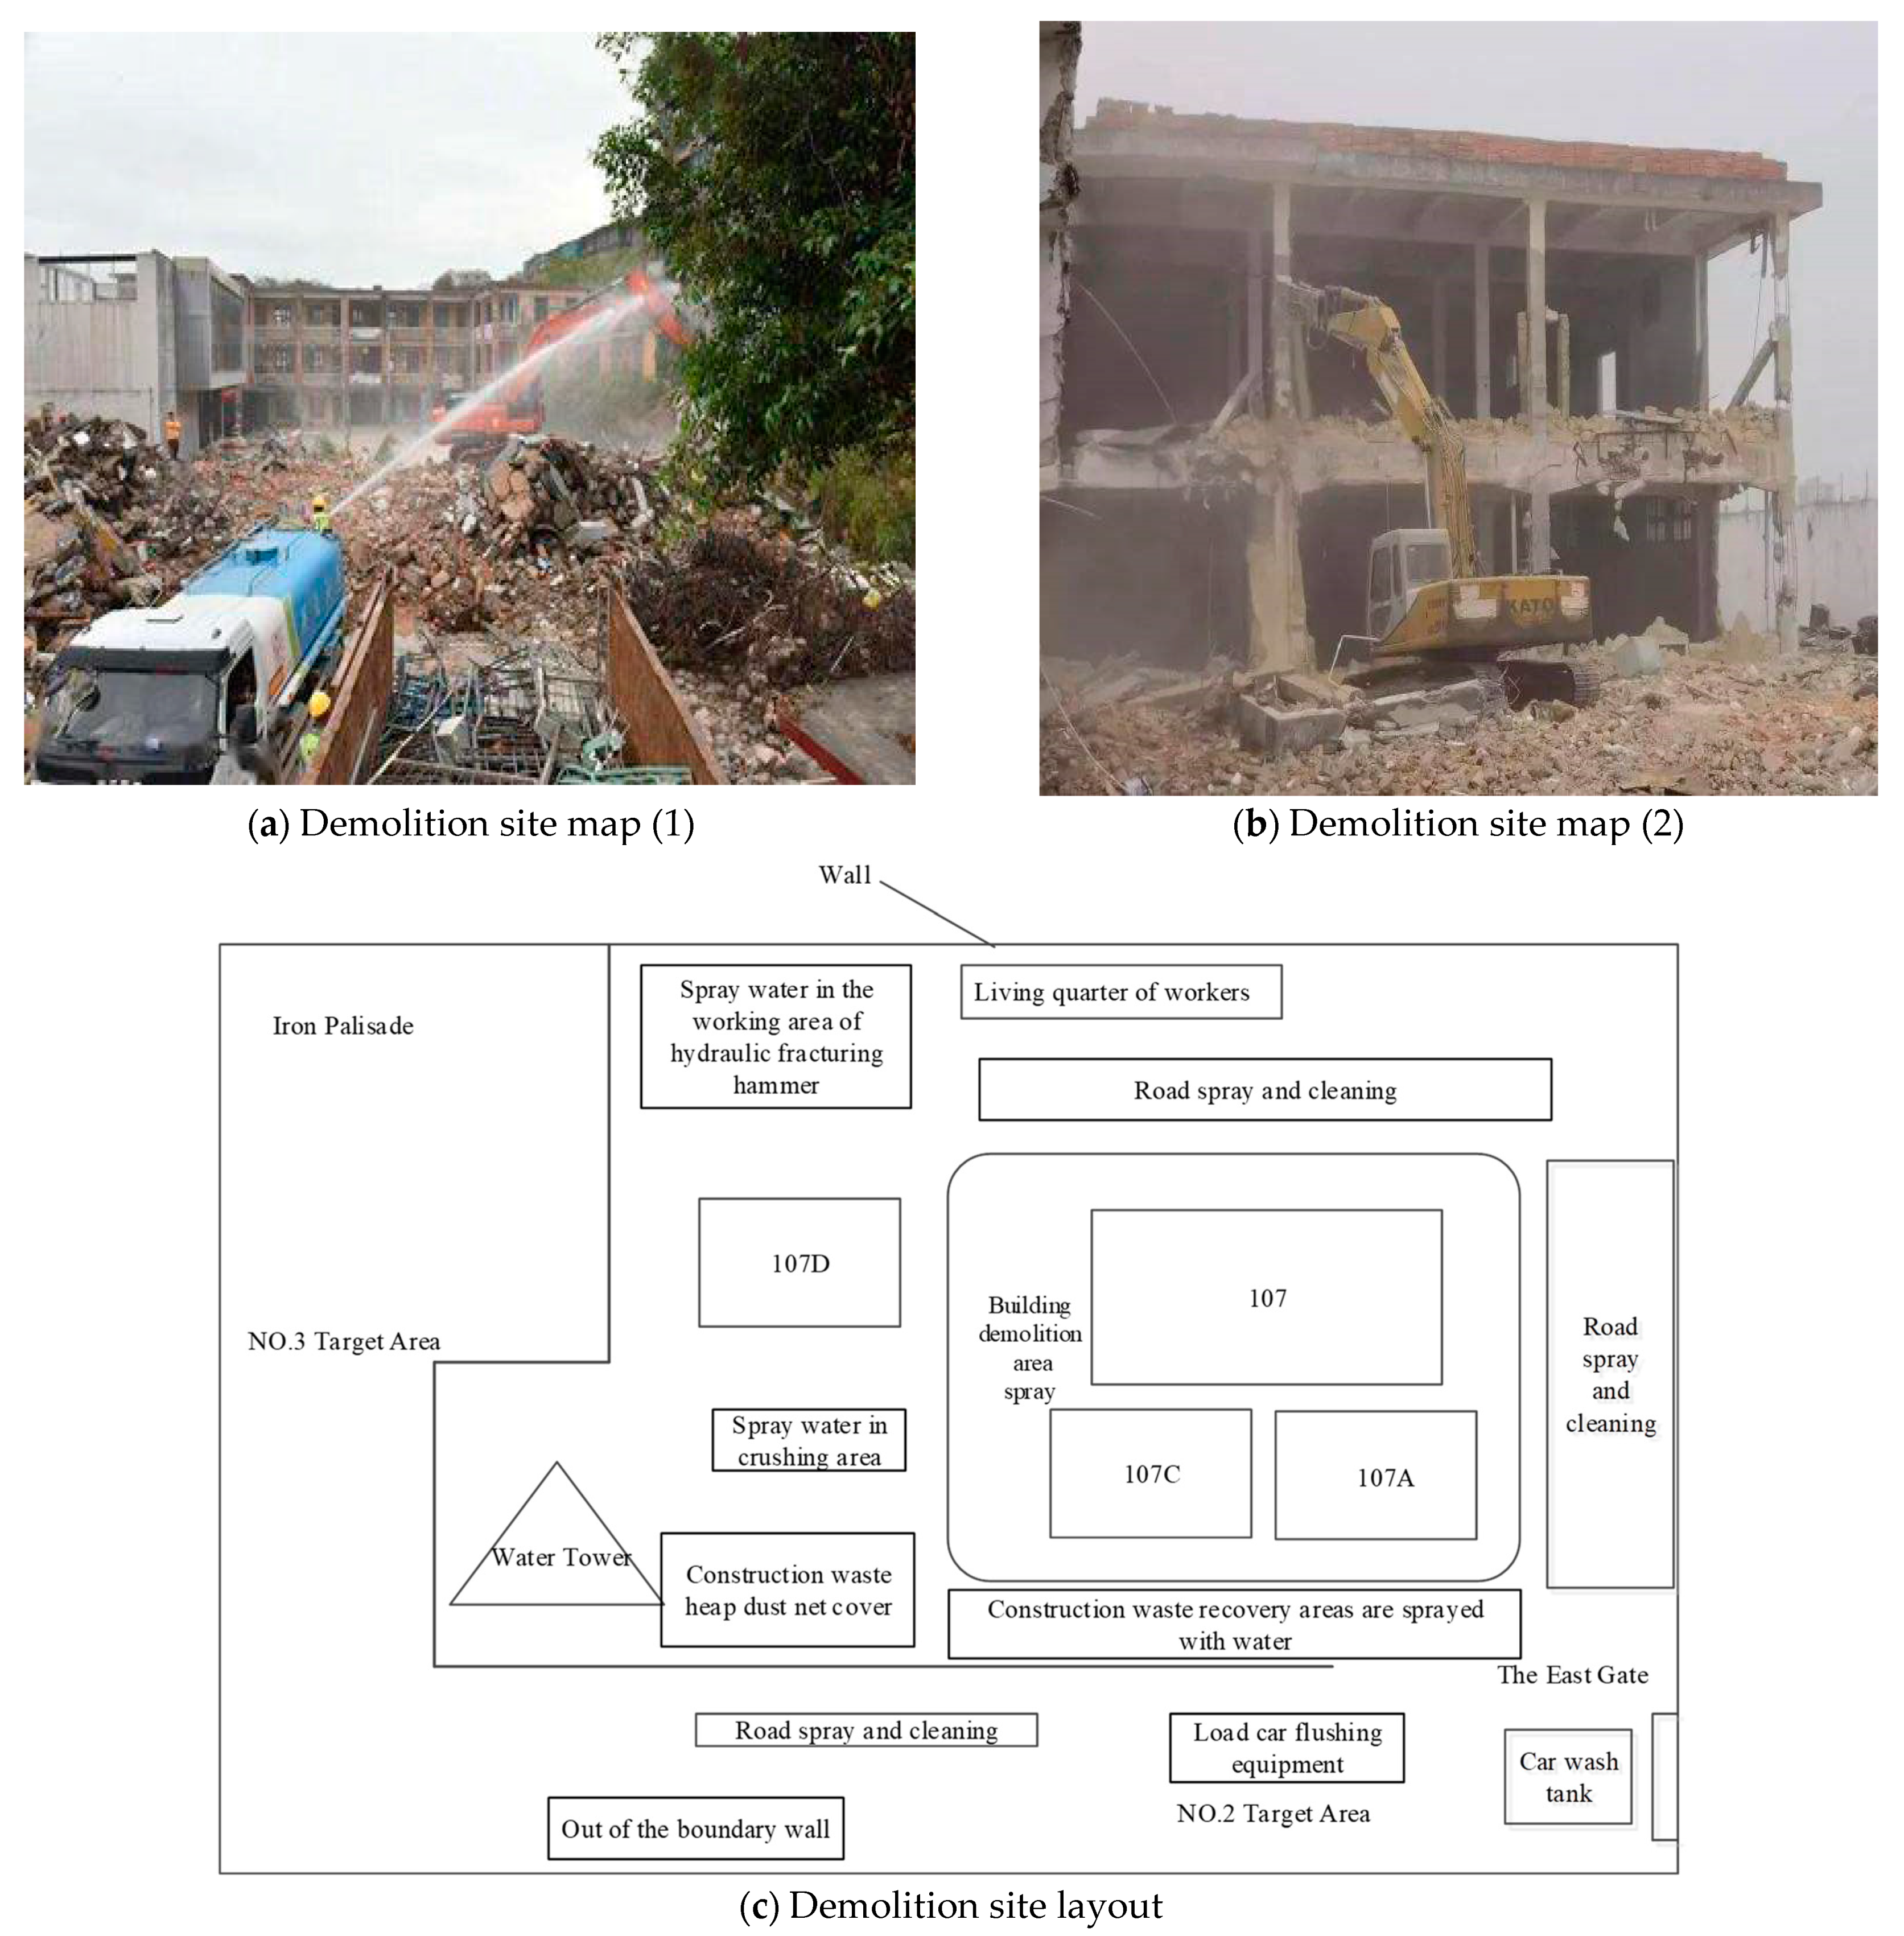
The scope of the project included the demolition and removal of four buildings, indicated as 107, 107A, 107C, and 107D, with a footprint of approximately 5000 square meters and a total gross floor area of 13,799 square meters.
Figure 4 provides a layout and picture of the demolition site including dust treatment methods employed. Building 107 is used for teaching, with a typical institutional character which is a five-story concrete framed structure; Building 107A is a hospital with a two-story brick-and-mortar structure; Building 107C is a dormitory with a four-story concrete framed structure; and Building 107D is an auditorium with a two-story brick-concrete structure. The demolition of the buildings was carried out from 11 September–5 October 2020. The demolition site was completely enclosed by iron sheets with a height of no less than 1.8 m. A minimum safe distance of 1.5 times the building height was maintained between the enclosure and the buildings to be demolished, with the eastern boundary of the demolition site connected to a wall.
4.3. Cost Analysis of Dust Control Measures
- (1)
Boundary fences
During the demolition process, a boundary fence mainly made up of steel sheets (including a steel frame) was erected. According to the fencing area requirements, the cost of the steel sheet fencing was 75 yuan per square meter. The main target of this treatment is the prevention of dust spreading beyond the site area.
- (2)
Dust screens on waste stockpiles
The onsite waste stockpiles are covered using anti-dust screens to prevent dust from spreading. Stockpiles are notorious in escalating dust generation in demolition sites. Ideally, stockpiles should be reduced to be minimum, but it is very hard to achieve this target. The demolition site is approximately 500 square meters of coverage area per 1000 square meters of land area. According to the above ratio, the cost of anti-dust screens is 12 yuan per square meter.
- (3)
Continuous water spray on demolition face and site
The water spray facilities were used for onsite dust suppression during the demolition operation. As discussed earlier, this is a very popular treatment method. The cost of each water spray ranges from 700–1000 yuan (including the water tariff). The demolition site requires no hardening of the road pavement, but irregular spraying of water, cleaning, and dust prevention of the passage. The number of water sprays is determined according to the actual dust on the construction site. The water spray intensity during the demolition period, on average, was 0.6 times per 10,000 square meters per day. Besides, spraying facilities were also used at the site, whose unit price was around 3000 yuan per piece.
- (4)
Transportation vehicle washing
The washing of transport vehicles, especially the wheels, is intended to prevent dust spreading outside the site into neighboring areas when the vehicle travels out for disposal. The washing cost of transportation vehicles consists of the cost of washing equipment and the water tariff. The washing equipment mainly refers to the automatic washing gear, high-pressure pump, sand-setting well, rinsing groove, etc. Under general conditions, the automatic washing gear costs around 10,000 yuan per set; the high-pressure pump costs 2500 yuan per piece; and the sand-setting well and rinsing groove costs 5000 yuan per set. The vehicle washing cost is calculated by considering 1.2 cubic meters of waste per vehicle trip.
4.4. Dust Treatment Cost Analysis
The method proposed by Zhang et al. (2016) for the cost analysis of dust control measures on construction sites is adopted in this study. The demolition project discussed above covers a total footprint area of 5000 square meters and a floor area of 13,799 square meters. The total waste generated on site is around 32,000 cubic meters. Thereby, the construction dust prevention and control costs are calculated as follows:
- (1)
Boundary fences: 300 square meters of steel sheet at an average unit price of 75 yuan per square meter would ends up in a total cost of 22,500 yuan for the boundary fence.
- (2)
Dust screen on waste stockpiles: 500 square meters of screen cloth at an average price of 12 yuan per square meter gives a total cost of 6000 yuan for this treatment.
- (3)
Continuous water spray: One water tank and the daily water spray cost is 2400 yuan per day (four times a day). The water tank is installed for 25 days of the demolition operation. The unit price of spray facilities is 3000 yuan per set and ten sets are used in total. Therefore, the total cost of this treatment is approximately 130,000 yuan.
- (4)
Cost of the vehicle washing: The daily use of water for spray is 18t (1.2 cubic meters per vehicle), and the unit price is 4.5 yuan per ton. The project lasted for 25 days, and the water cost is 2000 yuan. One set of washing equipment (including the fees of the automatic washing equipment, sand-setting well, rinsing groove, high-pressure gun, etc.) is adopted, which costs 10,000 yuan. The total fees are 12,000 yuan.
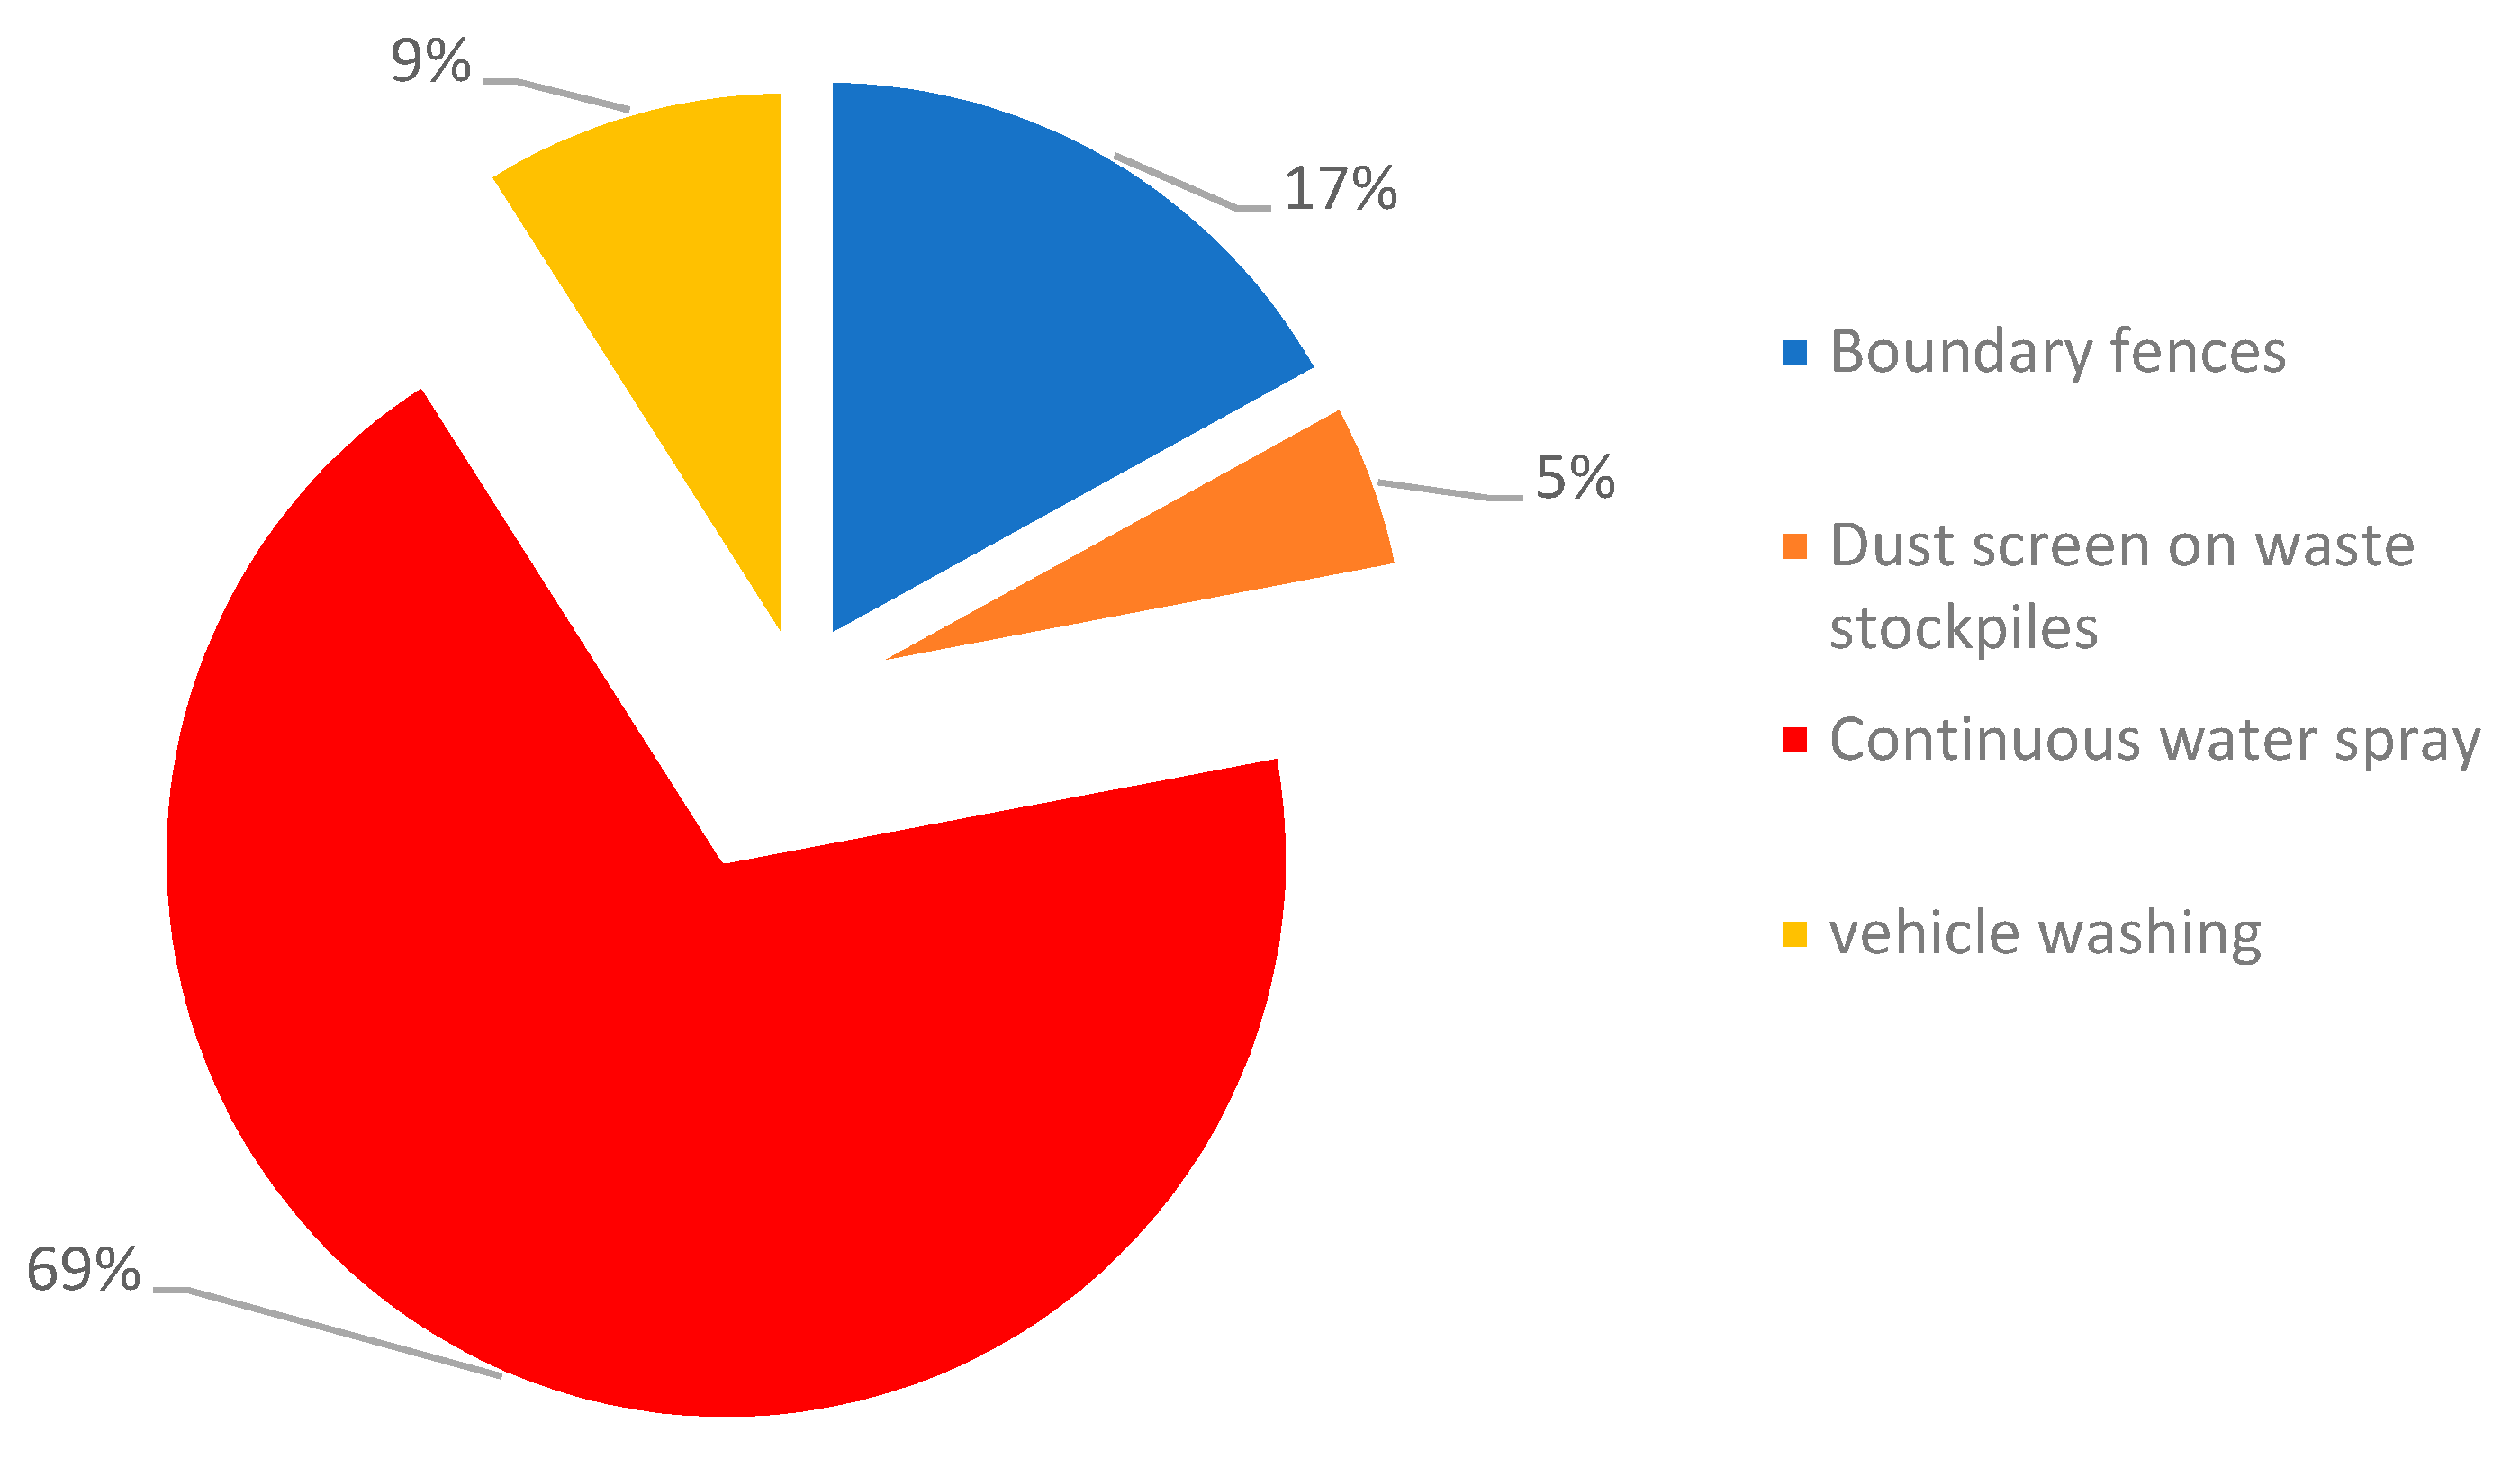
The costs of different dust control measures adopted by the demolition operation of the case study project are shown in
Table 8. The major cost items are the continuous water spray and boundary fences. From a unit area treatment cost perspective, a total of 130,500 yuan is needed for 5000 m
2 of demolition footprint, which translates in to 26.1 yuan per m
2 m.
Figure 5 illustrates the distribution of the total cost among the four main treatment methods used by the case study site. It clearly highlights the dominance of water sprinkling for dust suppression, where almost 70% of the total cost is directed towards it.
5. Discussions
In the past, there were numerous studies reported on dust pollution control in China, mainly due to issues with air pollution and the haze experienced by many large cities. These studies focused mostly on the emission factor of dust, the diffusion mechanisms, and control measures. There were very few studies that investigated the cost of dust control measures, and even fewer studies on the prediction of the dust treatment cost. Though technical knowhow is important, companies are very keen to make sure that their profit margins are not consumed up by dust treatment costs, which are increasing, partly due to the regulations and environmental conservation measures introduced by the government in recent years. In that context, this paper contributes to a very important but neglected area of dust treatment cost, and its prediction amidst a very tight regulatory environment. Though not explicitly, it deals with the cost of regulatory compliance. Cost certainty and appropriate budgeting tools are very important for companies and, consequently, for the success of ambitious government initiatives such as the “Nanchang Construction Site Dust Treatment Plan”.
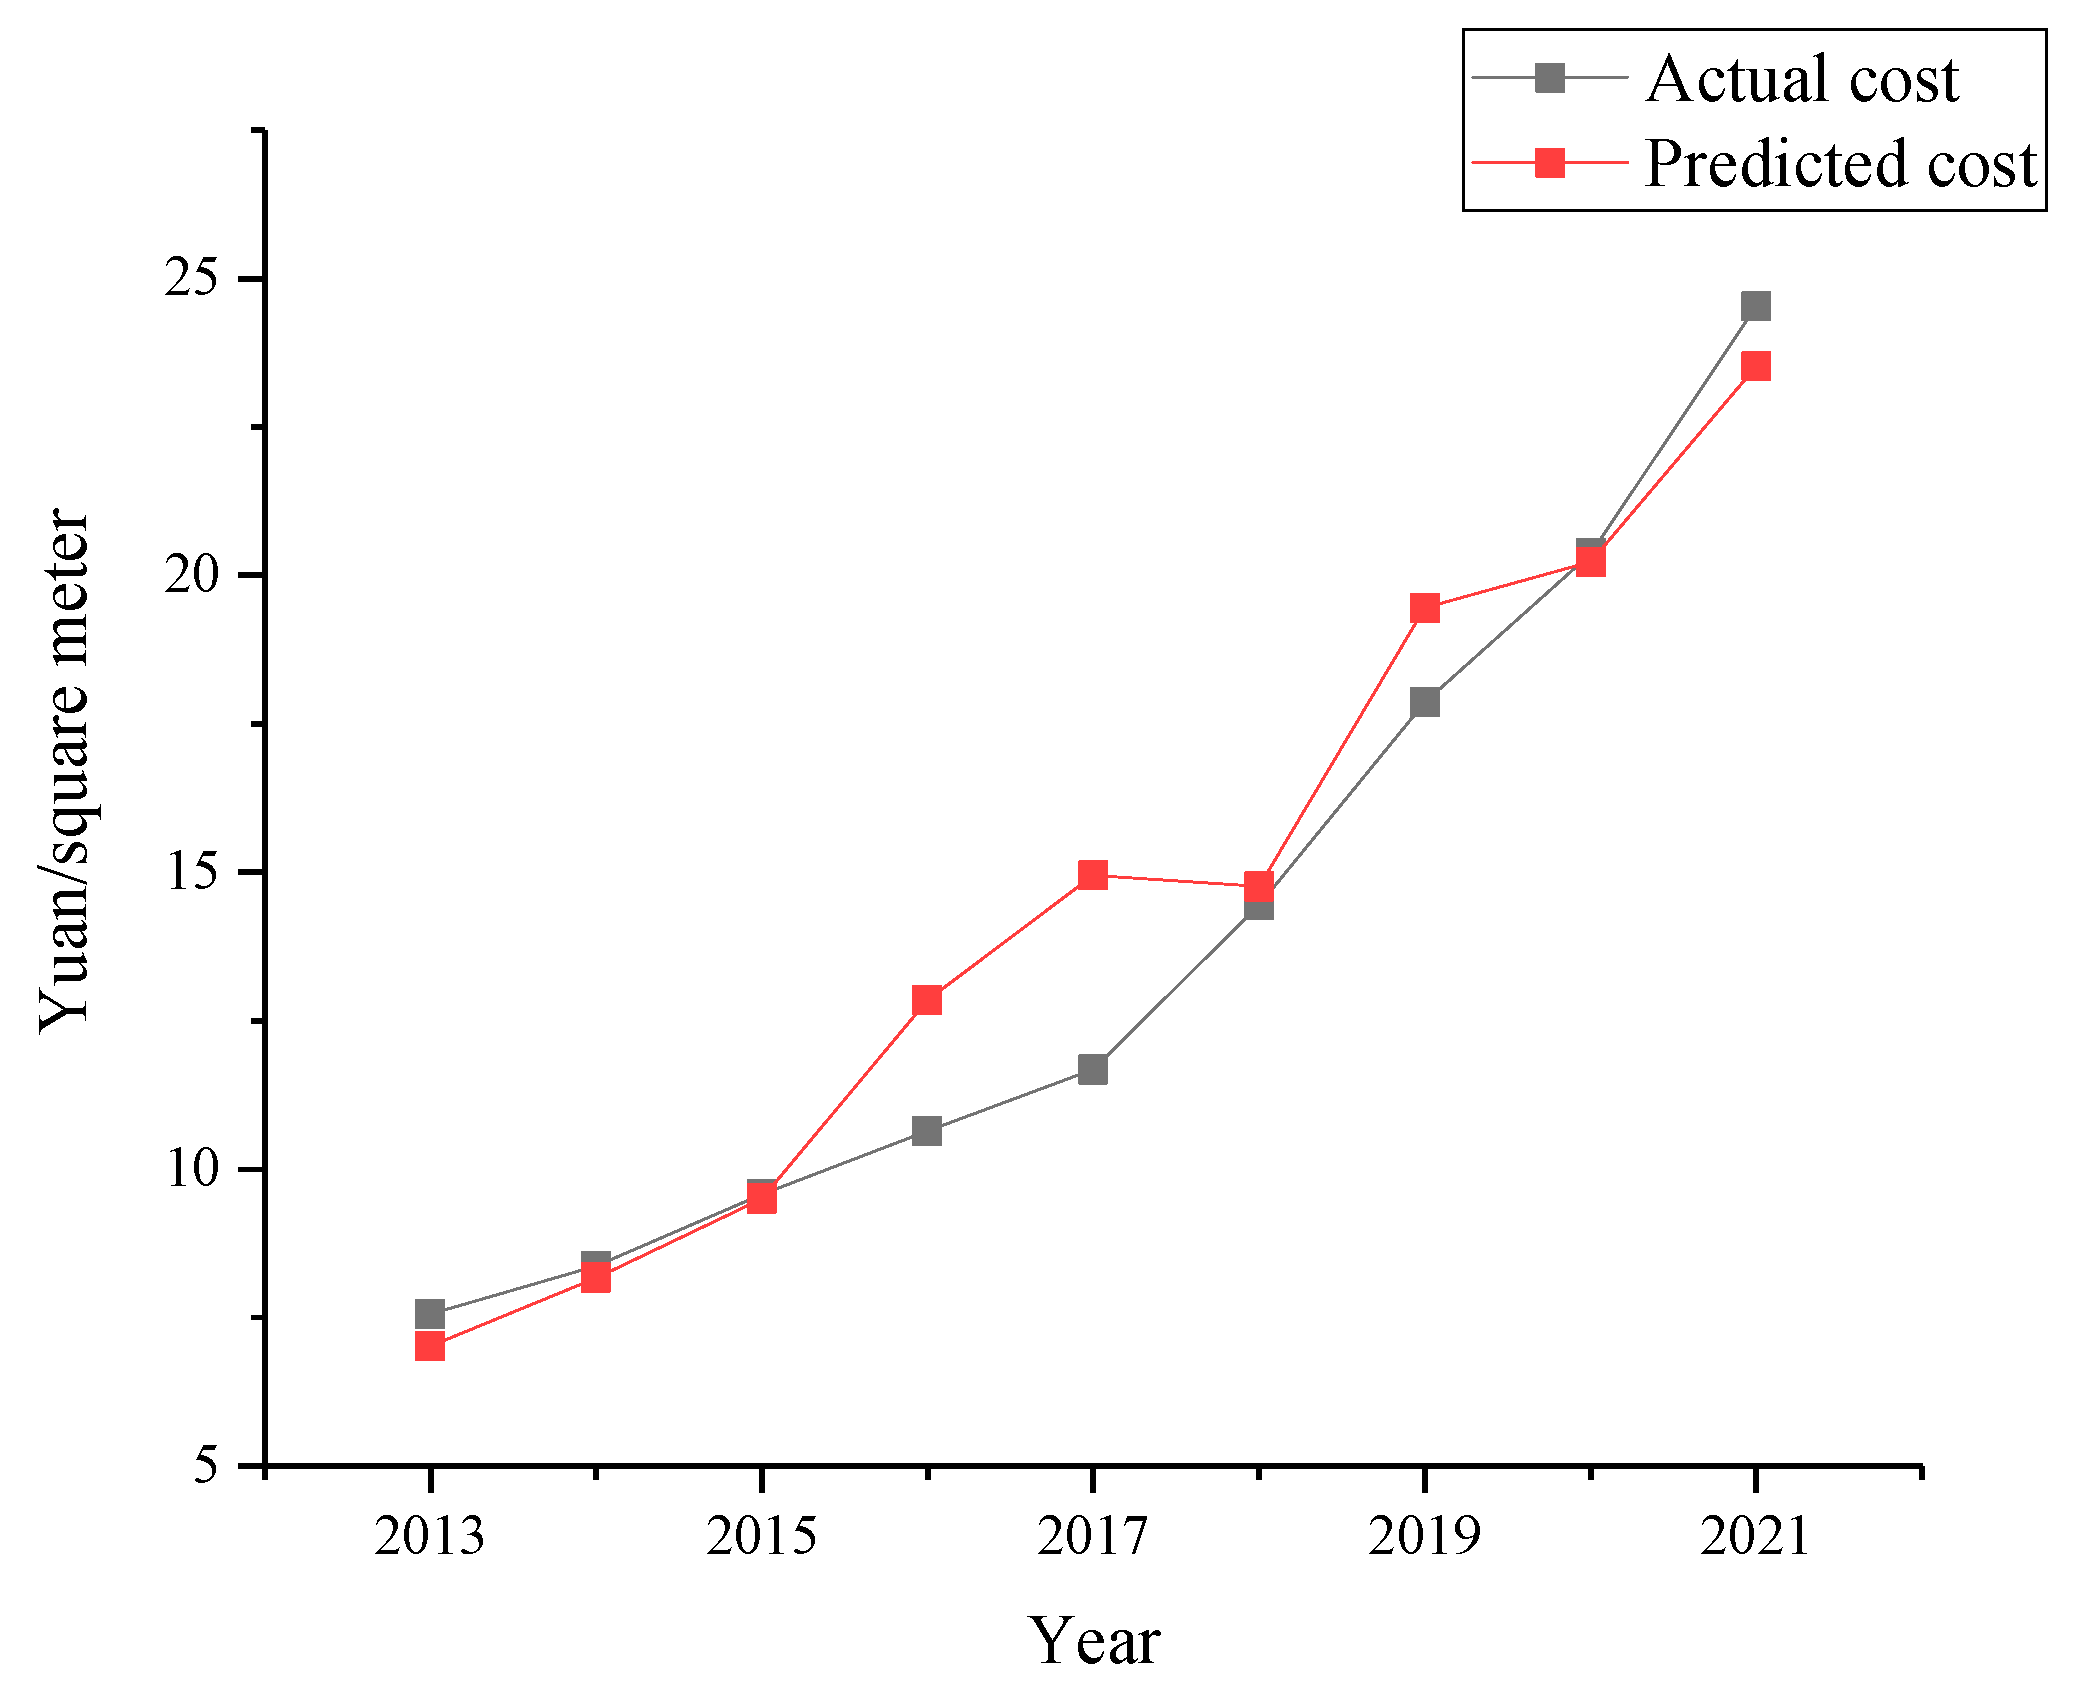
To verify the effectiveness of the dust treatment cost prediction model for demolition operations, dust treatment unit cost data for Nanchang from 2013 to 2021 were used. The demolition dust treatment cost obtained by the cost estimation model and the actual dust treatment cost very well coincide with each other. The fitting degree between the actual dust treatment costs and predicted values is shown in
Figure 6.
According to the above analysis, it can be observed that:
- (1)
From the relative error between the actual dust treatment costs and predicted values, the relative error is smallest in 2020, which is around 0.003%. The relative error is the largest in 2017, which is 0.08%. These values show that the model can predict the dust treatment cost to a very high accuracy.
- (2)
In order to further verify the model, the dust treatment cost in Nanchang for 2022 was derived as 27.95 yuan per square meter. The actual cost of dust treatment from the case study as reported under 4.3 was 26.1 yuan per square meter. Thus, the relative error between the predicted cost of the model and the actual cost is 0.07%. This shows the dust treatment cost prediction model proposed in this paper can obtain results with a very high accuracy. Though predicted dust treatment cost of the model generally coincides with the actual dust treatment cost, changes of the quota, including quota of materials, and material price, should be taken into consideration. Based on their degree of influence, the predicted cost can be further modified.
6. Conclusions
Buildings emit a large amount of dust in their whole life cycle. Among them, construction dust accounts for more than 10% of the concentration of PM2.5 and PM10. The concentration of airborne suspended particulates in a demolition site is seven times higher than that of a normal area. Therefore, reducing dust from demolition works is an important task in dealing with the haze weather experienced by many Chinese cities. With the worsening of environmental problems in China and the growing number of construction projects, environmental pollution treatment has been a top priority for the construction industry, as well as the government. Complying with such regulations comes with a huge cost tag as demonstrated by this study: within an eight-year period, dust treatment costs tripled in the Nanchang City. In such turbulent times, accurate prediction of cost in any business operation is crucial. This paper constructs a model for the prediction of demolition dust treatment cost, which provides a quick, convenient, and accurate estimation of the costs involved in the treatment of dust during demolition operations. The error between the predicted results and the actual costs was found to be small, and the relative error ranges from 0.003% to 0.077%. The possibility to predict dust treatment cost will immensely help demolition companies make informed decisions, as well as being helpful for demolition planning.
Through a better demolition dust treatment cost prediction, demolition companies could bid for projects with higher certainty, and have confidence during negotiations with clients and regulatory agencies, as well as monitor and control cost during operations. Based on the predicted dust treatment cost, demolition companies can formulate a sensible project cost plan according to the project Work Breakdown Structure (WBS) and estimate quantities and cost of the demolition operations; it could comprehensively consider the technical measures and management costs that may occur on site. When preparing the dust cost plan of a demolition project, attention should be paid to ensure its operability, cost of full compliance to regulations, and convenience of cost accounting. During the demolition operation, construction cost managers will have the responsibility of implementing the cost plan, and an accurate estimate of dust treatment cost is invaluable for their on-site decision-making. In addition, government agencies can draw lessons from the predicted values of the dust treatment cost of demolition projects in this paper, classify demolition projects based on their characteristics, enforce a minimum standard of dust control, and ensure cost certainty from various treatment methods. If the government can ensure cost certainty and provide financial incentives in areas where there need to be greater intervention, demolition site dust treatment can achieve the anticipated environmental protection and air pollution prevention and control standards much more effectively than at present.
Author Contributions
Conceptualization, W.L. and H.C.; Data curation, C.L. and Z.Q.; Formal analysis, C.L.; Funding acquisition, W.L.; Investigation, Z.H.; Methodology, W.L.; Project administration, Z.H., C.L. and Z.Q.; Resources, W.L. and H.C.; Supervision, W.L., Z.H. and H.C.; Validation, Z.H., C.L. and Z.Q.; Visualization, C.L. and Z.Q.; Writing—original draft, Z.H.; Writing—review and editing, W.L. and Z.H. All authors have read and agreed to the published version of the manuscript.
Funding
This research was funded by the Social Science Foundation Project of Jiangxi Province (20GL20), and humanities and social science research projects in colleges and universities in Jiangxi Province (GL19102).
Conflicts of Interest
The authors declare no conflict of interest.
References
- Sung, K.P.; Chunlu, L.; Craig, L. Case study of demolition costs of residential buildings. Constr. Manag. Econ. 2006, 24, 967–976. [Google Scholar]
- Akanbi, L.A.; Oyedele, L.O.; Akinade, O.O.; Ajayi, A.O.; Delgado, M.D.; Bilal, M.; Bello, S.A. Salvaging building materials in a circular economy: A BIM-based whole-life performance estimator. Resour. Conserv. Recycl. 2018, 129, 175–186. [Google Scholar] [CrossRef]
- Liu, Z.; Wang, Y.; Hu, B.; Ji, D.; Zhang, J.; Wu, F.; Wan, X.; Wang, Y. Sourcc appointment of fine particle number and volume concentration during severe haze pollution in Beijing in January 2013. Environ. Sci. Pollut. Res. 2016, 23, 6845–6860. [Google Scholar] [CrossRef]
- Fujii, H.; Managi, S.; Kaneko, S. Decomposition analysis of air pollution abatement in China: Empirical study for ten industrial sectors from 1998 to 2009. J. Clean. Prod. 2013, 59, 22–31. [Google Scholar] [CrossRef] [Green Version]
- Chu, B.; Liu, T.; Zhang, X.; Liu, Y.; Ma, Q.; Ma, J.; He, H.; Wang, X.; Li, J.; Hao, J. Secondary aerosol formation and oxidation capacity in photooxidation in the presence of Al203 seed particles and SO2. Sci. China Chem. 2015, 58, 1426–1434. [Google Scholar] [CrossRef] [Green Version]
- Lu, R.; Li, X.W. Research on the project cost prediction in the process of bidding for construction enterprises. J. Railw. Eng. Soc. 2016, 33, 104–109. [Google Scholar]
- Gao, J.W.; Zhang, H.B.; Zhong, X.Y. Optimization of straw purchase scheme and cost estimation on biomass power generation. Renew. Energy Resour. 2017, 35, 141–147. [Google Scholar]
- Zuo, J.; Raufdeen, R.; Matthew, H.; Zhou, Z.H.; Ding, Z.K. Dust pollution control on construction site: Awarenss and self-responsibility of managers. J. Clean. Prod. 2017, 166, 312–320. [Google Scholar] [CrossRef]
- Zuo, J.; Pullen, S.; Rameezdeen, R.; Bennetts, H.; Wang, Y.; Mao, G.; Zhou, Z.; Du, H.; Duan, H. Green building evaluation from a life-cycle perspective in Australia: A critical review. Renew. Sustain. Energy Rev. 2017, 70, 358–368. [Google Scholar] [CrossRef]
- Wu, Z.; Zhang, X.; Wu, M. Mitigating construction dust pollution: State of the art and the way forward. J. Clean. Prod. 2016, 112, 1658–1666. [Google Scholar] [CrossRef]
- Thomas, N.; Costa, D. Adoption of environmental practices on construction sites. Associaçao Nacional Tecnologia Ambiente Construído 2017, 17, 9–24. [Google Scholar] [CrossRef] [Green Version]
- Lin, W.Q. Analysis on project cost control method. Constr. Technol. 2013, 42, 173–176. [Google Scholar]
- Shao, S.L.; Qi, L.G.; Zhang, F. Construction and application of business cost prediction model of manufacturing enterprises based on grey theory. Commun. Financ. Account. 2019, 17, 76–79. [Google Scholar]
- Fan, S.H.; Yao, B.; Zhang, L.; Ji, C. EWMA cost control design based on grey prediction. Friends Account. 2017, 9, 23–26. [Google Scholar]
- Liu, W.; Yuan, Z.T.; Hu, W.C.; Wang, Y.C. Model analysis of spatial dispersion characteristics of construction dust and graded control measures. J. Environ. Eng. 2021, 15, 1976–1987. [Google Scholar]
- Liu, W.; Tang, P.T.; Li, K.; Jiang, T. Demolition dust formation, diffusion mechanism and monitoring quantitative research on demolition of existing buildings. Appl. Ecol. Environ. Res. 2019, 17, 14543–14559. [Google Scholar] [CrossRef]
- Zhang, L.W.; Sojobi, A.O.; Kodur, V.K.R.; Liew, K.M. Effective utilization and recycling of mixed recycled aggregates for a greener environment. J. Clean. Prod. 2019, 236, 117600. [Google Scholar] [CrossRef]
- Sojobi, A.O.; Xuan, D.; Li, L.; Liu, S.; Poon, C.S. Optimization of gas-solid carbonation conditions of recycled aggregates using a linear weighted sum method. Dev. Built Environ. 2021, 7, 100053. [Google Scholar] [CrossRef]
- Sun, X.T.; Feng, Y.J. Research on quality cost predicting of construction projections based on RBFNN. Resour. Dev. Mark. 2015, 31, 17–20. [Google Scholar]
- Liang, L.L.; Li, L.J. Research on fuzzy forecasting technology reasonable of project cost. J. Taiyuan Univ. Technol. 2011, 42, 88–91. [Google Scholar]
- Chang, L. An overview of cost control key points of civil engineering. Urban Archit. 2013, 11, 123–127. [Google Scholar]
| Publisher’s Note: MDPI stays neutral with regard to jurisdictional claims in published maps and institutional affiliations. |
© 2022 by the authors. Licensee MDPI, Basel, Switzerland. This article is an open access article distributed under the terms and conditions of the Creative Commons Attribution (CC BY) license (https://creativecommons.org/licenses/by/4.0/).


