Article

Economic and Technical Analysis of Power to Gas Factory Taking Karamay as an Example

College of Arts and Science, China University of Petroleum-Beijing at Karamay, Karamay 834000, China
*
Author to whom correspondence should be addressed.
Sustainability 2022, 14(10), 5929; https://doi.org/10.3390/su14105929
Submission received: 5 April 2022 / Revised: 26 April 2022 / Accepted: 9 May 2022 / Published: 13 May 2022

Abstract

:
Power to gas (PTG) refers to the technology of converting power into energy-storage gas, which can absorb excess power when there is excess power and release energy-storage gas when needed. Based on the carbon dioxide (CO2) emission of Karamay City in Northwest China, this study designed a process flow of the CO2 absorption process, and the hydrogen and CO2 methanation process, in PTG technology. The results show that the efficiency of the CO2 absorption process was 91.5%, and the methanation efficiency was 77.5%. The heat recovery module was set during the process, and the total heat recovered was 17.85 MW. The cost of producing synthetic natural gas (SNG) in the PTG factory was 1782 USD/ton. In terms of cost, the cost of hydrogen production from electrolyzed water accounted for the largest proportion. In terms of product profit, the sale of pure oxygen was the largest part of the profit. At present, the carbon emission reduction index profit brought by SNG production accounted for a small proportion. In the future, with technological progress, industrial upgrading and the improvement in the carbon trading market, PTG technology is expected to become one of the ways to achieve carbon-emission-reduction targets.

1. Introduction

With the further intensification of global warming, the climate has become an increasingly serious issue. With the rapid growth in the global population and economy, more and more greenhouse gases are emitted into the atmosphere [1]. Among them, CO2 emissions account for more than 60% of the total greenhouse gas emissions, which are the main cause of global warming and climate change [2]. Therefore, countries have introduced policies to reduce CO2 emissions. The European Union is committed to reducing greenhouse gas emissions by 80–95% by 2050, compared with 1990 [3]. The Biden government of the United States promises to achieve 100% carbon-free emission in the power industry by 2035 [4]. India is committed to reducing its CO2 emissions by 33–35% by 2030, compared with 2005 [5]. China is the world’s largest industrial country. Due to the rapid development of its industry in the past two decades, China has emitted nearly 30% of the CO2 in the world in 2020 alone [6]. Therefore, in the face of this situation, China has also set ambitious emission-reduction targets: By 2030, CO2 emissions will reach a peak, at 50–60% lower than that in 2005. In addition, carbon neutrality will be achieved by 2060 [7].
Carbon capture utilization and storage (CCUS) technology is expected to achieve climate commitments and solve climate problems. At present, CCUS technology has two main research directions. One is to physically store the captured CO2 and store it in oil fields or coalfields, so as to improve oil and gas recovery and reduce CO2 stock [8]. The second is to chemically convert the captured CO2 into methane and other fuels. In this direction, electricity generated from renewable energy is used to electrolyze water to produce hydrogen, which is converted into methane together with captured CO2. This technology is called PTG. At present, relevant PTG projects have been established in many parts of the world to carry out miniaturization experiments and commercialization attempts [9]. The first PTG project in the world is Ameland in the Netherlands. The project uses a proton exchange membrane electrolyzer (PEM) to produce hydrogen, which is mixed into the natural-gas pipe network and supplied to 14 families in apartments. The operation of the project has no safety problems currently [10]. Project Hybridge is one of the largest PTG projects in Europe. It is planned that it will design 100-MW electrolytic cells to produce hydrogen before 2030. The hydrogen will be used for transportation, mixing into the natural-gas pipeline network and conversion to methane [11]. At present, the largest PTG project in operation is located in the Audi e-gas plant in Werlte, Germany. The total capacity of its three electrolytic cells is 6.3 MW. Wind energy is used to provide power, and the generated hydrogen is converted into methane and injected into the gas network [12]. In general, based on literature research, there are nearly 130 PTG projects in the world, involving 26 countries or regions [9]. However, it should be pointed out that current projects often choose to provide surplus power in areas rich in renewable resources, rely on existing thermal power plants, or choose to obtain convenient raw materials in heavy industrial areas. Therefore, the choice of location is particularly important. Different resources exist in different regions; there are different bank discount rates, labor, land-use costs and product prices, leading to different project operation costs in different regions. These reasons also led to the emergence of this work.
Another important factor is based on energy-storage considerations. In recent years, renewable energy has received strong support from many countries, developed rapidly and steadily increased its market share [13]. However, the research shows that, with the increase in renewable installed capacity, the demand for power-system flexibility is also increasing [14]. Energy storage is one of the important options to improve the flexibility of power systems [15]. At present, the most widely used energy-storage technology is pumped storage, but its disadvantage is also very obvious: that is, specific locations such as steep slopes and nearby lakes are needed to meet the needs of system operation [16]. However, it is worth noting that PTG technology is expected to become a solution for large-scale energy-storage technology, which converts electric energy into hydrogen or methane [17]. At the same time, due to the construction of the “West-to-East gas transmission” project, the region has more natural-gas infrastructure, including pipelines and storage tanks. These can significantly improve energy-storage capacity and utilization capacity.
The focus of this study is to simulate the establishment of a PTG plant based on the distribution of renewable resources in Northwest China, CO2 emissions of industrial enterprises in this region, local prices and labor costs, and explore the utilization of renewable resources and the CO
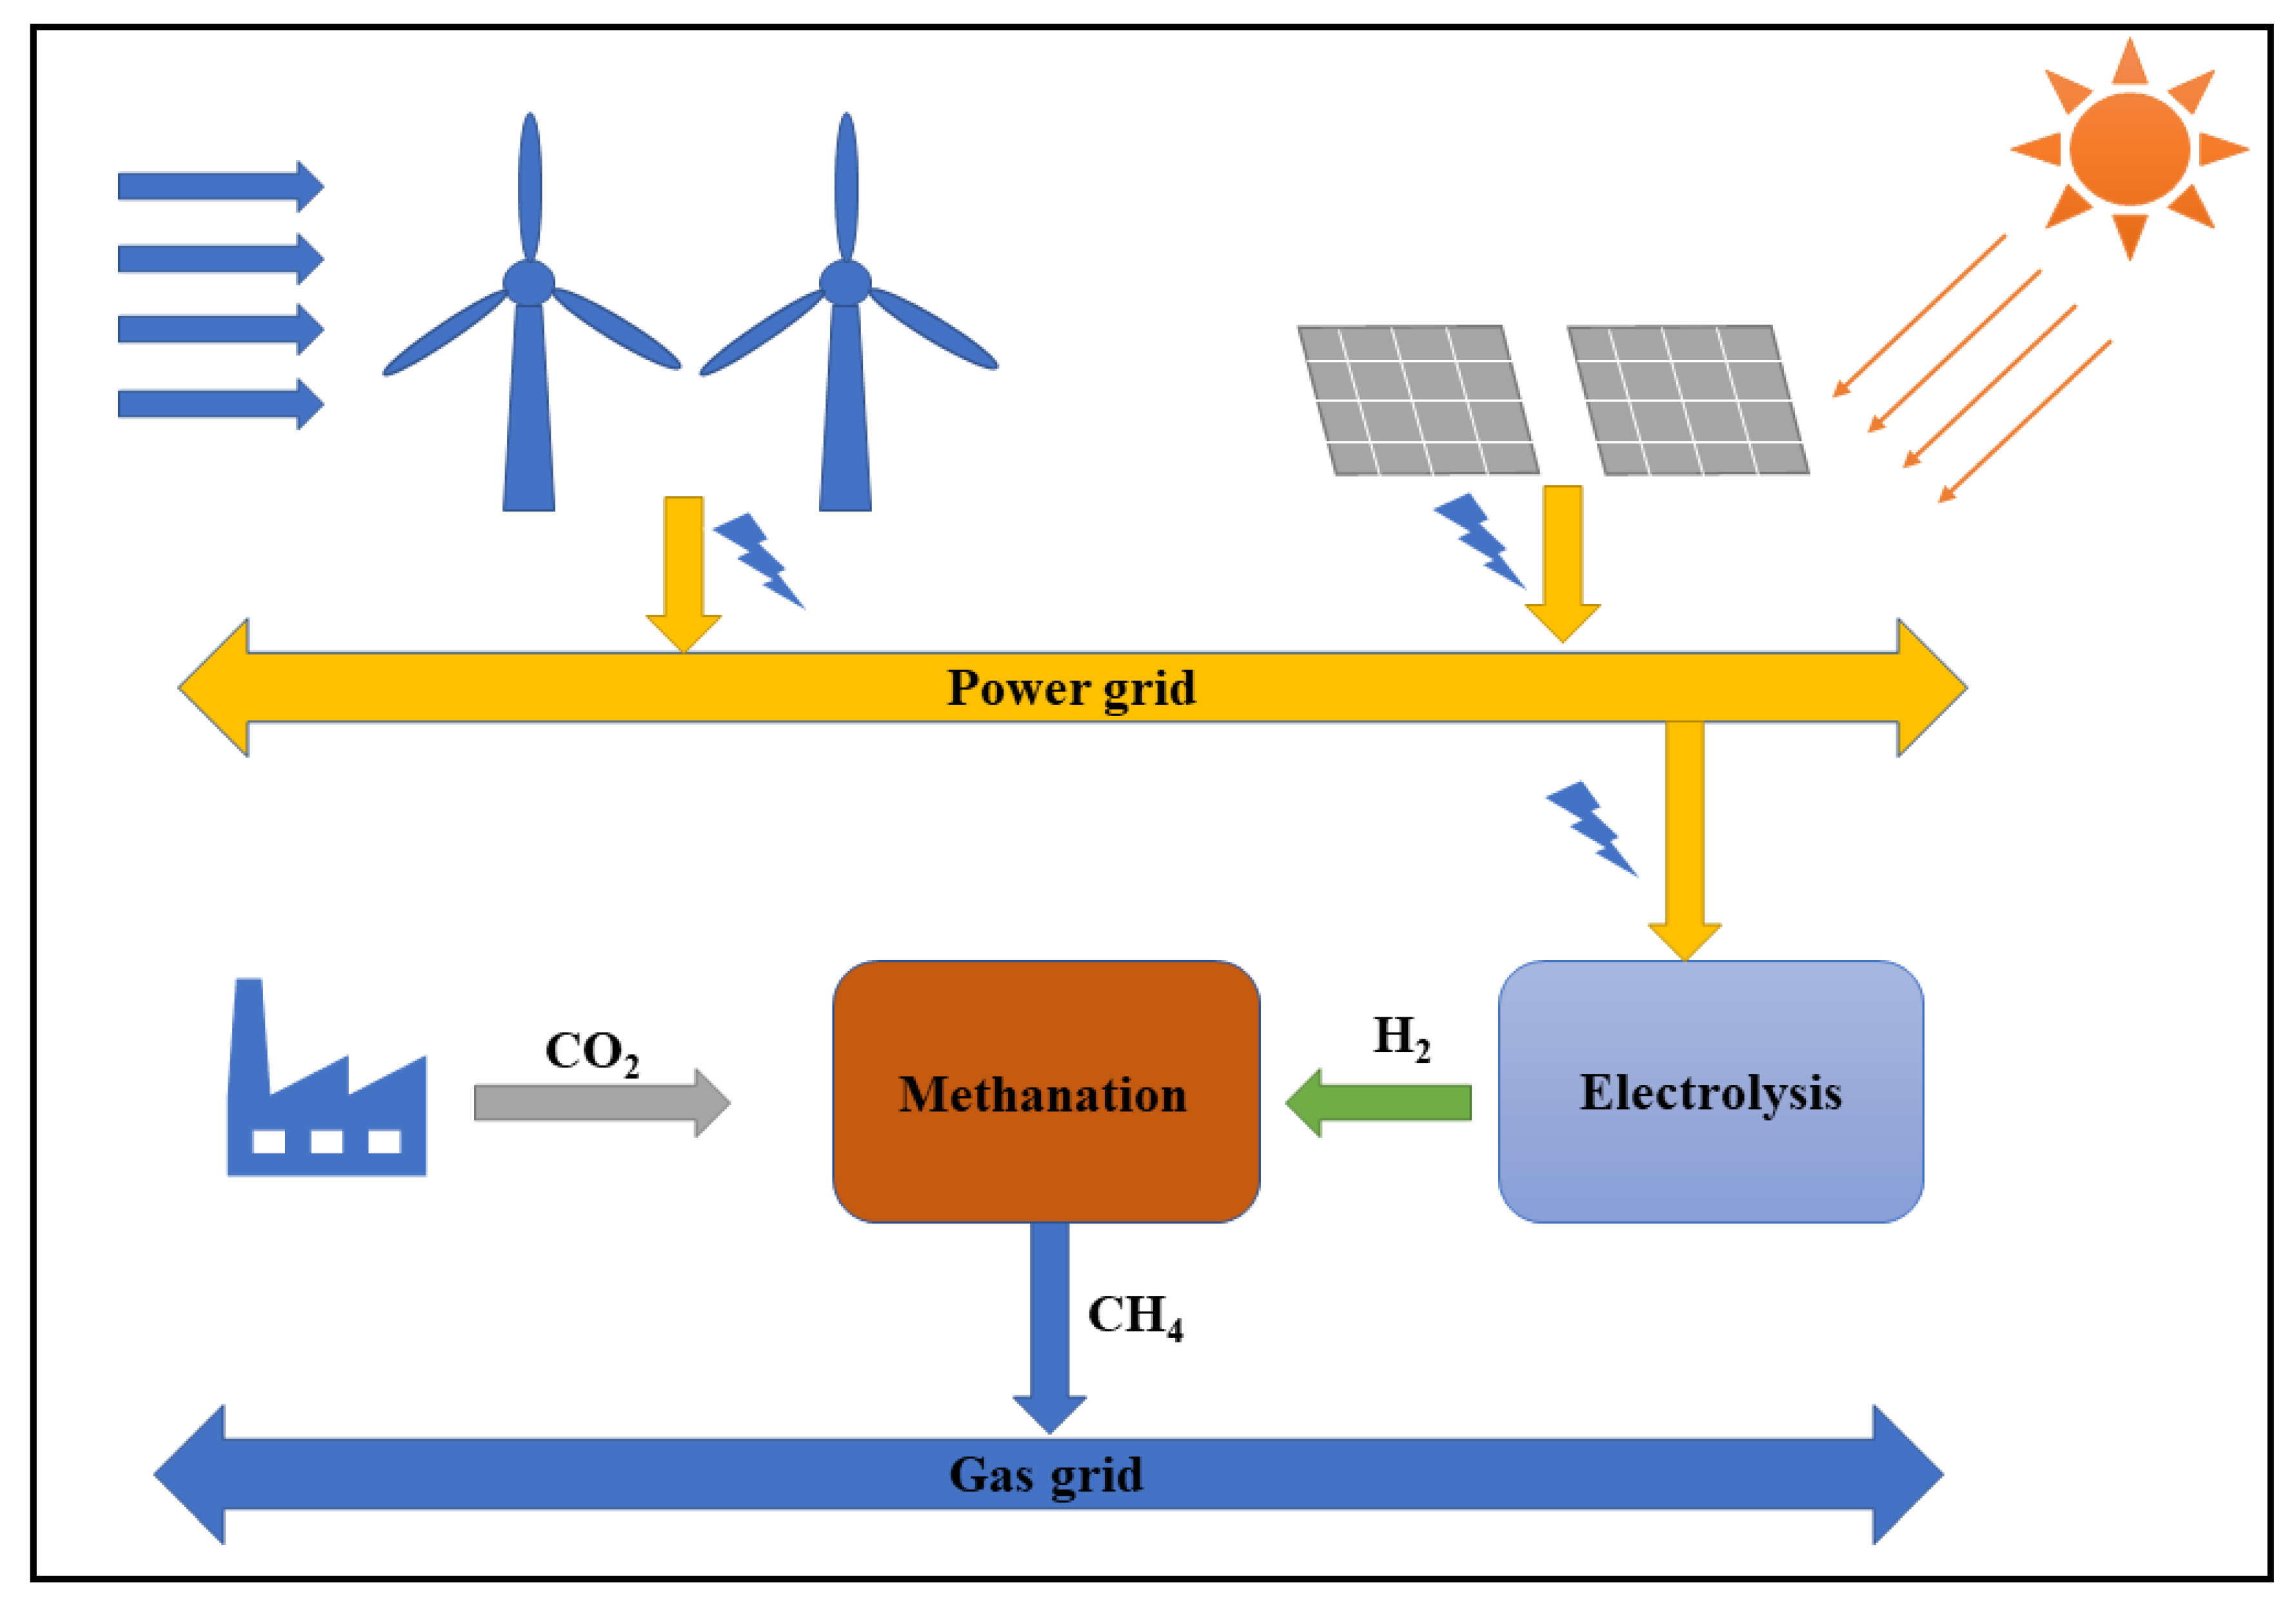
2 conversion path in this region. The schematic diagram of the plant is shown in Figure 1. The plant is composed of renewable-energy power generation, electrolytic-cell hydrogen production, the CO2 absorption process and the CO2 methanation process. The ratio of the CO2 absorption solution was 10 wt% MDEA + 30 wt% PZ, to save the energy in the absorption process to the greatest extent. The heat of the absorption process and methanation process was coupled to recover 17.85 MW of heat. Through the CO2 flow, the H2 flow was determined, and then the electrolytic cell capacity and renewable power generation capacity were determined. The economy of the PTG plant was evaluated. Combined with the corresponding carbon tax policy, the results show that the SNG cost generated by PTG at this stage was 1782 USD/ton. The cost sensitivity analysis shows that the cost of an electrolytic cell accounted for the largest proportion. In the future, with the progress of technology and the improvement in electrolytic efficiency, this technology is expected to run on a large scale, which is one of the technical paths towards decarbonization in the future.

2. Materials and Methods

This part focuses on the methods and technologies used in carbon-dioxide capture, carbon-dioxide methanation and hydrogen production from electrolytic water

2.1. Carbon Capture

Carbon capture generally requires specific sources of CO2, such as tail gas from large coal power plants, steel, cement and other large industries. Carbon capture can be implemented in three stages: post-combustion, pre-combustion and oxy-fuel [18]. Post combination is widely used in large-scale industrialization. Dust and sulfide need to be removed from the treated flue gas first. These amine-based solutions, such as monoethanolamine (MEA), amino methyl propanol, amino ethyl amino ethanol, piperazine (PZ), and methyldiethanolamine (MDEA), are then used to absorb CO2. However, the disadvantage of amine-based technology is that the energy consumption is very high, which led many researchers to study efficient processes and solvents [19]. Previous work showed that optimizing the process can significantly reduce energy consumption, by 20% [20]. Studies also showed that the configuration of new solvents can save 18% of current energy consumption [21].
The establishment of the CO2 absorption model in this study is based on Aspen HYSYS™ V.12 software (China University of Petroleum, Beijing authorized use. Beijing, China). By visiting and investigating relevant petroleum and petrochemical enterprises in Karamay, the composition of tail gas to be absorbed was obtained, as shown in Table 1.
The design of the CO2 absorption process is shown in Figure 2. The mixture of MDEA and PZ is considered as the absorbent. The absorption liquid from the absorption tower enters the flash module (FLASH) through the heat exchanger (LNG-101) and is divided into two parts: gas flow and liquid flow. Here, the rich solvent is flashed to produce a gas stream (composed of H2O and CO2), which is then compressed and sent back to the bottom of the flash module. The liquid flow is at the top of the flash module. This design can reduce the steam demand of the distillation column (REGEN) and heat the rich solvent entering the heat exchanger (LNG-102). This design refers to the practice of Le Moullec et al. [22]. Based on the heat-pump effect, the heat quality of the supply system is improved.

2.2. CO2 Methanation

The methanation of CO2 refers to the process of producing methane and water with CO2 (and a small part of CO) under high pressure and a certain temperature. At present, the catalysts used in large-scale commercial use are nickel or nickel-based catalysts [23]. The methanation process is shown in Equations (1)–(4). Here, (1) and (2) represent the hydrogenation of CO2 and CO, (3) represents the reverse reaction of water gas, and (4) represents the Boudouard reaction. The whole reaction process is strongly exothermic, but some studies have shown that a temperature exceeding 500 °C will lead to carbon deposition and deactivation of the catalyst. High temperatures will inhibit the conversion of CO2; therefore, it is necessary to control the reaction temperature to ensure the progress of the reaction. Processes (1)–(3) will produce water, which can be supplied to the electrolytic cell.
CO 2 + 4 H 2   CH 4 + 2 H 2 O  ( Δ H 0 = −165.1 KJ/Mol )
CO + 3 H 2   CH 4 + 2 H 2 O  ( Δ H 0 = −206.3 KJ/Mol )
CO 2 + H 2   CO + H 2 O  ( Δ H 0 = +41.2 KJ/Mol )
2 CO   C ( S ) + C O 2  ( Δ H 0 = −172.5 KJ/Mol )
The establishment of the CO2 methanation model in this study is based on Aspen Plus™ V.12 software. The methanation reactors adopt fixed-bed adiabatic reactors, which can adapt to large-scale methanation production. The process flow is shown in Figure 3. Four fixed-bed adiabatic reactors (R-1; R-2; R-3; R-4) are set; each stage is equipped with a cooling system (S13; S16; S22; S25) to ensure that the reaction temperature is controlled at 350 °C, so as to avoid carbon deposition (coking) and ensure that the catalyst will not be inactivated. At the same time, the heat taken away by the cooling system will not be wasted and will be used in the CO2-capture process or sold to the public sector for use (if any). The molar flow ratio of feed ports S1 (CO2) and S3 (H2) is 1:4. The reason for setting this ratio is available in a previous study [24]. The synthesized methane gas contains a lot of water, which must be removed in the use stage. Therefore, a condensation module (B19) is set to separate the water. Finally, further dehydrogenation (B24) and pressurization are required to produce SNG that meets the existing natural-gas pipeline standards.

2.3. Hydrogen Production from Electrolytic Water

Hydrogen production from electrolyzed water refers to the use of renewable energy, such as wind, solar and tidal energy, to generate electricity. Electricity is supplied to the electrolytic cell, and electrolyzed water produces hydrogen. The reaction equation of this process is shown in (5) [25]. Since renewable energy is used and the products are oxygen and hydrogen, this method has also become an environment-friendly technology option. At present, researchers have developed three typical electrolytic cells: alkaline water electrolytic (AWE), solid oxide electrolytic (SOE), and proton exchange membrane electrolytic (PEM). The technical specifications of the three electrolyzers are shown in Table 2 [26,27].
However, due to low conversion rate and high energy consumption, the biggest problem of electrolytic hydrogen production is low economic competitiveness. However, with the goal of energy decarbonization and the approaching pressure of carbon neutralization, coupling this technology with existing old power plants, photovoltaic power plants and wind power plants; using excess power to produce hydrogen; and storing it as energy-storage gas seems to be a scheme that can improve economic competitiveness and be implemented commercially.
H2O + Electricity (237.2 KJ/Mol) + Heat (48.6 KJ/Mol) → H2 + 1/2O2
AWE was first proposed by Troostwijk and Diemann in 1789 [28]. The electrolysis process is shown in Figure 4. The alkaline solution (KOH/NaOH) near the cathode is reduced to one hydrogen molecule (H2) and two hydroxyl ions (OH) are generated. Hydrogen molecules escape from the cathode surface. Under the influence of current, hydroxyl groups are transferred to the anode through the middle diaphragm, where they are converted into 1/2 oxygen molecules (O2) and one water molecule (H2O). Finally, oxygen molecules escape from the anode surface. The working temperature of the electrolytic is 40–90 ℃ and the service life can reach 30 years. Moreover, with the progress of technology, the response time of electrolytic has also gradually shortened. A study in 2014 showed that the restart time after shutdown was shortened to 15 min, which can adapt to fluctuating renewable power [29]. However, some studies have shown that the scheduling model is very important for the flexible operation of an electrolytic [30]. Generally speaking, an alkaline electrolyzer is the most mature, stable and cheap commercial cell because of its early development. Therefore, AWE was selected for hydrogen-production facilities.

3. Results

This section mainly analyzes the CO2 capture process, methanation process, hydrogen production from AWE, and energy consumption designed above. For the CO2 capture process, the energy consumption of different absorbents was analyzed and the CO2 absorption efficiency was calculated. For the methanation process, the flow data of each reaction stage are given as Supplementary Materials, and the final methanation efficiency was calculated. Through the hydrogen flow rate at the feed inlet of the methanation process, an AWE group was constructed to stably produce hydrogen.

3.1. Carbon-Capture Process

Select the CO2 adsorbent to be used: MDEA, PZ, and the mixture of MDEA and PZ. Referring to previous studies [31,32], the 40 wt% concentration of a PZ solution was used as a CO2 capture solvent. Then the concentration of the absorbent solution was set to 40 wt%. For PZ + MDEA mixed solution, the total solution mass fraction remained unchanged, and only the proportion of the two solutions changed. In order to ensure that the solvent ratio was the only variable, the pressure of the absorption tower and distillation tower should be consistent, in which the pressure of the absorption tower was 12 MPa and the pressure of the distillation tower was 52 MPa. By changing the composition of the absorbent, the total energy required in the absorption process was investigated. The energy required for different solvent processes is shown in Figure 5. It can be seen that, when the absorption solution is composed of 10 wt% MDEA + 30 wt% PZ, the energy required for the whole process is the least. Therefore, that solvent was selected as the CO2 absorbent.
Through the whole carbon-capture process, the captured gas was obtained, and the components are shown in Table 3.
In order to investigate the carbon-capture efficiency, the CO2-absorption efficiency is defined, ηCO2, as shown in Equation (6).
ηCO2 = fproduced/fin
where, fproduced is the molar flow rate of CO2 in the product, and fin is the molar flow rate of CO2 at the feed end. Through calculation, the capture efficiency was 91.5%. At the same time, Table 4 gives some performance specifications of the CO2-capture device.

3.2. CO2 Methanation

This section discusses the output results of the CO2 methanation process. Table 5 shows the changes in gas components in each part of the methanation process.
In order to investigate the methanation efficiency of the process, methanation efficiency ηh-c is shown in (7). Where, ηH-C is methanation efficiency, λc-out is the molar flow of (S38) CH4 at the outlet of the reaction process (kmol/s), λh-out is the molar flow of (S36) H2 at the outlet of the reaction process (kmol/s), λh-in is the molar flow rate of (S3) H2 at the reaction inlet (kmol/s). Mc and Mh are the molar mass (kg/mol) of CH4 and H2, respectively, and Lc and Lh are the low calorific values (MJ/kg) of CH4 and H2, respectively. Finally, the methanation efficiency of this process was 77.5%.
ηh-c = (λc-out·Mc·Lc + λh-out·Mh ·Lh)/λh-in·Mh·Lh
Similarly, Table 6 shows the operating specifications of other equipment in the methanation process. The specific dimensions of the four adiabatic reactors and the mass of the catalyst are given in Table 7.

3.3. Electrolytic Scale

This part discusses the capacity of the electrolytic cell to ensure the stable supply of hydrogen required in the methanation stage. It can be seen from Table 4 that the hydrogen molar flow rate at the feed inlet (S3) of the methanation process was 826.29 kmol/h. In order to adapt to this flow, through sufficient market research and literature research, China Huaneng Group Clean Energy Technology Research Institute Co., Ltd. was selected to develop an alkaline electrolytic [33]. The specific specifications are shown in Table 8.
Then, the required electrolytic capacity was obtained. It was specified that the electrolytic works with customized hydrogen power. Through calculation, the electrolytic capacity is 158 MW, that is, 29 alkaline electrolytics. Considering the start-up, shutdown, maintenance, and other operations of the electrolytic, the capacity of the electrolytic was expanded by 10% to ensure stable output. Then, 174 MW capacity was required, that is, 32 sets of the equipment are required.
In conclusion, based on the industrial tail gas emission of Karamay City, the scale of the carbon capture process, methanation process and hydrogen production from electrolytic water were designed. Table 9 is a summary of these works. The table shows the materials, output, and other information required by the PTG plant.

4. Discussion

This section mainly analyzes the economy and technology of the PTG plant. The energy consumption of the plant was analyzed, and the heat circulation module was added to make better use of heat. Based on the current market levels, current policies, and bank discount rates, the prices of land, equipment, labor, raw materials, and products were fully considered, and the economic feasibility of establishing PTG factory was explored at this stage.

4.1. Energy Consumption Analysis

As the methanation process is highly exothermic, it can collect heat for carbon capture, or send it to a steam turbine for power generation to provide power for plant operation. Figure 6 shows the composite curve of the cooling and heating load of the PTG plant. The total heat recovered was 17.85mw and the temperature range was 40–350 °C. At 150 °C, this part of heat can be sent to the distillation tower of the CO2 process. This part of the heat was 5.16 MW, which can effectively compensate for the heat demand of the process.
At the same time, it should be pointed out that the adiabatic reactor in the methanation stage is equipped with a cooling module. This high-temperature steam can be sent to the steam turbine to generate electricity, to be used for the consumption of compressors and pumps. The turbine heat rate [34] was 8063.6 kJ/kWh. The total molar enthalpy of cooling modules (S14, S17, S21, S27) per unit time was 196075.147 MJ, so the power generated by the steam turbine can fully meet the power required by the carbon-capture and methanation equipment, with reference to Table 4 and Table 6.

4.2. Economic Analysis

In this section, the investment cost and operation cost of the PTG plant is simulated and evaluated according to the simulation results, and the plant income is calculated according to the products. The cost coefficient method was used to calculate the fixed investment cost, as shown in (8).
P 1 = P 2 · ( 1 + i = 1 n R i ) · N
Among them, P1 is the total investment in fixed assets; P2 is the investment in equipment, taken to be 1.2; Ri is the cost coefficient of each part; and N is the comprehensive coefficient. Table 10 shows the cost coefficients of each part. The operating period is assumed to be 20 years and the residual value is assumed to be 0. The total project cost C is defined as Equation (9) [35], where Ci is the cost of each part; see Table 11 for details. Methane and pure oxygen can be sold, and carbon-emission reductions can be sold through the carbon trading market. The price is based on the national carbon trading price on 4 June 2021 [36], and the labor cost refers to the per capita disposable income of the city.
C = P 1 + i = 1 n C i
Regarding the cost of the alkaline electrolyzer, with the maturity of large-scale commercial technology and sufficient market competition, the equipment investment price will continue to decline. The investment cost of the alkaline electrolyzer selected in this study is 314 USD/kW [38]. Then, the calculation method of hydrogen production costs from electrolytic water is shown in (10).
S = (S1 + S2 + S3)/(C·Y) + SE·B
where S is hydrogen production cost, S1 is the investment cost for the electrolytic, S2 and S3 are the renewal and maintenance costs of electrolytic; these costs are 40% and 5%. C is the annual output of hydrogen, and Y is the operation cycle of the unit, which is 20 years. SE is the power cost of the electrolytic, and B is the power required to produce 1kg of hydrogen. After calculation, the hydrogen cost of electrolytic water was 4.66 USD/kg.
According to Formulas (8) and (9), Table 8 and Table 9, the cost required for each ton of natural gas produced by the PTG plant can be calculated, as shown in Figure 7.
The cost of producing SNG in the PTG plant is 1782 USD/ton, which is also shown in Guilera. et al. [39], and Chauvy et al. [3], within the cost range assessed. Compared with the traditional LNG price [40] of 607.7 USD/ton, the SNG produced by the PTG plant is three times the traditional price. However, it is worth noting that, from Figure 7, it can be seen that the high cost of hydrogen production increases the cost of SNG. Product pure oxygen and methanation product SNG can be sold to improve system revenue. It is worth noting that China launched the carbon trading market in 2017, so the CO2 used in the methanation stage can be sold as a carbon reduction quota, but the profit proportion is not high at this stage.
In order to further investigate the economy of the PTG plant, the sensitivity analysis of a large part of the cost was carried out. This included electrolytic electricity price, oxygen price, carbon trading price, etc., as shown in Figure 8.
Through sensitivity analysis, it can be seen that the change in electrolytic cell power consumption in the hydrogen production stage has the greatest impact on SNG cost. In the future, through technological progress, the improvement of electrolytic cell efficiency and the decrease in power consumption, the production cost of SNG can be reduced. Changes in oxygen sales profits and carbon trading prices can also have a certain impact on SNG costs.

5. Conclusions

The current work evaluates the technical route of setting up a PTG plant to produce SNG with CO2. Based on Karamay industrial tail gas emissions, the carbon capture process and methanation process were designed using Aspen Hysys™ V.12 software and Aspen Plus™ V.12 software. The heat flow in the process was recycled to ensure the balance of quality and energy. The alkaline electrolyzer module was designed to supply hydrogen stably. The results show that the PTG plant can produce 3.326 tons of natural gas per hour and consume 8.899 tons of CO2 at the same time. The final carbon capture efficiency was 91.5%, and the methanation efficiency was 77.5%. The price of one ton of SNG produced by the PTG plant was USD 1782, which is three times the price of traditional natural gas. At present, it is not economically competitive. According to the cost analysis, the cost of hydrogen accounted for the largest proportion, which is due to the high-power consumption of electrolytic hydrogen production. However, it is worth noting that the implementation of large-scale commercial electrolysis cases in the future will gradually reduce the electrolysis cost, and then reduce SNG production costs. With the continuous improvement of the national carbon trading market, the carbon price is expected to rise in the future, which can also bring objective benefits to the PTG plant.
It should be pointed out that, although this study gives a economic and technological construction scheme of a PTG plant in Karamay, it is based on the flue gas produced by industrial enterprises. In future research, more flexible schemes can be designed. For example, matching the thermal power plant, using the surplus power of the thermal power plant to produce hydrogen by electrolysis, and then converting it into methane as energy-storage gas, which is expected to greatly reduce the cost. In a previous study, Momeni and others chose a 500 MW gas-fired power plant, which can produce 579.8 ktons of methane per year by recovering tail gas and excess power, reducing the carbon emission of the power plant by 66%. In addition, it can also be combined with power-grid energy storage and peak shaving. Electricity is provided through renewable energy, hydrogen is produced by electrolysis, and then converted into methane with the captured CO2, which is used as energy-storage gas to regulate the grid load. However, with technological progress, PTG technology is expected to be implemented on a large scale, and is one of the technologies to achieve carbon neutrality in the future.

Supplementary Materials

The supporting information can be downloaded at: https://www.mdpi.com/article/10.3390/su14105929/s1.

Author Contributions

Formal analysis, W.J.; Funding acquisition, T.Y.; Investigation, T.Y.; Methodology, W.J.; Project administration, S.Z. and T.Y.; Resources, S.Z.; Software, W.J.; Supervision, S.Z.; Visualization, W.J.; Writing—original draft, W.J.; Writing—review & editing, W.J. and S.Z. All authors have read and agreed to the published version of the manuscript.

Funding

This research was funded by Natural Science Foundation of Xinjiang Uygur Autonomous Region, No. 2019D01A103 and Geological Research Institute of CNPC West Drilling Engineering Co., Ltd., grant number XQHX20200029.

Institutional Review Board Statement

This study did not require ethical approval.

Informed Consent Statement

This study did not involve humans.

Data Availability Statement

This study did not report any data.

Conflicts of Interest

The authors declare no conflict of interest.

References

  1. Sohani, A.; Rezapour, S.; Sayyaadi, H. Comprehensive performance evaluation and demands’ sensitivity analysis of different optimum sizing strategies for a combined cooling, heating, and power system. J. Clean. Prod. 2021, 279, 123225. [Google Scholar] [CrossRef]
  2. Razmi, A.; Soltani, M.; Kashkooli, F.M.; Garousi Farshi, L. Energy and exergy analysis of an environmentally-friendly hybrid absorption/recompression refrigeration system. Energy Convers. Manag. 2018, 164, 59–69. [Google Scholar] [CrossRef]
  3. Chauvy, R.; Dubois, L.; Lybaert, P.; Thomas, D.; de Weireld, G. Production of synthetic natural gas from industrial carbon dioxide. Appl. Energy 2020, 260, 114249. [Google Scholar] [CrossRef]
  4. Fact Sheet: The American Jobs Plan. Available online: https://www.whitehouse.gov/briefing-room/statements-releases/2021/03/31/fact-sheet-the-american-jobs-plan/ (accessed on 21 January 2022).
  5. Vishal, V.; Chandra, D.; Singh, U.; Verma, Y. Understanding initial opportunities and key challenges for CCUS deployment in India at scale. Resour. Conserv. Recycl. 2021, 175, 105829. [Google Scholar] [CrossRef]
  6. Analysis of Global Carbon Dioxide Emission in 2020. Available online: https://www.chyxx.com/industry/202108/966523.html (accessed on 21 January 2022).
  7. Li, Y.; Lan, S.; Ryberg, M.; Pérez-Ramírez, J.; Wang, X. A quantitative roadmap for China towards carbon neutrality in 2060 using methanol and ammonia as energy carriers. iScience 2021, 24, 102513. [Google Scholar] [CrossRef]
  8. Sun, L.; Chen, W. Development and application of a multi-stage CCUS source–sink matching model. Appl. Energy 2017, 185, 1424–1432. [Google Scholar] [CrossRef]
  9. Quarton, C.J.; Samsatli, S. Power-to-gas for injection into the gas grid: What can we learn from real-life projects, economic assessments and systems modelling? Renew. Sustain. Energy Rev. 2018, 98, 302–316. [Google Scholar] [CrossRef]
  10. Kippers, M.; de Laat, J.; Hermkens, R.; Overdiep, J.; van der Molen, G.; van Erp, S.; van der Meer, S. International Gas Union Research Conference. 2011. Available online: https://www.mendeley.com/catalogue/a8a1c899-1486-33c5-91f8-135646a8217e/ (accessed on 21 January 2022).
  11. Hybridge. Hybridge—A Project of Amprion and Open Grid Europe 2020. Available online: https://www.hybridge.net/index-2.html (accessed on 21 January 2022).
  12. Bailera, M.; Lisbona, P.; Romeo, L.M.; Espatolero, S. Power to Gas projects review: Lab, pilot and demo plants for storing renewable energy and CO2. Renew. Sustain. Energy Rev. 2017, 69, 292–312. [Google Scholar] [CrossRef]
  13. Administration UEI. Levelized Cost and Levelized Avoided Cost of New Generation Resources in the Annual Energy Outlook 2017. Available online: http://large.stanford.edu/courses/2017/ph240/muhammadshittu1/docs/eia-apr17.pdf (accessed on 21 January 2022).
  14. Belderbos, A.; Virag, A.; D’haeseleer, W.; Delarue, E. Considerations on the need for electricity storage requirements: Power versus energy. Energy Convers. Manag. 2017, 143, 137–149. [Google Scholar] [CrossRef]
  15. Ekman, C.K.; Jensen, S.H. Prospects for large scale electricity storage in Denmark. Energy Convers. Manag. 2010, 51, 1140–1147. [Google Scholar] [CrossRef]
  16. US Energy Information Administration. International Energy Statistics. 2017. Available online: https://www.eia.gov/ (accessed on 20 April 2022).
  17. DNV KEMA Energy & Sustainability. Systems Analyses Power to Gas. 2013. Available online: https://docplayer.net/7637393-Dnv-kema-energy-sustainability-final-report-systems-analyses-power-to-gas-deliverable-1-technology-review.html (accessed on 20 April 2022).
  18. Straka, P. A comprehensive study of Power-to-Gas technology: Technical implementations overview, economic assessments, methanation plant as auxiliary operation of lignite-fired power station. J. Clean. Prod. 2021, 311, 127642. [Google Scholar] [CrossRef]
  19. le Moullec, Y.; Kanniche, M. Screening of flowsheet modifications for an efficient monoethanolamine (MEA) based post-combustion CO2 capture. Int. J. Greenh. Gas Control 2011, 5, 727–740. [Google Scholar] [CrossRef]
  20. Mostafavi, E.; Ashrafi, O.; Navarri, P. Assessment of process modifications for amine-based post-combustion carbon capture processes. Clean. Eng. Technol. 2021, 4, 100249. [Google Scholar] [CrossRef]
  21. Dubois, L.; Thomas, D. Carbon dioxide absorption into aqueous amine based solvents: Modeling and absorption tests. Energy Procedia 2011, 4, 1353–1360. [Google Scholar] [CrossRef] [Green Version]
  22. le Moullec, Y.; Neveux, T.; al Azki, A.; Chikukwa, A.; Hoff, K.A. Process modifications for solvent-based post-combustion CO2 capture. Int. J. Greenh. Gas Control 2014, 31, 96–112. [Google Scholar] [CrossRef]
  23. Xu, J.; Froment, G.F. Methane steam reforming, methanation and water-gas shift: I. Intrinsic kinetics. AIChE J. 1989, 35, 88–96. [Google Scholar] [CrossRef]
  24. Chauvy, R.; Dubois, L.; Thomas, D.; de Weireld, G. Environmental impacts of the production of synthetic natural gas from industrial carbon dioxide. Sustain. Prod. Consum. 2022, 30, 301–315. [Google Scholar] [CrossRef]
  25. Kumar, S.S.; Himabindu, V. Hydrogen production by PEM water electrolysis—A review. Mater. Sci. Energy Technol. 2019, 2, 442–454. [Google Scholar] [CrossRef]
  26. Buttler, A.; Spliethoff, H. Current status of water electrolysis for energy storage, grid balancing and sector coupling via power-to-gas and power-to-liquids: A review. Renew. Sustain. Energy Rev. 2018, 82, 2440–2454. [Google Scholar] [CrossRef]
  27. Dincer, I.; Acar, C. Review and Evaluation of Hydrogen Production Methods for Better Sustainability. Altern. Energy Ecol. (ISJAEE) 2016, 11–12, 14–36. [Google Scholar] [CrossRef]
  28. Trasatti, S. Water electrolysis: Who first? J. Electroanal. Chem. 1999, 476, 90–91. [Google Scholar] [CrossRef]
  29. Bhandari, R.; Trudewind, C.A.; Zapp, P. Life cycle assessment of hydrogen production via electrolysis—A review. J. Clean. Prod. 2014, 85, 151–163. [Google Scholar] [CrossRef]
  30. Varela, C.; Mostafa, M.; Zondervan, E. Modeling alkaline water electrolysis for power-to-x applications: A scheduling approach. Int. J. Hydrogen Energy 2021, 46, 9303–9313. [Google Scholar] [CrossRef]
  31. van der Ham, L.V.; Romano, M.C.; Kvamsdal, H.M.; Bonalumi, D.; van Os, P.; Goetheer, E.L.V. Concentrated Aqueous Piperazine as CO2 Capture Solvent: Detailed Evaluation of the Integration with a Power Plant. Energy Procedia 2014, 63, 1218–1222. [Google Scholar] [CrossRef] [Green Version]
  32. Freeman, S.A.; Dugas, R.; van Wagener, D.H.; Nguyen, T.; Rochelle, G.T. Carbon dioxide capture with concentrated, aqueous piperazine. Int. J. Greenh. Gas Control 2010, 4, 119–124. [Google Scholar] [CrossRef]
  33. A Single Alkaline Electrolyzer with the World’s Largest Capacity of Production Was Successfully Manufactured Today. Available online: https://baijiahao.baidu.com/s?id=1717508822523316353&wfr=spider&for=pc (accessed on 27 January 2022).
  34. Guo, L.; Ding, Y.; Liao, Q.; Zhu, X.; Wang, H. A new heat supply strategy for CO2 capture process based on the heat recovery from turbine exhaust steam in a coal-fired power plant. Energy 2022, 239, 121817. [Google Scholar] [CrossRef]
  35. Mills, G.A.; Steffgen, F.W. Catalytic Methanation. Catal. Rev. 1974, 8, 159–210. [Google Scholar] [CrossRef]
  36. K-line Trend Chart of China’s Seven Carbon Markets. Available online: http://www.tanpaifang.com/tanhangqing/ (accessed on 30 January 2022).
  37. Chengdu Hydrogen Energy Subsidy Policy. Available online: https://zhuanlan.zhihu.com/p/328100548 (accessed on 30 January 2022).
  38. Technological Breakthrough in Alkaline Electrolyzer. Available online: http://www.cnenergynews.cn/guonei/2021/12/08/detail_20211208112828.html (accessed on 29 January 2022).
  39. Guilera, J.; Morante, J.R.; Andreu, T. Economic viability of SNG production from power and CO2. Energy Convers. Manag. 2018, 162, 218–224. [Google Scholar] [CrossRef]
  40. Tips on Gas Price Changes on January 26. Available online: http://news.10jqka.com.cn/20220126/c636364119.shtml (accessed on 30 January 2022).
Figure 1. Schematic diagram of PTG plant.
Sustainability 14 05929 g001
Figure 2. Carbon capture flow chart.
Sustainability 14 05929 g002
Figure 3. CO2 methanation process.
Sustainability 14 05929 g003
Figure 4. Principle of alkaline water electrolysis.
Sustainability 14 05929 g004
Figure 5. Absorbed energy required by different solvents.
Sustainability 14 05929 g005
Figure 6. Hot and cold composite curves of PTG plant.
Sustainability 14 05929 g006
Figure 7. Cost of producing one ton of SNG in PTG plant.
Sustainability 14 05929 g007
Figure 8. SNG cost sensitivity analysis.
Sustainability 14 05929 g008
Table 1. Composition of gas to be treated (molar flow 1100 kg·mole/h, 12 MPa, 40 °C).
Main Gas CompositionMole Fraction (%)
N262.1
CO223.1
O28.6
H2O6.2
Table 2. Typical specifications of electrolyzers.
SpecificationsUnitAWEPEMSOE
Technology maturity Large-scale commercializationCertain commercializationLaboratory research
System lifeyear20–3010–20-
Hydrogen purity%>99.899.999-
Cold start-up timemin15<15>60
Investment cost$/kW890–17001550–2300>2200
Table 3. Gas composition after capture (molar flow 208.9 kmol/h, 50 MPa, 40 °C).
Main Gas CompositionMole Fraction (%)
N20.2%
CO298.43%
H2O1.55%
Table 4. Performance specifications of CO2 capture.
ParametersValues
Waste gas
N2712.499 kmol/h
CO218.9572 kmol/h
O294.7028 kmol/h
H2O56.0436 kmol/h
CO0.0146 kmlo/h
SO20.0006 kmol/h
NO0.0052 kmol/h
Energy demand
Compressor1.039 MW
Pumps0.085 MW
Coolers6.728 MW
Total319 MW
Material requirement
PZ1.3931 kmol/h
MDEA0.3357 kmol/h
Table 5. Molar gas flow of each module.
Gas CompositionS1S3R-1R-2R-3R-4S38
Total molar flow (kmol/h)211827.123258.72842.974793.894625.741202.02
CH4 (%)//3.0911.5715.3832.9599.90
CO2 (%)98/18.0612.9610.660.090.01
H2 (%)/99.972.1451.7242.560.250.07
H2O (%)1.980.16.723.7431.3966.70.02
O2 (%)///////
N2 (%)0.12//////
Table 6. Performance specifications of CO2 methanation.
ParametersValues
Energy demand
Compressor0.967 MW
Coolers−7.9026 MW
Reactor
Operating pressure100 MPa
Pressure loss2%
Operating temperature350 °C
CatalyzerNi/MgAl2O4
Table 7. Adiabatic reactor specification.
ParametersR-1R-2R-3R-4
Length4.97 m5.56 m6.83 m6.62 m
Diameter2 m1.4 m1.2 m1.2 m
Catalyst weight22 ton5.87 ton5.44 ton7.47 ton
Table 8. Technical specifications of alkaline electrolyzer.
ParametersValues
Rated hydrogen production1300 Nm/h
Maximum hydrogen production1500 Nm/h
Maximum current density6000 A/m
Energy consumption<4.2 kWh/NmH
Table 9. PTG-plant energy consumption and material consumption.
SpecificationValues
Carbon captureTail gas34.109 ton/h
CO2 methanation inputs CO29.177 ton/h
H21.681 ton/h
Cooling water14.8 ton/h
Hydrogen productionNumber of electrolytic cells30
PtG outputs SNG3.236 ton/h
Table 10. Cost coefficient of each part.
PartExpense Type i Cost   Coefficient   R i
Direct costExisting equipment and plant1
Purchased equipment0.47
Instrumentation and control equipment0.36
The conduit0.68
Electrical system0.11
Building service facilities0.18
Plant-improvement facilities0.10
Living-service facilities0.60
Indirect costEngineering supervision0.28
Construction cost0.31
Legal service fee0.04
Contractor’s costs0.18
Contingency expenditure0.35
Table 11. Operating costs of various parts of the project.
Project (i)Specific MattersCost
1Raw materialAmine solvent: 3.5 USD/kg, catalyzer: 240 USD/kg, industrial water: 0.24 USD/ton, electrolytic water: 1.57 USD/kg, hydrogen: produced by electrolysis; selling price of methane: 0.32 USD/Nm3, price of industrial oxygen: 157 USD/ton
2Public utilityCooling water: 0.03 USD/ton, electric energy required for electrolysis [37], 0.047 USD/kWh;
3Plant operation and maintenance costsLabor cost40 people/shift, 3 shifts/day, 9432 USD/person·year
Maintenance and repair6% of capital investment
Consumption of operating supplies15% of working capital
4Depreciation20-year operation cycle, with a maturity discount of 0 USD
5General expenses15% of the total product cost
Publisher’s Note: MDPI stays neutral with regard to jurisdictional claims in published maps and institutional affiliations.

