Abstract
The technological performance and environmental advantages of replacing sand by ornamental stone processing waste (OSPW) in the production of mortars for civil construction were studied. Technological properties associated with the standard consistency index, squeeze flow and bulk densities as well as the determination of water retention and calorimetry analysis were evaluated in the mortars’ fresh state, whereas capillarity tests as well as mechanical resistance by flexural and compression tests were determined in the hardened state for mortars incorporated with 10, 30 and 60 wt.% of OSPW substituting sand. Three different types of Portland Cements were considered in the incorporated mortars production. For these mortars environmental analysis, their corresponding life cycle assessment results were compared to that of conventional waste-free (0% OSPW) control mortar. It was found that the OPSW incorporation acts as nucleation sites favoring a hydration process, which culminates after 28 days of curing in the formation of more stable phases identified as hydrated calcium silicates by X-ray diffraction (XRD) amorphous halo. It was also revealed that both flexural and compression improved resistance for the incorporated mortars after 28 curing days. In particular, the calorimetry and XRD results explained the better mechanical resistance (12 MPa) of the 30 wt.% OSPW incorporated mortar, hardened with Portland Cement V, compared not only to the control, but also to the other incorporated mortars. As for the environmental analysis, the replacement of sand by OSPW contributed to the reduction in associated impacts in the categories of land use (−5%); freshwater eutrophication (−9%); marine eutrophication (−6%) and global warming (−5%).
1. Introduction
Brazil stands out for having large mineral deposits, such as ornamental stones, which are transformed into products that can replace ceramic coverings and floors. In the Brazilian national territory, the state of Espírito Santo is known as a major producer of ornamental stones, such as marble and granite [1].
The ornamental stone industry is responsible for moving significant volumes in the national and international markets [2,3]. The Brazilian exports of natural stone materials totaled USD 1.34 billion and 2.40 Mt in 2021, an improvement of 35.5% and 11.4%, respectively, compared to 2020. Revenue and annual variation surpassed the historical records recorded in 2013 (USD 1.30 billion and 22.8%). The processed stone export activities were responsible for USD 1.077 billion, about 80% of total revenue in 2021 [4]
The observed growth consumption of the ornamental stone industry, in the national and international marketS, is directly linked to the amount of waste from the processing stages of this material. It is estimated that of the total natural stones available for processing, about 41% becomes tailing. Thus, in 2021, internal processing activities in Brazil generated 3.276 million tons of tailing [4]. The tailings obtained in the beneficiation phase form a sludge.
When drying, this sludge turns into non-biodegradable solid ornamental stone processing waste (OSPW) classified as class IIA waste—non-inert and non-hazardous [5]—which often receives inadequate final disposal, having its impacts reflected on human health and depletion of the environment [6]. The OSPW can be classified as non-biodegradable, from the particle’s point of view. Due to the strong presence of quartz in its crystalline phase, it resembles the waste glass previously studied [7], which corroborates that this class of waste, produced in increasing volumes, owing to the lack of adequate landfills for packaging, contributes to the intensification of pollution and ecosystem degradation, impacting factors such as water and soil. It is noteworthy that the glass residue, in its X-ray diffraction analysis, presents a quartz peak, and the remainder in the form of an amorphous halo [7].
The expressive volume of OSPW has a great potential for reuse in civil construction, being compatible with cement matrices, and can be applied as a filler in mortars and concrete, positively influencing the stability of the material [8,9,10,11].
The processing of ornamental stone has the objective of transforming the blocks, extracted in the mining phase, into final or semi-finished products. In the mining phase, the blocks are extracted in large dimensions, while in the primary processing, the blocks are prepared and sawn into sheets of variable thickness, usually two or three centimeters. Thus, they are subjected to a surface finish, with or without resin, which can be a simple grinding, polishing, brushing and flaming [1,12].
For the production of concrete and mortars incorporated with ornamental stone waste obtained in the processing phase, it is relevant to study the waste chemical characterization, since elements such as magnesium can generate expandability in the hardened state, reflecting in fissures when used in coatings and paving. In addition, the fineness of the residue and the SiO2 content associated with the production process might dislodge high reactivity, resulting in the occurrence of alkali-aggregate reactions [13,14]. Aiming at better technological performance of the mortar, in addition to prolonging its durability, some researchers evaluated the addition of OSPW, obtained in the processing phase, which is characterized as a non-plastic and non-biodegradable by-product. The study considered particles with a grain size between 2 µm and 60 µm, with chemical characteristics similar to the sand from the same region [15].
The OSPW, derived from granite and marble whose predominant minerals are calcite and dolomite, can be used as raw material in the production of mortar, presenting itself as an alternative that guarantees satisfactory technological performance, in addition to contributing to the reduction in the environmental impact associated with this industrial activity. Thus, investing this waste is mainly justified by the possibility of mitigating the environmental impact associated with the proper disposal of this waste [16,17].
Several studies of mortars incorporated with residues directed their objectives towards characterization and technological evaluation. However, issues from an environmental perspective and their impacts are still incipient [18]. According to Sánchez et al. [19], one of the main inputs for the production of mortar is cement, which, according to its composition and production process, contributes between 5 and 8% to CO2 emissions in a global context.
The life cycle assessment (LCA) can be understood as a systematic methodology of analysis capable of contributing to the quantification and identification of environmental impacts and protection areas associated with productive activities. This applies to the construction industry, allowing characteristic and comparative analyses of conventional and alternative products. The principle of LCA is to evaluate the basic flows of processes and products, being able to consider such steps as extraction, production, transport, useful life and disposal [20,21].
Many studies direct their efforts to study the incorporation of waste in the elaboration of new materials, mainly evaluating their results based on technological tests in accordance with current standards. However, in addition to the technological feasibility provided by the standards, it is necessary to evaluate the environmental impacts obtained in the elaboration of these new materials.
Additionally, it should be noted that compliance with the standards represents the minimum parameter for the use of construction materials in the industry, which stimulates the development of new materials. In addition to mitigating the environmental impacts associated with their production, it also results in technological performance that is superior to that expected by the norm. Thus, the present research represents a starting point for studies related to the incorporation of OSPW in the production of mortar, aiming at reducing environmental impacts and improving the technological performance of these new materials, considering the chemical composition of this residue and its positive effects on the formation of mortar.
This study aims to analyze the technological and environmental effects of replacing sand with OSPW in the production process of mortars used in civil construction. Three types of cement were considered for the production of mortar, namely Portland Cement II (CPII), Portland Cement III (CP III), and Portland Cement V (CPV) according to ABNT NBR 16697 [22].
2. Materials and Methods
Figure 1 presents the methodological flow established for the execution of tests and analyses in this research.
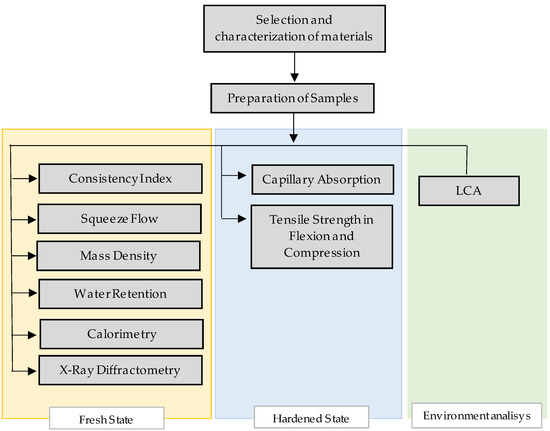
Figure 1.
Schematic diagram of the methodological flow.
2.1. Selection and Characterization of Materials
To produce the mortar and carry out the technological tests, the selection stage consisted of obtaining the raw materials sand and OSPW (Figure 2). The sand extraction region was the city of Campos dos Goytacazes, Brazil, with the selection of 50 kg of sand. The OSPW, on the other hand, was obtained in the same amount, in Cachoeiro de Itapemirim, Brazil, the main ornamental stone producing city in the state of Espirito Santo.
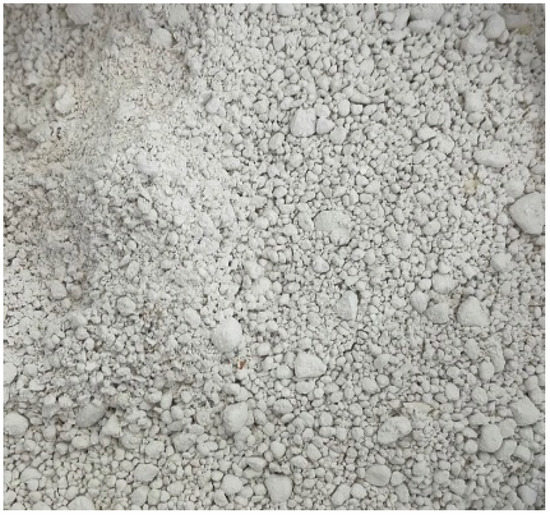
Figure 2.
The ornamental stone processing waste sample.
The aforementioned materials were taken to an oven at a temperature of ±105 °C for a period of 24 h. After drying, the OSPW passed through a 30 min milling process, using a ball mill just to ensure the homogenization of the sample particle size. To finish the preparation of the materials the sand and the residue went through the sieving process in a 20 mesh sieve. The analysis of the particle size of the ornamental stone waste was determined following ABNT 7181 [23] by the sieving and sedimentation method.
2.2. Preparation of Samples
Together with the preparation of the materials, the composition of the samples according to the raw materials was adopted in the proportion 1:6 cement/sand. For its dosage, Portland cement types CP II, CP III and CP V (ABNT 16697) [22] were used, and the sand was replaced by 10%, 30% and 60% of OSPW. To compare the results, the reference trace was prepared with 0% substitution, as shown in Table 1.

Table 1.
Samples composition.
2.3. Technological Analysis—Fresh State
2.3.1. Consistency Index
According to the fresh state of the mortar, the consistency index was defined according to the ABNT NM 13276 [24]. Each mortar was produced following the methodology prescribed by the standard, being mechanically mixed for 90 s (speed 1) in the mortar (power of 0.3 CV at 62 rpm with a capacity of 5 L) and then placed in rest for 15 min covered by a damp cloth. After resting, the mixture was manually homogenized for 30 s with a spatula and placed in the mold on the flow table (MC—119), where it was subjected to 30 strokes with a socket. After the last fall from the table, the average value of the diameter measured in three different directions was calculated to verify the consistency of each mixture produced, being established by the aforementioned standard that the margin is 260 ± 5 mm. Measurements were performed in relation to the table plane, considering the vertical, horizontal and inclined readings.
2.3.2. Squeeze Flow
The technological analysis using the squeeze flow methodology was carried out according to ABNT NM 15839 [25], using a universal testing machine EMIC 26–30 with a capacity of 30 kN. However, for the execution of this study, a maximum load of 1 kN was used, as recommended. After preparation, the mortars were spread and poured into a cylindrical metal mold with a diameter of 100 mm and a height of 10 mm on an inflexible base made of stainless steel.
The squeeze flow test basically consists of the dynamic analysis of a material compressed by two horizontally parallel plates, thus obtaining a radial expansion of the compressed material.
The data obtained from the squeeze flow method can be interpreted according to the 3 phases of behavior that the material can present. The first phase corresponds to the linear elastic behavior (I), the second describes the plastic behavior, also defined as viscous flow (II) and the third phase is known as hardening (III) [26]. The three aforementioned phases, when analyzed according to the force versus displacement relationship, present their behaviors described by exponential curves, as illustrated in Figure 3.
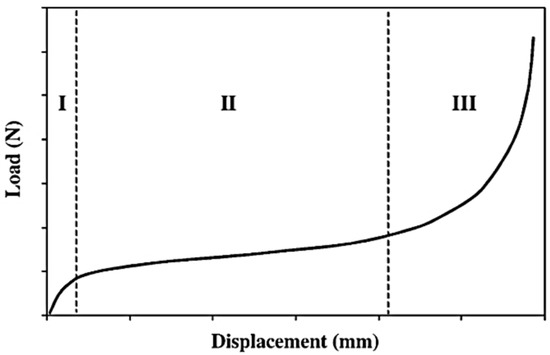
Figure 3.
Observed phases according to the force versus displacement curve by the squeeze flow test [27].
2.3.3. Mass Density
To define the density of the mass, the mortar was prepared according to the ABNT NM 13276 [24] standard. Then, an empty rigid and cylindrical container was used, with a mass of 0.891 kg and a volume of 400 cm3, continuing the test guided by the ABNT NM 13278 [28] standard.
2.3.4. Water Retention
First, considering the plate in the funnel, the filter paper positioned at the bottom of the plate was moistened. With the aid of a vacuum pump, a suction of 51 mm of mercury was applied to the set, which was weighed, and its mass (mv) recorded. After this procedure, the set was filled with the mortar, thickened with 37 socket strokes, flattened, weighed, and its mass (ma) was recorded.
Thus, with the set filled in the device, a suction of 51 mm of mercury was applied to the set, which was weighed, and its mass (ms) recorded. The entire continuation of the test was guided by the ABNT NM 13277 [29] standard. In addition to the three values (mv, ma, ms) recorded, the total mass of water (mw) and the mass of the anhydrous components (m) were also recorded.
2.3.5. Calorimetry
According to the squeeze flow test, the samples with cement type CPV were prioritized. To evaluate the rate of hydration reactions of the mortars, the calorimetry technique (ASTM C1679-17) [30] was used, being tested in two dosages, only in the CPV, with the substitutions of 0% and 30%, subjected first to consistency and later to the calorimeter, in amounts of 111.9 g and 111.8 g, respectively. The cement type CPV was used because it does not contain added blast furnace slag and/or pozzolana in the composition, and it contains calcium sulfate and carbonate material in the limit of up to 10% ABNT 16697 [22]. This makes it easier to identify the changes caused by the residue next to the folder. In addition, it was easily acquired in the local market. This cement is used for prefabricated parts when high initial strength is required.
2.3.6. X-ray Diffractometry Analysis—XRD
For the XRD analysis, the residue and paste samples were sieved through a 200 mesh (0.074 mm) opening sieve and taken to an oven at 110 °C for 24 h. The pastes were composed of CP V cement and water (CH2O), CP V cement with 30% of OSPW (COSPW) and water, and CP V cement with 30% sand and water (CS). For the XRD analysis, the CPV was used due to its composition, which does not register the presence of blast furnace slag, which is not in the CPII and CPIII types. The absence of blast furnace slag granulate contributes to the observation of phase formations and the presence of the main components when the sample is incorporated with OSPW [31].
The samples were mixed with isopropyl alcohol for 3 m in a 1:10 volumetric ratio (cement and alcohol), in a glass container with a glass rod. It was filtered and left to dry in a desiccator at 20 °C until it reached the consistency of the masses [30], and it was analyzed at the age of 28 days. Qualitative crystalline phases were obtained by XRD, in Proto Manufacturing equipment, XRD Powder Diffraction System: the generator of 30 kV and 2 mA, Cu-Kα1 radiation, angular step of 0.0149°, time interval of 0.5 s, sweep of 47 min and 2θ ranging from 5° to 60°. The crystalline phases in the residue were identified with reference to COD.
2.4. Technological Analysis—Hardened State
2.4.1. Capillary Absorption
To carry out this test, it was necessary to make 3 prismatic parts for each sample, using Portland cement types CP II, CP III and CP V, with cures of 7, 14 and 28 days. For this, it was based on the ABNT NM 13279 [32] standard, which describes the necessary procedures for the preparation of prismatic parts.
After finishing the curing days, the capillary absorption test was carried out, guided by the ABNT NM 15259 [33] standard. It was necessary to use a tray with water and an individual platform made of rubber material to lift the prismatic parts, allowing minimal contact with the water.
2.4.2. Analysis of Tensile Strength in Flexion and Compression
For this test, guided by the ABNT NM 13279 [32] standard, it was necessary to prepare 3 prismatic parts for each mix, using Portland cement types CP II, CP III and CP V, with cures of 7, 14 and 28 days, in the different substitutions of sand by OSPW (10%, 30% and 60%).
After completing the curing days, the prismatic parts were subjected to flexural and compressive strength tests, using an EMIC 26–30 universal testing equipment with a maximum force of 30 kN. First, the flexural tensile strength test was performed, where the prismatic parts were positioned in the machine in order to avoid contact between the flat surface and the supporting and loading components.
Then, to run the compressive strength test, the halves of each part of the flexural test were used and also positioned in the machine in order to avoid contact between the flat surface and the supporting and loading components.
2.5. Life Cycle Assessment
The LCA methodology was conducted considering the production process of mortar, incorporated with OSPW, according to the international standards ISO 14040 [34] and ISO 14044 [35]. Indeed, the development of this study aims to assess the environmental performance of mortar incorporated with OSPW, compared to conventional mortar. Both were evaluated according to the LCIA methods ReCiPe 2016 at midpoint, considering the impact categories, global warming (GW), stratospheric ozone depletion (SOD), ionizing radiation (IR), ozone formation, human health (OFHH), fine particulate matter formation (FPMF), ozone formation, terrestrial ecosystems (OFTE), terrestrial acidification (TA), freshwater eutrophication (FE), marine eutrophication (ME), terrestrial ecotoxicity (TE), freshwater ecotoxicity (FEC), marine ecotoxicity (MEC), human carcinogenic toxicity (HCT), human non-carcinogenic toxicity (HNCT), land use (LU), mineral resource scarcity (MRS), fossil resource scarcity (FRS), and water consumption (WC).
The functional unit considered in this study corresponds to the production of 1 kg of mortar. To define the phases of the process to be studied, the limits of the system were delimited, considering the productive activities from the extraction of raw material to the final process (Figure 4).
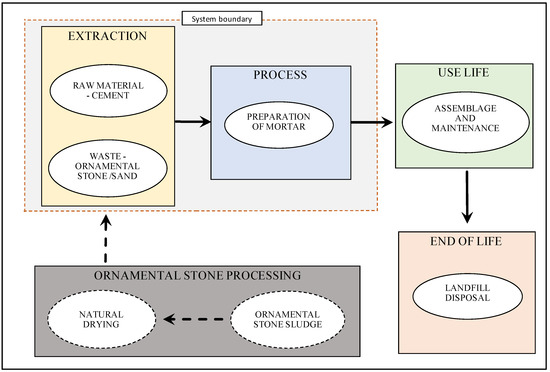
Figure 4.
Mortar system boundary.
The life cycle inventory (LCI) report (Table 2) was prepared considering the production process from the extraction and obtaining of raw material to the finished product phase (cradle to gate). In this case, the life cycle inventory consists of detailed compilations of all inputs considered in the study (materials and natural resources). For the ornamental stone sludge, this research considered the natural drying to obtain the OSPW.

Table 2.
Life cycle inventory data.
The data used for the model were extracted from the Ecoinvent 3.3 database, according to database allocations, as shown in Table 2. The OSPW data were obtained in studies by Rebello et al. [6]. The modeling, assessment of life cycle impacts (LCI) and interpretation of results were aided by the SimaPro 9.0 software. For the LCI assessment, the method used was ReCiPe 2016, at midpoint.
3. Results and Discussion
3.1. Technological Analysis—Fresh State
3.1.1. Consistency Index
According to the ABNT NM 13276 [24,36] standard, it is recommended to adopt the amount of water required for a consistency index of 260 ± 5 mm. Table 3 shows the results obtained by the related test.

Table 3.
Consistency index test results.
Thus, following the margin established by the aforementioned standard, the averages of all replacements (0%, 10%, 30% and 60%) of sand by OSPW in the three different types of cement (CP II, CP III and CP V) presented results within the acceptable limit.
Analyzing the water/cement ratio of the mortars produced, it was found that all the percentages of 10%, in the three different types of cement, had the lowest ratio, with the percentage of 10% in Portland cement type CP V being the lowest, with 1.19.
Taking into account that the lower the water/cement ratio, the greater the resistance, the lower the permeability and the greater the durability [37], the mortars produced with 10% substitution in cement type CP V have an advantage over the others.
3.1.2. Squeeze Flow
In view of the data obtained by the squeeze flow method, it is possible to elaborate the curves of the behavior of the material, guided by ABNT NM 15839 [25], which characterizes the workability level of the studied mortar. It is possible to analyze three workability phases: (i) the high workability being represented by the occurrence of the extension of the plastic deformation stage when the material is subjected to very low loads, registering transition to the hardening stage only in larger displacements; (ii) the low workability is characterized by the absence of the plastic deformation stage; and (iii) the medium workability is characterized by presenting variation of the load level as the plastic deformation occurs. It is noteworthy that, in mortars with medium workability characteristics, the material tends to flow and then interrupt the flow, being subjected to greater loads, and when they return flow, the load tends to decrease [26].
According to the dynamic squeeze flow test, the studied mortars were placed in an equipment composed of two parallel plates, where according to the variation of the time and speed parameters, the equipment recorded the data referring to force versus deformation, as shown in Figure 3.
Figure 5, Figure 6 and Figure 7 shows the results of the squeeze flow test for the mortars obtained from the diversifications regarding the type of cement (CP II, CPIII and CP V) and OSPW/sand replacement fractions (10%, 30% and 60% of OSPW), also considering the speed parameters (0.1 mm/s and 3.0 mm/s) of material compression. Observing the curve described by the results of Portland cement mortar types CP II, CP III and CP V, considering the mixtures with 10% of OSPW tested at speeds of 0.1 mm/s and 3.0 mm/s, they obtained similar results.
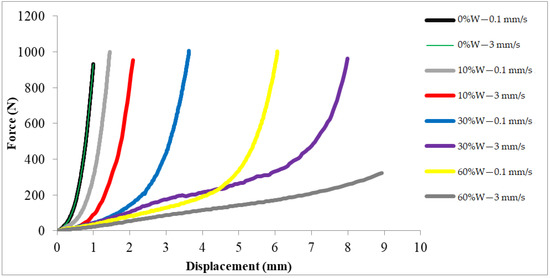
Figure 5.
Squeeze flow test results—mortar with cement Portland type CPII (%W represents the OSPW grade incorporated).
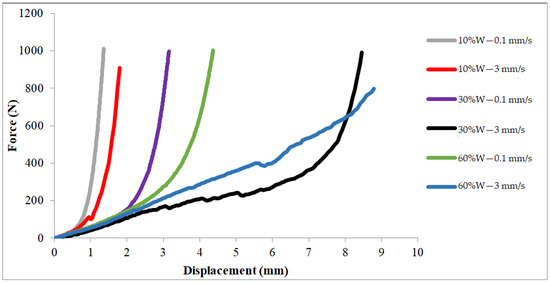
Figure 6.
Squeeze flow test results—mortar with cement Portland type CPIII (%W represents the OSPW grade incorporated).
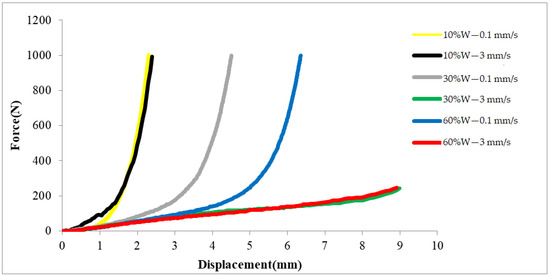
Figure 7.
Squeeze flow test results—mortar with cement Portland type CPV (%W represents the OSPW grade incorporated).
Thus, the squeeze flow test was performed in three different groups. The first one considered the CPII type cement, the second one considered the CPIII type cement and the third one considered the CP V type cement. The three groups were evaluated according to the incorporation of 0%, 10%, 30% and 60% of OSPW, under the variation of speed parameters (0.1 mm/s and 3 mm/s) and maximum force of 1 kN.
The definition of the groups occurred based on the parameters foreseen by the standard, in addition to the composition presented by each type of cement and also the effects observed in the variation of the incorporation of residue in the materials studied.
The materials composed of cement type CPII, with a variation of 10, 30 and 60% OSPW/sand, subjected to the test with a velocity of 0.1 mm/s, presented different behaviors in the phase transitions. In particular, the CPII cement mortar, incorporated with 10% OSPW and 90% sand, registered a phase transition of 0.5 mm in the displacement axis.
This behavior may be associated with the increase in the presence of OSPW in the samples, which contributed to the material having its plastic characteristics accentuated according to the increase in the incorporation of the waste. According to the variation of the incorporation rate, from 30% to 60% of OSPW, the phase transition doubled.
It is noteworthy that the curves responded to a maximum load of 1 kN; therefore, the behavior of the materials tested, considering the different ranges of OSPW incorporation, was directly influenced by the displacement speed (0.1 mm/s), emphasizing sensitivity to segregation.
Considering the materials formed by cement type CP III, with variations of 10, 30 and 60% of OSPW incorporation, subjected to a test speed of 0.1 mm/s, it can be seen that the mortar with the incorporation at 10% of OSPW presented its plastic phase up to the mark of 0.80 mm of displacement. The mortar incorporated with 30% of OSPW behaved plastically until the record of 1.80 mm of displacement. The mortar with 60% OSPW incorporation presented the highest displacement value, registering 2.60 mm.
According to the change in the speed parameter to 3.0 mm/s, the behavior of the curves was significantly sensitive, as seen in Figure 6. Thus, in a comparative analysis between the curves obtained at 0.1 mm/s and 3.0 mm/s, it was observed that the materials subjected to the lowest velocity parameter reached the maximum displacement in the system with a load of 1 kN, varying between 1.0 and 4.50 mm. On the other hand, the materials tested under a speed of 3.0 mm/s showed punctual behavior, being the loads to reach the maximum displacement, conditioned to the composition of each mortar. Taking into account the average load of 1 kN, the variation of the maximum displacement of the samples varied between 1.80 and 9.0 mm.
The curve obtained from the squeeze flow test with mortar incorporated with cement of the CPV type generated a different result from the others, showing only the viscous flow phase. Comparing the curves of the CP II type mortars, with the CP III type and CP V, in both the percentage of 60% reached maximum displacement, reaching the mark of 9.0 mm.
The tested materials formed by cement of the CPV type, with the incorporation of OSPW in 10, 30 and 60%, subjected to the parameter of speed of 0.1 mm/s, and of maximum force of 1 kN, presented phase changes punctually in displacements 1.0 mm, 2.90 mm and 4.30 mm respectively. The largest displacement recorded was 6.30 mm, presented by the product with 60% OSPW incorporation. When the speed parameter was changed to 3.0 mm/s, the product with 10% OSPW incorporation presented a similar curve to the same product subjected at a speed of 0.1 mm/s. Additionally, the CPV-type cement mortar incorporated with 10% OSPW, subjected to a speed parameter of 3 mm/s, registered a variation in the phase transition range.
Considering the speed of 3.0 mm/s, it was noticed that the products with 30 and 60% of OSPW incorporation described similar curves in the squeeze flow test, behaving plastically up to a maximum displacement of 9.0 mm.
In general, it appears that the curves mainly present the stages of plastic deformation and hardening stage. The materials subjected to the squeeze flow test started their curves in stage 2, known as plastic deformation or viscous flow, subjected to small loads. According to the increase in the load, the displacement responded with its gradual growth. In the transition from stage 2 to stage 3, some mortars presented the transition phase in a short displacement space. On the other hand, other mortars showed the transition phase in the long displacement space. As observed in Table 3, as the amount of waste increases, the amount of water and the w/c ratio increase, converging the results of the curves in Figure 5, Figure 6 and Figure 7.
From the point of view of viscosity, regardless of the type of cement, the curves are similar, despite the different values. It is noteworthy that the CPII curves with 30% of OSPW at 3 mm/s and 60% of OSPW and CPV with 60% of OSPW, both at 1 mm/s and at 3 mm/s, differ mathematically from the other curves, having similarities between them. Through linear regression, the equations presented in Table 4, Table 5 and Table 6 were obtained, which suggest that the fluid mortar behaves like a grade 2 Herschel Bulkley fluid, unlike the grade 1 Bingham fluid, according to [38], showing that the fluid was influenced by the addition of waste. It is observed that the linear coefficient of all equations is different from zero, that is, the initial yield stress occurred, differentiating these mortars from Newtonian fluids.

Table 4.
Linear regression and coefficient of determination—mortar sample with CPII.

Table 5.
Linear regression and coefficient of determination—mortar sample with CPIII.

Table 6.
Linear regression and coefficient of determination—mortar sample with CPV.
Another observed fact is that the yield stress decreases with the increase in the amount of waste, regardless of the load speed and the type of cement, and the mortar tends to be more fluid, that is, to have a greater workability. Ying et al., [39] studied the incorporation of waste glass processing in the mortar, noting that its increased incorporation in the mortar also contributed to a better workability.
Considering the value obtained in the linear regression analysis for R2, it is possible to analyze the linear correlation of the variables force and displacement. For values above 95%, it is possible to infer that the variables have a positive linear correlation, i.e., the data are accurate.
3.1.3. Mass Density
The density test was carried out in accordance with ABNT NM 13278 [28], and the mass of the full container was recorded. Then, the mass density of each mixture was calculated in the different substitutions (0%, 10%, 30% and 60%) in the three types of Portland cement (CP II, CP III and CP V). Table 7, Table 8 and Table 9 show the values obtained, respectively, by CP II, CP III and CP V cements.

Table 7.
Mass density of Portland cement type CP II.

Table 8.
Mass density of Portland cement type CP III.

Table 9.
Mass density of Portland cement type CP V.
Analyzing the mass density in Portland cement type CP II, it appears that the mortar with the lowest density was the one with 0% replacement of sand by the residue with 1.88 g/cm3, while the mortar with the highest density was the one with 30% replacement with 2.01 g/cm3. In the case of cement type CP III, the opposite occurs, where the mortar produced with 30% replacement has the lowest density with 1.62 g/cm3 and the mortar with 0% replacement has the highest density with 1.94 g/cm3.
In Portland cement type CP V, the same occurs as for CP II, the mortar with the lowest density is the one with 0% replacement with 1.90 g/cm3, and the one with the highest density is the one with 30% replacement with 2.03 g/cm3. Analyzing the densities in the three types of cement, the one that presents the highest density is the Portland cement type CP V, while the type CP III presents the lowest density.
Although the mortars tested in the three types of cements in percentages of different replacements show variations in densities, most are around 2 g/cm3, and densities lower than those mentioned are also obtained, bringing advantage to the mixture, as in the case of Portland cement type CP III with 30% replacement [40].
3.1.4. Water Retention
According to the registration of the five values (mv, ma, ms, mw, and m) of the mass of the set, the water/fresh mortar factor (AF) and the water retention (Ra) were then calculated, considering each mixture in the different substitutions (0%, 10%, 30% and 60%) in the three types of Portland cement (CP II, CP III and CP V), as shown in Table 10, Table 11 and Table 12.

Table 10.
Water retention in mortar with Portland cement type CP II.

Table 11.
Water retention in mortar with Portland cement type CP III.

Table 12.
Water retention in mortar with Portland cement type CP V.
Analyzing the water retention in Portland cement type CP II, it appears that the mortar with the lowest retention was the one with 10% of sand replacement by OSPW with 95.81%, while the mortar with the highest retention was the one with 60% of replacement with 99.07%. The same characteristics are found in cement type CP III; the mortar produced with 10% replacement has the lowest retention with 97.71% and the mortar with 60% replacement has the highest retention with 99.27%.
Considering the Portland cement type CP V, there is a difference from the others. The mortar with the lowest retention is the one with 30% replacement with 98.45% instead of 10%, as in the CP II and CP III cements. The one with the highest retention is the 60% replacement with 98.94%, as in the other cements.
Examining the control mortar (0% OSPW), it is noted that the lowest value is found in CP II cement with 96.29%, while the highest is found in CP III with 98.73% retention. At 10% replacement, the lowest value is also found in CP II cement with 95.81%, while the highest is for CP V with 98.90% retention.
As for the analysis of the mortars with 30% replacement, it is noted that the lowest value is found in the CP III cement with 98.42%, while the highest is found in the CP II with 99.03% of retention. At 60% replacement, the lowest value is found in CP V cement with 98.94%, while the highest is found in CP III with 99.27% retention.
3.1.5. Calorimetry
Regarding the calorimetry analysis the registration of the hydration reactions of the mortars, through the software connected to the calorimeter device, it was then possible to plot the heat and thermal energy curves per unit weight of cement. Figure 8 and Figure 9 present the values obtained.
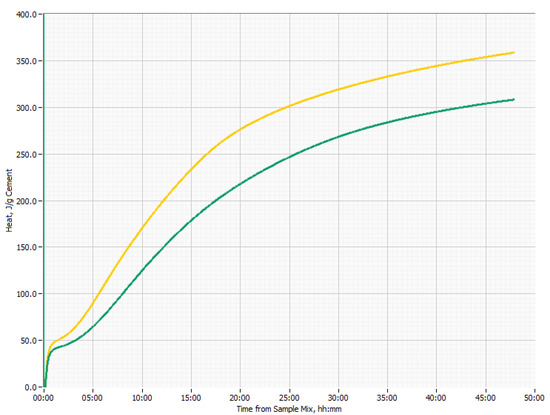
Figure 8.
Heat per unit weight of cement: Yellow curve with 30% and green curve with 0%.
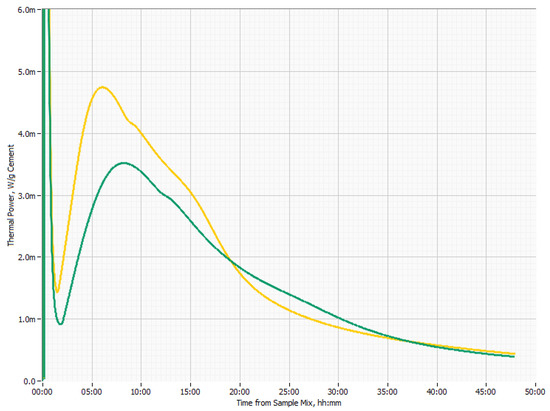
Figure 9.
Thermal energy per unit weight of cement: Yellow curve with 30% and green curve with 0%.
By means of the thermal power curves, it was possible to observe in the sample with 30% substitution an increase in the curve in the acceleration period from 1.5 h to 5 h approximately, due to the faster heat release. This is directly associated with a nucleation process and growth of hydration products faster, a behavior also shown in previous studies [13,41].
On the other hand, in the heat of hydration curves, it was possible to observe that the 30% sample presented higher heat of hydration accumulated since the beginning of the test, as a consequence of a greater formation of hydration products, a similar result to that obtained by Topçu et al. [42].
3.1.6. X-ray Diffractometry Analysis—XRD
Figure 10 shows that the particle size distribution of the OSPW particles dimensions is 88% between 2 µm and 60 µm. This class is considered as a filler. It was observed 10% of particles smaller than 2 µm, represented by D10 referring to fine quartz particles found by XRD. The particle size of the sand fraction is 2%, which is the coarser particle of the raw material. The residue is classified as non-plastic. These results are similar to those of Xavier et al. [5].
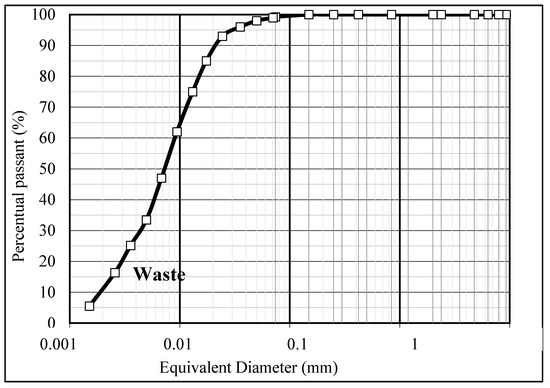
Figure 10.
Particle size distribution of the ornamental stone processing waste.
Figure 11a presents the XRD pattern of the OSPW. Note that it is basically formed by quartz, identified by well-defined peaks. Figure 11b shows the presence of ettringite, portlandite, quartz and calcium carbonate. There is also an amorphous halo of C–S–H between 20° and 28° in the COSPW and CH2O samples. An amorphous halo of C–S–H is found between 22° and 26° (X-ray angle of incidence) in the CS sample, which shows a smaller amount of this stable and resistant phase. This shows that the waste contributes to the formation of this more resistant phase, as observed in Figure 8 with the increase in the heat of hydration being faster with the paste containing 30% of OSPW with the nucleation of the smaller particles, these being in amounts of 10% of OSPW fraction of 2 µm (Figure 10—OSPW particle size distribution). There is no difference between the COSPW and CH2O paste when compared to each other.
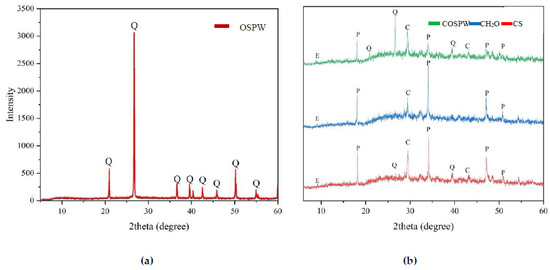
Figure 11.
(a) X-ray diffraction patterns of the OSPW. (b) X-ray diffraction patterns of cement pastes. Legend: E (ettringite), P (portlandite), Q (quartz), C (CaCO3).
The above-mentioned difference is observed in Figure 7, from the squeeze flow, in the fresh state, as it requires less load and has a greater possibility of displacement, which means that the mortar with OSPW has more workability than the control mortar with only sand. In addition, there is a difference in intensity in most portlandite peaks between the COSPW and CH2O samples, with smaller peaks being observed in most of the COSPW samples. This may indicate a portlandite reduction and formation of stable phases, as discussed earlier.
3.2. Technological Analysis—Hardened State
3.2.1. Capillary Absorption
The capillary absorption test was carried out as per the ABNT NM 15259 [33] standard, from which two parameters can be taken to determine the phenomenon of capillarity in mortars: (i) the capillarity coefficient, and (ii) the water absorption by capillarity at 90 m [40].
Three prismatic parts were made for each mix, using Portland cement types CP II, CP III and CP V, with cures of 7, 14 and 28 days, in the different replacement of sand by OSPW (10%, 30% and 60%). Table 13 shows the average of each percentage of the capillarity coefficients of the mortars produced.

Table 13.
Capillarity coefficients (g/dm2·min1/2).
Thus, analyzing the capillarity coefficient in the prismatic specimens, made with Portland cement type CP II, it appears that the 60% replacement mortars, from sand to OSPW, showed a higher capillarity coefficient regardless of the curing time. On the other hand, the mortars produced with 30% replacement showed the lowest capillarity coefficient also regardless of the curing time.
In the specimens made with Portland cement type CP III, the 30% replacement mortars, at all curing times, showed the lowest capillarity coefficient. In mortars with curing times of 7 and 28 days, the highest capillarity coefficient is at 60% replacement, while at 14 days of curing, it is at 10% replacement.
In Portland cement type CP V, mortars with curing times of 14 and 28 days presented the highest coefficient at 60%, while at 7 days of curing, the highest coefficient is at 10% replacement. As with mortars made with cement type CP II and CP III, the lowest coefficient is found at 30%, when analyzed at 14 and 28 days, while at 7 days of curing, the lowest value is at 60% of replacement.
3.2.2. Determination of Tensile Strength in Flexion and Compression
Table 14 presents the compressive strengths found in the mortars made with Portland cement types CP II, CP III and CP V, with curing of 7, 14 and 28 days, in the different replacement of sand by OSPW (10%, 30% and 60%).

Table 14.
Flexural and compression strength test results.
Analyzing the compressive strength of mortars, it was found that in all three types of cement, the highest strengths were found in the replacement of 30% of OSPW, and these values were identified in CP III and CP V cements, at 28 days of curing, and in cement CP II, at 7 days of curing.
In Portland cement type CP II, the highest strength found was 9.82 MPa tested at 7 days of curing, in the percentage of 30% replacement, while the lowest strength was 3.83 MPa tested at 14 days of curing, in the 10% replacement percentage. Note that the strengths of the mortars tested at 7 and 28 days of curing present similar values in all replacements.
In mortars made with CP III type cement, the highest strengths, in all percentages, were at 28 days of curing, with the highest value being 8.82 MPa in 30% replacement. On the other hand, the lowest resistances found, regardless of residue replacements, were at 14 days of curing.
In Portland cement type CP V, the highest strengths, as well as in CP III, were at 28 days of curing, regardless of percentages, with the highest value of 12.56 MPa in 30% replacement. While the lowest resistances were at 7 days of curing in all percentages.
Table 14 also shows the flexural tensile strengths found in mortars made with Portland cement types CP II, CP III and CP V, with cures of 7, 14 and 28 days of curing, in the different replacements of sand by OSPW (10%, 30% and 60%).
Analyzing the flexural tensile strengths of mortars, it was found that in all three types of cement, the highest strengths were found in the replacement of 30% of OSPW, at 28 days of curing, with the highest value being 3, 12 MPa, found in CP V cement. In Portland cement type CP II, the mortars tested at 7 and 14 days of curing showed similar strengths, while those tested at 28 days showed greater discrepancies.
The mortars made with cement type CP III tested at 28 days showed higher strengths in all replacement percentages, when compared to the other curing times of the same cement. In contrast, the lowest resistance found was with 60% replacement tested at 14 days of curing. In Portland cement type CP V, the mortars tested at 28 days showed the highest strengths with 10% and 30% replacement, however, with 60% the mortars that showed higher values were those tested at 14 days of curing.
3.3. Life Cycle Assessment (LCA)
According to the results of the technological tests, LCA studies were directed on the environmental impacts associated with obtaining the mortar incorporated with 30% of OSPW and cement CPV type. For the analysis of the environmental impacts associated with the mortar production process, OSPW was considered as an alternative raw material to substitute the use of sand, which allows obtaining an avoided impact with the reduction of the extraction of this input.
The LCA study was compiled considering the geographic limitation of the states of Rio de Janeiro and Espírito Santo, in the Brazilian context, in addition to the chemical composition and morphological characteristics of the sand and OSPW found in the studied region. The study was conducted in a comparative way between the two products: the mortar produced in a conventional way (0% OSPW), and the mortar incorporated with 30% OSPW. For this study, the use of CPV-type cement was also considered.
The mortar production process considered at the system boundary consisted of traditional operations and equipment. Thus, studies that direct efforts to analyze the effects of new technologies are recommended. In addition, the present LCA study is dedicated only to analyzing the environmental impacts caused by the products of interest, recommending future analyses on economic and social impacts.
Figure 12 presents the environmental impact of the conventional mortar production process, without the incorporation of OSPW (the characterized analysis can be seen in Table S1 of the Supplementary Materials). Eighteen impact categories were analyzed at midpoint. In a global analysis, it is possible to realize that the cement and sand inputs significantly contribute to the impact associated with obtaining the mortar, as presented by Sánchez et al. [19]. Cement has an intensive impact on the global warming categories, accounting for about 75% of the CO2 emissions considered in this production process, and also on the mineral resource scarcity category, corresponding to 91% of the impacts recorded in this category. Jiménez et al. [43] state that cement is the material with the greatest influence in all categories of impacts considered in their studies, in addition to being the main contributor to emissions to air.
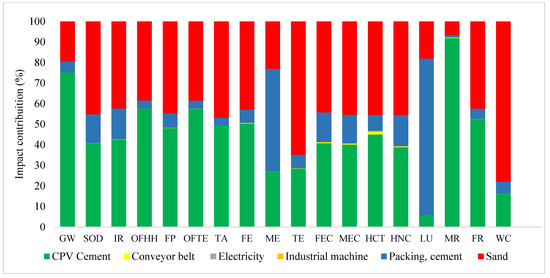
Figure 12.
Impact life cycle assessment—mortar with 0% OSPW—CPV.
The sand has its largest impact contribution associated with the water consumption category, with over 77%. In addition, the cement used, identified as packing in the study, has considerable impacts on point categories, such as the land use category, reaching 76% of the relative impact. This can be attributed to the area needed to obtain wood that will supply the pulp industry for the manufacture of cement packages.
To highlight the main impacts associated with alternative mortar composed of cement type CPV, 30% of OSPW and sand, the LCA was analyzed (Figure 13). It was possible to identify that the replacement of sand by OSPW contributed to the reduction in the associated impacts in most categories, such as in the categories of land use −5%, freshwater eutrophication −9%, marine eutrophication −6% and global warming −5%. The most significant record of impacts associated with the use of OSPW is in the water consumption category, totaling 2.3% (the characterized analysis can be seen in Table S2 of the Supplementary Materials).
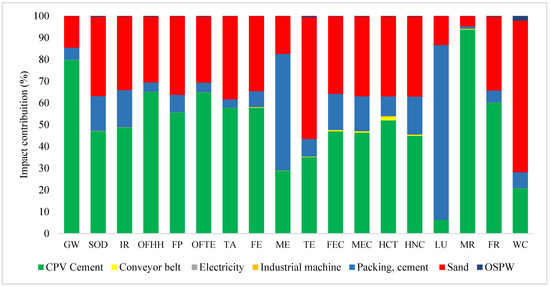
Figure 13.
Impact life cycle assessment—mortar with 30% OSPW—CPV.
In a comparative way, the processes of obtaining the mortar with cement CPV, and the mortar with cement CPV incorporated with 30% of OSPW were analyzed. The normalized results show the reduction in global impacts when the mortar undergoes the replacement of sand by OSPW. The normalized scale also allows the identification of the main categories of impacts that are intensely affected by the industrial activity of obtaining the product under study, namely marine ecotoxicity, freshwater ecotoxicity, human carcinogenic toxicity, human non-carcinogenic toxicity and terrestrial ecotoxicity (Figure 14). These categories are allocated into two main areas of protection, those being human health and ecosystem quality, often assessed at the endpoint.
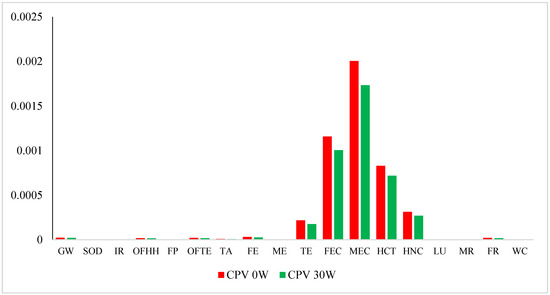
Figure 14.
Impact life cycle assessment—normalized result of the comparison between conventional and 30% OSPW mortar.
The categories that estimate human health impacts aim to characterize human exposure to toxic substances, especially through ingestion and inhalation. Values referring to acute and chronic toxicological effects provide estimates of the toxicological risk and impacts associated with the mass (kilograms) of a substance emitted to the environment, such as dichlorobenzene, for example.
The categories related to ecosystem are related to the harmful, sometimes irreversible, action of substances toxic to the environment. This category can be defined for both water and soil, using chemical emissions to air, water and soil. Its indicator corresponds to the ecotoxicity potential of each emission in relation to the reference substance (for example, triethylene glycol).
Figure 15 presents the comparison in a characteristic mode between the conventional mortar and the mortar incorporation with OSPW. It is possible to notice the decrease in environmental impacts associated with all categories when the mortar is incorporated with OSPW. According to Rebello et al. [6], the incorporation of OSPW in the elaboration of civil construction materials presented better environmental performance compared to the use of sand.
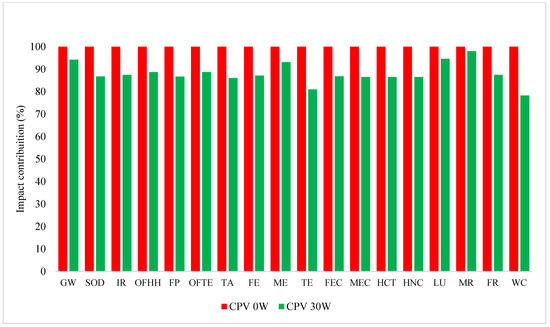
Figure 15.
Impact life cycle assessment—characterized result of the comparison between conventional and 30% OSPW mortar.
This can be mainly related to the reuse of an inert residue, which implies the reduction in sand extraction for the composition of this mortar, being an avoided impact. The main reductions occurred in the water consumption and terrestrial ecotoxicity categories, recording reductions of 22% and 20%, respectively. According to Santos et al. [44], the incorporation of alternative aggregates in conventional mortars (with high environmental impact) requires less energy for production and transport. This mainly applies to the replacement of natural sand in mortars, which can also benefit the technological performance of the material.
In LCA studies oriented to the production of construction materials with incorporation of waste, the geographical distance to obtain the inputs stands out. Indeed, distance and transport have a direct relationship, that is, great distances can be associated with the increase in the environmental impacts considered [45].
The carbon footprints for both evaluated processes were obtained and are shown in Table 15. Thus, it was possible to identify the contribution to the environmental impacts of raw materials in the system, mainly associated with the global warming category. Predominantly, CPV cement presents itself as the main contribution to the carbon footprint in both scenarios, being responsible for 75.1% of the CO2 equivalent generated in obtaining the mortar without incorporation of OSPW, and 79.7% of the CO2 equivalent in the mortar with the incorporation of 30% of OSPW.

Table 15.
Carbon footprint.
4. Conclusions
- Considering the results found in the squeeze flow test, it can be concluded that the greater the displacement achieved by the material, the better its workability level, which was recorded in different mortar compositions incorporated by the ornamental stones processing waste (OSPW).
- According to the tests in the fresh state, it is possible to conclude that the mortar composed of cement of the CPV type, incorporated with 30% of OSPW, stands out in comparison to the others analyzed, presenting higher density, which implies a material with lower porosity and good water retention index. The workability of this material also stands out, as well as the rapid release of heat that occurs in this material, which positively influences the nucleation process and rapid hydration.
- Through the calorimetry technique, it is possible to infer that the incorporation of the waste is acting as nucleation sites for the hydration products, favoring the cement hydration process, culminating at 28 days of curing, in the formation of more stable phases, according to the amorphous halo of the formation of C–S–H (hydrated calcium silicate).
- According to the tests in the hardened state, the mortar composed of cement of the CPV type, incorporated with 30% OSPW, stands out, which presents low capillarity and better performance in the resistance to flexural and compression strength, considering 7 days of curing when compared to other types of cement. There is still a better performance in the flexural and compression strength tests when the curing time increases to 28 days.
- In view of the life cycle assessment (LCA) for environmental analysis, it is concluded that the use of OSPW contributes to the reduction in the environmental impact associated with the process of obtaining the mortar. Indeed, this waste can replace the use of sand in the production mortar, which consequently reduces the sand extraction process and its impacts. Considering the LCA impacts generated by the production of mortars, the main areas of protection affected are human health and ecosystem quality.
Supplementary Materials
The following supporting information can be downloaded at: https://www.mdpi.com/article/10.3390/su14105904/s1, Table S1: Life Cycle Impact Assessment considering the mortar with 0% of OSPW and cement type CPV; Table S2: Life Cycle Impact Assessment considering the mortar with 30% of OSPW and cement type CPV.
Author Contributions
Conceptualization, P.I.M. and G.d.C.X.; methodology, G.d.C.X., C.M.V. and A.R.G.d.A.; software, J.d.O.D. and R.P.R.; validation, C.M.V., S.N.M. and J.A.; formal analysis, G.d.C.X. and R.P.R.; investigation, P.I.M. and G.d.C.X.; resources, G.d.C.X., S.N.M. and C.M.V.; data curation, A.R.G.d.A. and J.A.; writing—original draft preparation, G.d.C.X. and J.d.O.D.; writing—review and editing, R.P.R.; visualization, J.A.; supervision, G.d.C.X.; project administration, C.M.V.; funding acquisition, S.N.M. All authors have read and agreed to the published version of the manuscript.
Funding
This research was funded by State University of the Northern Fluminense (UENF), partial financed by CAPES (Coordenação de Aperfeiçoamento de Pessoal de Nível Superior—Brazil) and provided additional financial CNPq (Coordenação Nacional de Pesquisa) Code 309428/2020-3. The participation of A.R.G.A. was sponsored by FAPERJ through the research fellowships proc. no: E-26/210.150/2019, E-26/211.194/2021, E-26/211.293/2021, and E-26/201.310/2021 and by CNPq through the research fellowship PQ2 307592/2021-9.
Institutional Review Board Statement
Not applicable.
Data Availability Statement
Not applicable.
Acknowledgments
The authors acknowledge the Brazilian governmental research agencies CAPES (Coordenação de Aperfeiçoamento de Pessoal de Nível Superior), CNPq (Conselho Nacional de Desenvolvimento Científico e Tecnológico), and FAPERJ (Fundação de Amparo à Pesquisa do Estadodo Rio de Janeiro).
Conflicts of Interest
The authors declare no conflict of interest.
References
- Azevedo, A.R.G.; Marvila, M.T.; Barroso, L.S.; Zanelato, E.B.; Alexandre, J.; Xavier, G.C.; Monteiro, S.N. Effect of Granite Waste Incorporation on the Behavior of Mortars. Materials 2019, 12, 1449. [Google Scholar] [CrossRef] [PubMed] [Green Version]
- Montani, C. Marble and Stones in the World XXVIII Report—International Situation Production and Interchange, 18th ed.; Casa di Edizioni in Carrara: Carrara, Italy, 2017; pp. 1–132. [Google Scholar]
- Chiodi, C. The Brazilian Ornamental Stone Sector; Brazilian Association of the Ornamental Stone Industry (ABIROCHAS): Vitoria, Brazil, 2018. (In Portuguese) [Google Scholar]
- Chiodi, C. Balanço das Exportações e Importações Brasileiras de Materiais Rochosos Naturais e Artificiais de Ornamentação e Revestimento em 2021; Brazilian Association of the Ornamental Stone Industry (ABIROCHAS): Vitoria, Brazil, 2022. [Google Scholar]
- Xavier, G.C.; Azevedo, A.R.G.; Alexandre, J.; Monteiro, S.N.; Pedroti, L.G. Determination of Useful Life of Red Ceramic Parts Incorporated with Ornamental Stone Waste. J. Mater. Civ. Eng. 2019, 31, 04018381. [Google Scholar] [CrossRef]
- Rebello, T.A.; Zulcão, R.; Calmon, J.L.; Gonçalves, R.F. Comparative life cycle assessment of ornamental stone processing waste recycling, sand, clay and limestone filler. Waste Manag. Res. 2019, 37, 186–195. [Google Scholar] [CrossRef] [PubMed]
- Xiao, R.; Polaczyk, P.; Zhang, M.; Jiang, X.; Zhang, Y.; Huang, B.; Hu, W. Evaluation of glass powder-based geopolymer stabilized road bases containing recycled waste glass aggregate. Transp. Res. Rec. J. Transp. Res. Board 2020, 2674, 22–32. [Google Scholar] [CrossRef]
- Galetakis, M.; Soultana, A. A review on the utilisation of quarry and ornamental stone industry fine by-products in the construction sector. Constr. Build. Mater. 2016, 102, 769–781. [Google Scholar] [CrossRef]
- Aydin, E.; Sahan Arel, H. High-volume marble substitution in cement-paste: Towards a better sustainability. J. Clean. Prod. 2019, 237, 117801. [Google Scholar] [CrossRef]
- Baghel, R.; Pandel, U.; Vashistha, A. Manufacturing of sustainable bricks: Utilization of mill scale and marble slurry. Mater. Today Proc. 2020, 26, 2136–2139. [Google Scholar] [CrossRef]
- Jain, A.; Gupta, R.; Chaudhary, S. Sustainable development of self-compacting concrete by using granite waste and fly ash. Constr. Build. Mater. 2020, 262, 120516. [Google Scholar] [CrossRef]
- Awad, A.H.; El-Wahab, A.; El-Gamsy, R.; Abdel-Latif, H. A study of some thermal and mechanical properties of HDPE blend with marble and granite dust. Ain Shams Eng. J. 2019, 10, 353–358. [Google Scholar] [CrossRef]
- Li, L.G.; Huang, Z.H.; Tan, Y.P.; Kwan, A.K.H.; Chen, H.Y. Recycling of marble dust as paste replacement for improving strength, microstructure and eco-friendliness of mortar. J. Clean. Prod. 2019, 210, 55–65. [Google Scholar] [CrossRef]
- Messaouda, B.; Rahmouni, Z.E.A.; Tebbal, N. Influence of the addition of glass powder and marble powder on the physical and mechanical behavior of composite cement. Procedia Comput. Sci. 2019, 158, 366–375. [Google Scholar] [CrossRef]
- Saboya, F.; Xavier, G.C.; Alexandre, J. The use of the powder marble by-product to enhance the properties of brick ceramic. Constr. Build. Mater. 2007, 21, 1950–1960. [Google Scholar] [CrossRef]
- Dantas, A.P.A.; Acchar, W.; Leite, J.Y.P.; Araújo, F.S.D. Use of Ornamental Stone Residues in the Production of White Ceramics. Holos 2010, 1, 26. [Google Scholar]
- Buyuksagis, I.S.; Uygunoglu, T.; Tatar, E. Investigation on the usage of waste marble powder in cement-based adhesive mortar. Constr. Build. Mater. 2017, 154, 734–742. [Google Scholar] [CrossRef]
- Perera, A.G.; Dionisio, M.D.P.S.; Sancha, P. Alternativas de reducción de las emisiones de dióxido de carbono (CO2) en la producción de cemento. Propuesta de un modelo de evaluación. Innovar 2016, 26, 51–66. [Google Scholar] [CrossRef]
- Sánchez, A.R.; Ramos, V.C.; Polo, M.S.; Ramón, M.V.L.; Utrilla, J.R. Life Cycle Assessment of Cement Production with Marble Waste Sludges. Int. J. Environ. Res. Public Health 2021, 18, 10968. [Google Scholar] [CrossRef]
- Malça, J.; Freire, F. Renewability and life-cycle energy efficiency of bioethanol and bio-ethyl tertiary butyl ether (bioETBE): Assessing the implications of allocation. Energy 2006, 31, 3362–3380. [Google Scholar] [CrossRef] [Green Version]
- Ye, L.; Hong, J.; Ma, X.; Qi, C.; Yang, D. Life cycle environmental and economic assessment of ceramic tile production: A case study in China. J. Clean. Prod. 2018, 189, 432–441. [Google Scholar] [CrossRef]
- NBR 16697; Portland Cement—Requirements. Brazilian Association of Technical Standards: Rio de Janeiro, Brazil, 2018. (In Portuguese)
- ABNT NBR 7181; SOIL—Particle Size Analysis. Brazilian Association of Technical Standards: Rio de Janeiro, Brazil, 1984. (In Portuguese)
- NBR 13276; Mortar for and Coating Walls and Ceilings—Mixing Preparation and Determination of Consistency Index. Brazilian Association of Technical Standards: Rio de Janeiro, Brazil, 2016. (In Portuguese)
- NBR 15839; Mortars for Laying and Covering Walls and Ceilings—Rheological Characterization by the Squeeze Flow Method. Brazilian Association of Technical Standards: Rio de Janeiro, Brazil, 2010. (In Portuguese)
- Cardoso, F.A.; John, V.M.; Pileggi, R.G.; Banfill, P.F.G. Characterization of rendering mortars by squeeze-flow and rotational rheometry. Cem. Concr. Res. 2014, 57, 79–87. [Google Scholar] [CrossRef]
- Cardoso, F.A.; John, V.M.; Pileggi, R.G. Rheological behavior of mortars under different squeezing rates. Cem. Concr. Res. 2009, 39, 748–753. [Google Scholar] [CrossRef]
- NBR 13278; Argamassas para Assentamento e Revestimento de Paredes e Tetos—Determinação da Densidade de Massa e Do teor de ar Incorporado. Associação Brasileira de Normas Técnicas: Rio de Janeiro, Brazil, 2005.
- NBR 13277; Argamassas para Assentamento e Revestimento de Paredes e Tetos—Determinação da Retenção de Água. Associação Brasileira de Normas Técnicas: Rio de Janeiro, Brazil, 2005.
- C1679-17; Standard Practice for Measuring Hydration Kinetics of Hydraulic Cementitious Mixtures Using Isothermal Calorimetry. American Society for Testing and Materials—ASTM: West Conshohocken, PA, USA, 2017.
- Tambara, L.U.D.; Cheriaf, M.; Rocha, J.C.; Palomo, A.; Fernández-Jiménez, A. Effect of alkalis content on calcium sulfoaluminate (CSA) cement hydration. Cem. Concr. Res. 2020, 128, 105953. [Google Scholar] [CrossRef]
- NBR 13279; Mortars for Laying and Covering Walls and Ceilings—Determination of Tensile Strength in Flexion and Compression. Brazilian Association of Technical Standards: Rio de Janeiro, Brazil, 2005. (In Portuguese)
- NBR 15259; Mortars for Laying and Covering Walls and Ceilings—Determination of Water Absorption by Capillarity and Capillarity Coefficient. Brazilian Association of Technical Standards: Rio de Janeiro, Brazil, 2005. (In Portuguese)
- ISO 14040: 2006/Amd 1:2020; Environmental Management Life Cycle Assessment—Principles and Framework. ISO: Geneva, Switzerland, 2006.
- ISO 14044: 2006/Amd 2:2020; Environmental Management—Life Cycle Assessment—Requirements and Guidelines. ISO: Geneva, Switzerland, 2006.
- de Oliveira Guimarães, C.A.; Delaqua, G.C.G.; de Azevedo, A.R.G.; Monteiro, S.N.; Amaral, L.F.; Souza, C.L.M.; Vieira, C.M.F. Heating rate effect during sintering on the technological properties of brazilian red ceramics. Int. J. Adv. Man. Technol. 2022, 119, 8125–8135. [Google Scholar] [CrossRef]
- Ghasemipor, V.; Piroti, S. Experimental Evaluation of the Effect of Water-Cement Ratio on Compressive, Abrasion Strength, Hydraulic Conductivity Coefficient and Porosity of Nano-Silica Concretes. J. Appl. Eng. Sci. 2018, 8, 17–24. [Google Scholar] [CrossRef] [Green Version]
- Baumert, C.; Garrecht, H. Minimization of the Influence of Shear-Induced Particle Migration in Determining the Rheological Characteristics of Self-Compacting Mortars and Concretes. Materials 2020, 13, 1542. [Google Scholar] [CrossRef] [PubMed] [Green Version]
- Ying, J.; Huang, J.; Xiao, J. Test and theoretical prediction of chloride ion diffusion in recycled fine aggregate mortar under uniaxial compression. Constr. Build. Mater. 2022, 321, 126384. [Google Scholar] [CrossRef]
- Marvila, M.T.; Alexandre, J.; Azevedo, A.R.G.; Zanelato, E.B.; Xavier, G.C.; Monteiro, S.N. Study on the replacement of the hydrated lime by kaolinitic clay in mortars. Adv. Appl. Ceram. 2019, 118, 373–380. [Google Scholar] [CrossRef]
- Wadsö, L.; Winnerfeld, F.; Riding, K.; Sandeberg, P. Calorimetry. In A Practical Guide to Microstructural Analisys of Cementitious Materials, 1st ed.; Scrivener, K., Snellings, R., Lothenbach, B., Eds.; CRC Press: Boca Raton, FL, USA, 2016. [Google Scholar]
- Topçu, I.B.; Bilir, T.; Uygunoglu, T. Effect of waste marble dust content as filler on properties of self-compacting concrete. Constr. Build. Mater. 2009, 23, 1947–1953. [Google Scholar] [CrossRef]
- Jiménez, C.; Barra, M.; Josa, A.; Valls, S. LCA of recycled and conventional concretes designed using the Equivalent Mortar Volume and classic methods. Constr. Build. Mater. 2015, 84, 245–252. [Google Scholar] [CrossRef] [Green Version]
- Santos, T.; Almeida, J.; Silvestre, J.D.; Faria, P. Life cycle assessment of mortars: A review on technical potential and drawbacks. Constr. Build. Mater. 2021, 288, 123069. [Google Scholar] [CrossRef]
- Yazdanbakhsh, A.; Lagouin, M. The effect of geographic boundaries on the results of a regional life cycle assessment of using recycled aggregate in concrete. Resour. Conserv. Recycl. 2019, 143, 201–209. [Google Scholar] [CrossRef]
Publisher’s Note: MDPI stays neutral with regard to jurisdictional claims in published maps and institutional affiliations. |
© 2022 by the authors. Licensee MDPI, Basel, Switzerland. This article is an open access article distributed under the terms and conditions of the Creative Commons Attribution (CC BY) license (https://creativecommons.org/licenses/by/4.0/).