Article

Evaluation of Energy Potential from Coffee Pulp in a Hydrothermal Power Market through System Dynamics: The Case of Colombia

by
Yessenia Martínez-Ruiz
1,
Diego Fernando Manotas-Duque
1,*,
Juan Carlos Osorio-Gómez
1 and
Howard Ramírez-Malule
2
1
School of Industrial Engineering, Universidad del Valle, Calle 13 #100–00, Cali 7600034, Valle del Cauca, Colombia
2
School of Chemical Engineering, Universidad del Valle, Calle 13 #100–00, Cali 7600034, Valle del Cauca, Colombia
*
Author to whom correspondence should be addressed.
Sustainability 2022, 14(10), 5884; https://doi.org/10.3390/su14105884
Submission received: 24 March 2022 / Revised: 28 April 2022 / Accepted: 6 May 2022 / Published: 12 May 2022

Abstract

:
Colombia has abundant solar, wind, and biomass resources for energy production with non-conventional renewable energy (NCREs) sources. However, the current participation of NCREs is negligible in the electricity mix of the country, which has historically depended on hydroelectric plants. Meteorological phenomena, such as the El Niño–Southern Oscillation (ENSO), threaten the energy supply during periods of drought, and the generation of energy using fossil fuels is necessary to offset the hydric deficit. Since Colombia is one of the largest coffee producers in the world, this study used system dynamics to evaluate the energy potential from cherry coffee pulp and analyze trends in the energy supply for different energy sources in scenarios of climatic vulnerability. First, the causal relationship of the system was identified, and the key variables of the model were projected. Then, the behavior of the system was evaluated by simulating a 120-month period. The results showed a generation potential from coffee pulp of 177 GWh per year and a power generation of 11,250 GWh and 7537 GWh with solar and wind resources, respectively, by 2030. Finally, it was confirmed that including new renewable resources is a key factor in supporting hydraulic generation in the warm phase of ENSO while reducing thermal generation dependence.

1. Introduction

Driven by factors such as environmental issues and global warming, a global goal for decarbonizing the economy has been set in recent years [1]. Due to the topography of the country, Colombia has important hydraulic resources that are used to generate electricity. These sources represent 68.3% of the current electricity mix and, along with thermal generation (gas 13.3%, coal 9.4%, and oil 7.7%), account for 98.7% of installed capacity. In addition, generation using non-conventional renewable energy sources (NCREs) does not reflect a significant contribution to the electricity mix, considering that NCREs only represented 1.3% of the total installed capacity in 2020, which were mainly obtained from the cogeneration of sugarcane bagasse [2]. The importance of hydraulic and thermal sources as the main energy supply makes the Colombian electricity market a hydrothermal market. Although the electricity generation mix in Colombia is mostly renewable [3], the significant contribution of hydro sources represents a high reliance on the availability of this resource for energy production, since hydropower generation is affected by El Niño–Southern Oscillation (ENSO) [4].
ENSO is a weather pattern whose effects have been studied in the framework of energy production in different Latin American countries [5]. Two opposite phenomena derive from ENSO. The La Niña phenomenon is characterized by rainy seasons, and the El Niño phenomenon refers to the warm phase of ENSO, with high temperatures and droughts [6]. Both have a direct effect on the potential for electricity production in Colombia, since the contribution to hydraulic generation can vary from 45 to 95% [7,8]. However, El Niño has a negative influence on water inflows to dam reservoirs, which has implications for generation costs and energy supply [9]. When this occurs, the main support to supply the demand is assumed by thermal generation sources, which can reach 50% of the total energy generated during some El Niño episodes [10]. In this context, the Colombian government has been encouraging NCREs investment through a regulatory framework that is mainly represented by Law 1715 enacted in 2014 (Unconventional Renewable Energies Law) [11]. With these incentives, NCRE’s installed capacity is expected to represent 12% of the total electricity matrix by 2022. [12]. To contribute to this national goal and reduce hydropower dependence, one of the available resources to generate clean energy in Colombia is biomass. According to Gómez-Navarro and Ribó-Pérez [7], the energy potential from biomass in Colombia is close to 15 GW of installable capacity. Moreover, compared to sources such as solar, wind, and geothermal, biomass is considered the most abundant resource available to produce NCRE in the country [13]. Despite this, most of the research has been focused on other non-conventional technologies, and the projected installed capacity of NCREs is based entirely on solar and wind resources [14]. Different studies have evaluated the energy potential of biomass on a national [15,16] and regional scale [17], highlighting the vast availability of this source for energy applications in Colombia.
The process of energy power generation using biomass is produced through different thermochemical and biochemical conversion methods. However, the selection of the appropriate process depends on the features of each residue [18,19]. For example, the percentage of moisture determines the total solid (TS) content in the biomass [20]. Nevertheless, the efficiency of the process in thermochemical alternatives may be affected due to the presence of water in residues with high moisture content, as is discussed in different studies [21,22,23]. Thermochemical processes, such as combustion, pyrolysis, and gasification, are frequently used for energy production from biomass with moisture percentages of less than 50% [24], whereas for residues with high percentages of moisture, bioconversion technologies, such as anaerobic digestion (AD), are considered a more suitable option [25]. The AD and direct combustion processes were studied by Sagastume et al. [15] to evaluate the energy potential of the main crops and livestock produced in Colombia. In this study, the authors estimated a bioenergy potential between 60,000 and 120,000 GWh per year from (i) pig, cattle, and poultry wastes and (ii) agricultural production residues from crops such as sugarcane, palm oil, and coffee.
Worldwide, Colombia is the third-largest coffee producer, after Brazil and Vietnam, and the largest producer of mild-washed Arabica coffee [26,27]. In December of 2020, Colombia reached 651 thousand tons of cherry coffee production, the highest recorded in the last 24 years [28,29]. However, in the coffee production process, less than 5% of the biomass is used for the elaboration of the final product [30]. The other 95% remains in residual form and can be used for biofuels [31,32] heat [33] and energy [34] production, among others [35,36]. For example, Zinla et al. [37] evaluated the thermochemical properties of coffee husk as a biofuel to produce electricity from biomass thermal plants in Côte d’Ivoire, while Garcia-Freites et al. [38] assessed the potential of coffee steams for energy generation and heat recovery in Colombia. In this work, the authors highlighted the potential of this residue for combined heat and power generation (CHP) and concluded that the technical properties of coffee steams make it an attractive option for energy production. Therefore, considering the high levels of production of cherry coffee in Colombia, residues from coffee processing can be used for energy purposes [39,40], contributing to the generation of NCRE in the country. For example, in a recent study developed by Ramos-Hernández et al. [25], the authors assessed the potential of coffee pulp for energy generation on an industrial scale in Mexico and employed system dynamics (SD) to model the coffee pulp supply chain for energy production. SD is a methodology that allows the evaluation and analysis of the features of systems in the mean and long term through the causal relationship of the variables [41]. Energy generation and planning systems are affected by multiple variables of different natures, making SD a useful tool for modeling the behavior of such systems under different scenarios.
This study seeks to evaluate the energy generation potential of coffee pulp in the electricity market of Colombia, a hydro-dominated market that is highly affected by climatic phenomena due to the current composition of the electricity mix. SD was applied to model two topics related to the Colombian electricity generation system: (i) the bioenergy potential of coffee pulp, one of the by-products of the coffee production process, and (ii) the behavior of the electricity mix and the supply of the demand, considering factors such as the El Niño phenomenon, installed capacity, and thermal generation. This research presented the power generation potential associated with wastes from the coffee industry in Colombia, such as coffee pulp, as an additional alternative to the production of energy with solar and wind sources and a backup for the hydrothermal market in climatic vulnerability scenarios.

2. Literature Review

During cherry coffee processing, two methods, known as wet and dry benefit, can be employed to obtain green coffee beans [42]. The latter is commonly used in Brazil [31]. Meanwhile, in Colombia [43] and Central America countries [44], the transformation of cherry coffee is carried out using the wet approach. In wet coffee processing, coffee cherries are depulped, demucilled, washed, and dried [45,46]. Then, by-products such as pulp, mucilage, husk, and cut-stems, among others, are obtained [47,48], most of which have been evaluated as a source of energy [49]. For example, García et al. [50] conducted an energetic and environmental assessment for energy production from coffee cut-stems. Chala et al. [51], and Rivera and Ortega-Jimenez [39] studied the energy potential of coffee through the use of by-products such as pulp, mucilage and husk, from a case study in Ethiopia and Colombia, respectively. In turn, Dal-Bó et al. [52] relied on heuristic and evolutionary approaches to optimize the technical features of energy generation from coffee husk and concluded that pyrolysis is an appropriate method for energy production from this residue. On the other hand, wet residues such as pulp and mucilage, whose moisture content is approximately 85% and 92% [53,54], respectively, are often used for biogas generation from AD.
Biogas is composed mainly of methane (CH4) and carbon dioxide (CO2) and is produced from the decomposition of organic material in an anaerobic (absence of oxygen) environment [55]. During the AD process, four stages are developed for biogas generation: hydrolysis, acidogenesis, acetogenesis, and methanogenesis [56]. The technical features of biomass, such as cellulose, lignin, TS, and volatile solid (VS) content were studied by Rojas-Sossa et al. [57] to evaluate the effect of these properties on the amount of biogas generated from different combinations of mucilage and pulp, and by Widjaja et al. [58] and Corro et al. [59] to assess biogas production using the co-digestion of coffee pulp and cow dung. These works are similar to the study by Sumardiono et al. [60], where the TS content of coffee pulp for biogas generation was discussed, concluding that the TS content can affect the amount of biogas generated.
Authors such as Achinas et al. [61], Mayer et al. [62], and Poblete et al. [63] reviewed different energy conversion processes from waste, and they concluded that AD is an efficient alternative to biogas production. In the framework of energy generation at an industrial scale, Liu et al. [64] estimated the potential for renewable energy production from biomass in Canada, while Borges et al. [65] relied on the SD approach to estimate the biogas potential in Brazil, considering biomass such as municipal wastes and agriculture residues for energy generation. Likewise, Pham et al. [66] applied SD to assess the effect of climatic conditions on coffee production in Vietnam, considering variables such as coffee harvest area and total rainfall. Other studies have involved the SD approach to model systems related to biowaste management [67,68], biomass supply chains [69], and energy generation from urban solid waste [70].
SD has also been applied to systems of a renewable nature [71] to understand the behavior of power generation systems [72] and the effect of policies and mechanisms in this sector [73,74]. For example, Zapata et al. [75] relied on SD to evaluate the effect of renewable energy sources on the Colombian electricity market. In their study, the authors concluded that solar and wind energy will play a significant role in the energy supply of the country by 2035, and that fossil fuel generation will not be necessary in this scenario. A similar result was obtained by Henao and Dyner [76], whose results suggest that power generation from solar and wind sources are indispensable to fulfill the energy demand and provide reliability in the Colombian electricity system. Power generation from solar and wind technologies has been also studied in other Latin American countries, such as Argentina, Brazil and Chile [5,77,78], to evaluate the energy support of these sources under climatic vulnerability scenarios. Then, using SD modeling, the technical properties of coffee pulp for biogas generation were considered in this study to estimate the energy potential of this by-product, involving characteristics inherent to the Colombian power generation system and its complementarity with other renewable sources, such as solar and wind, in the analysis.

3. Materials and Methods

In this study, the system of interest was represented through the causal loop diagram, and variables such as cherry coffee production, projected energy demand, installed capacity of solar, wind and hydro power, the occurrence of the El Niño phenomenon, and El Niño’s effect on hydroelectric power were considered. For data forecasting, methods such as autoregressive integrated moving average (ARIMA) were applied, using MATLAB® software, version 2020A, The MathWorks, Inc. (Natick, MA, USA). Then, the SD model was simulated for 10 years (2021–2030) at a monthly frequency by using Vensim DSS® software, version 9, Ventana System (Harvard, MA, USA). The equations of the system and main indicators were also defined.

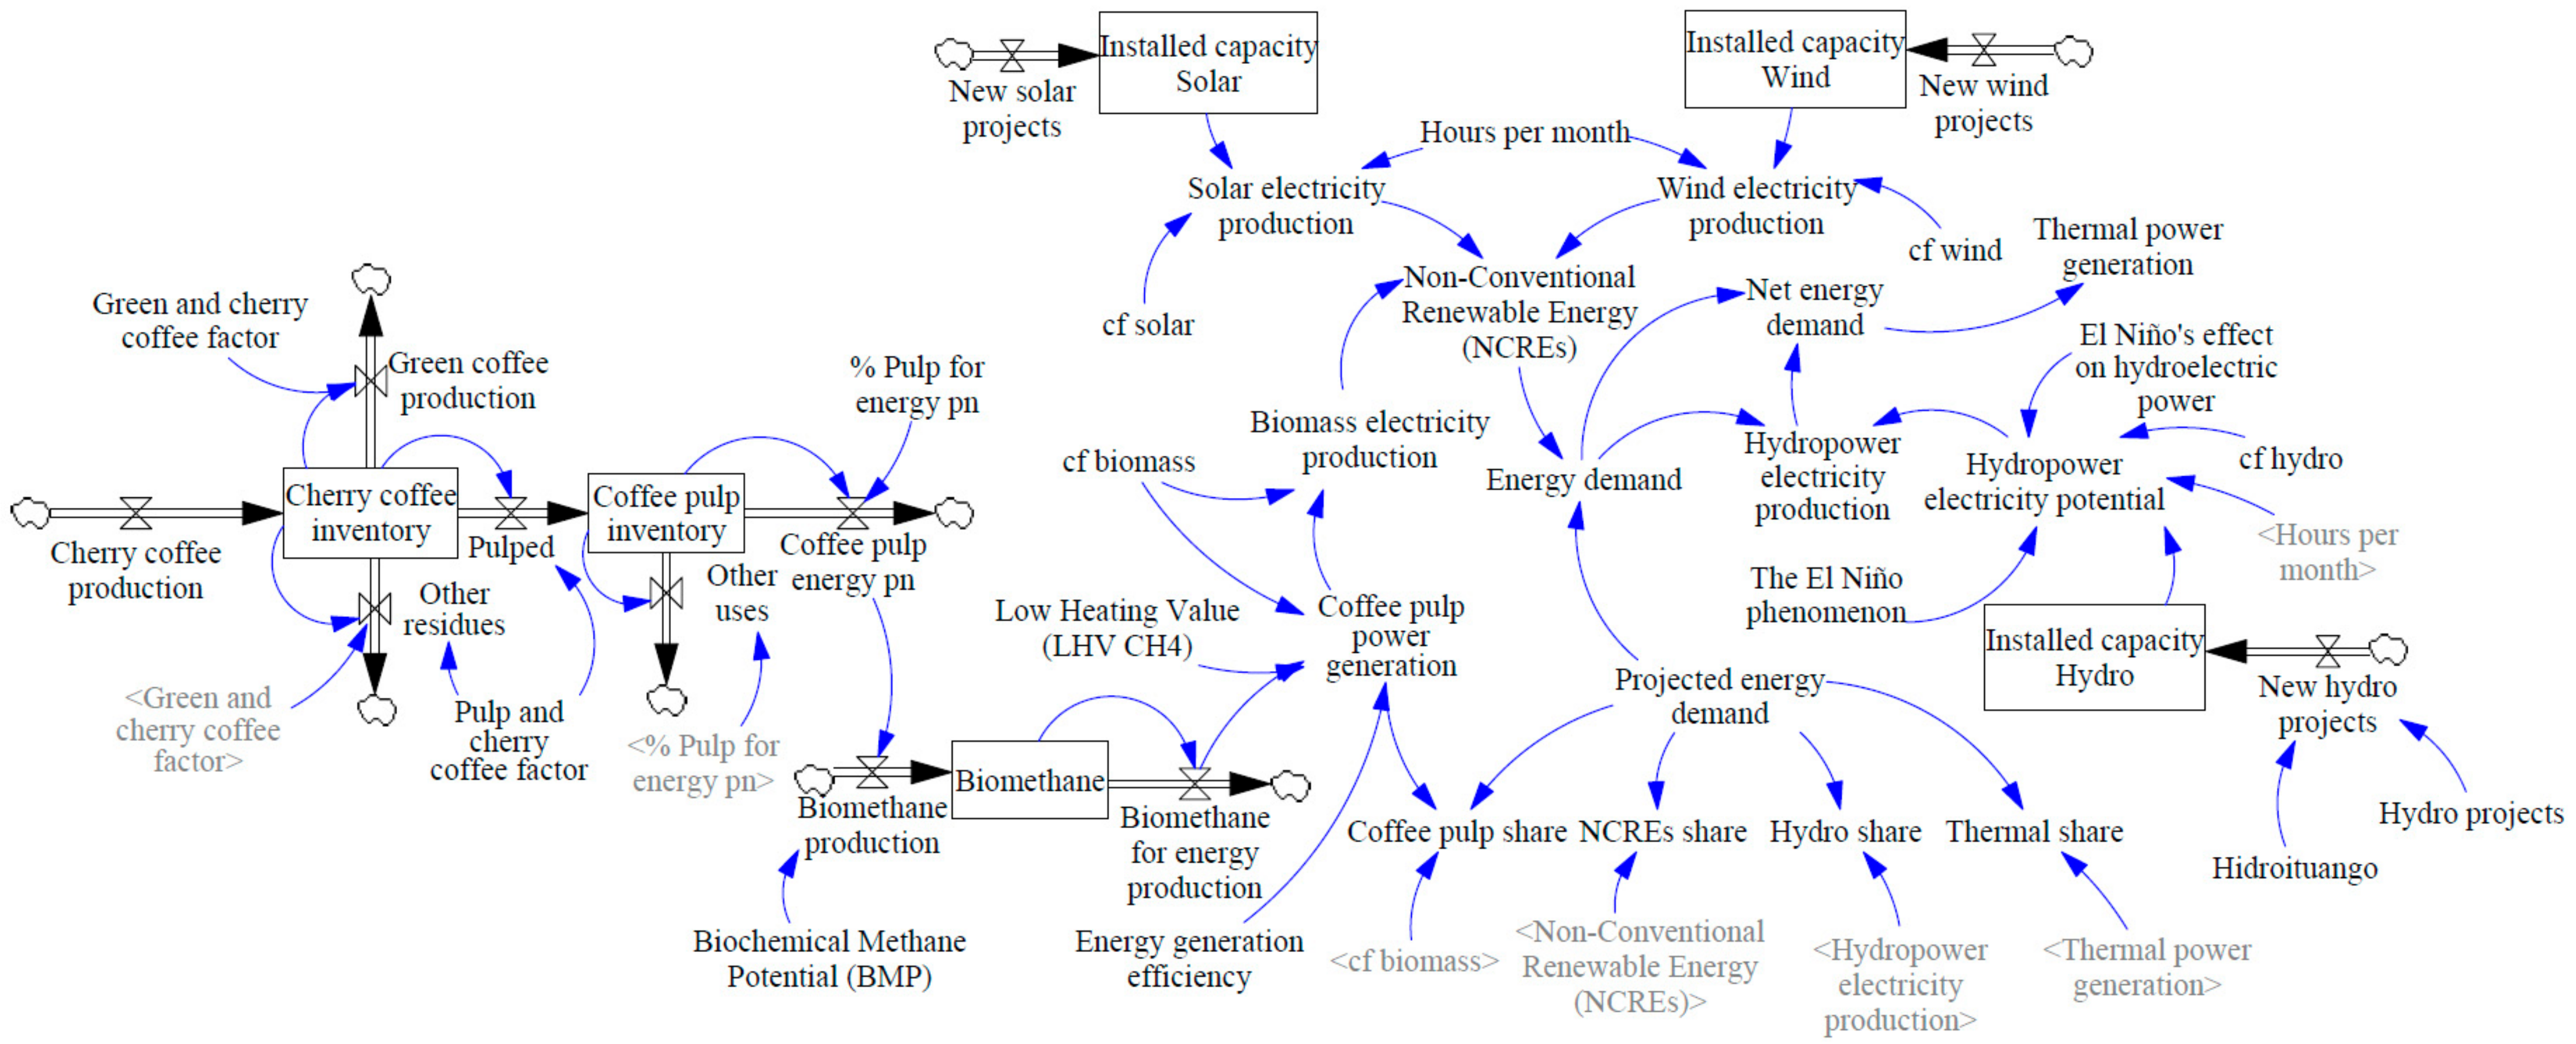
3.1. Causal Loop Model

The causal representation of the model is shown in Figure 1 and considers two subsystems. The first subsystem is coffee pulp procurement for energy generation (green color). The second subsystem is the Colombian electricity generation system (blue color), which is considered a hydrothermal market due to the high contribution of large hydro and thermal plants.
About 882,257 hectares have been harvested to supply the national and international demand for coffee [28]. In recent years, the country has produced a total of 70,625 thousand green coffee bags, accounting for 26.4 million tons of cherry coffee. For example, in 2020, Colombia exported 12.5 million green coffee bags to supply foreign demand of countries such as the United States, Germany, and Japan [79]. Thus, an increase in international and national demand for green coffee will also increase the production of cherry coffee in Colombia (Figure 1, loops B1 and B2).
The high levels of cherry coffee processing directly affect the amount of coffee pulp obtained. Coffee pulp represents 43.6% of the cherry coffee bean on a wet weight basis [51], which means for every thousand tons of cherry coffee processed, 436 tons of pulp are obtained. The inventory of this residue can be exploited to generate biogas for power generation (Figure 1, loop B3), and the digestate produced from this process can be used directly as organic fertilizer to improve the soil yield in cherry coffee production (Figure 1, loop R1). On the other hand, power generation from coffee pulp contributes to increasing energy production with NCREs in Colombia, reducing the demand supplied by hydroelectric plants. This is notable, considering that power generation from NCREs only reached 925 GWh of electricity production in 2020, while 49,837 GWh of the 70,313 GWh of the total energy demand were supplied by hydro sources [2]. These figures represent a share of 1.3% and 71% of the total electricity produced in that year, respectively.
Historically, the annual energy demand in Colombia has shown a growing and almost linear behavior. However, the demand in the country presents some variations, depending on the month of the year. In periods between April and November, the energy demand has an increasing trend, with no major fluctuation, while in February, it presents a clearly decreasing demand for electricity, followed by an increasing trend in March [2]. On the other hand, the daily energy demand in the country ranges between 180 GWh and 220 GWh, with Sundays and holidays registering the lowest energy requirements [80]. Figure 2 depicts the energy demand in Colombia, with monthly details, from 2010 to 2020 [81].
Figure 2 also shows the periods in which the El Niño events took place during the last ten years. As can be seen, no clear effects are reflected in the behavior of energy demand during the 2015–2016 and 2018–2019 El Niño episodes. However, the severe droughts caused by this climatic phenomenon reduced water inflows for energy generation of the large hydropower plants, which affected the amount of energy available for matching the national demand (Figure 1, loop B4), especially considering that hydraulic and thermal sources accounted for 98.7% of the total installed capacity, and solar, wind, and biomass resources did not exceed 0.22 GW installed [2], as shown in Table 1. Therefore, thermal generation is the main source to support hydropower generation when the latter is unable to produce enough energy. This represents not only a high reliance on fossil fuels, but also increases in generation costs [8] (Figure 1, loops B5, B6, and B7).

3.2. Modeling

The system under study is depicted from the Forrester diagram of Figure 3, which is based on the causal loop diagram presented in the last section. The system modeling considered the analysis of the key variables involved, data forecast, and the relationship among them with the application of different equations. Then, the analysis was carried out simulating 120 months.
As in the case of the causal loop diagram, the model represented by Figure 3 considers the two subsystems of study. The left side of the diagram details the procurement of coffee pulp for energy generation, where the amount of electricity produced from this waste (GWh/month) is obtained from the monthly cherry coffee production in Colombia and considers that 80% of the coffee pulp (ton pulp/month) would be used for energy generation. Then, the biomethane generated ( m 3 CH 4 /month) from the AD process of this residue is used for electricity production, considering its low heating value (LHV) (GWh/ m 3 CH 4 ) and an efficiency of 40% for the electrical conversion process [82,83].
The middle and right sections of Figure 3 represent the Colombian electricity generation system, where the electricity production from biomass, solar, and wind technologies were evaluated considering a capacity factor (cf) of 84%, 20%, and 38% [84], respectively. The coffee pulp power generation increases the biomass electricity production, as new solar and wind projects increase the installed capacity available to generate energy from these technologies. Then, the total of electricity produced from NCREs (GWh/month) reduces the amount of energy demand to be generated by hydroelectric plants. In this sense, any contribution of energy generation from coffee pulp contributes to a lower net energy demand. The hydropower electricity potential is used to produce the electricity needed to supply the net energy demand. However, the occurrence of the El Niño phenomenon negatively affects the available capacity of this resource (stored in water reservoirs) and thereby, hydropower electricity production (GWh/month). Finally, the deficit of hydroelectric generation to meet demand is supplied by electricity production from thermal power plants (GWh/month).
The following sections provide a detailed explanation of the main variables involved in the model.

3.2.1. Biochemical Methane Potential from Coffee Pulp (in m 3 CH 4 / ton   pulp )

According to IRENA [85], the amount of energy produced from biogas depends mainly on the methane content within the biogas. In this study, the biochemical methane potential (BMP) obtained from the AD process using coffee pulp was estimated from Equation (1) [86]. For this calculation, the 4 biomass components (for coffee pulp case), cellulose ( X C ), hemicellulose ( X H ), lignin ( X L ), and residuals ( X R = 1 X C X H X L ) were obtained in [15].
BMP   m 3 CH 4 ton VS = 378 X C + 354 X H 194 X L + 313 X R   259.42
Note that the result of Equation (1) represents the BMP per ton of VS, since the amount of raw material that can be digested by anaerobic bacteria depends on the VS portion within the TS content. In the case of coffee pulp, the VS content is 74.6% on a dry basis [15], and the TS percentage, considering the moisture of this biomass, is equal to 15%. Thus, the VS fraction (VSF) is 11.19% VSF = 74.6 % 15 % .
The BMP (in m 3 CH 4 ) is equal to 29.03 per ton of cherry coffee pulp and was estimated from Equation (2), according to the VS fraction and the result of Equation (1):
BMP   m 3 CH 4 ton   pulp = VSF BMP   m 3 CH 4 ton VS   29.03

3.2.2. Projections of System Variables

In this work, data projection of cherry coffee production was made from historical information collected from Fedecafé [28], and the available land for cherry coffee production was not considered as a constraint due to the large availability of land in Colombia for coffee cultivation. The El Niño phenomenon occurrence and El Niño’s effect on hydroelectric power were projected according to the behavior and intensities recorded in the last 10 years. Finally, the projected energy demand was obtained from UPME [87], while the Installed capacity of solar, wind and hydro energy were based on information from SIEL [14]. This section presents the projection analysis performed for each of the system variables mentioned above.
  • Cherry coffee production (tons/month). The projection of this variable considered a continuous production cycle throughout the year based on a cultivated land of around 880 thousand hectares in 20 regions of Colombia. Using historical information for the last 65 years, the projection of cherry coffee production was made from the application of the ARIMA model, following the Box–Jenkins methodology for the estimation [88]. First, a differentiation of the annual time series was carried out to establish data stationarity. Then, a conditional media model was estimated, and it was determined that ARIMA (1, 1, 0) had the best fit for the time series. The standardized residuals obtained from this model did not present an autocorrelation between them, as shown in Figure 4.
Furthermore, a Ljung–Box test was applied for lags 5, 10, and 15, which reaffirmed that the chosen model adequately described the behavior of the data because the residuals were independent, with p values equal to 0.93, 0.75, and 0.73, respectively, for the test. Finally, the cherry coffee production forecast for the next 10 years was estimated. Then, to represent the different levels of production in each month, the monthly behavior of cherry coffee production was calculated from the historical monthly proportions and the annual projections obtained from the ARIMA model using Econometrics Toolbox-MATLAB® version 2020A, The MathWorks, Inc. (Natick, MA, USA).
  • The El Niño phenomenon. This variable depicts the months where the El Niño phenomenon will take place within the study period (2021–2030). Although a defined forecast does not exist to establish climatic phenomenon occurrences, according to the International Research Institute (IRI), El Niño occurs with a frequency of every 2 to 7 years [89]. In addition, some researchers have determined a behavior pattern that points out that strong El Niño events have a longer duration versus those of lower intensity [90].
    For this analysis, the occurrence and intensity of the El Niño phenomena registered in the last 10 years were assessed. It was assumed that within the analysis period, El Niño will take place in two events, with moderate and strong intensities, respectively. The first of them will be in 2023–2024, with behavior similar to that registered in 2018–2019. The second will occur from the beginning of 2028 to the first quarter of 2029, with duration and behavior similar to those presented during 2015–2016. Thus, a 4-year period was considered between one El Niño phenomenon and another. This is consistent with the research carried out regarding the frequency of this climatic phenomenon.
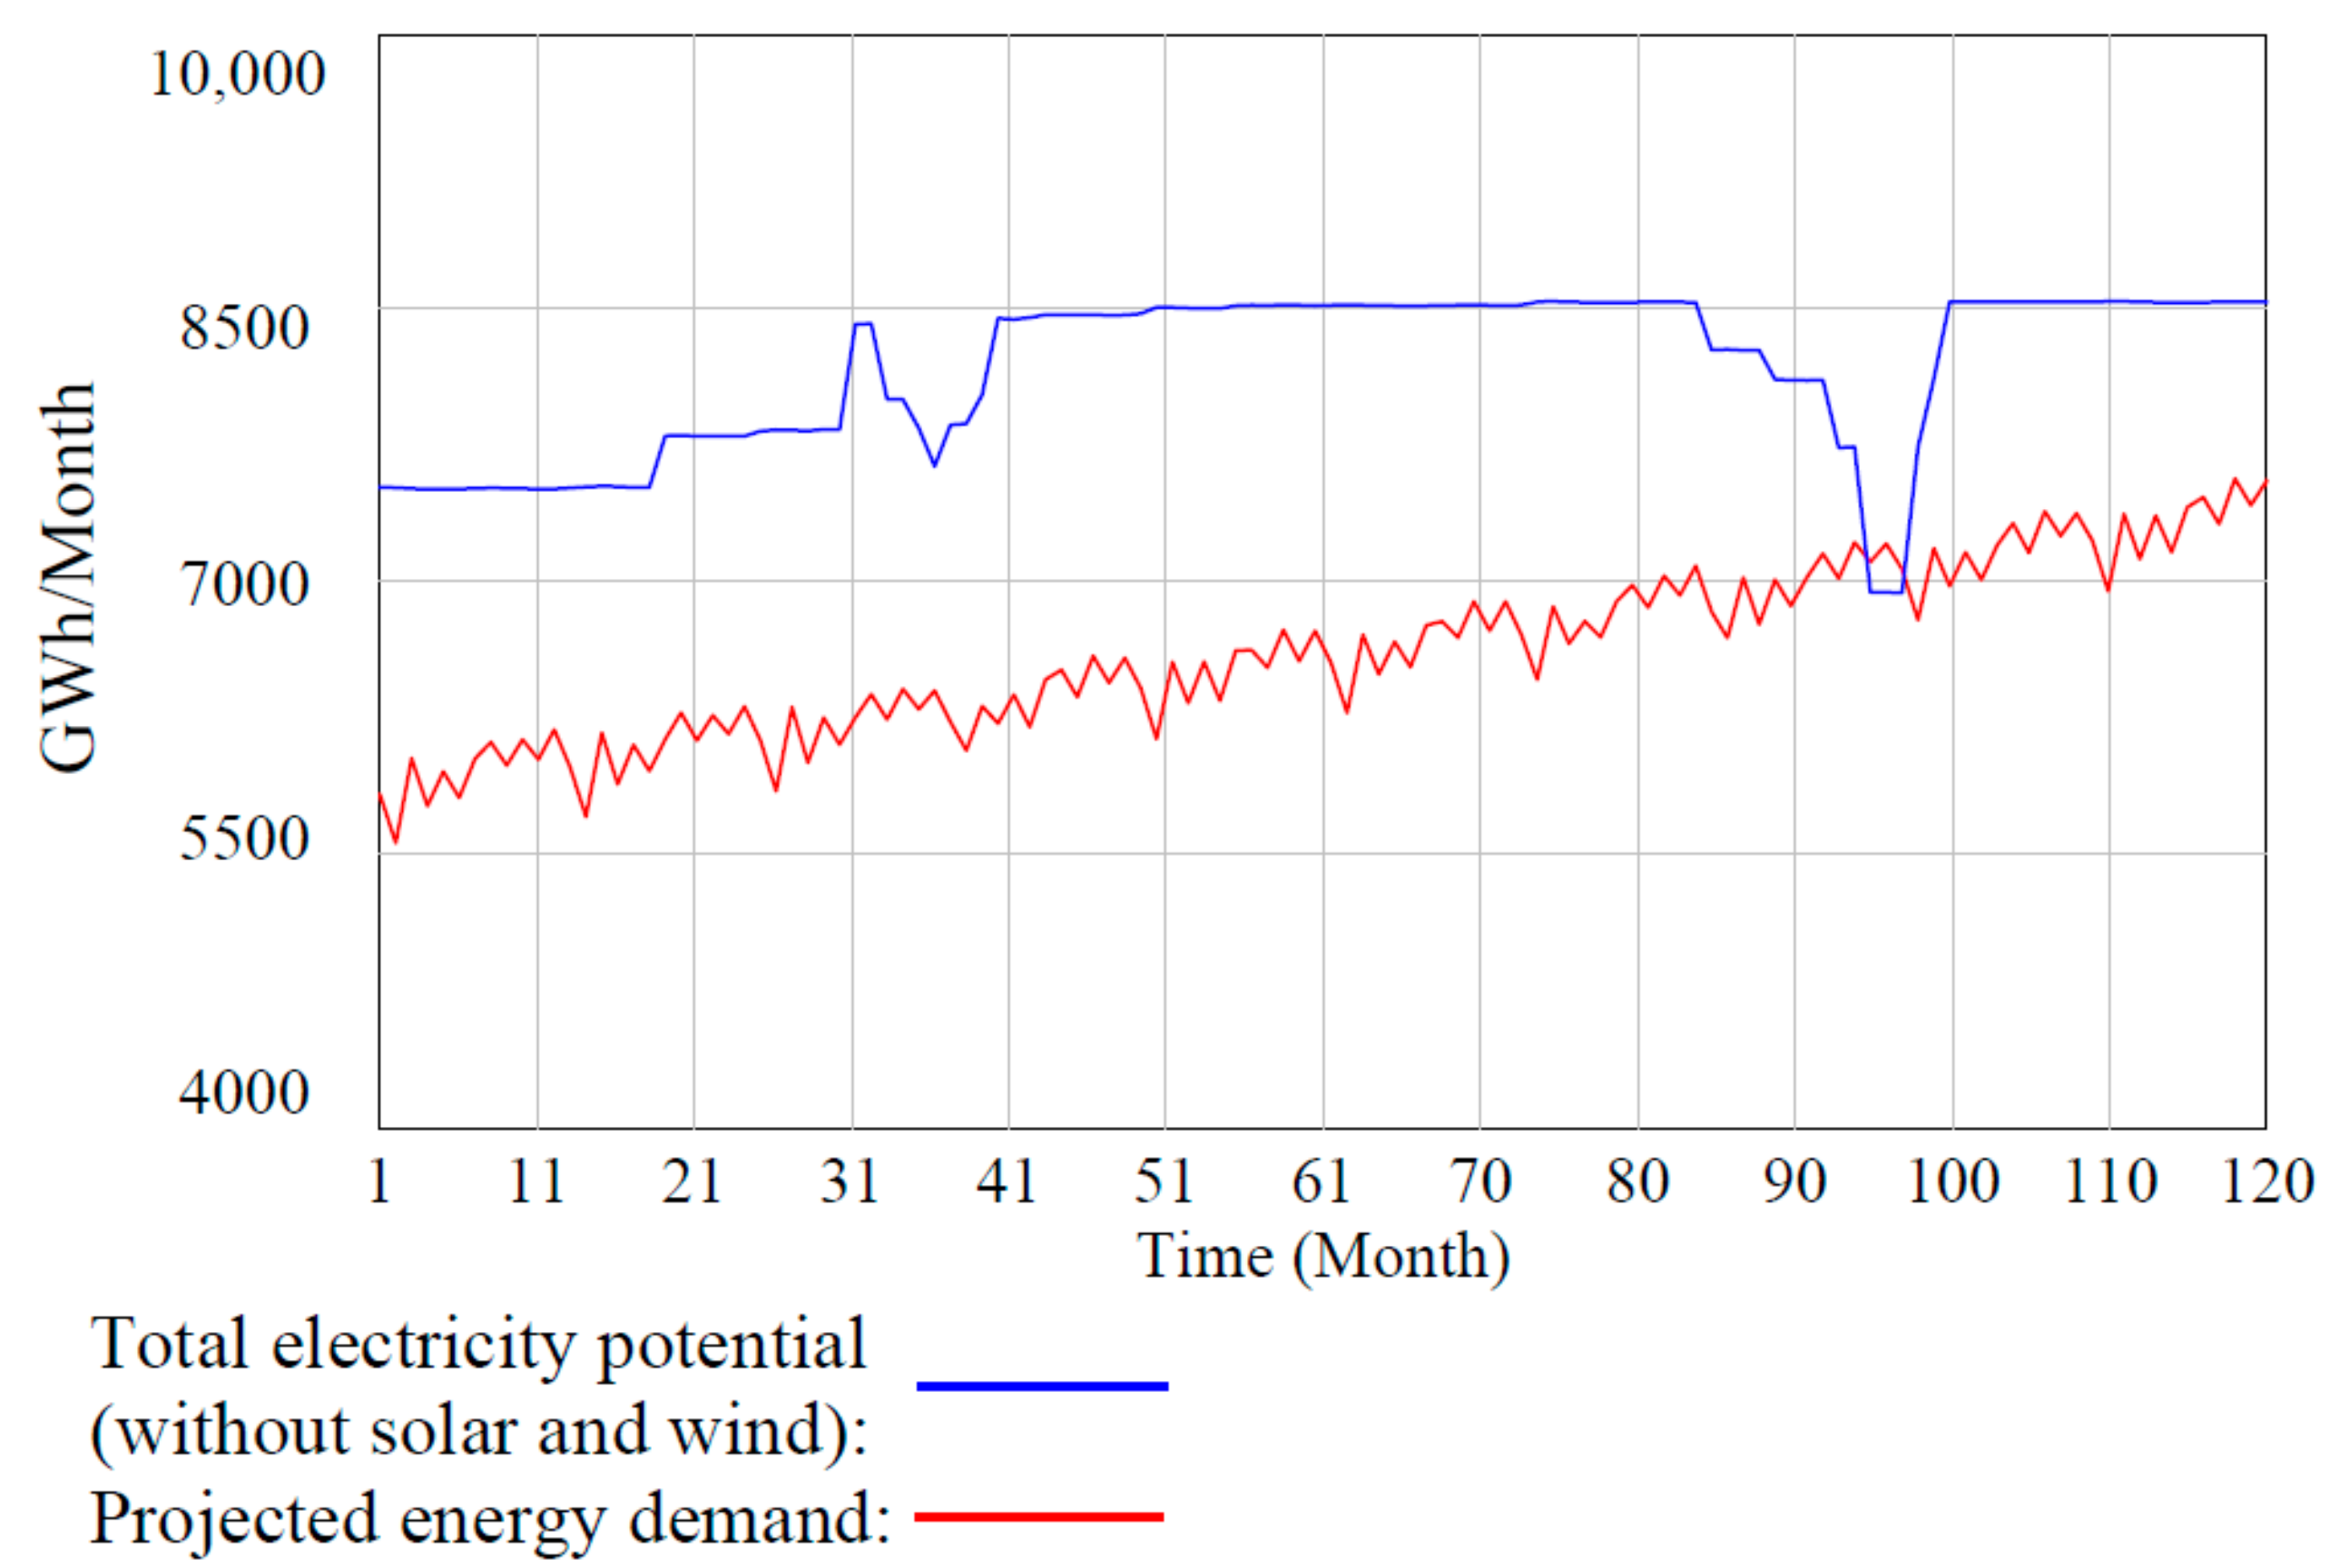
  • Projected energy demand (GWh/month). This variable indicates the amount of GWh of monthly demand in the country. The figures of this variable were based on the projection of the Unidad de Planeación Minero-Energética (UPME), the mine and energy planning unit in Colombia, and considered the monthly variation in energy demand in different moments of the year, according to its historical behavior.
    On the other hand, this study did not consider any effect of the El Niño phenomenon on the level of energy demand during the study period, since no significant effects of El Niño on energy demand are observed in the history from recent years (see Section 3.1).
  • Installed capacity for solar, wind, and hydro energy (GW). The projection of the installed capacity for the 3 technologies was calculated considering the current projects in phase 2 (with prefeasibility studies) or 3 (with the execution schedule and environmental licenses) that were registered in the UPME at the time of the estimates. From this information, the monthly details of the amount of GW that would come into operation for each year of the study period (new solar, wind, and hydro projects) were obtained, increasing the installed capacity of the country for each type of technology. In the case of hydropower, the Hidroituango project was also considered. Hidroituango is a mega hydroelectric project—the largest hydropower project in Colombia—that expects to increase the hydropower capacity by 2.4 GW [76], which represents 13.72% of the total capacity currently installed. In this research, it was assumed that Hidroituango will start operation in 2022 and 2023, with 0.8 GW and 1.6 GW of installed capacity, respectively. These assumptions were considered due to the importance of Hidroituango for energy supply in Colombia, especially during severe drought events.
    The amount of monthly electricity production for each technology (GWh/month) was calculated based on (i) installed capacity, (ii) capacity factor, and (iii) hours per month. The impacts of the El Niño phenomenon on solar and wind generation were not considered, since there is no historical information available for Colombia to carry out such estimates.
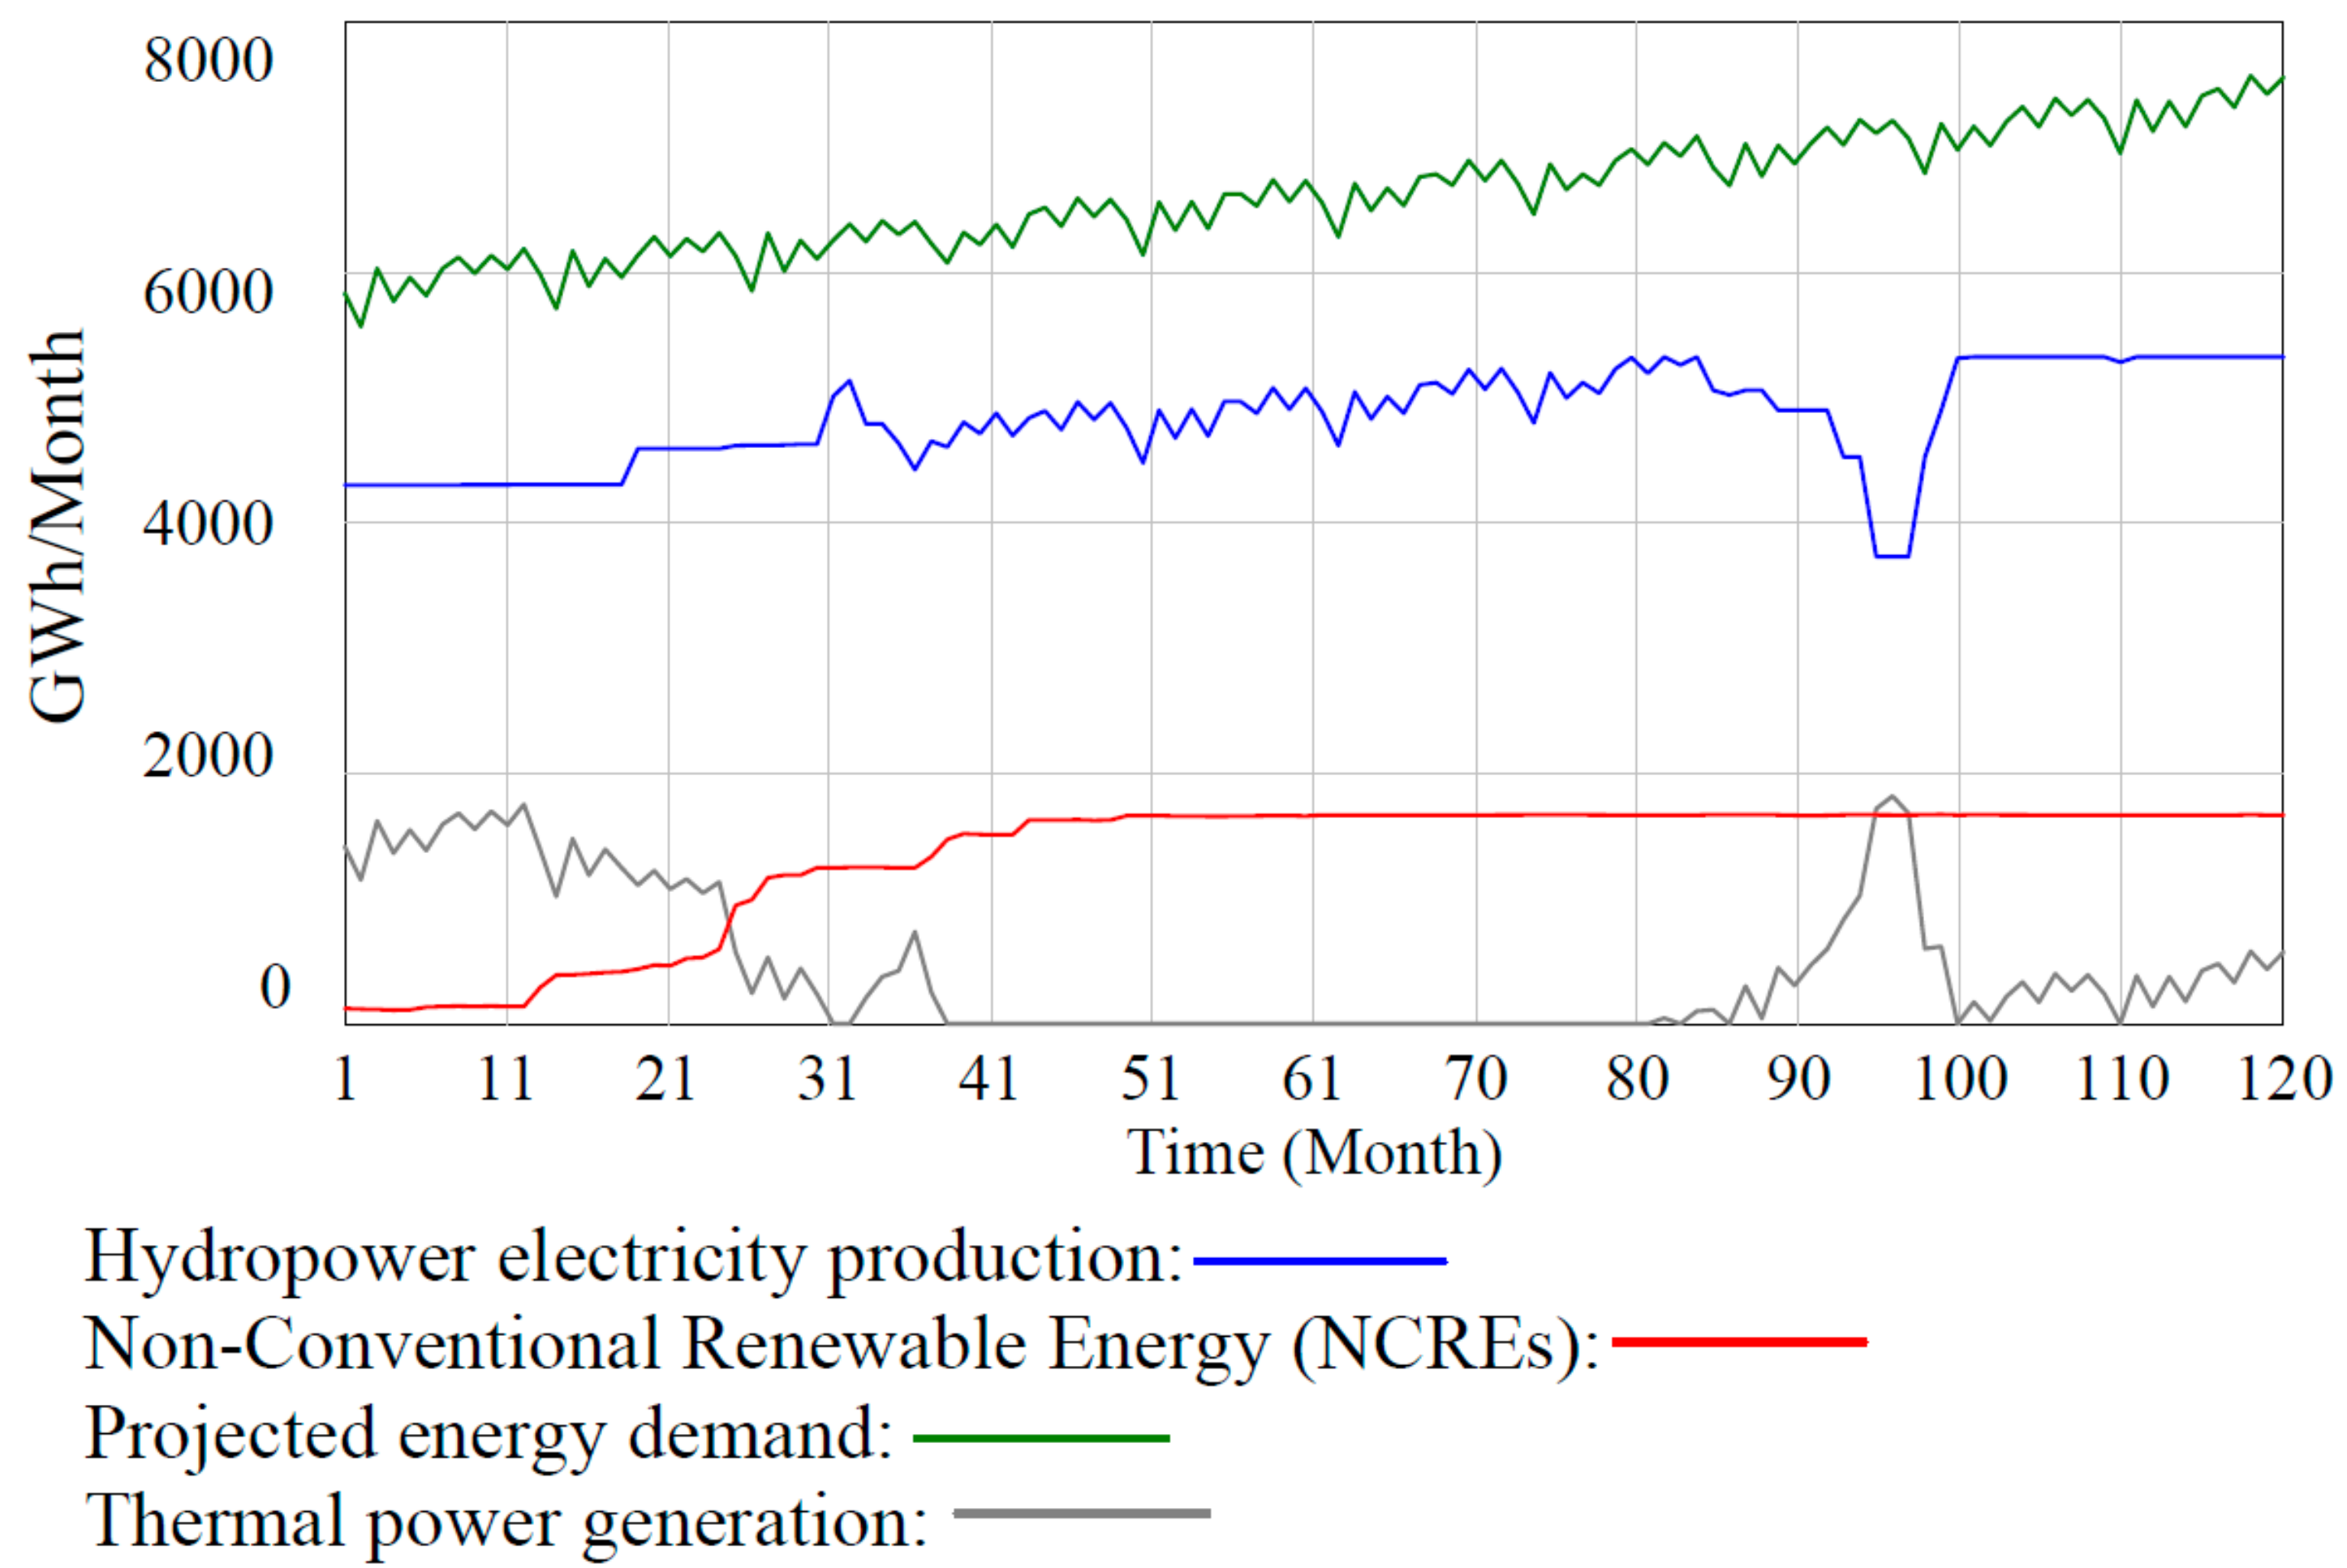
  • El Niño’s effect on hydroelectric power. This variable represents the percentage reduction in the hydroelectric potential during El Niño events and depicts the vulnerability of the electricity generation matrix in Colombia. To this end, the behaviors recorded by the Oceanic Niño Index (ONI) during 2015–2016 and 2018–2019 were assessed. ONI is a measure of ENSO that establishes that El Niño conditions exist when the oceanic temperature is at least 0.5 °C above the normal median temperature for more than 3 consecutive months. ONI data were collected from the Climate Predictor Center [91]. Then, a comparison between the decline in hydropower electricity production in Colombia and the ONI for each month of El Niño in 2015–2016 and 2018–2019 was carried out. It was found that for a strong El Niño, the share of hydrogeneration in the total energy produced dropped to 50% of the electricity mix at that moment. Based on this analysis, the effect of El Niño on hydroelectric power was projected for the years evaluated by the study.
    A duration of 7 months was defined for El Niño of the 2023–2024 period (moderate intensity), and 15 months was defined for the 2028–2029 period (strong intensity). Additionally, this study considered that the effects of El Niño reach the highest levels in December and the first quarter of the following year for the indicated periods, according to the behavior recorded by the ONI and other investigations [9,90,92] for this climatic phenomenon.

3.3. Main Equations of SD Model

The equations of the model were formulated based on the Forrester diagram in Figure 3 and the projections of Section 3.2.2. Table 2 presents the main equations of the system and the indicators used to measure the share of different energy sources in the projected energy demand at each moment.
The initial values for the installed capacity of solar, wind, and hydro energy correspond to the installed capacity in 2020 (see Table 1). In addition, the initial value of coffee pulp inventory was 238,938 tons, corresponding to the amount of pulp generated from cherry coffee production in December 2020. The initial production of biomethane was defined as 6,593,901 m 3 .

3.4. Model Assumptions and Limitations

This subsection describes the main assumptions and limitations of the model.
  • Cherry coffee production was forecasted according to historical information on national coffee production for the last 65 years.
  • It was assumed that 80% of the coffee pulp obtained would be used for energy generation.
  • In this work, two El Niño events were modeled. The duration, frequency, and intensity were based on previous studies associated with this climatic phenomenon (see Section 3.2.2).
  • The model considered the monthly behavior of the energy demand, according to UPME estimates (see Section 3.2.2).
  • The electricity production from renewable sources was modeled, considering the projections of installed capacity and the capacity factor of each technology. For simplicity, the model did not include the monthly variation of wind and solar generation associated with the fluctuation of each resource.
  • The effects of the El Niño phenomenon were considered to evaluate the energy supply in climatic vulnerability scenarios and were mainly represented by the implications for the hydropower electricity potential. Impacts on the NCRE electricity production and the energy demand were not included in the model (see Section 3.1 and Section 3.2.2).
  • The model represents the Colombian electricity generation system, where the amount of power generated is produced to supply the energy demand. Therefore, there was no excess in the energy generated by any of the technologies evaluated in the model (see Section 3.2 and Table 2).
  • The model does not consider increases in the installed capacity from fossil sources.

4. Results

4.1. Energy Potential from Coffee Pulp

For the study period, the generated biomethane had a maximum value of 7.05 million m 3 CH 4 and an average of 4.65 million m 3 CH 4 per month, which can generate 15 GWh of energy monthly. Figure 5 depicts the behavior of biomethane production and power generation from coffee pulp, with monthly details. For both cases, the results vary for each month, since the variables are closely related to cherry coffee production. The graph also shows the total biomass electricity production, whose figure remained between 94 and 106 GWh during the analysis period. The difference between the results of coffee pulp power generation and biomass electricity production corresponds to the initial value of the installed biomass capacity (see Table 1). On average, coffee pulp power generation represented 15% of the total biomass electricity production, considering that no new biomass projects were found in phase 2 or 3 in the registry of generation projects for the next 10 years.
Energy generation with NCREs sources experienced a significant increase compared to the baseline scenario, driven mainly by new solar and wind projects. For January 2021, solar and wind electricity production was equal to 8.85 and 5.04 GWh, respectively. However, for the same month of 2026, these figures reached 937.54 and 628.14 GWh, respectively, and remained constant until 2030. Coffee pulp generation represented a significant contribution to NCREs generation in the first months of analysis since at that time, the installed capacity with NCREs was negligible. Figure 6 shows the behavior of the total generation with NCREs sources and the details of coffee pulp, wind, and solar electricity production.

4.2. Climate Vulnerability in a Hydrothermal Market

As expected, the hydropower electricity potential experienced an important reduction during the two El Niño events assumed in this analysis, especially during the 2028–2029 period, where the climatic phenomenon was considered to have strong intensity. In August 2023, one month before the occurrence of the first El Niño event, the hydropower electricity potential was equal to 5205 GWh. However, for December of the same year, this variable had the lowest value during this period, with 4424 GWh of hydropower potential. A greater effect was recorded for the simulation of an El Niño of strong intensity. Considering the results, the water deficit caused by this phenomenon reduced the hydropower electricity potential to 3727 GWh for 3 consecutive months (November and December 2028, and January 2029), which is equivalent to a 30% drop in the energy supply from this technology. Additionally, the duration of this last event was 2.14-fold of the simulated duration for the moderate El Niño case.
According to the projections of Section 3.2.2, the total capacity of the Hidroituango project was already installed by the time the phenomenon of the 2023–2024 period was assumed. For the second El Niño (2028–2029 period), hydraulic generation had 14.79 GW of total capacity, i.e., an additional 23.61% to the figure registered in Table 1. Figure 7 presents the monthly behavior of hydropower electricity potential for the next 10 years. Additionally, the graph shows the periods where the El Niño phenomenon should take place in this analysis and the influence of El Niño on the variable of interest.
Because of the features of the Colombian generation system and the reliance on hydropower generation to supply energy, the obtained results for the share for each energy source were assessed. Table 3 summarizes the values of this indicator (see Section 3.3) for the different technologies during the simulation of moderate and strong El Niño events.
According to Table 3, energy generation using coffee pulp contributed approximately 0.20% of the total energy demand during El Niño events and did not present significant variations. NCRE generation (which includes biomass generation) shows a strong complementarity to supply the deficit in the hydroelectric generation, since NCREs exceeded 19% of the share for all related periods. This was reflected in the results obtained for the case of thermal production. During the most critical month of the first El Niño event (December 2023), fossil fuel generation supplied only 11.44% of the total energy and dropped to 0% in February and March of 2024. Similar behavior was noted for the first eight months of the second assumed El Niño event, where the share of thermal energy did not exceed 8.31% and presented negligible contributions in January, February, and April 2028. For December 2028, when the climatic phenomenon was most severe, the share of hydropower declined to 51.69%. At that moment, thermal generation presented the highest participation in energy supply demand, with a share of 25.2%, which means an energy generation of 1816 GWh. Although this is an important contribution, the energy generation using fossil sources was not higher, due to the energy support from NCREs generation, whose installed capacity during the second El Niño was approximately 8.90 GW, according to the results from the simulation.
On the other hand, the peak of thermal generation in December 2028 only represents 58% of the almost 3.100 GWh of monthly energy production that could be generated from the installed capacity of thermal sources in Colombia (see Table 1). Therefore, the current installed capacity with fossil sources is enough to cover possible variations in the NCRE associated to fluctuations in the resources of these technologies (mainly solar and wind), and no additional thermal plants are needed to supply energy demand in vulnerable scenarios. However, without the expected development in solar and wind technologies, the potential available to generate energy from biomass, hydro, and thermal sources would not be enough to supply the projected demand during a strong El Niño event. As is show in Figure 8, for three months (November and December 2028, and January 2029) the estimated total energy that can be produced without solar and wind development is not sufficient to meet the energy demand under the most extreme climatic conditions. In addition, under this scenario, thermal energy generation would have an average share of 47% during the study period.

5. Discussion

It is estimated that the agricultural sector in Colombia could generate up to 153,600 GWh/year from biomass as a result of the processing of crops such as sugarcane, oil palm, and coffee [93]. This study evaluated the energy potential of coffee pulp in Colombia considering the applicability and relevance of the inclusion of non-conventional renewable resources as energy sources. It was found that, on average, 15 GWh of monthly electricity can be generated from coffee pulp. Nevertheless, during coffee cultivation, different residues are produced that can also be used for energy applications. For example, Sagastume et al. [15] estimated the bioenergy potential from cut-stems, husks, and coffee pulp in Colombia and found that these residues can generate between 244 and 900 GWh of energy per month.
In addition, this study evaluated the system generation in Colombia, which was represented by the diversification of the electrical matrix, the inclusion of renewable sources (including coffee power generation), and El Niño’s effect on hydroelectric potential, the dominant generation technology of the country. Figure 9 depicts the behavior obtained during the simulation for energy production from hydro, thermal, and NCREs and represents the monthly behavior of energy demand. The figure shows an increasing trend within the simulated period. The increase in the installed capacity of NCREs means that in a large part of the horizon analyzed, the generation from fossil sources is not necessary to supply the projected energy demand. In fact, thermal power generation by December 2030 is projected to be only 569.87 GWh, compared to 1164 GWh of the actual generation that this technology produced in December 2020 [81]. This represents a decline of 51%, despite the constant increase in energy demand. As expected, hydropower generation continues to be the dominant source of power generation in the country. However, the generation mix is observed to be more diversified, due to the increase in the installed capacity of NCREs, whose energy generation in December 2030 is 11.04-fold the production of January 2021 (according to the simulation results).
From the previous graph, the participation of the NCREs sources provides important support during El Niño events, reducing the reliance of the power system on thermal generation during this climatic phenomenon. Similarly, Pupo-Roncallo et al. [94] highlighted the importance of power generation using renewable sources in Colombia. In that work, the authors found that for 2030, the increase in solar, wind, and biomass energy production could reduce CO2 emissions and fossil fuel consumption by 20%.

6. Conclusions and Future Research

This study presented a global review of the Colombian electricity generation system through SD, considering elements such as the energy potential of coffee pulp, the El Niño phenomenon, and NCRE generation. It was estimated that one ton of coffee pulp can generate 0.10 MWh of electricity, which is an energy potential close to 177 GWh per year, according to the levels of cherry coffee production in Colombia, and if 80% of the coffee pulp obtained is used for energy purposes. This energy potential from cherry coffee pulp corresponds to 20% of the total energy generated in 2020 from NCREs sources, which could be much higher if other residues of coffee processing, most of which are discarded, were used for energy generation.
In addition, the effect of the El Niño phenomenon on energy supply was evaluated under different scenarios of installed capacity for 120 months. The results indicated that, with 8.9 GW of installed capacity using NCRE by 2029, thermal generation in a strong El Niño reached only a 25.2% share, under the most vulnerable hydro conditions. During this event, the largest contribution of NCRE to energy supply came from solar and wind resources, whose annual electricity production remained at 11,250 GWh and 7537 GWh, respectively, from 2026 to 2030. However, in a scenario without solar and wind energy development, the electricity produced from the other technologies would not be enough to meet the projected energy demand under extreme weather conditions. These findings highlight the importance of including NCREs to provide support to the Colombian electricity generation system, especially when hydraulic sources decrease their potential due to climatic phenomena, whose frequency and intensity hold great uncertainties.
In future research, it is proposed to analyze the potential for electricity generation of other by-products obtained from the coffee production process, such as mucilage, stems, and husks, and the economic feasibility of energy generation projects using these wastes. Limitation of the model associated with the variation of solar and wind sources, as well as the effect of the El Niño phenomenon on this type of energy, can be evaluated in future work. Other studies could include an estimation of carbon emissions savings and analyze the daily impact of including NCREs in the electricity production of other technologies and on electricity generation costs.

Author Contributions

Conceptualization, Y.M.-R. and D.F.M.-D.; data curation, Y.M.-R.; formal analysis, D.F.M.-D., J.C.O.-G. and H.R.-M.; methodology, Y.M.-R.; project administration, Y.M.-R., D.F.M.-D., J.C.O.-G. and H.R.-M.; software, Y.M.-R. and J.C.O.-G.; supervision, D.F.M.-D., J.C.O.-G. and H.R.-M.; validation, Y.M.-R., D.F.M.-D., J.C.O.-G. and H.R.-M.; visualization, Y.M.-R.; writing–original draft, Y.M.-R.; writing–review and editing, Y.M.-R., D.F.M.-D., J.C.O.-G. and H.R.-M. All authors have read and agreed to the published version of the manuscript.

Funding

This research received no external funding.

Institutional Review Board Statement

Not applicable.

Informed Consent Statement

Not applicable.

Data Availability Statement

Not applicable.

Conflicts of Interest

The authors declare no conflict of interest.

References

  1. Hürlimann, C. Valuation of Renewable Energy Investments Practices among German and Swiss Investment Professionals; Springer Gabler: Berlin, Germany, 2019; pp. 1–458. [Google Scholar]
  2. Xm. Reporte Integral de Sostenibilidad, Operación y Mercado 2020. Available online: https://informeanual.xm.com.co/2020/informe/pages/xm/24-capacidad-efectiva-neta.html (accessed on 30 January 2022).
  3. International Energy Agency (IEA) Colombia. Available online: https://www.iea.org/countries/colombia (accessed on 28 November 2021).
  4. Gaona, E.E.; Trujillo, C.L.; Guacaneme, J.A. Rural Microgrids and Its Potential Application in Colombia. Renew. Sustain. Energy Rev. 2015, 51, 125–137. [Google Scholar] [CrossRef]
  5. Gonzalez-Salazar, M.; Poganietz, W.R. Evaluating the Complementarity of Solar, Wind and Hydropower to Mitigate the Impact of El Niño Southern Oscillation in Latin America. Renew. Energy 2021, 174, 453–467. [Google Scholar] [CrossRef]
  6. Jaramillo-Robledo, Á.; Arcila-Pulgarín, J. Variabilidad Climática En La Zona Cafetera Colombiana Asociada Al Evento de El Niño y Su Efecto En La Caficultura. Av. Técnicos Cenicafé 2009, 390, 1–8.
  7. Gómez-Navarro, T.; Ribó-Pérez, D. Assessing the Obstacles to the Participation of Renewable Energy Sources in the Electricity Market of Colombia. Renew. Sustain. Energy Rev. 2018, 90, 131–141. [Google Scholar] [CrossRef]
  8. Arango, S.; Larsen, E.R. The Environmental Paradox in Generation: How South America Is Gradually Becoming More Dependent on Thermal Generation. Renew. Sustain. Energy Rev. 2010, 14, 2956–2965. [Google Scholar] [CrossRef]
  9. Henao, F.; Viteri, J.P.; Rodríguez, Y.; Gómez, J.; Dyner, I. Annual and Interannual Complementarities of Renewable Energy Sources in Colombia. Renew. Sustain. Energy Rev. 2020, 134, 110318. [Google Scholar] [CrossRef]
  10. Perez, A.; Garcia-Rendon, J.J. Integration of Non-Conventional Renewable Energy and Spot Price of Electricity: A Counterfactual Analysis for Colombia. Renew. Energy 2021, 167, 146–161. [Google Scholar] [CrossRef]
  11. Martínez-Ruiz, Y.; Manotas-Duque, D.F.; Ramírez-Malule, H. Evaluation of Investment Projects in Photovoltaic Solar Energy Using the DNPV Methodology. Int. J. Energy Econ. Policy 2021, 11, 180–185. [Google Scholar] [CrossRef]
  12. Caicedo, C. Colombia’s Prospects for Renewables. Available online: https://ihsmarkit.com/research-analysis/colombias-prospects-for-renewables.html (accessed on 5 December 2021).
  13. Departamento Nacional de Planeación Energy Supply Situation in Colombia. 2017. Available online: https://www.dnp.gov.co/Crecimiento-Verde/Documents/ejes-tematicos/Energia/MCV—EnergySupplySituationvf.pdf (accessed on 1 December 2021).
  14. Sistema de Información Eléctrico Colombiano (SIEL) Informe de Registro de Proyectos de Generación de Energía Eléctrica. Available online: http://www.siel.gov.co/Inicio/Generación/InscripcióndeproyectosdeGeneración/tabid/113/Default.aspx (accessed on 25 April 2021).
  15. Sagastume Gutiérrez, A.; Cabello Eras, J.J.; Hens, L.; Vandecasteele, C. The Energy Potential of Agriculture, Agroindustrial, Livestock, and Slaughterhouse Biomass Wastes through Direct Combustion and Anaerobic Digestion. The Case of Colombia. J. Clean. Prod. 2020, 269, 1–17. [Google Scholar] [CrossRef]
  16. Gonzalez-Salazar, M.A.; Morini, M.; Pinelli, M.; Spina, P.R.; Venturini, M.; Finkenrath, M.; Poganietz, W.R. Methodology for Biomass Energy Potential Estimation: Projections of Future Potential in Colombia. Renew. Energy 2014, 69, 488–505. [Google Scholar] [CrossRef] [Green Version]
  17. Montenegro Orozco, K.T.; Rojas Carpio, A.S.; Cabeza Rojas, I.; Hernández Pardo, M.A. Potencial de Biogás de Los Residuos Agroindustriales Generados En El Departamento de Cundinamarca. Rev. ION 2016, 29, 23–37. [Google Scholar] [CrossRef]
  18. Shilpi, S.; Lamb, D.; Bolan, N.; Seshadri, B.; Choppala, G.; Naidu, R. Waste to Watt: Anaerobic Digestion of Wastewater Irrigated Biomass for Energy and Fertiliser Production. J. Environ. Manag. 2019, 239, 73–83. [Google Scholar] [CrossRef]
  19. Carlini, M.; Monarca, D.; Castellucci, S.; Mennuni, A.; Casini, L.; Selli, S. Beer Spent Grains Biomass for Biogas Production: Characterization and Anaerobic Digestion-Oriented Pre-Treatments. Energy Rep. 2021, 7, 921–929. [Google Scholar] [CrossRef]
  20. Gallego Fernández, L.M.; Portillo Estévez, E.; Navarrete, B.; González Falcón, R. Estimation of Methane Production through the Anaerobic Digestion of Greenhouse Horticultural Waste: A Real Case Study for the Almeria Region. Sci. Total Environ. 2021, 807, 151012. [Google Scholar] [CrossRef] [PubMed]
  21. Claudio, C.C.; Perazzini, M.T.B.; Perazzini, H. Modeling and Estimation of Moisture Transport Properties of Drying of Potential Amazon Biomass for Renewable Energy: Application of the Two-Compartment Approach and Diffusive Models with Constant or Moisture-Dependent Coefficient. Renew. Energy 2022, 181, 304–316. [Google Scholar] [CrossRef]
  22. Poomsawat, S.; Poomsawat, W. Analysis of Hydrochar Fuel Characterization and Combustion Behavior Derived from Aquatic Biomass via Hydrothermal Carbonization Process. Case Stud. Therm. Eng. 2021, 27, 101255. [Google Scholar] [CrossRef]
  23. Glushkov, D.O.; Nyashina, G.S.; Anand, R.; Strizhak, P.A. Composition of Gas Produced from the Direct Combustion and Pyrolysis of Biomass. Process Saf. Environ. Prot. 2021, 156, 43–56. [Google Scholar] [CrossRef]
  24. Abdel Daiem, M.M.; Said, N. Energetic, Economic, and Environmental Perspectives of Power Generation from Residual Biomass in Saudi Arabia. Alex. Eng. J. 2021, 61, 3351–3364. [Google Scholar] [CrossRef]
  25. Ramos-Hernández, R.; Sánchez-Ramírez, C.; Mota-López, D.R.; Sandoval-Salas, F.; García-Alcaraz, J.L. Evaluation of Bioenergy Potential from Coffee Pulp Trough System Dynamics. Renew. Energy 2021, 165, 863–877. [Google Scholar] [CrossRef]
  26. Federación Nacional de Cafeteros de Colombia Producción de Café de Colombia Aumenta 30% En Marzo. Available online: https://federaciondecafeteros.org/wp/listado-noticias/produccion-de-cafe-de-colombia-aumenta-30-en-marzo/ (accessed on 25 November 2021).
  27. Salazar-Gallego, F.A. Café de Colombia, Análisis de Los Principales Productores de Café Del Mundo. Bachelor’s Thesis, Universidad Pontificia Bolivariana, Salazar Gallego, FA, USA, 2021. [Google Scholar]
  28. Federación Nacional de Cafeteros de Colombia Estadísticas Cafeteras—Precios, Áreas y Producción Del Café. Available online: https://federaciondecafeteros.org/wp/estadisticas-cafeteras/ (accessed on 8 March 2021).
  29. Federación Nacional de Cafeteros de Colombia Producción de Café de Colombia En 2020 Fue de 13,9 Millones de Sacos. Available online: https://federaciondecafeteros.org/wp/listado-noticias/produccion-de-cafe-de-colombia-en-2020-fue-de-139-millones-de-sacos/ (accessed on 25 November 2021).
  30. Rodríguez Valencia, N.; Zambrano Franco, D. Los Subproductos Del Café: Fuente de Energía Renovable. Av. Técnicos Cenicafé 2010, 393, 1–8. [Google Scholar]
  31. Mendoza Martinez, C.L.; Saari, J.; Melo, Y.; Cardoso, M.; de Almeida, G.M.; Vakkilainen, E. Evaluation of Thermochemical Routes for the Valorization of Solid Coffee Residues to Produce Biofuels: A Brazilian Case. Renew. Sustain. Energy Rev. 2021, 137, 110585. [Google Scholar] [CrossRef]
  32. Duarte, A.; Uribe, J.C.; Sarache, W.; Calderón, A. Economic, Environmental, and Social Assessment of Bioethanol Production Using Multiple Coffee Crop Residues. Energy 2021, 216, 119170. [Google Scholar] [CrossRef]
  33. Cubero-Abarca, R.; Moya, R.; Valaret, J.; Filho, M.T. Use of Coffee (Coffea Arabica) Pulp for the Production of Briquettes and Pellets for Heat Generation. Cienc. e Agrotecnologia 2014, 38, 461–470. [Google Scholar] [CrossRef] [Green Version]
  34. Mendoza Martinez, C.L.; Alves Rocha, E.P.; Oliveira Carneiro, A.d.C.; Borges Gomes, F.J.; Ribas Batalha, L.A.; Vakkilainen, E.; Cardoso, M. Characterization of Residual Biomasses from the Coffee Production Chain and Assessment the Potential for Energy Purposes. Biomass Bioenergy 2019, 120, 68–76. [Google Scholar] [CrossRef]
  35. Nava-Valente, N.; Del Ángel-Coronel, O.A.; Atenodoro-Alonso, J.; López-Escobar, L.A. Effect of Thermal and Acid Pre-Treatment on Increasing Organic Loading Rate of Anaerobic Digestion of Coffee Pulp for Biogas Production. Biomass Convers. Biorefin. 2021. [Google Scholar] [CrossRef]
  36. Manasa, V.; Padmanabhan, A.; Anu Appaiah, K.A. Utilization of Coffee Pulp Waste for Rapid Recovery of Pectin and Polyphenols for Sustainable Material Recycle. Waste Manag. 2021, 120, 762–771. [Google Scholar] [CrossRef]
  37. Zinla, D.; Gbaha, P.; Koffi, P.M.E.; Koua, B.K. Characterization of Rice, Coffee and Cocoa Crops Residues as Fuel of Thermal Power Plant in Côte d’Ivoire. Fuel 2021, 283, 119250. [Google Scholar] [CrossRef]
  38. Garcia-Freites, S.; Welfle, A.; Lea-Langton, A.; Gilbert, P.; Thornley, P. The Potential of Coffee Stems Gasification to Provide Bioenergy for Coffee Farms: A Case Study in the Colombian Coffee Sector. Biomass Convers. Biorefin. 2020, 10, 1137–1152. [Google Scholar] [CrossRef] [Green Version]
  39. Rivera, J.A.; Ortega-Jimenez, C.H. Power Generation with Biomass from Coffee: A Literature Review, Current Trend and Scope for Future Research. MATEC Web Conf. 2019, 293, 05002. [Google Scholar] [CrossRef]
  40. Algarín, C.R.; Llanos, A.P.; Castro, A.O. An Analytic Hierarchy Process Based Approach for Evaluating Renewable Energy Sources. Int. J. Energy Econ. Policy 2017, 7, 38–47. [Google Scholar]
  41. Zhang, Y.; Zhao, X.; Ren, L.; Liang, J.; Liu, P. The Development of China’s Biomass Power Industry under Feed-in Tariff and Renewable Portfolio Standard: A System Dynamics Analysis. Energy 2017, 139, 947–961. [Google Scholar] [CrossRef]
  42. Remón, J.; Ravaglio-Pasquini, F.; Pedraza-Segura, L.; Arcelus-Arrillaga, P.; Suelves, I.; Pinilla, J.L. Caffeinating the Biofuels Market: Effect of the Processing Conditions during the Production of Biofuels and High-Value Chemicals by Hydrothermal Treatment of Residual Coffee Pulp. J. Clean. Prod. 2021, 302, 127008. [Google Scholar] [CrossRef]
  43. Torres-Valenzuela, L.S.; Serna-Jiménez, J.A.; Martínez, K. Coffee By-Products: Nowadays and Perspectives. In Coffee—Production and Research; BoD—Books on Demand: Norderstedt, Germany, 2020; pp. 1–18. Available online: https://www.intechopen.com/chapters/69900 (accessed on 2 December 2021).
  44. Pereira, L.L.; Guarçoni, R.C.; Pinheiro, P.F.; Osório, V.M.; Pinheiro, C.A.; Moreira, T.R.; ten Caten, C.S. New Propositions about Coffee Wet Processing: Chemical and Sensory Perspectives. Food Chem. 2020, 310, 125943. [Google Scholar] [CrossRef] [PubMed]
  45. Zhang, S.J.; De Bruyn, F.; Pothakos, V.; Contreras, G.F.; Cai, Z.; Moccand, C.; Weckx, S.; De Vuyst, L. Influence of Various Processing Parameters on the Microbial Community Dynamics, Metabolomic Profiles, and Cup Quality During Wet Coffee Processing. Front. Microbiol. 2019, 10, 1–24. [Google Scholar] [CrossRef] [PubMed]
  46. Dos Santos, É.M.; de Macedo, L.M.; Tundisi, L.L.; Ataide, J.A.; Camargo, G.A.; Alves, R.C.; Oliveira, M.B.P.P.; Mazzola, P.G. Coffee By-Products in Topical Formulations: A Review. Trends Food Sci. Technol. 2021, 111, 280–291. [Google Scholar] [CrossRef]
  47. Ancy Jenifer, A.; Vasanthy, M.; Thamarai selvi, C.; Ravindran, B.; Chung, W.J.; Chang, S.W. Treatment of Coffee Cherry Pulping Wastewater by Using Lectin Protein Isolated from Ricinus communis L. Seed. J. Water Process Eng. 2021, 39, 101742. [Google Scholar] [CrossRef]
  48. Klingel, T.; Kremer, J.I.; Gottstein, V.; Rajcic de Rezende, T.; Schwarz, S.; Lachenmeier, D.W. A Review of Coffee By-Products Including Leaf, Flower, Cherry, Husk, Silver Skin, and Spent Grounds as Novel Foods within the European Union. Foods 2020, 9, 665. [Google Scholar] [CrossRef]
  49. Yadira, P.S.B.; Sergio, S.T.; Fernando, S.E.L.; Sebastian, P.J.; Eapen, D. Bioethanol Production from Coffee Mucilage. Energy Procedia 2014, 57, 950–956. [Google Scholar] [CrossRef] [Green Version]
  50. García, C.A.; Peña, Á.; Betancourt, R.; Cardona, C.A. Energetic and Environmental Assessment of Thermochemical and Biochemical Ways for Producing Energy from Agricultural Solid Residues: Coffee Cut-Stems Case. J. Environ. Manag. 2018, 216, 160–168. [Google Scholar] [CrossRef]
  51. Chala, B.; Oechsner, H.; Latif, S.; Müller, J. Biogas Potential of Coffee Processing Waste in Ethiopia. Sustainability 2018, 10, 2678. [Google Scholar] [CrossRef] [Green Version]
  52. Dal-Bó, V.; Lira, T.; Arrieche, L.; Bacelos, M. Process Synthesis for Coffee Husks to Energy Using Hierarchical Approaches. Renew. Energy 2019, 142, 195–206. [Google Scholar] [CrossRef]
  53. Santos da Silveira, J.; Durand, N.; Lacour, S.; Belleville, M.P.; Perez, A.; Loiseau, G.; Dornier, M. Solid-State Fermentation as a Sustainable Method for Coffee Pulp Treatment and Production of an Extract Rich in Chlorogenic Acids. Food Bioprod. Process. 2019, 115, 175–184. [Google Scholar] [CrossRef]
  54. Prakash, I.; Shankar, S.R.; Sneha, H.P.; Kumar, P.; Om, H.; Basavaraj, K.; Murthy, P.S. Metabolomics and Volatile Fingerprint of Yeast Fermented Robusta Coffee: A Value Added Coffee. LWT 2022, 154, 112717. [Google Scholar] [CrossRef]
  55. Tayibi, S.; Monlau, F.; Bargaz, A.; Jimenez, R.; Barakat, A. Synergy of Anaerobic Digestion and Pyrolysis Processes for Sustainable Waste Management: A Critical Review and Future Perspectives. Renew. Sustain. Energy Rev. 2021, 152, 111603. [Google Scholar] [CrossRef]
  56. He, Z.W.; Yang, W.J.; Ren, Y.X.; Jin, H.Y.; Tang, C.C.; Liu, W.Z.; Yang, C.X.; Zhou, A.J.; Wang, A.J. Occurrence, Effect, and Fate of Residual Microplastics in Anaerobic Digestion of Waste Activated Sludge: A State-of-the-Art Review. Bioresour. Technol. 2021, 331, 125035. [Google Scholar] [CrossRef] [PubMed]
  57. Rojas-Sossa, J.P.; Murillo-Roos, M.; Uribe, L.; Uribe-Lorio, L.; Marsh, T.; Larsen, N.; Chen, R.; Miranda, A.; Solís, K.; Rodriguez, W.; et al. Effects of Coffee Processing Residues on Anaerobic Microorganisms and Corresponding Digestion Performance. Bioresour. Technol. 2017, 245, 714–723. [Google Scholar] [CrossRef] [PubMed]
  58. Widjaja, T.; Iswanto, T.; Altway, A.; Shovitri, M.; Juliastuti, S.R. Methane Production from Coffee Pulp by Microorganism of Rumen Fluid and Cow Dung in Co-Digestion. Chem. Eng. Trans. 2017, 56, 1465–1470. [Google Scholar] [CrossRef]
  59. Corro, G.; Pal, U.; Bañuelos, F.; Rosas, M. Generation of Biogas from Coffee-Pulp and Cow-Dung Co-Digestion: Infrared Studies of Postcombustion Emissions. Energy Convers. Manag. 2013, 74, 471–481. [Google Scholar] [CrossRef]
  60. Sumardiono, S.; Jos, B.; Dewanti, A.A.E.; Mahendra, I.; Cahyono, H. Biogas Production from Coffee Pulp and Chicken Feathers Using Liquid-and Solid-State Anaerobic Digestions. Energies 2021, 14, 4664. [Google Scholar] [CrossRef]
  61. Achinas, S.; Achinas, V.; Euverink, G.J.W. A Technological Overview of Biogas Production from Biowaste. Engineering 2017, 3, 299–307. [Google Scholar] [CrossRef]
  62. Mayer, F.; Bhandari, R.; Gäth, S. Critical Review on Life Cycle Assessment of Conventional and Innovative Waste-to-Energy Technologies. Sci. Total Environ. 2019, 672, 708–721. [Google Scholar] [CrossRef]
  63. Poblete, I.B.S.; Araujo, O.d.Q.F.; de Medeiros, J.L. Dynamic Analysis of Sustainable Biogas-Combined-Cycle Plant: Time-Varying Demand and Bioenergy with Carbon Capture and Storage. Renew. Sustain. Energy Rev. 2020, 131, 109997. [Google Scholar] [CrossRef]
  64. Liu, T.; McConkey, B.; Huffman, T.; Smith, S.; MacGregor, B.; Yemshanov, D.; Kulshreshtha, S. Potential and Impacts of Renewable Energy Production from Agricultural Biomass in Canada. Appl. Energy 2014, 130, 222–229. [Google Scholar] [CrossRef]
  65. Borges, C.P.; Sobczak, J.C.; Silberg, T.R.; Uriona-Maldonado, M.; Vaz, C.R. A Systems Modeling Approach to Estimate Biogas Potential from Biomass Sources in Brazil. Renew. Sustain. Energy Rev. 2021, 138, 110518. [Google Scholar] [CrossRef]
  66. Pham, Y.; Reardon-Smith, K.; Deo, R.C. Evaluating Management Strategies for Sustainable Crop Production under Changing Climate Conditions: A System Dynamics Approach. J. Environ. Manag. 2021, 292, 112790. [Google Scholar] [CrossRef] [PubMed]
  67. Ramírez Flórez, G.; Correa, L.F.G.; Urrea, N.T.; Gómez, J.C.O. Simulación Dinámica de Una Alternativa de Generación de Energía a Partir de Residuos. Mutis 2017, 7, 67–77. [Google Scholar] [CrossRef] [Green Version]
  68. Oviedo-Ocaña, E.R.; Dominguez, I.; Torres-Lozada, P.; Marmolejo-Rebellón, L.F.; Komilis, D.; Sanchez, A. A Qualitative Model to Evaluate Biowaste Composting Management Systems Using Causal Diagrams: A Case Study in Colombia. J. Clean. Prod. 2016, 133, 201–211. [Google Scholar] [CrossRef]
  69. Zahraee, S.M.; Golroudbary, S.R.; Shiwakoti, N.; Kraslawski, A.; Stasinopoulos, P. An Investigation of the Environmental Sustainability of Palm Biomass Supply Chains via Dynamic Simulation Modeling: A Case of Malaysia. J. Clean. Prod. 2019, 237, 117740. [Google Scholar] [CrossRef]
  70. Dasgupta, T. Energy Modeling of Urban Municipal Solid Waste Management System to the City of Lake, Bhopal. Int. J. Sci. Eng. Technol. 2014, 3, 1031–1035. [Google Scholar]
  71. Arias-Gaviria, J.; Carvajal-Quintero, S.X.; Arango-Aramburo, S. Understanding Dynamics and Policy for Renewable Energy Diffusion in Colombia. Renew. Energy 2019, 139, 1111–1119. [Google Scholar] [CrossRef]
  72. Sani, K.; Siallagan, M.; Putro, U.S.; Mangkusubroto, K. Indonesia Energy Mix Modelling Using System Dynamics. Int. J. Sustain. Energy Plan. Manag. 2018, 18, 29–52. [Google Scholar] [CrossRef]
  73. Hsiao, C.T.; Liu, C.S.; Chang, D.S.; Chen, C.C. Dynamic Modeling of the Policy Effect and Development of Electric Power Systems: A Case in Taiwan. Energy Policy 2018, 122, 377–387. [Google Scholar] [CrossRef]
  74. Flynn, H.; Breger, D.; Belden, A.; Bier, A.; Laurent, C.; Andrews, N.; Rickerson, W. System Dynamics Modeling of the Massachusetts SREC Market. Sustainability 2010, 2, 2746–2761. [Google Scholar] [CrossRef] [Green Version]
  75. Zapata, S.; Castaneda, M.; Aristizabal, A.J.; Dyner, I. Renewables for Supporting Supply Adequacy in Colombia. Energy 2022, 239, 122157. [Google Scholar] [CrossRef]
  76. Henao, F.; Dyner, I. Renewables in the Optimal Expansion of Colombian Power Considering the Hidroituango Crisis. Renew. Energy 2020, 158, 612–627. [Google Scholar] [CrossRef]
  77. De Jong, P.; Sánchez, A.S.; Esquerre, K.; Kalid, R.A.; Torres, E.A. Solar and Wind Energy Production in Relation to the Electricity Load Curve and Hydroelectricity in the Northeast Region of Brazil. Renew. Sustain. Energy Rev. 2013, 23, 526–535. [Google Scholar] [CrossRef]
  78. Viviescas, C.; Lima, L.; Diuana, F.A.; Vasquez, E.; Ludovique, C.; Silva, G.N.; Huback, V.; Magalar, L.; Szklo, A.; Lucena, A.F.P.; et al. Contribution of Variable Renewable Energy to Increase Energy Security in Latin America: Complementarity and Climate Change Impacts on Wind and Solar Resources. Renew. Sustain. Energy Rev. 2019, 113, 109232. [Google Scholar] [CrossRef]
  79. Federación Nacional de Cafeteros de Colombia Estadísticas Cafeteras—Exportaciones de Café Colombiano. Available online: https://federaciondecafeteros.org/wp/exportacion/ (accessed on 30 November 2021).
  80. Xm. Históricos de Demanda. Available online: https://www.xm.com.co/consumo/historicos-de-demanda (accessed on 27 April 2022).
  81. Xm. Indicadores. Available online: https://www.xm.com.co/portal-de-indicadores (accessed on 27 April 2022).
  82. Chludziński, D.; Duda, M. Technological Solutions Applied in Biogas Plants—A Case Study. E3S Web Conf. 2018, 49, 00012. [Google Scholar] [CrossRef]
  83. Barragán-Escandón, A.; Olmedo Ruiz, J.M.; Curillo Tigre, J.D.; Zalamea-León, E.F. Assessment of Power Generation Using Biogas from Landfills in an Equatorial Tropical Context. Sustainability 2020, 12, 2669. [Google Scholar] [CrossRef] [Green Version]
  84. National Renewable Energy Laboratory (NREL) Utility-Scale Energy Technology Capacity Factors. Available online: https://www.nrel.gov/analysis/tech-cap-factor.html (accessed on 27 April 2022).
  85. Samah, E. Measuring Small-Scale Biogas Capacity and Production; International Renewable Energy Agency (IRENA): Abu Dhabi, United Arab Emirates, 2016. [Google Scholar]
  86. Thomsen, S.T.; Spliid, H.; Østergård, H. Statistical Prediction of Biomethane Potentials Based on the Composition of Lignocellulosic Biomass. Bioresour. Technol. 2014, 154, 80–86. [Google Scholar] [CrossRef]
  87. Unidad de Planeación Minero Energética (UPME) Proyección de Demanda de Energía Eléctrica y Gas Natural 2021–2035. Available online: https://www1.upme.gov.co/DemandayEficiencia/Paginas/Proyecciones-de-demanda.aspx (accessed on 27 April 2022).
  88. Box, G.E.; Jenkins, G.M.; Reinsel, G.C.; Ljung, G.M. Time Series Analysis: Forecasting and Control, 5th ed.; John Wiley & Sons, Inc.: Hoboken, NJ, USA, 2015. [Google Scholar]
  89. International Research Institute (IRI) IRI ENSO Forecast. Available online: https://iri.columbia.edu/our-expertise/climate/forecasts/enso/current/ (accessed on 30 July 2021).
  90. Unidad Nacional para la Gestión del Riesgo de Desastres (UNGRD). Fenómeno El Niño; Unidad Nacional para la Gestión del Riesgo de Desastres (UNGRD): Bogotá, Colombia, 2016. [Google Scholar]
  91. Climate Predictor Center Cold & Warm Episodes by Season. Available online: https://origin.cpc.ncep.noaa.gov/products/analysis_monitoring/ensostuff/ONI_v5.php (accessed on 30 June 2021).
  92. Ramírez-Builes, V.H.; Jaramillo-Robledo, Á. Relación Entre El Índice Oceánico de El Niño y La Lluvia, En La Región Andina Central de Colombia. Cenicafé 2009, 60, 161–172. [Google Scholar]
  93. Cáceres-Martínez, L.E. Technical Evaluation of Available Residual Biomass in Colombia for Its Thermochemical Conversion in Fluidized Bed Reactors; Universidad Nacional de Colombia: Bogotá, Colombia, 2018. [Google Scholar]
  94. Pupo-Roncallo, O.; Campillo, J.; Ingham, D.; Hughes, K.; Pourkashanian, M. Large Scale Integration of Renewable Energy Sources (RES) in the Future Colombian Energy System. Energy 2019, 186, 115805. [Google Scholar] [CrossRef]
Figure 1. Causal loop diagram of energy potential from coffee pulp in a hydrothermal power market in Colombia.
Sustainability 14 05884 g001
Figure 2. Historical energy demand.
Sustainability 14 05884 g002
Figure 3. Forrester diagram of energy potential from coffee pulp in a hydrothermal power market in Colombia.
Sustainability 14 05884 g003
Figure 4. Autocorrelation function for residuals of the ARIMA (1, 1, 0) model.
Sustainability 14 05884 g004
Figure 5. (a) Biomethane production with coffee pulp; (b) Energy generation from coffee pulp and biomass.
Sustainability 14 05884 g005
Figure 6. Energy generation with NCREs.
Sustainability 14 05884 g006
Figure 7. Behavior of hydropower electricity potential and El Niño occurrences.
Sustainability 14 05884 g007
Figure 8. Supply of energy demand without solar and wind sources.
Sustainability 14 05884 g008
Figure 9. Energy generation and energy demand.
Sustainability 14 05884 g009
Table 1. Distribution of Installed Capacity of Energy Plants in Colombia in 2020.
TechnologyInstalled Capacity (GW)Share (%)
Hydraulic11.9468.3%
Wind0.021.3%
Solar0.06
Biomass0.14
Thermal5.3230.4%
Total17.48
Table 2. Main equations and indicators of the SD model according to the syntax of the Vensim DSS®® software. Subindex i represents energy sources, where i = coffee   pulp ,   NCRE ,   hydro ,   thermal } .
VariableUnitsEquation
Coffee Pulp InventoryTons/MonthINTEG (Pulped-Coffee pulp energy pn-Other uses)
Biomethane Production m 3 CH 4 /Month“Biochemical Methane Potential (BMP)” *Coffee pulp energy pn
Coffee Pulp Power GenerationGWh/MonthBiomethane for energy production* “Low Heating Value (LHV CH4)”*cf biomass *Energy generation efficiency
Hydropower Electricity PotentialGWh/MonthInstalled capacity Hydro*Hours per month*cf hydro*(1 − (“The El Niño phenomenon” *Niño effect on hydroelectric power))
Hydropower electricity ProductionGWh/MonthIF THEN ELSE (Energy demand>Hydropower electricity potential, Hydropower electricity potential, Energy demand)
Solar Electricity ProductionGWh/MonthInstalled capacity Solar*Hours per month* cf solar
Wind Electricity ProductionGWh/MonthInstalled capacity Wind*Hours per month* cf wind
IndicatorUnitsEquation
i Energy Share%Electricity production of i /Projected energy demand
Table 3. Behavior of indicators during El Niño events.
Time (Month)Month-YearIntensity of El NiñoCoffee
Pulp Share
NCREs ShareHydro ShareThermal Share
33Sep-23Moderate0.22%20.00%76.71%3.30%
34Oct-23Moderate0.20%19.46%74.71%5.83%
35Nov-23Moderate0.17%19.76%73.52%6.72%
36Dec-23Moderate0.15%19.44%69.12%11.44%
37Jan-24Moderate0.20%21.37%74.64%3.99%
38Feb-24Moderate0.24%24.21%75.79%0.00%
39Mar-24Moderate0.27%23.98%76.02%0.00%
85Jan-28Strong0.22%24.40%73.99%1.61%
86Feb-28Strong0.26%24.97%75.03%0.00%
87Mar-28Strong0.20%23.74%72.02%4.25%
88Apr-28Strong0.20%24.63%74.75%0.62%
89May-28Strong0.20%23.77%69.86%6.37%
90Jun-28Strong0.16%24.22%71.33%4.45%
91Jul-28Strong0.13%23.64%69.71%6.65%
92Aug-28Strong0.14%23.23%68.46%8.31%
93Sep-28Strong0.16%23.71%64.49%11.80%
94Oct-28Strong0.20%23.11%62.71%14.18%
95Nov-28Strong0.20%23.45%52.42%24.13%
96Dec-28Strong0.18%23.11%51.69%25.20%
97Jan-29Strong0.16%23.54%52.73%23.73%
98Feb-29Strong0.21%24.55%66.66%8.79%
99Mar-29Strong0.23%23.25%68.18%8.57%
Publisher’s Note: MDPI stays neutral with regard to jurisdictional claims in published maps and institutional affiliations.

