Article

Money, a Drain of Educational Opportunity: A Microregional Study of School Dropouts in Mpigi, Uganda

1
College of RC Conversions, Yonsei University, Wonju-si 26493, Korea
2
Department of Social Welfare, Sangji University, Wonju-si 26339, Korea
*
Author to whom correspondence should be addressed.
Sustainability 2022, 14(10), 5875; https://doi.org/10.3390/su14105875
Submission received: 3 March 2022 / Revised: 16 April 2022 / Accepted: 26 April 2022 / Published: 12 May 2022
(This article belongs to the Section Sustainable Education and Approaches)

Abstract

:
This paper sheds light on the causes of school dropouts, a major challenge facing UPE attainment in public primary schools of Uganda. We offer microregional analysis of school dropout patterns in the Mpigi district, and show a number of distinct patterns of school dropouts in Mpigi that can be differentiated from studies based on national data. While the Universal Primary Education program covered tuition fees, additional costs for education, such as meals, school transport, and uniforms, function as hurdles for longer school years. This is an obstacle regardless of parental awareness about education’s importance and how wealthy the parents think they are. Such findings directly conflict with existing knowledge that higher household income results in longer school years. The previous understanding of girl dropouts in Sub-Saharan Africa and its patriarchal context offer little explanations on the dropout pattern of Mpigi, as it is more related to the economic cost of education and the high demand for male agricultural labor. For a multicultural society such as Uganda, we highlight the importance of microlevel regional study in educational research.

1. Introduction: Universal Primary Education

Universal education refers to universally available educational opportunities to all human beings regardless of their economic, social, and cultural conditions. Universal education is guaranteed by Article 25 of the 1948 United Nations Universal Declaration of Human Rights that states, “Everyone has the right to education… Education shall be free, at least in the elementary and fundamental stages” [1].
Universal primary education (UPE) was first implemented in 1976 in Nigeria and proliferated in Sub-Saharan Africa in the 1990s to increase the rate of primary education attainment by providing free universal education [2]. There were positive socioeconomic and political effects of primary education in the least developed countries (LDCs). Education contributes to economic growth at both the national and household levels by improving labor productivity, facilitating the introduction of new technologies and rational resource allocation, and broadening the choice of available jobs in the labor market [3,4,5,6,7]. Primary education leads to positive social and health effects. The average years of primary schooling is related to an increase in life expectancy in 193 countries [8], an increase in the gender equality index [9], and an increase in the vaccination rate of infants and young children and the adherence to guidelines on preventing infectious diseases [10,11]. Education contributes to a reduction in infant mortality rate through public awareness about HIV/AIDS [12]. Furthermore, universal education contributes to the quality of politics, as it increases people’s trust in the democratic political system [12] by facilitating the acquisition of political information and the spread of democratic political culture [13]. Indeed, Ref. [14] reported that primary-education completers are 2.5 times more likely to support democracy than those without any formal schooling in 18 Sub-Saharan African countries.
Despite the increase in public spending on improving the educational environment, previous studies reported that UPE implementation has been accompanied with high dropout rates since the early 2000s in Uganda. Studies analyzed and identified challenges to UPE at the continental and national levels [15,16,17,18]. However, community-specific causes of school dropouts remain largely unexplored. Sociocultural diversity in Sub-Saharan Africa requires microlevel regional study to reveal the community’s uniqueness. Filling the gaps of previous research, this study explores the trend of school dropouts in the Mpigi district, covering the three following aspects: (1) assessment of UPE in Uganda and Sub-Saharan Africa, (2) challenges in pursuing UPE, and (3) the current snapshot of Ugandan UPE and the microregional characteristics of dropouts in the Mpigi district. The study aims to shed light on the causes of school dropouts, a major challenge facing UPE attainment in the public primary schools of Mpigi district, Uganda.

2. UPE in Uganda

In Uganda, Y. Museveni came to power through a military coup in 1997 and proclaimed the Poverty Eradication Action Plan and the Education Strategic Investment Plan, both of which had UPE at their core. The rationale for introducing UPE was to compensate for the negligent educational policies of the two previous administrations led by Idi Amin (1971–1979) and Obote (1979–1985), which led to a continuous degradation of the education system.
The Museveni administration’s UPE program consisted of five key policies [19]: (1) the provision of free primary education for up to four children per household; (2) increased budgetary allocation for primary education to alleviate individual households’ school fee burden; (3) the provision of school facilities, including tuition, teachers’ salaries, and classroom construction by the government, and parents’ contribution towards other costs, such as meals, school transport, and uniforms; (4) the abolition of the Parent–Teacher Association fee, and (5) campaigns to promote girls’ education by local governments. To achieve these goals, the Ugandan government allocated UGX 5000 per student for grades 1–3, and UGX 8100 per student for grades 4–7 [20]. In 1990, the education budget was 15% of the overall government budget, subsequently raised to 31% in 1997, of which 65% was allocated for implementing UPE [21].

2.1. Achievements of UPE in Uganda

UPE’s introduction in Uganda resulted in three main achievements. First, there was a remarkable increase in the absolute number of primary schools, and the enrollment and attendance rates of students, as shown in Table 1. While the enrollment rate for girls and boys was 63.2% and 75.7%, respectively, in 1995, it soared to over 100% in 1997 after introduction of UPE. This rise in enrolment rate continued until recent years. Providing free education led to overenrollment (i.e., the number of enrolled children exceeded the number of primary school-eligible children) of students of preschool age (4 and 5 years old) and postprimary school entrance-age children entering primary schools. This achievement was supported by [16], which reported significant enhancement in school enrollment and attendance rates in Uganda after the launch of UPE. These high enrollment rates in Uganda are a greater achievement when compared to other countries that also introduced the UPE program [19].
Second, the program contributed to an increase in literacy rates, as shown in Table 2. The rural literacy rate among young adults (15–24 years) was 75.2% for males and 59% for females in 1992. In 2010, eight years after the introduction of UPE program, the literacy rate among rural youths increased to 88.6% for males and 83.1% for females. Urban literacy among males and females increased from 90.5% and 86.5% in 1991 to 94.7% and 93.9% in 2010, respectively. The annual change in literacy rate between 1991 and 2002 was higher than that between 2002 and 2010 in all cohorts due to the implementation of UPE.
Third, the introduction of UPE also contributed to a reduction in the age at first marriage in Uganda, as shown in Table 3. Before UPE’s launch in 1991, the age at first marriage was 19.4 years for women, showing a steady increase since then and reaching 20 years in 2005. Refs. [23,24] explained the trend on the basis of UPE’s implementation as follows. First, the age at first marriage increased as the length of schooling years extended; second, as education broadens one’s knowledge, the girls are made aware of the disadvantages of early marriage, leading them to refuse early marriage.

2.2. Student Dropouts in Uganda

The greatest problem facing the Ugandan UPE program is the high dropout rate. 
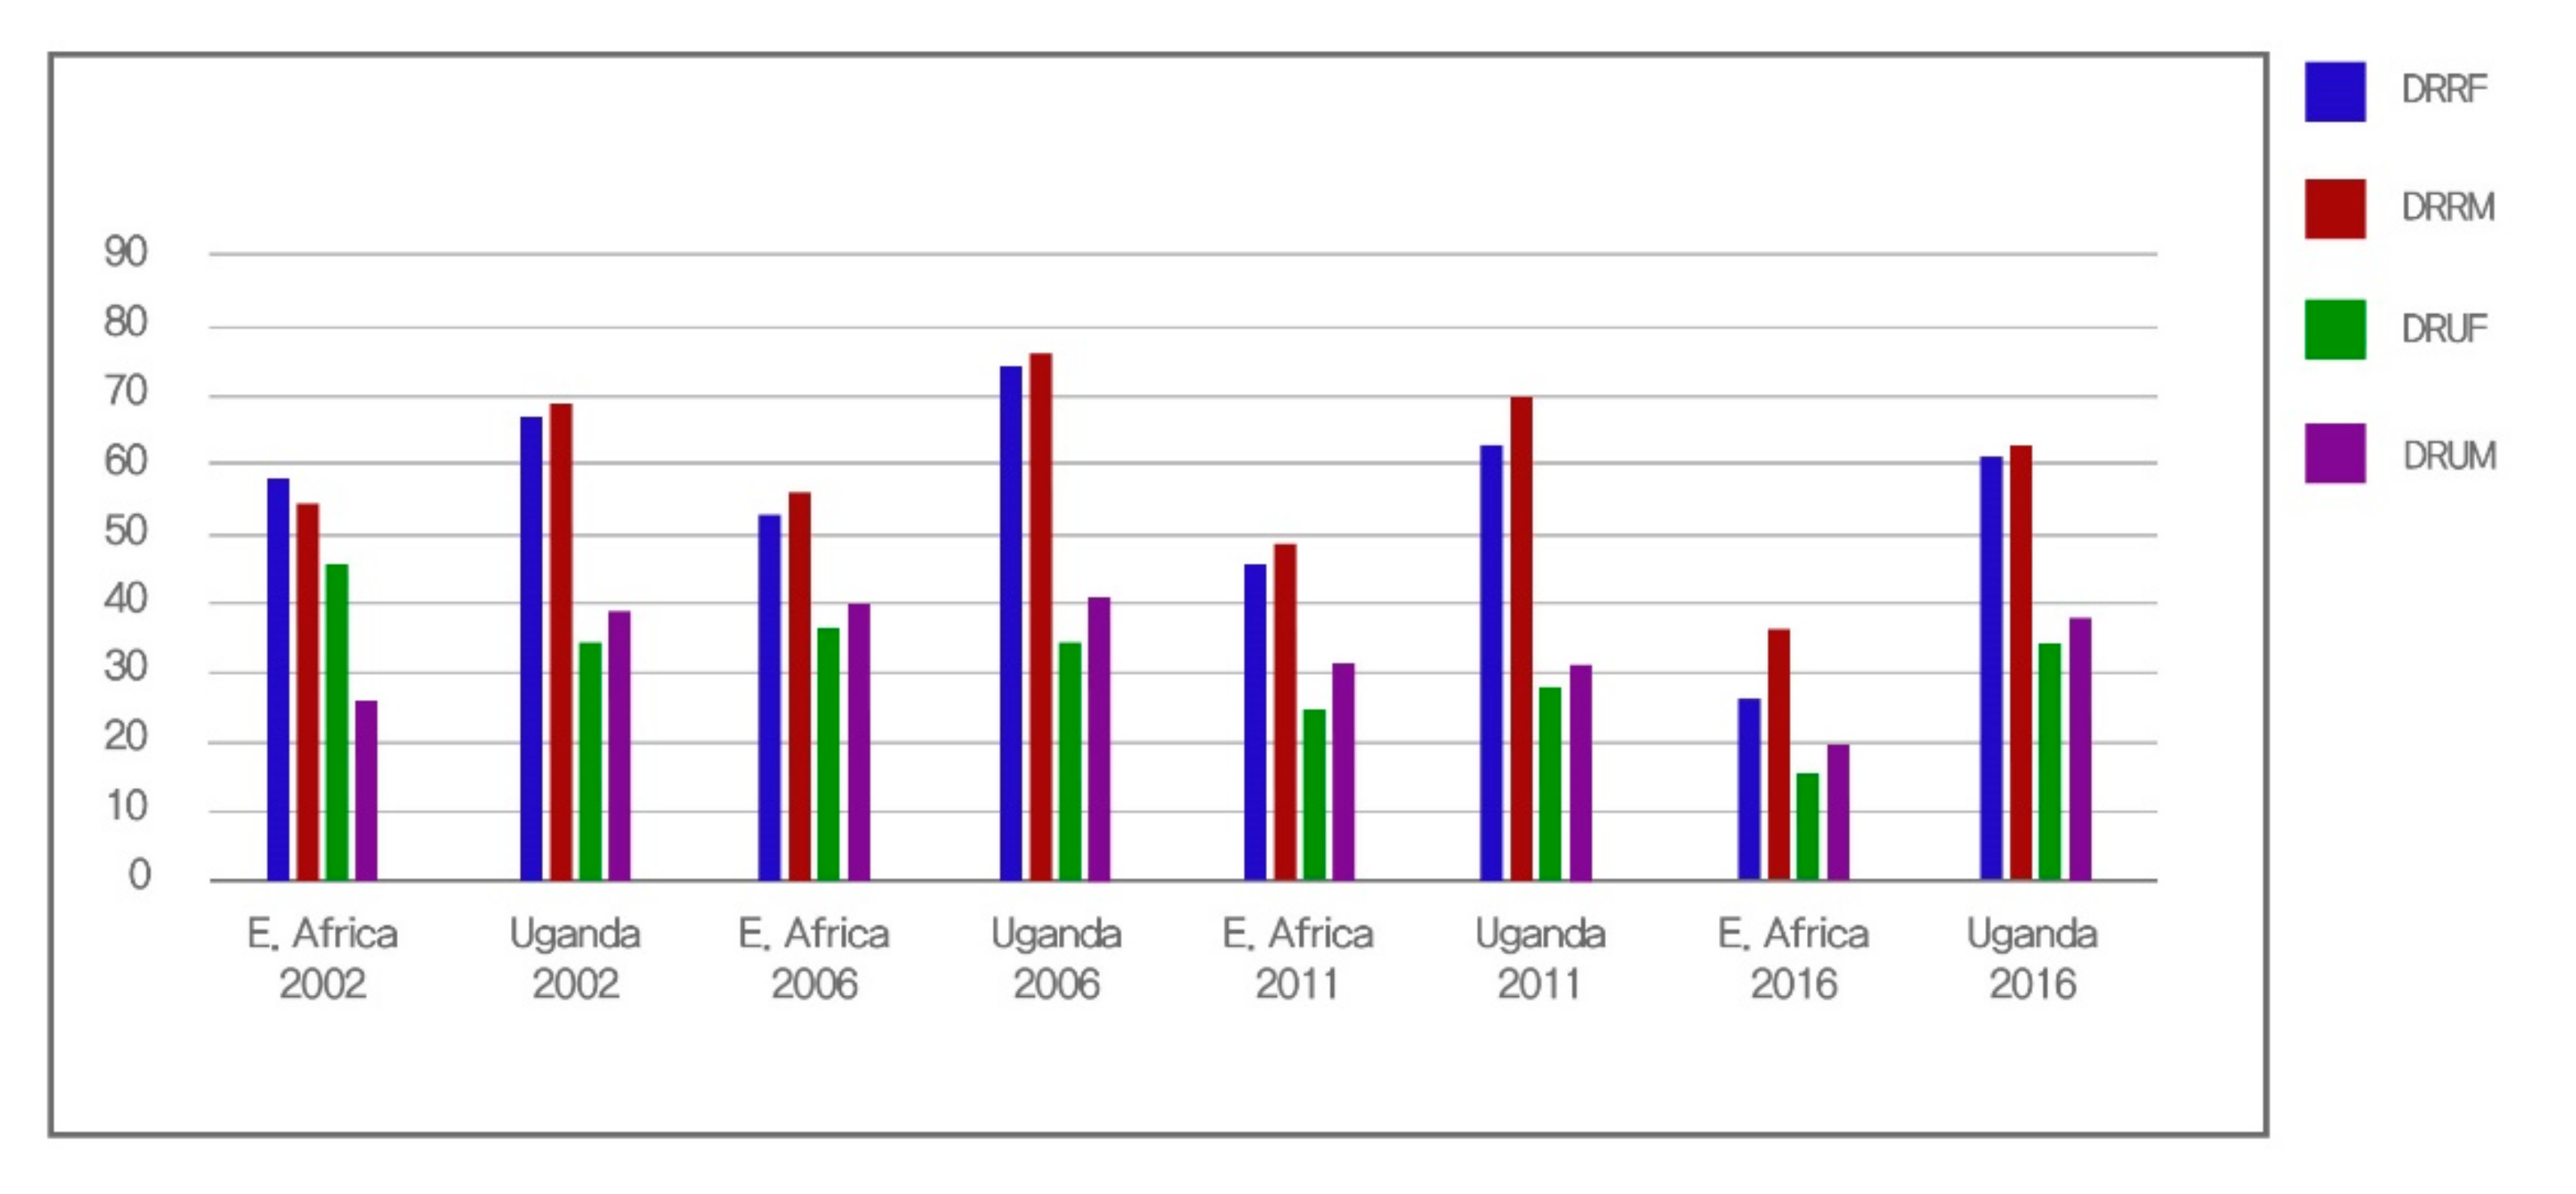
Figure 1 illustrates gender differences in primary-school dropout rates in Uganda and other countries in East Africa (Tanzania, Kenya, and Rwanda) that introduced the UPE program around the same time. The statistical trend of the Ugandan dropout rates shows a number of problems when compared with neighboring countries. First, the urban areas of Uganda had a 33% higher dropout rate than that of rural areas, twice as high as the urban–rural difference in neighboring countries (17%). Second, the trend has not shown any progress in dropout rates since 2002, thoughneighboring countries have recorded a rapid decrease. While the dropout rate of Ugandan students in rural areas decreased slightly and reached 62–63%, and that in the urban areas had stabilized at 35%, neighboring countries recorded a 26–37% dropout rate in rural areas and 16–20% in urban areas in 2016.
Then, what makes students drop out of schools despite the increase in the government’s education budget?

3. Reasons for School Dropouts Explored by Previous Studies

Despite the importance of universal education and its positive effects on the economy and society, LDCs including Uganda face several obstacles in implementing UPE. Previous studies highlighted a number of challenges including low household income, gender discrimination, family’s social status, and commuting time.

3.1. Low Household Income

Low household income is an obstacle to universal education across Africa, including Uganda, as it prevents poor households from investing in their children’s education. Education is given a lower priority than that of immediate life essentials such as food, housing, and healthcare [26,27,28]. When household income is low, parents engage in two to three auxiliary jobs in the agricultural or service sector and lack the time required to create a conducive environment for their children’s education, causing dropouts [29,30]. In this vein, Ref. [17] researched the relationship between household labor force and dropouts in Uganda. They found that the number of economically active family members had a higher influence on dropouts than other variables did, including the marital status of the head of the household, distance to school, parents’ educational qualifications, rural residence, and the number of family members. They interpreted that the variable of the number of economically active family members reflected Uganda’s high unemployment rate and low wages, which directly impact dropouts by burdening household income. Ref. [16] also reported that, while the UPE alleviated the disparities in income, sex, and parental education level for reverse inferring the causes of dropouts to some extent, they continued to affect students’ attendance rates to a large extent.

3.2. Educational Costs

In Uganda, the relative share of educational spending is also a cause of school dropouts. According to the Ugandan National Household Survey, spending on education was responsible for 67.6% of school dropouts for boys and 64.6% for girls in 2016. Although the UPE program covers tuition fees, schooling involves other expenditures, such as on uniforms, school supplies, transportation, and dormitories. Table 4 shows that educational costs have been a greater cause for dropouts since 1999. Another survey conducted by [15] supports the findings of the Ugandan National Household Survey, identifying school fees as a prominent cause of dropouts, with school meals and uniforms constituting additional expenditure.

3.3. Gender Discrimination

Gender discrimination embedded in societies of Sub-Saharan Africa is another major challenge in implementing UPE. The gender of the children shapes the family’s decision regarding investment in their education. The primary cause of the nonenrollment of girls under the age of six is housework [31,32,33]. While boys drop out of school around the age of 11 to engage in the agricultural and service sectors [34,35]. This preference in the investment of male children’s education in Sub-Saharan Africa stems from gender discrimination in the labor market, as the expected economic rewards from investing in female children’s education are less than that in a male child’s education [36,37].
Early marriage and childbearing also lead to the school nonenrollment and dropout of girls. While early marriage and childbearing rates for girls under 15 years are as high as 18% and 8%, respectively, in Sub-Saharan Africa, they are expected to engage only in household chores after marriage [38,39,40]. At the same time, the husband dominates the economic decisions of the household, which renders investment in girls’ education economically irrational for parents [30,41]. As the marriage of underage girls leads to additional household income through dowries [42], child marriage is considered to be a better investment for girls than their education [15]. Girls born to young mothers tend to have a shorter schooling period compared to other girls [43], which creates a vicious circle involving child marriage and fewer years of education. In Uganda, the sex of students continues to be a cause of dropouts, though the UPE has alleviated the disparities to some extent [16]. Ref. [44] who analyzed the factors affecting gender-dependent enrollment rate in Uganda, reported that boys’ attendance rate increased with age when the father was the head of the household, and reduced when the family resided in the central region. Girls’ attendance rate increased with age when the mother had a high educational qualification.

3.4. Religion

Some studies observed that religion affects the schooling years of girls. Protestantism positively affects the length of schooling for Ghanaian women and for children aged 10–14 years in the Democratic Republic of Congo [45,46], while Islam has a negative effect [45]. Uganda exhibited a mixed result of religion on the years of schooling. On the basis of a comparison between Uganda and Malawi, [47] argued that Catholicism had significant positive correlation with the length of schooling, whereas Islam had negative correlation in Malawi. However, refs. [44,48] did not observe any significant effect of religion on Ugandan children’s educational attainment.

3.5. Commute Time

Previous studies reported that commute time and school enrollment are inversely proportional in Sub-Saharan Africa because a long commute is directly related with issues such as transportation costs, road infrastructure, and safety [49]. Ref. [50] showed that, in LDCs, transportation cost and commute time to school were significantly correlated with the length of schooling, especially among female students. Ref. [17] reported that commute time accounted for 1.2% and 0.7% of dropout rates among Ugandan children aged 5–8 and 9–12 years, respectively. Ref. [18] also discussed long distances to school as a contributing factor.

3.6. Education Levels of Parents

Studies also highlighted other household characteristics, including parents’ educational level and the number of children, as factors affecting children’s educational level.
Ref. [51] argued that educating one generation brings about a perceptual change regarding education in the next generation, because education increases one’s ability to acquire information, including social networks and literacy for their households’ and children’s welfare. In other words, the low educational attainment of one generation affects the educational prospects of the next generation. Indeed, [52] found that the educational attainment of the head of the household determined a child’s dropout rates in South Africa, while [16] found that mothers’ educational level significantly affected their children’s schooling in lower grades (6–8 years). After controlling for economic status, age, and residence type. Ref. [53] argued that parents’ educational level significantly affected their children’s schooling in Uganda. Ref. [43] also reported that, in rural areas of Uganda, children whose parents were well-educated were less likely to drop out than those whose parents were not. Refs. [16,17] also identified the educational level of parents as a cause of dropouts, although the UPE has alleviated disparities. Ref. [54] analyzed determinants of primary-school attendance rates in Uganda and revealed that, for boys, the child’s age and mother’s educational level, and for girls, the child’s age and the educational level of both parents positively affected attendance rate.

3.7. Other Household Characteristics

The number of siblings determines the average length of schooling and affects the share of household budget for education per child. [25] analyzed the likelihood of school enrollment of children aged 6–14 years in Kenya, Tanzania, and Zambia, and argued that children without siblings had a significantly higher likelihood of school enrollment than those with two or more siblings. Ref. [55] analyzed the effect of sex on the attendance rate of private primary schools in Uganda. Analysis revealed that the number of children in the family had a negative effect, and family size had a weak positive effect on boys’ attendance rate, while the child’s age, father’s death, number of brothers, and family size had a weak positive effect on girls’ attendance rate. Ref. [17] identified the marital status of the head of the household, rural residence, and the number of family members as contributing factors for school dropouts in Uganda. Ref. [54] reported that having the caregiver as a guardian (e.g., foster family) negatively affected the attendance rate of students in Uganda regardless of the child’s gender. Further, residing in the northern region negatively affected girls’ attendance rates. Ref. [56] indicated the age of the child, child disability, and no biological parents in the household as negative factors that influence school dropouts. Table 5 summarizes the findings of studies that examined causes of school dropouts in Uganda.

4. Research Methods

4.1. Research Site

The Ugandan sociocultural topology is diverse, consisting of more than 7 kingdoms (Toro, Lango, Teso, Busoga, Bunyoro, Buganda, and Bukedi) and 54 tribes with at least 10 clans each. This leads to diverse cultural, historical, and social identities coexisting over and above the national identity within Ugandan boundaries, and mutual distinctions often precipitate competition and conflict. Diversity in ethnic communities leads to different attitudes toward life, social ideas, and norms, which Weber called “differences in daily life affairs” [57].
Mpigi is a region in Uganda with a population of 280,000, of which only 8.4% live in the county, and 91% live in the surrounding rural areas. Mpigi is the oldest of the 112 national administrative divisions formed after decentralization in the 1980s. It consists of 1 county and 16 subcounties, with each subcounty consisting of a parish and a village. Mpigi has some distinctive characteristics compared to other agricultural regions in Uganda. As it is located approximately 50 km from the capital city of Kampala, Mpigi’s people share economic, political, and cultural infrastructures of Kampala on a daily basis. The market zone formed around and within Kampala provides information and employment opportunities for Mpigi’s population. Mpigi, therefore, has an above-average educational environment compared to other rural districts in Uganda. As seen in Table 6, the teacher–pupil ratio and number of students per classroom are far lower than the national average. The literacy rate of the 10–17 years age group is higher and the nonenrollment rate of school-age children is lower than the national averages.
While all previous studies analyzing school dropouts in Uganda used national data, this study explored the dropout patterns of Mpigi, a region with both urban and rural characteristics.

4.2. Sample and Data

We randomly selected four schools and conducted a questionnaire survey for school children and their parents for eight days (12–20 July 2018). The schools were Mbute, St. Bruno, Bulamu, and Nsumba National Primary School located in the Mpigi district. A total of 830 parents participated in the survey, along with 2402 school-age children (6–20 years). Table 7 outlines the sociodemographic characteristics of the participants.

4.3. Variables and Analytical Methods

We separately set the actual dropout rates and parents’ expectations about the pupils’ educational years as the dependent variables to distinguish the effect of socioeconomic causes and parents’ feelings and preunderstanding of children’s education. We conducted separate regression analysis by gender, considering the age and marital status of the head of the household as control variables. Independent variables were self-perceived household economic status, religion, household head’s educational attainment, educational cost, commute time, and the household head’s perception of education. The first dependent variable, child dropout, was analyzed through binary logistic regression analysis; multiple regression analysis was performed to analyze the effect of parents’ educational expectation level as a continuous variable. Figure 2 shows the analytical model.
Table 8 presents the variables used in analysis. Parents’ educational expectations for their children were a continuous variable calculated through the number of schooling years from the first grade to university. Child dropout was a dummy variable (no = 0; yes = 1). Regarding perceived household economic status and the importance of education, we asked the respondents the following questions: “How do you judge your family’s economic status?” and “Do you consider your children’s education important?” Responses to both questions were measured using a Likert scale and treated as continuous variables. The major religions in Uganda, Catholicism, Protestantism, Islam, and no religion, were treated as dummy variables. Educational cost and school attendance were continuous variables, but we subjected educational cost to a natural logarithmic transformation to avoid distorting the analytical results and to observe the ratio-dependent change in the key relationship.

5. Results

We performed logistic regression analysis using dropout status and multiple regression analysis using the child’s expected number of years of schooling as the dependent variables, respectively. Variance inflation factor values did not exceed 2, rejecting the problem of multicollinearity. Analysis showed the following results.
As shown in Table 9, when using the child’s desired number of years of schooling as the dependent variable, the importance of children’s education (1.346, p < 0.001) had the strongest effect on girls’ length of schooling, followed by practicing Islam (−0.519, p < 0.001), educational cost (−0.272, p < 0.001), and parents’ age (−0.008, p < 0.05). For boys, awareness about the importance of children’s education (1.674, p < 0.001), practicing Islam (−0.448, p < 0.05), being divorced or widowed (−0.393, p < 0.05), and educational expenses (−0.179, p < 0.05) were the most important factors. The explanatory power was 9.7% for girls and 12.5% for boys.
Table 10 presents the results of the logistic regression analysis performed using the child dropout (dummy variable) as a dependent variable. Significant variables were educational cost (girls: 0.516, p < 0.001; boys: 0.415, p < 0.05) and parents’ age (girls: 0.03, p < 0.001; boys: 0.023, p < 0.05). The explanatory power was 8.2% for girls and 8.1% for boys.
We performed a t-test to analyze differences in the expected grade completion and dropouts between boys and girls. The expected grade completion by the mean number of years for boys and girls was 7.03 and 7.09 years, respectively; however, with a significance level of 0.400, the difference was not significant. When 1 was assigned to dropout, and 0 to no dropout, mean values for boys and girls were 0.11 and 0.09, respectively, with statistically significant difference (p < 0.05). The expected grade completion did not show sex-based difference; however, the dropout rate for boys was higher than that for girls.

6. Concluding Discussion

Our microregional analysis on school dropout patterns of Mpigi showed a number of distinct patterns from other studies based on the national data of Uganda and other Sub-Saharan African countries. This uniquely contributes to existing knowledge on school dropouts of Uganda in the following ways.
First, this paper casts a simple message to prolong schooling years in the case of Mpigi. Educational costs are the key cause of school dropouts. Despite the waiver of tuition fees after the launch of the UPE program, education still serves as an economic burden for families in Mpigi. Parents pay approximately USX 80,000 (USD 20) per year per child for additional items such as transportation, examination, lunch, school supplies, and school uniforms, and USX 600,000 (USD 150) as dormitory expenses. While previous studies highlighted the importance of social campaigns targeting an increase in parental awareness of the importance of education [58,59,60], our findings suggest that a further reduction in educational costs needs to be the focus of the UPE program to expand the level of basic education. In addition, the influence of educational costs over school dropout rates needs to be acknowledged and independently analyzed from the effect of household income. Previous studies argued that low household income is the main contributing factor to school dropouts, which means that higher household income would result in longer school years [16,17]. However, findings show that educational spending on its own acts as an obstacle in Mpigi regardless of how wealthy households think they are (self-perceived household economic status does not influence investment in education).
Second, the result shows a wide gap between parents’ expectations for their children’s education and actual school enrollment rates. This represents a significant hurdle for parents to provide an ideal level of education to children. Our analysis showed that parents in Mpigi have relatively high aspirations for their children’s education, meaning that they are keenly aware of the potential rewards of education (see Table 9). Parents’ understanding about the importance of children’s education also has a strong effect on expected grade completion, as shown in Table 9. Unfortunately, parental awareness about the importance of education in Mpigi does not lead to actual investment in their children’s education. In other words, parental understanding of educational importance does not overcome their actual economic obstacles.
Third, as discussed in the second point, the parental aspiration of children’s education in Mpigi is powerful. It incapacitates the impact of other reverse inferring variables addressed by previous studies [15,16,18,44,48,55]. While the patriarchal system in Sub-Saharan Africa is a sociocultural barrier undermining parents’ investment in girls’ education [16,44], such a pattern was not found in Mpigi. Rather, dropouts in Mpigi are more related to reality, educational costs, and demand for agricultural labor. Our study showed a higher dropout rate among boys than that among girls, especially in rural areas that require manual labor. A work of [61] on the cultural causes of boy school dropouts in rural Uganda provides a good explanation on this pattern of dropouts. Boys are socially and culturally expected to be a means to survive in families, which in turn impacts the retention rates of boys in the mainstream educational system. Given that Mpigi’s main agricultural products include food crops, such as cassava and maize, male agricultural labor is often mobilized during the labor-intensive season (sowing and harvesting) [62]. This implies an inevitable choice for families in rural Uganda on employing their children in agricultural labor despite their high aspirations for children’s education.
Fourth, this study highlights the importance of microlevel regional studies in educational research, especially for a multicultural society such as Uganda. The sociocultural topology of Uganda is diverse. Geographical distinctiveness created by its own tribal cultural and social characteristics hinders understanding a regional phenomenon from national data. Indeed, analysis shows that many contributing factors of school dropouts in Uganda identified by previous studies do not significantly impact school dropouts in Mpigi. Previous studies in Uganda used national datasets highlighting the educational levels of the household’s head [16,43,44,63], and commuting time [17]. As significant contributors to school dropouts in Uganda. Religion was also a contributing factor in other countries [45,46,47,48] (in 11 neighboring countries). Such factors do not affect dropout rates in Mpigi after controlling for socioeconomic variables, which means that Mpigi may have its own unique regional characteristics that cannot be identified using national data.

Author Contributions

Conceptualization, J.K. and M.J.; methodology, J.K.; software, J.K.; validation, J.K.; formal analysis, J.K.; investigation, J.K.; resources, J.K.; data curation, J.K.; writing—original draft preparation, J.K. and M.J.; writing—review and editing, M.J.; visualization, J.K; supervision, J.K.; project administration, M.J. All authors have read and agreed to the published version of the manuscript.

Funding

This research received no external funding.

Conflicts of Interest

The authors declare no conflict of interest.

References

  1. UN. Universal Declaration of Human Rights. 1948. Available online: https://www.un.org/en/universal-declaration-human-rights/ (accessed on 4 May 2022).
  2. Csapo, M. Universal Primary Education in Nigeria: Its Problems and Implications. Afr. Stud. Rev. 1983, 26, 91–106. [Google Scholar] [CrossRef]
  3. Benavot, A. Education, Gender, and Economic Development: A Cross-National Study. Sociol. Educ. 1989, 62, 14. [Google Scholar] [CrossRef]
  4. DFID. Education for All; DFID: London, UK, 2000. [Google Scholar]
  5. Mankiw, N.G.; Romer, D.; Weil, D.N. A Contribution to the Empirics of Economic Growth. Q. J. Econ. 1992, 107, 407–437. [Google Scholar] [CrossRef]
  6. Psacharopoulos, G.Z.; Woodhall, M. Education for Development: An Analysis of Investment Choices; Oxford University Press: London, UK, 1985. [Google Scholar]
  7. Vokes, R.; Mills, D. ‘Time for School’? School fees, savings clubs and social reciprocity in Uganda. J. East. Afr. Stud. 2015, 9, 326–342. [Google Scholar] [CrossRef]
  8. Bulled, N.L.; Sosis, R. Examining the relationship between life expectancy reproduction, and educational attainment A cross-country analysis. Hum. Nat. 2010, 21, 269–289. [Google Scholar] [CrossRef]
  9. Rumberger, R.W.; Thomas, S.L. The Distribution of Dropout and Turnover Rates among Urban and Suburban High Schools. Sociol. Educ. 2000, 73, 39–67. [Google Scholar] [CrossRef]
  10. Currie, J.; Moretti, E. Mother’s Education and the Intergenerational Transmission of Human Capital: Evidence from College Openings. Q. J. Econ. 2003, 118, 1495–1532. [Google Scholar] [CrossRef]
  11. Keats, A. Women’s schooling, fertility, and child health outcomes: Evidence from Uganda’s free primary education program. J. Dev. Econ. 2018, 135, 142–159. [Google Scholar] [CrossRef]
  12. UNESCO. Teaching and Learning: Achieving Quality for All; EFA Global Monitoring Report, 2013–2014. 2014. Available online: https://unesdoc.unesco.org/ark:/48223/pf0000225654 (accessed on 4 May 2022).
  13. Harber, C. Education, Democracy and Poverty Reduction in Africa. Comp. Educ. 2002, 38, 267–276. [Google Scholar] [CrossRef]
  14. Evans, G.; Rose, P. Understanding Education’s Influence on Support for Democracy in Sub-Saharan Africa. J. Dev. Stud. 2012, 48, 498–515. [Google Scholar] [CrossRef] [Green Version]
  15. Mpyangu, C.M.; Ochen, E.A.; Onyango, E.O.; Lubaale, Y.A.M. Out of School Children Study in Uganda. 2014. Available online: https://gcap.global/wp-content/uploads/2018/07/OUT_OF_SCHOOL_CHILDREN_STUDY_REPORT__FINAL_REPORT_2014.pdf (accessed on 4 May 2022).
  16. Deininger, K. Does cost of schooling affect enrollment by the poor? Universal primary education in Uganda. Econ. Educ. Rev. 2003, 22, 291–305. [Google Scholar] [CrossRef]
  17. Mike, I.O.; Nakajjo, A.; Isoke, D. Socioeconomic determinants of primary school dropout: The logistic model analysis. Afr. J. Econ. Rev. 2008, 4, 217–241. [Google Scholar]
  18. Nabugoomu, J. School Dropout in Rural Uganda: Stakeholder Perceptions on Contributing Factors and Solutions. Educ. J. 2019, 8, 185. [Google Scholar] [CrossRef] [Green Version]
  19. Ogawa, K.; Nishimura, M.; Chimombo, J.; Ghartey Ampiah, J. A comparative analysis of universal primary education policy in Ghana, Kenya, Malawi, and Uganda. J. Int. Coop. Educ. 2009, 12, 143–158. [Google Scholar]
  20. Uganda Ministry of Education and Sports. The Ugandan Experience of Universal Primary Education; Uganda Ministry of Education and Sports: Kampala, Uganda, 1999.
  21. MoES. Government of Uganda Mid-Term Review Final Report; Ministry of Health Knowledge Management Portal: Kampala, Uganda, 2003. [Google Scholar]
  22. UNESCO. Institute for Statistics. 2020. Available online: http://uis.unesco.org (accessed on 4 May 2022).
  23. Kalamar, A.M.; Lee-Rife, S.; Hindin, M.J. Interventions to Prevent Child Marriage among Young People in Low- and Middle-Income Countries: A Systematic Review of the Published and Gray Literature. J. Adolesc. Health 2016, 59, S16–S21. [Google Scholar] [CrossRef] [Green Version]
  24. Malhotra, A.; Warner, A.; McGonagle, A.; Lee-Rife, S.; Solutions to End Child Marriage: What the Evidence Shows. Interna-tional Center for Research on Women. 2011. Available online: http://www.icrw.org/wp-content/uploads/2016/10/Solutions-to-End-Child-Marriage.pdf (accessed on 4 May 2022).
  25. UN. Population Division: World Marriage Data. 2019. Available online: https://www.un.org/development/desa/pd/data/world-marriage-data (accessed on 4 May 2022).
  26. Colclough, C.; Lewin, K. Educating All the Children: Srategies for Primary Schooling in the South; Clarendon Press: Oxford, UK, 1993. [Google Scholar]
  27. Lloyd, C.B.; Blanc, A.K. Children’s Schooling in sub-Saharan Africa: The Role of Fathers, Mothers, and Others. Popul. Dev. Rev. 1996, 22, 265–298. [Google Scholar] [CrossRef]
  28. Schultz, T.P. Investments in the Schooling and Health of Women and Men: Quantities and Returns. J. Hum. Resour. 1993, 28, 694. [Google Scholar] [CrossRef]
  29. Blanden, J.; Gregg, P. Family Income and Educational Attainment: A review of approaches and evidence for Britain. Oxf. Rev. Econom. Pol. 2004, 20, 245–263. [Google Scholar] [CrossRef]
  30. Odaga, O.; Heneveld, W. Girls and Schools in Sub-Saharan African from Analysis to Action; World Bank: Washington, DC, USA, 1995. [Google Scholar]
  31. Brock, C.; Camish, N. Factors Affecting Female Participation in Education in Seven Developing Countries. Educational Research Paper No. 09. Department for International Development. 1997. Available online: https://assets.publishing.service.gov.uk/media/57a08da6e5274a31e000199c/paper09.pdf (accessed on 4 May 2022).
  32. Munene, I.I.; Ruto, S.J. The Right to Education for Children in Domestic Labour: Empirical Evidence from Kenya. Int. Rev. Educ. 2010, 56, 127–147. [Google Scholar] [CrossRef] [Green Version]
  33. Smock, A.C. Women’s Education in Developing Countries; Praeger Publisher: New York, NY, USA, 1981. [Google Scholar]
  34. Devereux, S. Making Less Last Longer’: Informal Safety Nets in Malawi; IDS Discussion Paper No 373; IDS: Brighton, UK, 1999. [Google Scholar]
  35. Kadzamira, E.; Rose, P. Can free primary education meet the needs of the poor?: Evidence from Malawi. Int. J. Educ. Dev. 2003, 23, 501–516. [Google Scholar] [CrossRef]
  36. Holmes, J. Measuring the determinants of school completion in Pakistan: Analysis of censoring and selection bias. Econ. Educ. Rev. 2003, 22, 249–264. [Google Scholar] [CrossRef] [Green Version]
  37. McMahon, W.W. Higher Learning, Greater Good: The Private and Social Benefits of Higher Education Baltimore; John Hopkins University Press: Baltimore, MD, USA, 2009. [Google Scholar]
  38. Dunne, M.; Humphreys, S.; Leach, F. Gender violence in schools in the developing world. Gend. Educ. 2006, 18, 75–98. [Google Scholar] [CrossRef]
  39. Glick, P.; Sahn, D.E. Schooling of girls and boys in a West African country: The effects of parental education, income, and household structure. Econ. Educ. Rev. 1999, 19, 63–87. [Google Scholar] [CrossRef]
  40. Waldfogel, J.; Washbrook, E. Low Income and Early Cognitive Development in the UK; Sutton Trust: London, UK, 2010. [Google Scholar]
  41. Boserup, E. Obstacles to advancement of women during development. In Investment in Women’s Human Capital; Schultz, T.P., Ed.; University of Chicago Press: Chicago, IL, USA, 1995. [Google Scholar]
  42. Kakuru, D.M. Gender Sensitive Educational Policy and Practice: A Uganda Case Study. Available online: http://doriskakuru.com/docs/publications/Kakuru%20D.%20M%20(2003)%20Gender%20sensitive%20educational%20policy%20and%20practice%20-%20A%20Uganda%20Case%20Study.pdf (accessed on 4 May 2022).
  43. Drajea, J.A.; O’Sullivan, C. Influence of parental education and family income on children’s education in rural Uganda. Glob. Educ. Rev. 2014, 1, 149–166. [Google Scholar]
  44. Nishimura, M.; Yamano, T.; Sasaoka, Y. Impacts of the universal primary education policy on educational attainment and private costs in rural Uganda. Int. J. Educ. Dev. 2008, 28, 161–175. [Google Scholar] [CrossRef]
  45. Takyi, B.K.; Addai, I. Religious Affiliation, Marital Processes and Women’s Educational Attainment in a Developing Society. Sociol. Relig. 2002, 63, 177–193. [Google Scholar] [CrossRef]
  46. Shapiro, D.; Tambashe, B.O. Gender, poverty, family structure, and investments in children’s education in Kinshasa, Congo. Econ. Educ. Rev. 2001, 20, 359–375. [Google Scholar] [CrossRef]
  47. Behrman, J.A. The effect of increased primary schooling on adult women’s HIV status in Malawi and Uganda: Universal Primary Education as a natural experiment. Soc. Sci. Med. 2015, 127, 108–115. [Google Scholar] [CrossRef] [Green Version]
  48. Izama, M.P. Muslim Education in Africa: Trends and Attitudes toward Faith-Based Schools. Rev. Faith Int. Aff. 2014, 12, 38–50. [Google Scholar] [CrossRef]
  49. Lavy, V. School supply constraints and children’s educational outcomes in rural Ghana. J. Dev. Econ. 1996, 51, 291–314. [Google Scholar] [CrossRef]
  50. Glick, P. What Policies will Reduce Gender Schooling Gaps in Developing Countries: Evidence and Interpretation. World Dev. 2008, 36, 1623–1646. [Google Scholar] [CrossRef]
  51. Leclercq, F. Education Guarantee Scheme and Primary Schooling in Madhya Pradesh. Econ. Pol. Week. 2003, 38, 1855–1869. [Google Scholar]
  52. Sibanda, A. Who drops out of school in South Africa? The influence of individual and household characteristics. Afr. Popul. Stud. 2004, 19, 99–117. [Google Scholar]
  53. Essama-Nssah, B. Achieving universal primary education through school fee abolition: Some policy lessons from Uganda. In Yes, Africa Can: Success Stories from Dynamic Continent; Chuhan-Pole, P., Angwafo, M., Eds.; World Bank: Washington, DC, USA, 2011. [Google Scholar]
  54. Lincove, J.A. The influence of price on school enrollment under Uganda’s policy of free primary education. Econ. Educ. Rev. 2012, 31, 799–811. [Google Scholar] [CrossRef]
  55. Grogan, L. Universal Primary Education and School Entry in Uganda. J. Afr. Econ. 2008, 18, 183–211. [Google Scholar] [CrossRef]
  56. Candia, D.A.; Ashaba, C.; Mukoki, J.; Jehopio, P.J.; Kyasiimire, B. Non-school factors associated with school drop-outs in Uganda. Sciences 2018, 4, 477–493. [Google Scholar]
  57. Weber, M. Wirtschaft und Gesellschaft; Mohr Siebeck GmbH & Co. KG: Tübingen, Germany, 2001. [Google Scholar]
  58. LaRocque, M.; Kleiman, I.; Darling, S.M. Parental Involvement: The mission link in school achievement. Prevent. School Fail. 2011, 55, 115–122. [Google Scholar] [CrossRef]
  59. Polat, F. Inclusion in education: A step towards social justice. Int. J. Educ. Dev. 2011, 31, 50–58. [Google Scholar] [CrossRef]
  60. Cotton, W.; Dudley, D.; Peralta, L.; Werkhoven, T. The effect of teacher-delivered nutrition education programs on elementary-aged students: An updated systematic review and meta-analysis. Prev. Med. Rep. 2020, 20, 101178. [Google Scholar] [CrossRef]
  61. Ngabirano, M. Cultural Issues Affecting the School Drop-Out Rate among Rural Boys in Uganda; University of Groningen: Groningen, The Netherlands, 2010; pp. 175–189. [Google Scholar] [CrossRef]
  62. Uganda Bureau of Statistics. The National Population and Housing Census 2014—Area Specific Profile Series; Uganda Bureau of Statistics: Kampala, Uganda, 2014.
  63. Lincove, J.A. Determinants of schooling for boys and girls in Nigeria under a policy of free primary education. Econ. Educ. Rev. 2009, 28, 474–484. [Google Scholar] [CrossRef]
Figure 1. Dropout rate of primary school students by gender and region. Source: UNESCO Institute for Statistics 2020; DRRF, dropout rate of rural females (%); DRRM, dropout rate of rural males (%); DRUF, dropout rate of urban females (%); DRUM: dropout rate of urban males (%).
Sustainability 14 05875 g001
Figure 2. Analytical model.
Sustainability 14 05875 g002
Table 1. Children enrolled in and attending Ugandan schools (unit: thousand).
1995199619971998201020132017
Girls, age 6349363376390555612635
Boys, age 6354367381395563621675
Girls, grade 1 (%)243256443485677686690
(63.2)(65.2)(109.3)(117.2)(122.4)(113)(104.1)
Boys, grade 1 (%)223239417463689702684
(75.7)(75.9)(126)(131.6)(121.5)(111)(101.3)
Source: UNESCO Institute for Statistics, 2020 [22].
Table 2. Youth literacy rate in population aged 15–24 years (unit: %).
1991 (t₁)2002 (t₂)2010 (t₃)(t₂ − t₁)/yrs(t₃ − t₂)/yrs(t₂ − t₁)/yrs − (t₃ − t₂)/yrs
Rural male75.284.588.60.850.510.34
Rural female59.073.283.11.291.240.05
Urban, male90.593.894.70.300.110.19
Urban, female86.591.393.90.440.330.11
Source: UNESCO Institute for Statistics, 2020 [22].
Table 3. Age at first marriage in Uganda.
19911995200120052011
WomenAge at first marriage19.418.219.62020
Difference/year −0.300.230.100.00
MenAge at first marriage, Male23.722.523.423.824.3
Difference/year −0.300.150.100.08
Source: United Nations Population Division: World Marriage Data 2019 [25].
Table 4. Number of students per classroom and students per teacher.
SurveyNational Household SurveyMpyangu et al.
Year1999200220162014
SexBoysGirlsBoysGirlsBoysGirlsBoysGirls
Cost6149656267.664.678.7
Lack of interest among pupils----8.78.327.8
Completed the desired level of schooling50445.85.5
Sickness or calamity in family712844.94.7-
Pregnancy-10-9-4.413.8
Housework44222.42.322.2
Grade repetition------16.2
Crowded classrooms------19.4
Poor school facilities------10.7
Unsafe commute to school------8.1
Source: Uganda National Household Survey 1999, 2002, 2016; [15]. -, option not included in the survey.
Table 5. Previous research on factors that influence Ugandan school dropouts.
AuthorsLow Household IncomeEducational CostsGender DiscriminationReligionCommute TimeEducational Levels of ParentsOther Household Characteristics
Mpyangu et al. (2014) O
Deininger (2003)O O
Mike et al. (2008)O OOO
Nabugoomu (2019)O O O
Nishimura et al. (2008) OO
Izama (2014) O
Essama-Nassa (2011) O
Drajea and O’Sullivan (2014) O
Lincove (2012) OO
Grogan (2008) O
Candia et al. (2018) O
Table 6. Educational statistics in Mpigi district.
GovernmentPrivateOverall
MaleFemaleTotal
No. of students37,371707622,52021,92744,447
No. of schools10628 134
Pupil–teacher ratio3227
Pupil–classroom ratio2733
Illiterate people aged 10–17 years 8088 (15.6%)
Children 6–12 years not attending primary school 14.8%12.9%13.8%
Source: Uganda Bureau of Statistics, 2016 [15].
Table 7. General characteristics of the study sample.
Respondent ParentsPupils
AgeCategoryFrequency%CategoryFrequency%CategoryFrequency%
10~2030.362249.372279.5
20~3022226.782159.091897.9
30~4028033.7102379.9111437.3
40~5016620122018.4132028.4
50~609211141757.3151405.8
60~70546.5161265.217913.8
70~8070.8181074.519482.0
80~9060.720773.2
SexMan15919.1Boy 112147.4
Woman67371.9Girl 124251.7
Marital StatusMarried15618.7
Divorced/widowed32138.6
Single/living together35342.5
Total8302402
Table 8. Description of variables.
CategoryFrequency%CategoryFrequency%
Expectancy2381.6Household economic status100
31426.0220.2
4843.6377432.9
5552.34137358.4
6934.051988.4
72139.1ReligionCatholic120351.2
8132956.6Protestant86436.8
Missing39616.9Muslim25710.9
Atheist100.4
Importance of education100Education costMission160.7
20010,0001788.4
380.320,00034216.1
423510.030,00030014.1
5205487.440,00030214.2
Missing532.350,00029013.7
Commute time1024912.960,0001637.7
202311270,000874.1
3049125.480,0001155.4
501558110,000472.2
6058330.2200,0001085.1
901115.7300,000361.7
1201954.9400,0001075.0
180160.8600,000482.3
Missing41917.8
Total 2350100
Table 9. Regression analysis of determinants of educational expectations by child’s sex.
RespondentPupil
VariableGirlsBoys
Sex: Boys Girls0.098−0.044
Age−0.008 *−0.008
Marriage: marriedDivorced/widowed−0.216−0.393 *
Single/living together−0.069−0.097
Household economy−0.0280.068
Religion CatholicProtestant0.0770.132
Muslim−0.519 ***−0.448 *
Ln Educational cost−0.272 ***−0.179 *
Commute time−0.002−0.003
Importance of education1.346 ***1.674 ***
Household head’s education level0.0230.009
Constant5.425 ***6.962 ***
R 2 9.712.5
Observation1633765
Mean of the dependent variables7.057.02
***: p < 0.001. *: p < 0.05.
Table 10. Logistic regression analysis of determinants of actual school dropouts by sex.
VariableGirlsBoys
Sex: BoysGirls−0.1440.156
Age0.030 **0.023 *
Marriage: marriedDivorced/widowed−0.499−0.562
Single/living together−0.353−0.178
Household economy0.1880.220
Religion CatholicProtestant−0.009−0.108
Muslim0.5581.698
Ln Educational cost0.516 **0.415 *
Commute time0.0060.006
Importance of education0.119−0.371
Household head’s education level0.023−0.028
Constant1.220−0.242
R 2 0.0820.081
Observation1798849
Log likelihood603.204328.156
**: p < 0.01. *: p < 0.05.
Publisher’s Note: MDPI stays neutral with regard to jurisdictional claims in published maps and institutional affiliations.

