Article

Energy Efficiency in Production of Swiftlet Edible Bird’s Nest

by
Rabiatul Munirah Alpandi
1,
Fakarudin Kamarudin
2,*,
Peter Wanke
3,
Muhammad Syafiq Muhammad Salam
2 and
Hafezali Iqbal Hussain
1,4
1
Taylor’s Business School, Taylor’s University Lakeside Campus, 1 Jalan Taylors, Subang Jaya 47500, Malaysia
2
School of Business and Economics, Universiti Putra Malaysia, Serdang 43400, Malaysia
3
COPPEAD Graduate Business School, Federal University of Rio de Janeiro, Rio de Janeiro 21941-918, Brazil
4
University of Economics and Human Sciences in Warsaw, Okopowa 59, 01-043 Warsaw, Poland
*
Author to whom correspondence should be addressed.
Sustainability 2022, 14(10), 5870; https://doi.org/10.3390/su14105870
Submission received: 8 March 2022 / Revised: 23 April 2022 / Accepted: 9 May 2022 / Published: 12 May 2022

Abstract

:
The swiftlet edible bird’s nest (EBN) is a ranching industry in which the ranchers do not have to own the birds and are not required to prepare the food as the birds will find their own. However, the ranchers need to provide the ranches and attract the birds for nesting. This study examined a two-stage analysis on energy efficiency and greenhouse gas (GHG) emission in the swiftlet EBN production in Johor Bahru, Johor, Malaysia. In the first stage, non-parametric data envelopment analysis (DEA) was used to measure the efficiency score. The results revealed that out of 150 ranches, 7.33% and 40.67% of the ranches were efficient under the Charnes, Cooper, and Rhodes (CCR) and Banker, Charnes, and Cooper (BCC) models, respectively. The average of technical, pure technical, and scale efficiencies are 0.35361, 0.93071, and 0.37199, respectively. Analysis on optimum energy requirement and energy savings showed the total energy input that could be saved by the inefficient ranches was 0.89391 MJ/sqft−1 (63.87%). In addition, the inefficient ranches could reduce emissions by 63.86% (0.04497 kg Co2eq/sqft−1). In the second stage of analysis using the Tobit model, the results reported that a nesting plank was the factor with the most significantly positive effect on the ranch efficiency to improve their efficiency in energy consumption savings and emissions reduction in the EBN production.

1. Introduction

A swiftlet edible bird’s nest (EBN) is molded from the saliva of the aerodramus swiftlet that forms white and black nests that are highly prized culinary food products reputed to have many health benefits. EBNs have been consumed by Chinese people over thousands of years for health and regenerate effects, and EBNs have thus become one of the most expensive and highly sought-after delicacies among Chinese people [1]. Ranching for swiftlet EBNs is significantly different from other types of conventional ranching because the nests are produced by the wild birds and the ranches do not own the birds. In addition, the ranchers are not required to prepare the food for these birds as they find their own, but ranchers just provide the ranches or bird houses and attract the birds to come to the ranches for nesting. The ranchers ensure the perfect timing for harvesting the nests based on three methods, namely spoils, extraction of eggs, and after hatching collections to ensure that the specification of the nests meets the standard for the production of EBNs. Therefore, the resources used for EBN production may slightly differ from conventional ranching, and the quantity of inputs used and outputs produced could be different, specifically in regards to energy consumption and emission.
EBN output in Malaysia is expected to rise by eight metric tons per year. Swiftlet farming has maintained constant growth in annual EBN output, producing an astounding 135 tons with a total value of 1 billion Malaysian Ringgit in 2010, surpassing the 2010 estimate. By 2020, this industry is expected to provide more than RM 5.2 billion to the Gross National Income (GNI) and fulfil 40% of global market demand [2]. Despite an increase in the number of swiftlet farms, it has been observed that more than 70% of the ranches were unable to attract enough birds for nesting [3].
Successful swiftlet ranches, in contrast, generate at least 1.36 kg of nests each month, which equates to approximately 150 nests after one year of operation [1]. The major cause of this failure, according to Anuar et al. [3], is that ranchers lack awareness and assistance about infrastructural features and correct management. Improper management can result in wastage of energy input consumption such as electricity, water irrigation, human labor, and pesticides, resulting in high energy consumption and contributing to high greenhouse gas (GHG) emissions, which further effect global warming [4]. The swiftlet ranches need electricity as power supply to fit the house with an MP4 player and a humidity tool to attract the birds to come to the house and produce the nests. Swiftlets are very sensitive birds, and they will only enter and stay in a house that provides a surrounding similar to their original habitats in a cave. Water irrigation is also needed to always keep the house moist and it will help in producing high-grade nests, pesticides are used to control pests from disturbing the nest, and human labor is important for the harvesting and maintaining processes.
Although energy is important to the ecosystem, human civilizations, and life, the rapid use of energy negatively impacts the environment. This indicates that in order to improve the environment, it is important to optimize energy consumption to ensure the efficiency of energy usage and emission. Hatirli et al. [5], Hosseinzadeh-Bandbafha et al. [6], and Jin et al. [7] posit that energy efficiency could increase productivity, contribute to the economy and competitiveness in the agricultural environment, improve profitability, and lower emissions.
In fact, numerous previous studies have examined energy use in the production of agricultural crops such as cucumber, tomato, grape, watermelon, and peanut [4,5,6,8,9], but virtually no studies have examined efficiency, energy use, and GHG emission in EBN production.
As a result, this study used the non-parametric frontier data envelopment analysis (DEA) approach to assess the farms’ effectiveness in producing swiftlet EBN. The efficient ranches will serve as benchmarks for the inefficient ranches in order to improve their efficiency in energy consumption savings and emissions reduction. Many studies have applied the DEA method in agricultural research. Mousavi-Avval et al. [10] employed DEA to improve canola crop energy usage efficiency, reporting that 15% of the farmers were technically efficient and overall energy consumption was 17,786 MJ ha−1. The findings of using DEA revealed that farmers might save 9.5% of their energy (1696 MJ ha−1) if they worked more effectively. Khoshnevisan et al. [11] used DEA to increase energy efficiency and decrease GHG emissions in wheat production, whereas Hosseinzadeh-Bandbafha et al. [6] and Bolandnazar et al. [12] used DEA to assess energy efficiency and reduce GHG emissions in peanut and cucumber producers, respectively.
Heidari et al. [13] and Amid et al. [14] employed the Charnes, Cooper, and Rhodes (CCR) and Banker, Charnes, and Cooper (BCC) models to estimate farmer efficiency in broiler production in Iran’s Yazd and Ardabil provinces, respectively. According to Yazd, just 10 farmers were effective in utilizing the CCR strategy, whereas 16 farmers were effective in using the BCC approach. The researchers rated farmers’ technical, pure technical, and scale efficiency as 0.90, 0.93, and 0.96, respectively. According to Ardabil’s data, CCR and BCC models were effective in 40% and 22.86% units, respectively.
Sefeedpari [15] used DEA to calculate the energy efficiency of input use in Iran’s Tehran province. The researcher obtained primary collection data from 35 dairy farmers, and the results revealed the technical efficiency to be 88%. Hosseinzadeh-Bandbafha et al. [6] also determined the optimum energy consumption of dairy farms using DEA and extended calculation on the effect of optimum energy consumption on GHG emission. The results revealed the optimum energy required was estimated to be 129,932 MJ. The total GHG emission rate was calculated as 5393 KgCO2, which can be reduced to 4738 KgCO2 with optimum energy consumption.
DEA has been supported by numerous academics as a viable tool for assessing efficiency in optimal energy and GHG emission in most agricultural businesses, but not in the swiftlet EBN industry, based on earlier studies. Due to this void, the initial step of this research looked at the energy efficiency consumption and reduction of GHG emissions emitted by swiftlet EBN manufacturing in Johor Bahru, Malaysia. In the second stage, this study will determine factors that influence efficiency of swiftlet ranches by using the Tobit regression estimation method.
More specific objectives of this study include:
  • To examine the evaluation of the flow of energy consumption based on the different resources in EBN production;
  • To investigate the GHG emission rate based on the different resources in EBN production;
  • To assess the efficiency of energy consumption based on four inputs and one output in EBN production by using the DEA approach;
  • To calculate the optimum energy and GHG emissions rate to reduce the consumption of energy and emission in EBN production;
  • To analyze the potential determinants of the swiftlet ranches’ efficiency for improvement in energy savings and emissions reduction by using the Tobit regression estimation method.

2. Materials and Methods

2.1. Collection of Data

In 2018/2019, this research was carried out in Johor Bahru, Johor, Malaysia. Malaysia is a Southeast Asian country represented as the world’s second largest producer of swiftlet EBNs after only Indonesia [16]. Although swiftlets tend to originate from rural and forested sites, Johor Bahru is different because it is an urban environment. Furthermore, Johor Bahru has been listed as one of the top five states that produced the highest amount of swiftlet EBNs in Malaysia based on a report provided by the Malaysian Department of Veterinary Service in 2017. Face-to-face interviews and questionnaires were used to collect data from 150 swiftlet farms in Johor Bahru. The location of the research area is shown in Figure 1.

2.2. Energy Equivalent in EBN Production

In this study, there were four inputs used for EBN production: human labor, electricity, water irrigation, and pesticides. EBN production served as the output energy. Furthermore, three additional sets of data on ranches’ specific variables that may affect energy efficiency in EBN production were also collected: capital, size, and plan. Every source of energy has a different value of energy. The summary of inputs and outputs in EBN production converted to an energy term by multiplying by the appropriate coefficient of energy equivalent is illustrated in Table 1, and the energy converters used are for farming agriculture area. The results indicated that the total energy input resources and EBN production were 1.39952 MJ sqft−1 (standard deviation of 0.33168) and 0.00299 Kg sqft−1 (standard deviation of 0.00171), respectively. In addition, electricity represented the highest energy consumption with 1.37861 MJ sqft−1 (98.51%), and the lowest belonged to pesticides with 0.00289 MJ sqft−1 (0.21%).

2.3. DEA Method for Efficiency Estimation

DEA is a method for comparing the inputs and outputs of similar decision-making units (DMUs) that is often employed (e.g., ranches). This approach examines the performance of DMUs by comparing their relative efficiency to that of other DMUs. When no other DMUs can create outputs with less or equivalent inputs, efficiency is defined [9]. DEA also provides efficiency scores as well as reference units for inefficient DMUs. To put it another way, reference units are imaginary units on the efficient surface that may be used as objective units in inefficient enterprises. Furthermore, by extending the inefficient DMU radially to the efficient surface, a reference unit may be identified in DEA. According to Cooper et al. [19], DEA does not need any assumptions about the form of the border or the internal operations of a DMU.
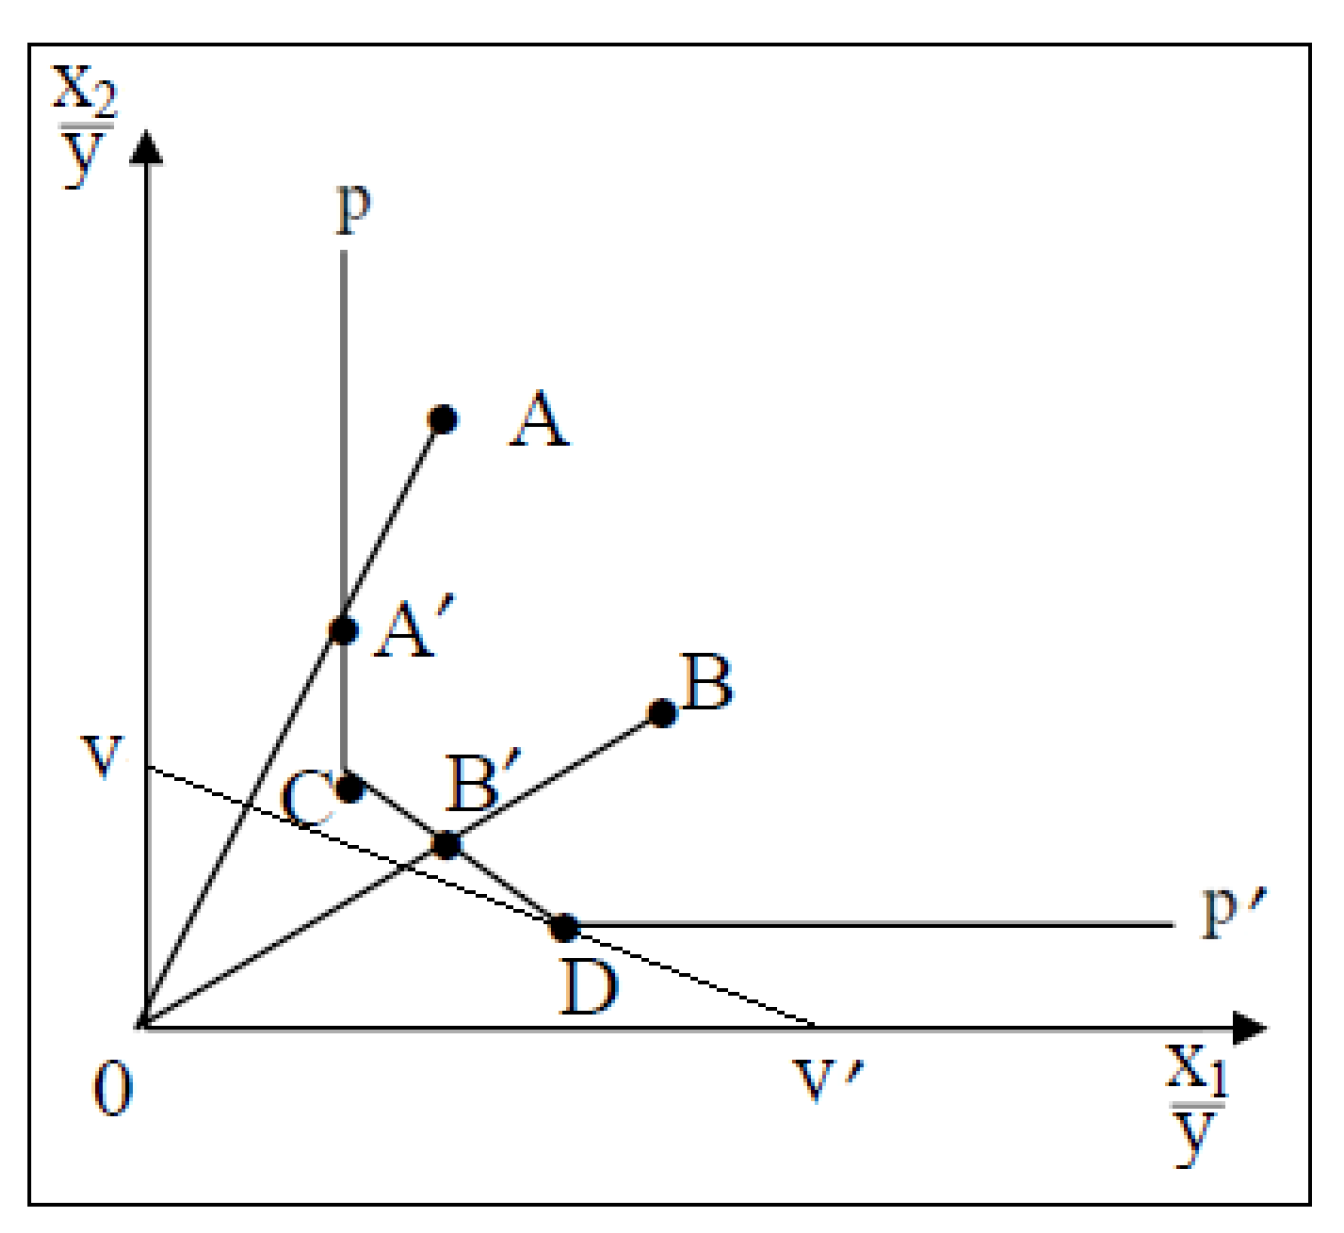
Figure 2 depicts the input oriented piecewise method utilizing the CCR DEA Model [20] under the assumption of constant return to scale (CRS). In the figure, X1 and X2 represent input 1 and input 2, respectively, and Y is the output. The unit isoquant of the full efficiency firm, represented by PP’, that allows the technical efficiency (TE) measurement, and the iso-cost line is representing by VV’. Two efficient DMUs are presented by using the combination of the C and D inputs, which define the frontier, whereas A and B are technical inefficient (TIE).
If a particular DMU employs inputs specified by points A and B to create a unit of output, the TIE of that DMU may be represented by the distances A’A and B’B, which are the amounts by which all inputs could be proportionately reduced without causing a reduction in output. It is stated in percentage terms by the ratio A’A/0A and B’B/0B, which is the ratio by which all of the inputs might be lowered. Farrell [21] defines TE as 0A’/0A (0B’/B), which is one less than A’A/0A (B’B/0B).
DEA can be input or output-oriented. In the input-oriented instance, the DEA technique defines the frontier by attempting to achieve the greatest feasible proportionate decrease in input utilization while keeping output levels constant for each business. In the output-oriented situation, the DEA technique seeks the greatest proportionate increase in output production while keeping input levels constant.
DMUs were supposed to be (k = 1,…, K) with the vector of input indicated as x = (x1,..., xN)   N + and the vector of output represented as y = (y1,…, yM) M + . The TE of the DMU might be calculated using Equation (1):
  T E k = λ 1 y 1 k + λ 2 y 2 k + , , + λ M y M k = m = 1 M λ m y m k ν 1 x 1 k + ν 2 x 2 k + , , + ν N x M k = n = 1 N ν n x n k  
where
T E k = the technical efficiency score given to the k-th DMU;
λ = output weights;
v = input weights.
Equation (1) can be translated into a linear programming under Equation (2), given by:
DEA L   ( x , y ) = M i n   ϕ k C R S | ϕ k C R S 0 s . t .   k = 1 K λ k y k   m     s m + = y o m ,   m = 1 , . . . ,   M k = 1 K v k x k   n + s n = x o n ,   n = 1 , . . . ,   N λ k v k , s m + ,     s n 0  
TE of the k-th DMU using the CRS technique is ϕ k C R S . The inputs of the k-th DMU are parameter multiplied by ϕ k C R S to decrease their size to the smallest factor possible with the constraint that these reduced inputs must still be capable of producing the original output bundle. The virtual DMU is designed in such a way that each sample may be used in another and the differences between virtual and real-world DMUs can be investigated. In the CRS model ϕ k C R S , the DMU’s output and input are indicated by y 0 m and x o n , respectively, whereas the output and input slacks are denoted by s m + and s n , respectively. The DMU is considered totally TE if the ϕ k C R S = 1 and the output and input slacks = 0.
TE estimation using the CRS approach is acceptable when all DMUs are running at the optimal scale. However, a number of internal and external factors such as company financial concerns, government regulation, and imperfect competition make assuring the appropriate size for all DUMs practically difficult. As a result, under the BCC DEA model, the selection of variable returns to the scale (VRS) method might solve this problem [22], imposing an extra convexity constraint k = 1 K v k = 1 on Equation (1). Using model Equation (3) as follows, the VRS technique implies that the TE scores may be split into two components: pure technical efficiency (PTE) and scale efficiency (SE):
D E A L   x , y = M i n   ϕ k V R S | ϕ k V R S 0 s . t .   k = 1 K λ k y k   m s m + = y o m ,   m = 1 , ,   M k = 1 K v k x k   n + s n = x o n ,     n = 1 , ,   N k = 1 K v k = 1 ;       k = 1 , ,   K λ k v k , s m + ,     s n 0  
In Equation (3), k V R S PTE of the k-th DMU provides a convex monotone hull of intersecting planes that encircles the data points more closely than the CRS conical hull when using the VRS approach. As a result, the PTE score under the CRS approach may be more than or equal to the TE score [23]. The CRS approach does not implement the convexity criterion, which might lead to the inefficient DMU being benchmarked against other DMUs of various sizes. In contrast, the VRS approach compares the inefficient DMU against DMUs of equivalent size, as indicated by the convexity requirement. The SE calculates the impact of DMU size on system efficiency, revealing that the wrong DMU size might lead to inefficiencies. The SE model is given by Equation (4):
SE k = T E P T E = ϕ k C R S ϕ k V R S
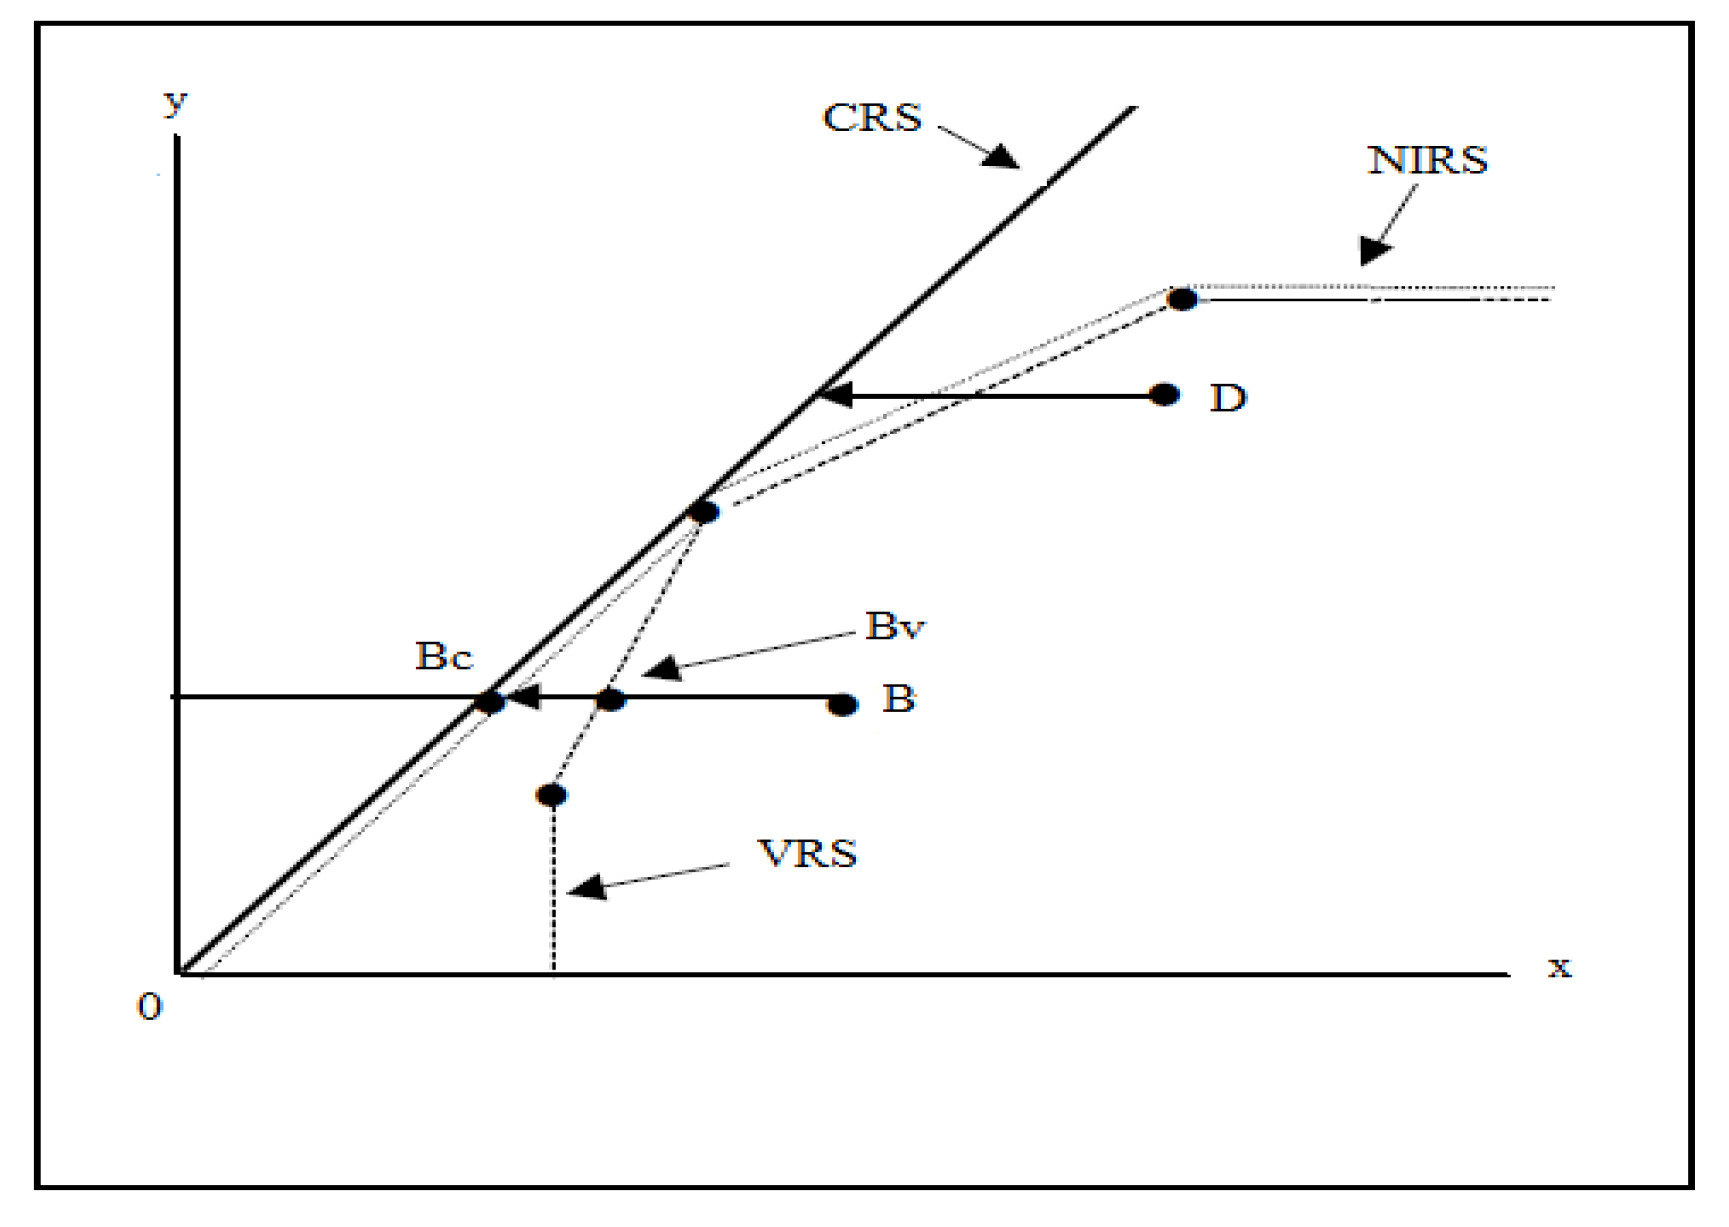
If the SEk value is 1, the DMU is either SE or CRS, but if the SEk value is less than 1, the DMU is scale inefficient (SIE). This may be achieved by using the same data for both a CRS and a VRS DEA. If the difference between two DMU TE scores is more than one, this indicates the existence of SIE in DMU, which may be determined by the PTE and TE disparity values. The input-oriented TIE of point B under CRS is the distance BBC, but with VRS, the TIE is just BBv, shown in Figure 3. As a result of the discrepancies between BcBv, scale inefficiency occurs. Although the SE measure can tell you how inefficient a DMU is as it does not use CRS, it cannot tell you if it is in a region with rising returns to scale (IRS) or declining returns to scale (DRS). This may be found by imposing non-increasing returns to scale (NIRS) on an extra DEA issue.
As a result, the contrast among the NIRS TE and VRS TE scores might be used to evaluating the nature of the scale inefficiencies caused by IRS or DRS. If the VRS TE @ PTE differs from the NIRS TE, the DMU is in IRS mode (point B). The DMU is running at DRS (point D) in Figure 3 if the VRS TE @ PTE equals the NIRS TE.

2.4. Emission of GHG in EBN Production

Table 2 summarizes the GHG emission coefficients for the inputs used in EBN synthesis. In traditional energy consumption mode, the GHG emission rate is computed by multiplying the GHG coefficient with item unit of electricity and pesticides. The results show that the total GHG emission rate in the production of EBN is approximately 0.07041 kgCo2eq sqft−1. The input of electricity contributes to the highest emission with 0.07026 kgCo2eq sqft−1 (99.79%). The input of pesticides contributes to the lowest emission with only 0.00015 kgCo2eq sqft−1 (0.21%).

2.5. Tobit Regression Estimation Method

This study applied the Tobit model to identify the potential determinants in influencing EBN ranches for energy efficiency and emissions reduction, which focus on specific characteristics of swiftlet ranching. The selection of Tobit due to the value of TE, PTE, and SE scores produced by DEA is truncated between 0 and 1, and numerous previous studies employed this regression estimation under second stage to identify the efficiency determinants [9].
A swiftlet ranch’s performance depends on how a ranch manages its characteristics, which consist of capital, size, and plank. Anuar et al. [3] reported that a swiftlet ranch’s performance is dependent on capital investment. The higher the capital investment, the greater the chance to attract swiftlets to the ranch to produce nests. However, the rancher should use the capital wisely by operating the ranch according to proper specifications.
In addition, Anuar et al. [3] noted that the performance of a swiftlet ranch is dependent on size and structure. The study suggested that the ideal size for swiftlet ranches is 20 × 60 feet. If a ranch is too small, it will distract the movement of birds, causing them to migrate to another place. This shows that size is a significant determinant for the performance of a swiftlet ranch. However, Wan Kahiry et al. [25] reported that swiftlets are highly social with their community, and this shows that they are comfortable with the saturated population, whereas in a large ranch sometimes there is not enough sound to attract them.
Furthermore, Zulnaidah, and Shahwahid [26] suggested that more nesting planks should be created to encourage higher quality nests, as swiftlets can form their nests properly by reducing the number of corner nests. There are two main reasons why providing more nesting planks are important: more places the swiftlets have to build their nests and swiftlets can find their suitable nesting plank by moving from one nesting plank to another. Therefore, the Tobit regression model is explained below under Equation (5):
y = α 0 + i = 1 3 α i x i k + ε k  
where y is the k-th DMU TE score obtained from DEA as the dependent variable, and x represents all three determinant variables, namely, x1 = capital (measured by Ringgit Malaysia), x2 = size (measured by square feet), and x3 = plank (measured by piece).

3. Results and Discussion

3.1. Ranch Efficiency

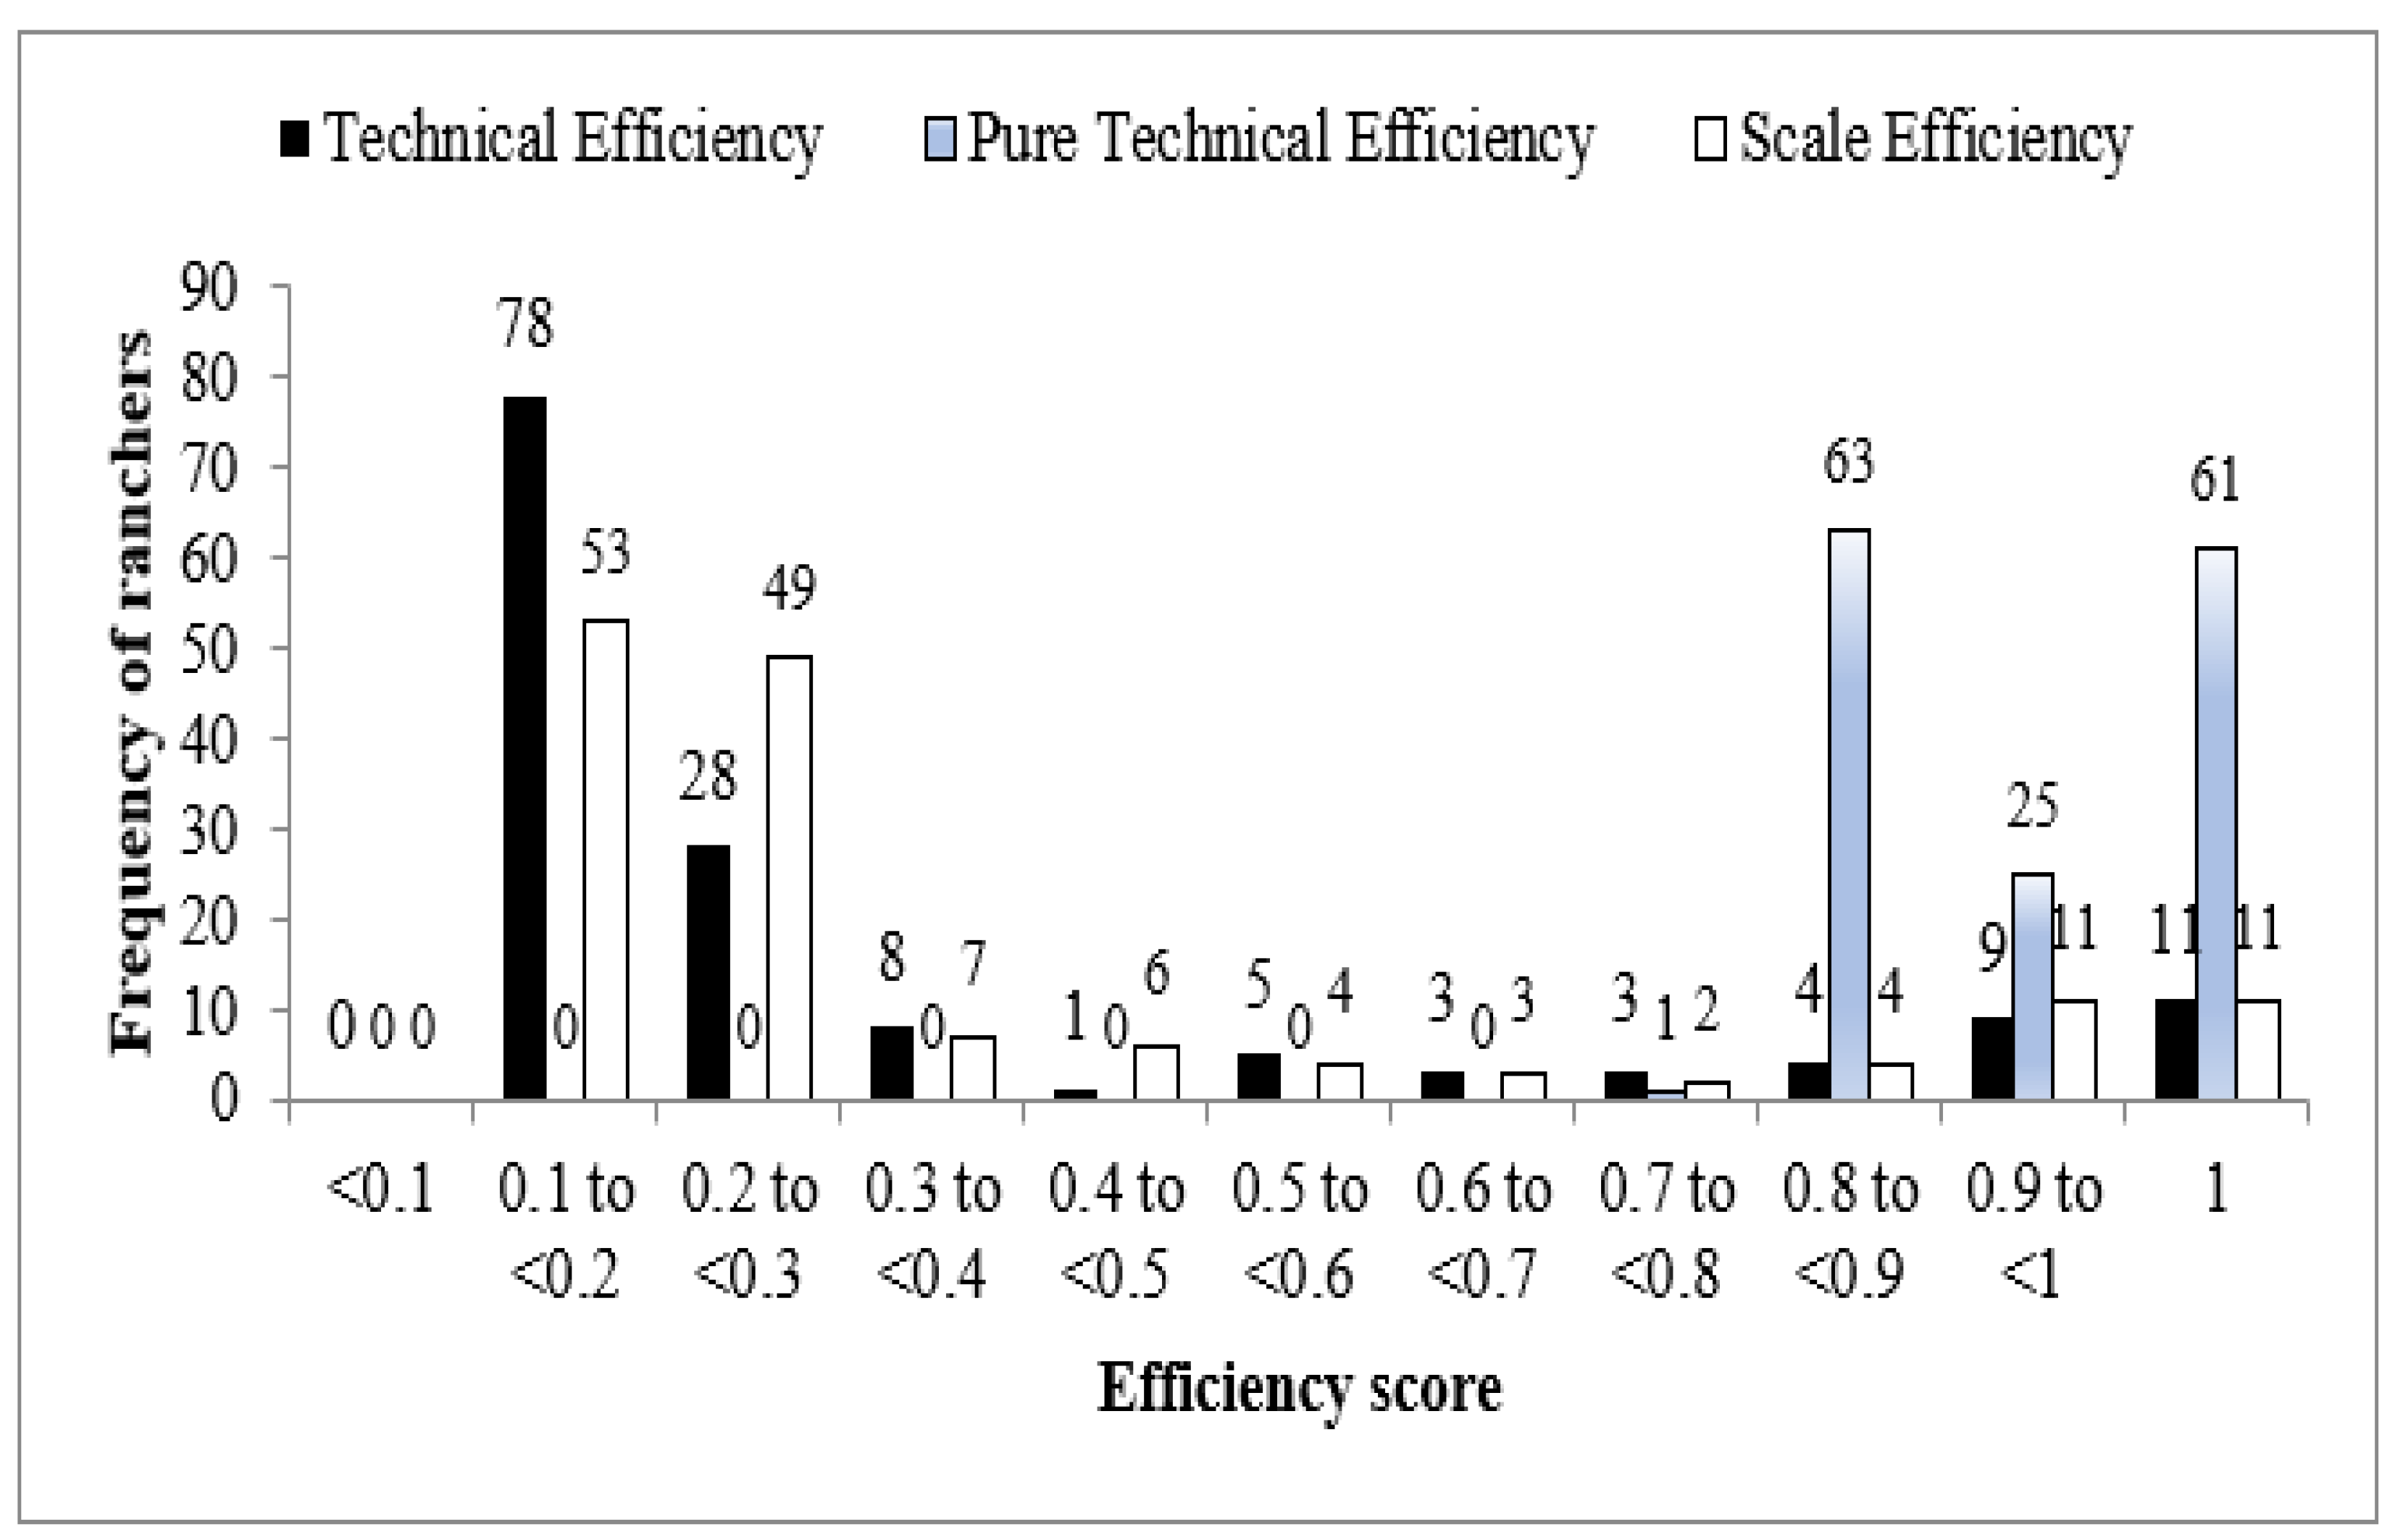
Based on Figure 4, the analysis of the efficiency scores on TE, PTE, and SE were calculated using the CCR and BCC models. Out of 150 ranches, 11 (7.33%) had a TE score of 1 under the CCR model, whereas 61 (40.67%) showed a full PTE using the BCC model. This indicated that these ranches were efficiently using their energy resources in producing EBNs in terms of TE and PTE, respectively. For the SE, 11 ranches were found to have a score of 1, which provided evidence that these ranches have fully utilized the inputs and maximized the output in energy efficiency with the appropriate size.
The average standard deviation and the lowest and maximum score values of the ranches’ efficiency were included in the descriptive statistics of TE, PTE, and SE given in Table 3. The average TE, PTE, and SE, respectively, were 0.35361 (standard deviation 0.29255), 0.93071 (standard deviation 0.06626), and 0.37199 (standard deviation 0.29173). The maximum score for all three efficiencies was 1.
The TE, PTE, and SE for Yazd’s broiler farmers were 0.9, 0.93, and 0.96, respectively, according to prior research done by Heidari et al. [13]. According to Amid et al. [14], the average TE, PTE, and SE for broiler farmers in Ardabil was 0.88, 0.93, and 0.95. As a consequence of comparing these data, it was found that improving the ranches’ TE in EBN production has a high potential, which could be performed by studying inefficient ranches.

3.2. Ranking Ranch Efficiency

This study employed the benchmarking approach to analyze each ranch’s ranking by identifying the most efficient ranches based on how frequently they appeared in the reference set, and these, in turn, could serve as a benchmark that would be useful for other inefficient ranches. This is indicated as the highest (lowest) number of times efficient ranches will be ranked as the most (least) efficient. Table 4 shows the results of the 10 most efficient ranches from 150 ranches listed, demonstrating that ranches 23, 43, 37, 40, and 39 appeared 79, 72, 61, 37, and 35 times in the reference set, respectively. Ranch 23 ranked as the most efficient because it appeared most often in the reference set compared with the others. Thus, the inefficient ranches could benefit from these results by adopting the management style of the most efficient ranches to improve their energy efficiency consumption and reduce emissions.

3.3. Pattern of Input Consumption in Efficient and Inefficient Ranches

The comparison pattern of input consumption in efficient and inefficient ranches is presented in Table 5. The results illustrate that electricity was the only input that the 10 most efficient ranches used more than the inefficient ranches (0.26%), whereas other inputs were lower. The production of the 10 most efficient ranches was 192.78%, significantly higher than that of inefficient ranches. With 24.28% and 24.13%, respectively, pesticides and human labor had the greatest disparity among inputs.

3.4. Identifying Optimum Energy Requirement and Energy Savings to Avoid Wastage

Table 6 summarizes the optimal energy need, energy savings, and proportion of energy inputs in total energy input savings for EBN production using the BCC model. The findings showed that the total energy input of the optimal energy need was 0.50561 MJ sqft−1, indicating that the correct amount of energy was employed to increase energy efficiency and savings. Comparing the present and optimum energy savings and the total energy input that could be saved by the inefficient ranches, the result was 0.89391 MJ sqft−1. Thus, it can be recommended that the inefficient ranches decrease energy consumption by 63.87% to enhance the EBN production and efficiency levels. Other information also presented is that the input of pesticides represented the highest energy savings with 0.00204 MJ sqft−1, followed by human labor with 0.00225 MJ sqft−1 and electricity with 0.88022 MJ sqft−1, respectively. If all ranches operated efficiently, the inputs of pesticides, human labor, and electricity could be reduced by 70.83%, 68.24%, and 63.85%, respectively, without decreasing EBN production. Furthermore, electricity had the biggest percentage contribution to overall energy savings with 98.47%, indicating that the high rate of electricity was the primary driver for the efficiency score discrepancy between the current and optimal farms.
The ranches use electricity 24 h/day, 7 days/week to power speakers that play recorded swiftlet chirping that attracts the birds to stay and nest in the ranch. Thus, the solar energy replacement system would be the best alternative to reduce energy consumption and maximize EBN production in the most efficient approach [27]. Additionally, solar energy could also provide an environmental benefit, as zero GHG emissions would be produced from utilizing it.
The study by Amid et al. [14] also reported that the total percentage of energy savings for boiler production was 22,341.26 MJ sqft−1 (14.53%), indicating that this energy value could be saved without affecting the output yield. A similar study conducted by Heidari et al. [13] showed that the total input energy that could be saved was 25,816.63 MJ sqft−1 for boiler production.

3.5. Energy Indices Improvements

Table 7 shows how energy indices for EBN generation have improved. According to the findings, the energy consumption efficiency, energy productivity, specific energy, and net energy for optimal farms were determined to be 2520.16635, 161.03299 kg MJ−1, 0.00621 MJ kg−1, and 1273.71739 MJ kg−1, respectively. Using the DEA technique, these energy indices might be improved by 176.80%, 176.80%, −63.87%, and 0.07%, respectively. Furthermore, Table 7 also lists the direct energy, indirect energy, renewable energy, and non-renewable energy for present and optimum quantities. The percentage differences between present and optimum quantity were −68.24%, −63.86%, −64.59%, and −63.86% for direct, indirect, renewable, and non-renewable energies, respectively, demonstrating the reduction in energy for ranches operated inefficiently. The results also noted that there is a significant difference in the amount of direct energy consumption in present and optimum quantities. Given the importance of this type of energy, it is suggested that ranches reduce energy consumption as much as possible under the direct energy that is human labor.

3.6. Optimum GHG Emission and Emission Reduction to Enhance Health Environment

Analysis results on optimum GHG emissions and emission reduction in EBN production is summarized in Table 8. Based on the findings, the total optimum GHG emissions of efficient ranches was reported as 0.02544 kgCo2eq sqft−1, which explained a realistic amount of GHG emissions. The value of total GHG emission reduction was calculated from the difference between inefficient and efficient ranches, illustrated by 0.04497 kgCo2eq sqft−1. Therefore, by using the optimum inputs, the inefficient ranches could reduce emission by 63.86% without affecting EBN production and also keep a healthy environment. The input of pesticides represented the highest emission reduction with 0.00011 kgCo2eq sqft−1, followed by electricity with 0.04486 kgCo2eq sqft−1. This indicated that the emission reduction of pesticides and electricity can be reduced by 73.33% and 63.85%, respectively, if all ranches operated efficiently. Nonetheless, based on the results, the electricity input contributed the biggest proportion of the overall decrease emission with 99.76%, demonstrating that electricity was the key driver for the difference in efficiency scores between efficient and inefficient ranches. Thus, we can conclude that electricity was the highest contribution to total emissions reduction. Therefore, all findings confirmed that reducing energy consumption could contribute to reducing GHG emissions.

3.7. Other Determinants on Ranches’ TE, PTE, and SE

Table 9 illustrates the other determinants that influenced the ranches’ TE, PTE, and SE by using the Tobit regression model under the second stage of analysis. From the observation of 150 ranches, the piece of plank was the factor that significantly influenced TE, PTE, and SE positively at the 1% level. Furthermore, the specific variables of capital and size of swiftlet ranches did not significantly affect the ranches to improve their efficiency in energy consumption savings and emission reduction in EBN production.
One reason might be that the capital used by the ranches was not properly used to set up the right ranch’s specifications to attract swiftlets to produce nests, as Johor Bahru is an urban location, not in a rural or forested site. In addition, according to Wan Kahiry et al. [25], the size of a swiftlet ranch must not be too big because it will not work well in a place that does not have a saturated swiftlet population.
The consistent pattern of a significant positive relationship between plank and TE, PTE, and SE indicates that increasing the usage of the plank can increase the surface area for swiftlets to produce more nests. A nesting plank is created to encourage higher quality nests by reducing the number of corner nests. The more planks laid, the more places the swiftlets have to build their nests [26]. In addition, according to Hendri [28], swiftlets like to find their suitable nesting plank by moving from one nesting plank to another. Therefore, planks do have an important role in the performance of swiftlet ranching in improving their energy efficiency and emission reduction rate.

4. Conclusions

This study examined the two-stage analysis on energy efficiency and GHG emissions in the swiftlet EBN production in Johor Bahru, Johor, Malaysia. In the first stage, non-parametric DEA was used to measure the efficiency score. The average TE, PTE, and SE scores were 0.35361, 0.93071, and 0.37199, respectively. The 10 most efficient ranches used 0.26% more electricity input, and production was 192.78% higher than the inefficient ranchers. Analysis on optimum energy requirements and energy savings shows that the total energy input that could be saved by inefficient ranches was 0.89391 MJ sqft−1 (63.87%). Other information also presented that the input of pesticides represented the highest energy savings with 0.00204 MJ sqft−1 (70.83%), followed by human labor with 0.00225 MJ sqft−1 (68.24%) and electricity with 0.88022 MJ sqft−1 (63.85%). With 98.47% energy savings, electricity had the most important role.
The energy use efficiency, energy productivity, specific energy, and net energy indices could be improved by 176.80%, 176.80%, −63.87%, and 0.07%, respectively. The differences between present and optimum quantities were −68.24%, −63.86%, −64.59%, and −63.86% for direct, indirect, renewable, and non-renewable, energies respectively.
In addition, the inefficient ranches could reduce emission by 63.86% (0.04497 kgCo2eq sqft−1). The emission reduction of pesticides and electricity could be reduced by 73.33% (0.00011 kgCo2eq sqft−1) and 63.85% (0.04486 kgCo2eq sqft−1), respectively, if all the ranches operated efficiently. However, electricity was the highest contribution to total reduction emission (99.76%), and this finding was paralleled with the contribution to total energy savings. Therefore, all findings confirmed that reducing energy consumption could contribute to reducing GHG emissions.
In the second stage of analysis, the results reported that out of three potential determinants, plank was the only factor that significantly influenced TE, PTE, and SE positively at the 1% level. Therefore, the plank could improve the efficiency of ranches by enhancing energy efficiency and emission reduction for three reasons. First, a nesting plank is created to encourage higher quality nests by reducing the number of corner nests. Second, the more planks laid, the more places the swiftlets have to build their nests. Finally, each bird likes to find its suitable nesting plank by moving from one nesting plank to another.
For future studies, we would recommend a study in Gua Musang, Kelantan, Malaysia, as this region has also been listed among the Malaysian states that has produced the highest amount of swiftlet EBNs. Therefore, we could investigate the efficiency level of the energy and emission reduction rates from the most efficient ranches in Johor Bahru and Gua Musang, and in turn compare efficiency scores between the two regions.

Author Contributions

Conceptualization, R.M.A. and F.K.; methodology, R.M.A. and F.K.; software, F.K.; validation, P.W., M.S.M.S., and H.I.H.; formal analysis, F.K. and P.W.; investigation, H.I.H.; resources, M.S.M.S.; data curation, R.M.A.; writing—original draft preparation, R.M.A.; writing—review and editing, R.M.A. and M.S.M.S.; visualization, M.S.M.S. and H.I.H.; supervision, P.W. and F.K.; project administration, H.I.H.; funding acquisition, P.W. All authors have read and agreed to the published version of the manuscript.

Funding

This research received no external funding.

Data Availability Statement

The data are available in a publicly accessible repository that does not issue DOIs. Publicly available datasets were analyzed in this study. This data can be found here: https://databank.worldbank.org/source/world-development-indicators, assessed on 1 January 2021.

Acknowledgments

We would like to thank the editors and the anonymous referees of the journal for constructive comments and suggestions, which have significantly helped to improve the contents of the paper. The usual caveats apply.

Conflicts of Interest

The authors declare no conflict of interest.

References

  1. Lim, C. Make Millions from Swiftlet Farming: A Definitive Guide; True Wealth Sdn Bhd Publication: Kuala Lumpur, Malaysia, 2006. [Google Scholar]
  2. Rabu, M.R.; Nazmi, M.S.M. Malaysia’s Edible Bird Nest (EBN) Industry. Economic and Technology Management Centre; Food and Fertilizer Technology Center for the Asian and Pacific Region Publications: Suva, Fiji, 2015. [Google Scholar]
  3. Anuar, A.; Ang, Y.P.; Nurul Zahirah, M.A.; Mokhtar Azizi, M.D. Investment in swiftlet hotels in MalaysiaDoes ROI compensate investment risks? Afr. J. Bus. Manag. 2013, 7, 3936–3943. [Google Scholar]
  4. Nabavi-Pelesaraei, A.; Abdi, R.; Rafiee, S.; Bagheri, I. Determination of efficient and inefficient units for watermelon production-a case study: Gulian province of Iran. J. Saudi Soc. Agric. Sci. 2016, 15, 162–170. [Google Scholar] [CrossRef] [Green Version]
  5. Hatirli, S.A.; Ozkan, B.; Fert, C. Energy inputs and crop yield relationship in greenhouse tomato production. Renew. Energy 2006, 31, 427–438. [Google Scholar] [CrossRef]
  6. Hosseinzadeh-Bandbafha, H.; Nabavi-Pelesaraei, A.; Khanali, M.; Ghahderijani, M.; Chau, K.W. Application of data envelopment analysis approach for optimization of energy use and reduction of greenhouse gas emission in peanut production of Iran. J. Clean. Prod. 2018, 172, 1327–1335. [Google Scholar] [CrossRef]
  7. Jin, W.; Zhang, H.Q.; Liu, S.S.; Zhang, H.B. Technological innovation, environmental regulation, and green total factor efficiency of industrial water resources. J. Clean. Prod. 2019, 211, 61–69. [Google Scholar] [CrossRef]
  8. Heidari, M.D.; Omid, M. Energy use patterns and econometric models of major greenhouse vegetable productions in Iran. Energy 2011, 36, 220–225. [Google Scholar] [CrossRef]
  9. Khoshroo, A.; Mulwa, R.; Emrouznejad, A.; Arabi, B. A non-parametric Data Envelopment Analysis approach for improving energy efficiency of grape production. Energy 2013, 63, 189–194. [Google Scholar] [CrossRef]
  10. Mousavi-Avval, S.H.; Rafiee, S.; Jafari, A.; Mohammadi, A. Optimization of energy consumption for soybean production using Data Envelopment Analysis (DEA) approach. Appl. Energy 2011, 88, 3765–3772. [Google Scholar] [CrossRef]
  11. Khoshnevisan, B.; Rafiee, S.; Omid, M.; Mousazadeh, H. Applying Data Envelopment Analysis approach to improve energy efficiency and reduce GHG (greenhouse gas) emission of wheat production. Energy 2013, 58, 588–593. [Google Scholar] [CrossRef]
  12. Bolandnazar, E.; Keyhani, A.; Omid, M. Determination of efficient and inefficient greenhouse cucumber producers using Data Envelopment Analysis approach, a case study: Jiroft city in Iran. J. Clean. Prod. 2014, 79, 108–115. [Google Scholar] [CrossRef]
  13. Heidari, M.D.; Omid, M.; Akram, A. Optimization of energy consumption of broiler production farms using Data Envelopment Analysis Approach. Mod. Appl. Sci. 2011, 5, 69–78. [Google Scholar] [CrossRef] [Green Version]
  14. Amid, S.; Gundoshmian, T.M.; Shahgoli, G.; Rafiee, S. Energy use pattern and optimization of energy required for broiler production using data envelopment analysis. Inf. Processing Agric. 2016, 3, 83–91. [Google Scholar] [CrossRef] [Green Version]
  15. Sefeedpari, P. Assessment and optimization of energy consumption in dairy farm: Energy efficiency. Iran. J. Energy Environ. 2012, 3, 213–224. [Google Scholar] [CrossRef]
  16. Guo, L.; Wu, Y.; Liu, M.; Wang, B.; Ge, Y.; Chen, Y. Determination of edible bird’s nests by FTIR and SDS-PAGE coupled with multivariate analysis. Food Control 2017, 80, 259–266. [Google Scholar] [CrossRef]
  17. Nabavi-Pelesaraei, A.; Abdi, R.; Rafiee, S.; Taromi, K. Applying data envelopment analysis approach to improve energy efficiency and reduce greenhouse gas emission of rice production. Eng. Agric. Environ. Food 2014, 7, 155–162. [Google Scholar] [CrossRef]
  18. Oryza, O. Birds Nest Extract; Oryza Oil and Fat Chemical Co., LTD: Ichinomiya-City, Japan, 2013. [Google Scholar]
  19. Cooper, W.W.; Seiford, L.M.; Zhu, J. Handbook on Data Envelopment Analysis; Springer: Berlin/Heidelberg, Germany, 2011. [Google Scholar]
  20. Charnes, A.; Cooper, W.W.; Rhodes, E. Measuring efficiency of decision making units. Eur. J. Oper. Res. 1978, 2, 429–444. [Google Scholar] [CrossRef]
  21. Farrell, M.J. The measurement of productive efficiency. J. R. Stat. Soc. Assoc. 1957, 120, 253–281. [Google Scholar] [CrossRef]
  22. Banker, R.D.; Charnes, A.; Cooper, W.W. Some models for estimating technical and scale efficiencies in data envelopment analysis. J. Manag. Sci. 1984, 30, 1078–1092. [Google Scholar]
  23. Coelli, T.J.; Rao, D.S.P.; O’Donnell, C.J.; Battese, G.E. An Introduction to Efficiency and Productivity Analysis; Springer: Berlin/Heidelberg, Germany, 2005. [Google Scholar]
  24. Asgharipour, M.R.; Mousavinik, S.M.; Enayat, F.F. Evaluation of energy input and greenhouse gases emissions from alfalfa production in the Sistan region, Iran. Energy Rep. 2016, 2, 135–140. [Google Scholar] [CrossRef] [Green Version]
  25. Wan Khairy, W.I.; Mohd Rafi, Y.; Azwan, A. The importance of technical knowledge in sustainability of Malay’s bird’s nest industry in Malaysia. J. Appl. Environ. Biol. Sci. 2015, 5, 190–196. [Google Scholar]
  26. Zulnaidah, M.; Shahwahid, M. An Economic Analysis of Swiftlet Edible Birds’ Nest Industry; Forestry Department Peninsular Malaysia, Kuala Lumpur Publications: Kuala Lumpur, Malaysia, 2012. [Google Scholar]
  27. Prehoda, E.W.; Pearce, J.M. Potential lives saved by replacing coal with solar photovoltaic electricity production in the U.S. Renew. Sustain. Energy Rev. 2017, 80, 710–715. [Google Scholar] [CrossRef] [Green Version]
  28. Hendri, S.C. Strategi Jitu Memikat Walet; PT AgroMedia Pustaka Publications: Jakarta Selatan, Indonesia, 2007. [Google Scholar]
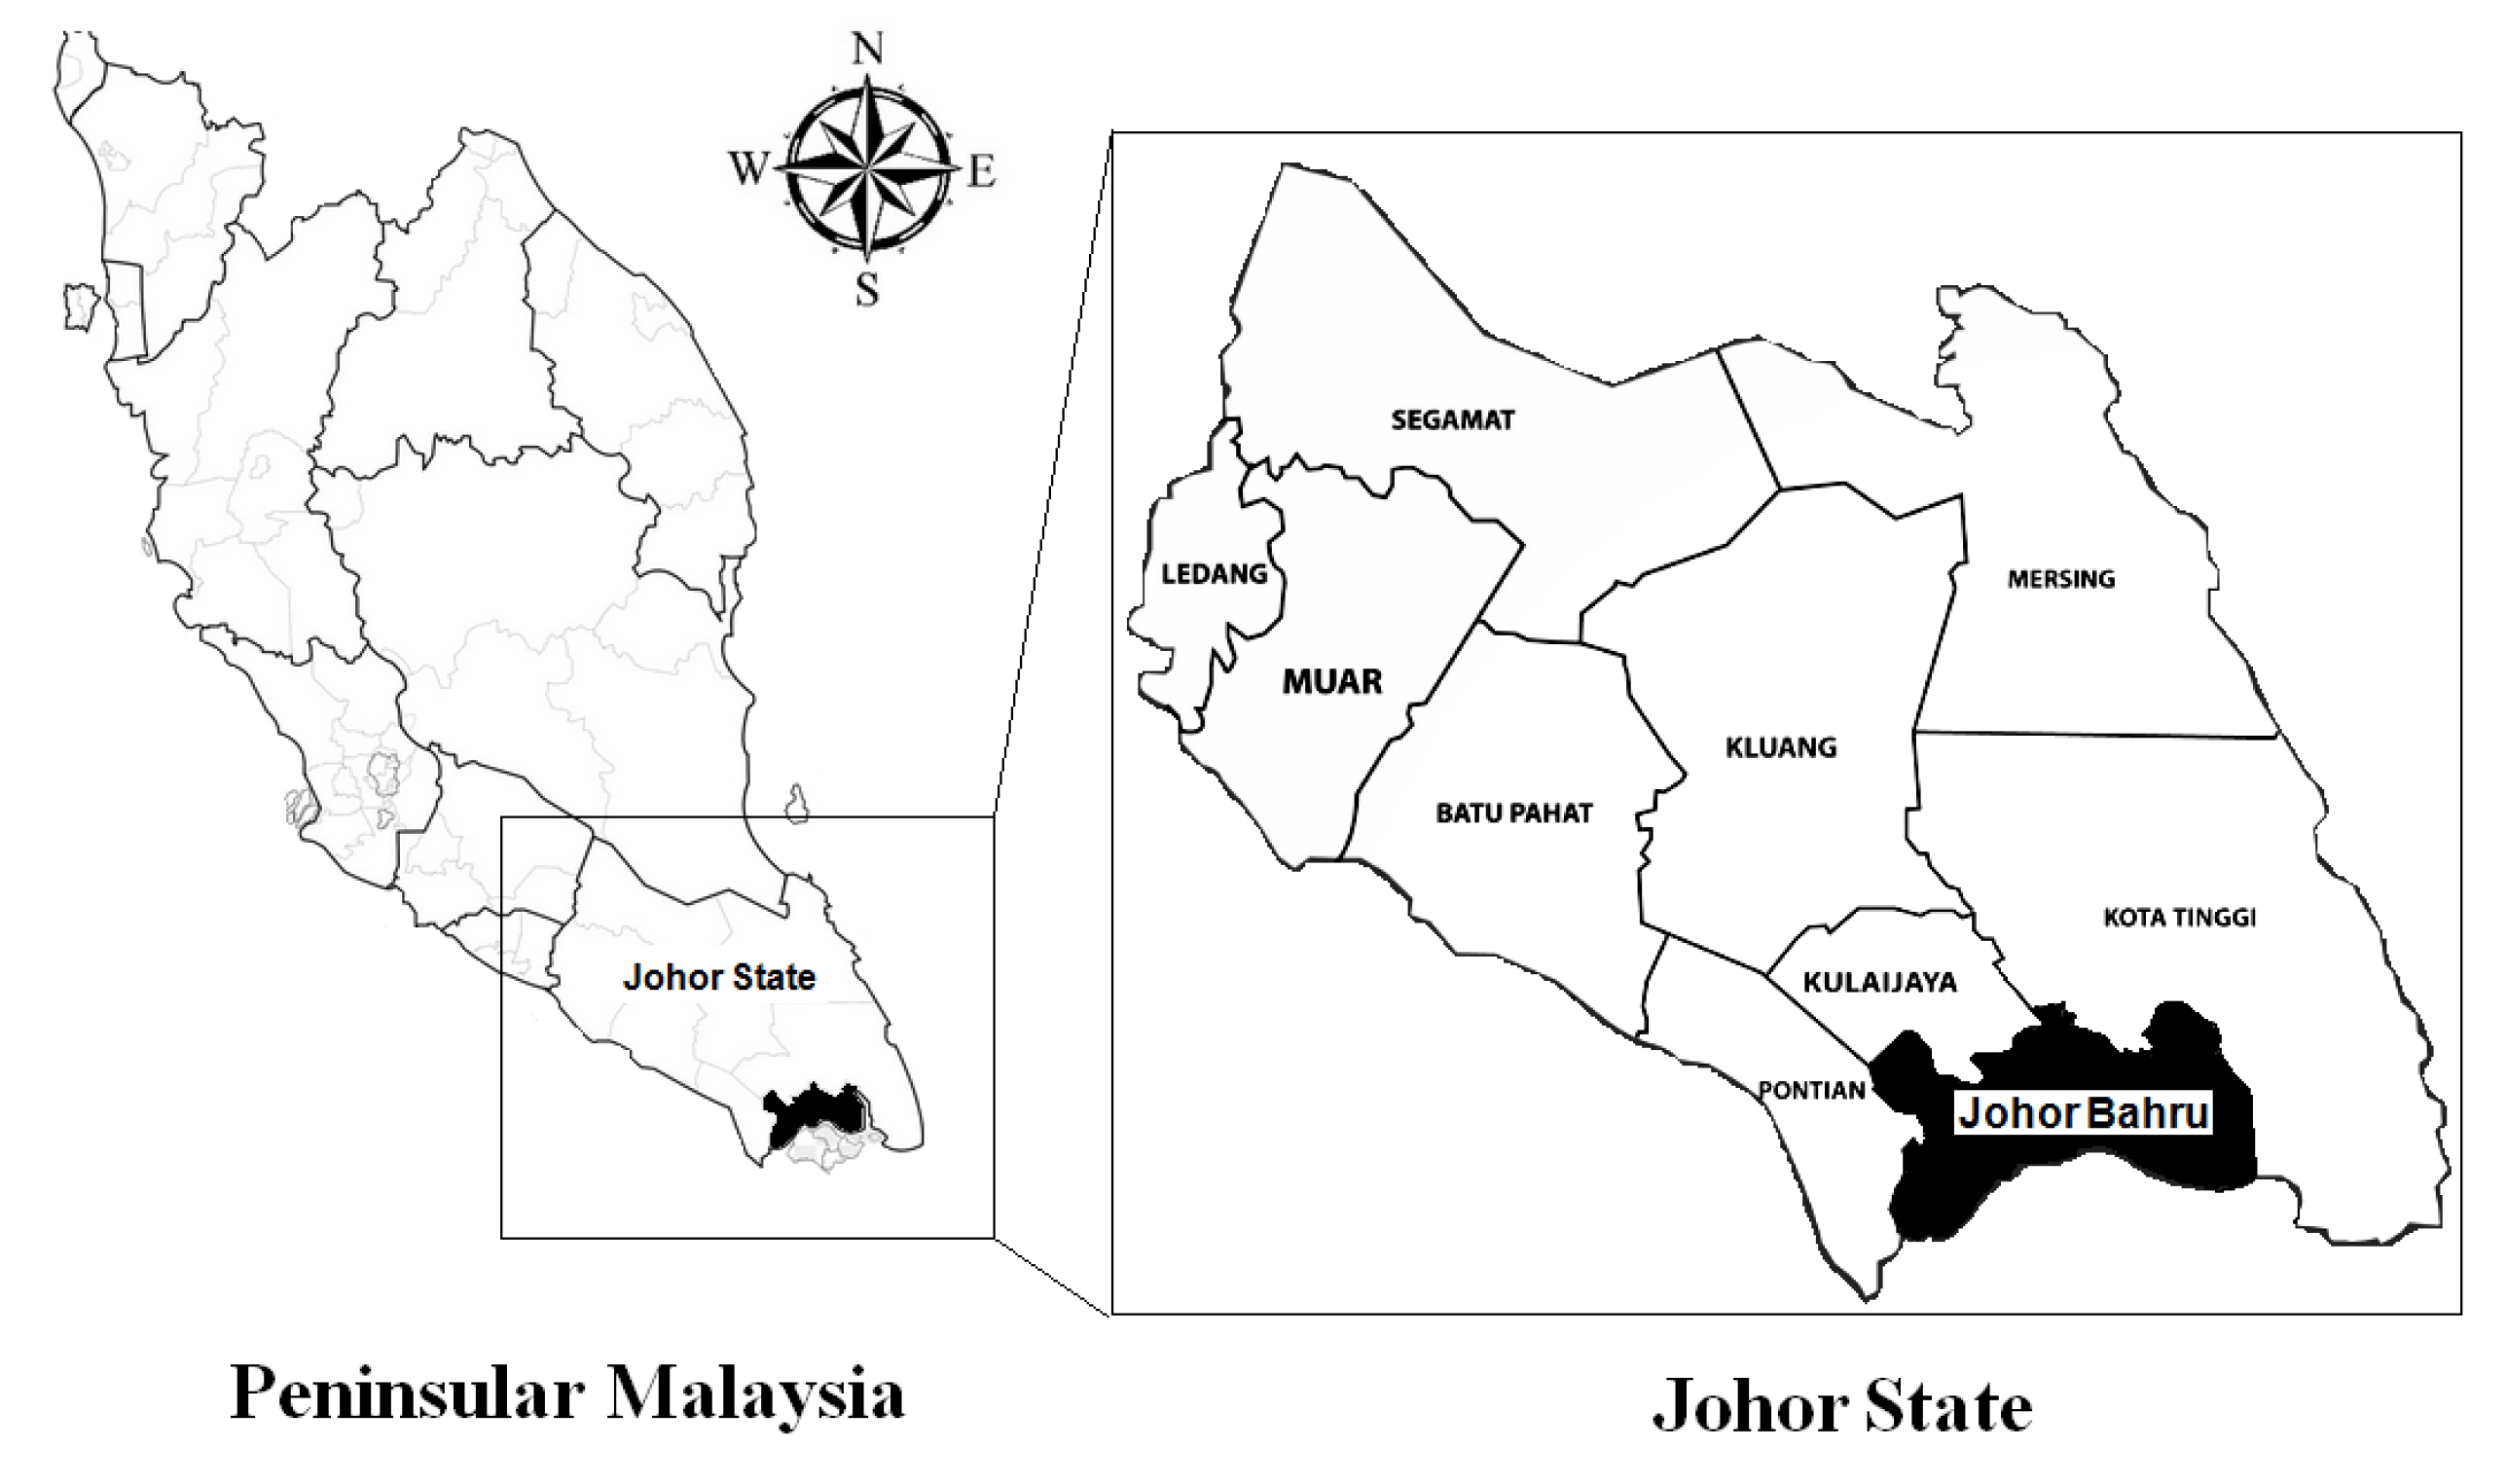
Figure 1. Johor Bahru, Johor, Malaysia.
Sustainability 14 05870 g001
Figure 2. Input oriented piecewise linear convex isoquant.
Sustainability 14 05870 g002
Figure 3. DEA scale economies of scale calculation.
Sustainability 14 05870 g003
Figure 4. EBN ranch efficiency score distribution in Johor Bahru.
Sustainability 14 05870 g004
Table 1. Energy coefficient of different inputs and output used in EBN production.
Items
(Unit)
Energy Equivalent
(MJ Unit−1)
Quantity Per Unit Area
(Unit Sqft−1)
Total Energy Equivalent
(MJ Sqft−1)
Total Energy Equivalent
(%)
A. Input
1. Human labor (h)1.96[6,9,14,17]0.001680.003300.24
2. Electricity (kWh)11.93[6,9,14]0.115561.3786198.51
3. Water irrigation (m3)1.02[9,10]0.014440.014731.05
4. Pesticides (kg)101.20[9,10]0.000030.002890.21
Total energy input (MJ) 1.39952100
B. Output
Edible bird’s nest (kg)15.65[18]0.002990.04678
Table 2. EBN production’s GHG emissions and the related coefficient.
Input (Unit)GHG Coefficient
(kgCo2eq Unit−1)
GHG Emissions (kgCo2eq Sqft−1)GHG Emission (%)
1. Electricity (kWh)0.608 [17]0.0702699.79
2. Pesticides (kg)5.10 [11,24]0.000150.21
Total GHG emissions (kg CO2eq.)5.7080.07041100
Table 3. Descriptive statistic for TE, PTE, and SE of EBN ranches.
ParticularCRS under CCR ModelVRS under BCC Model
TEPTESE
Average0.353610.930710.37199
SD0.292550.066260.29173
Min0.140000.729000.14400
Max1.000001.000001.00000
Source: Author estimation.
Table 4. Ranking for the 10 most efficient ranches in EBN production in Johor Bahru, Malaysia.
RankRanch No.Frequency in Referent Set
12379
24372
33761
44037
53935
64815
7410
8415
963
10363
Table 5. Amount of inputs and outputs for the 10 most efficient ranches and inefficient ranches.
Items (Unit)10 Most Efficient Ranches (MJ sqft−1)Inefficient Ranches (MJ Sqft−1)Difference (%)
A. Input.
1. Human labor (h)0.002720.0035924.13
2. Electricity (kWh)1.474231.47046−0.26
3. Water irrigation (m3)0.015600.015730.82
4. Pesticides (kg)0.002380.0031424.28
B. Output
1. Edible bird’s nest (kg)0.127280.04347−192.78
Table 6. Optimum energy requirement and energy savings for EBN production.
Items (Unit)Optimum Energy Requirement
(MJ Sqft−1)
Energy Saving (MJ Sqft−1)Energy Saving (%)Contribution to Total Energy Saving (%)
1. Human labor (h)0.001050.0022568.240.25
2. Electricity (kWh)0.498380.8802263.8598.47
3. Water irrigation (m3)0.005340.0093963.771.05
4. Pesticides (kg)0.000840.0020470.830.23
Total energy input (MJ)0.505610.8939163.87100
Table 7. Improvement of energy indices for EBN production.
Items (Unit)UnitPresent QuantityOptimum QuantityDifference (%)
Energy use efficiency910.470432520.16635176.80
Energy productivitykg MJ−158.17702161.03299176.80
Specific energyMJ kg−10.017190.00621−63.87
Net energyMJ sqft−11272.823481273.717390.07
Direct energy aMJ sqft−10.00330 (0.24)0.00105 (0.21)−68.24
Indirect Energy bMJ sqft−11.39622 (99.76)0.50456 (99.79)−63.86
Renewable Energy cMJ sqft−10.01803 (1.29)0.00639 (1.26)−64.59
Non-renewable Energy dMJ sqft−11.38149 (98.71)0.49923 (98.74)−63.86
Total Energy inputMJ sqft−11.39952 (100)0.50561 (100)−63.87
Note: a Includes human labor; b Includes electricity, water irrigation, and pesticides; c Includes human labor and water irrigation; d Includes electricity and pesticides. Number in parentheses indicate percentage of total optimum energy requirement.
Table 8. Optimum GHG emissions and reducing emissions for EBN production.
Items (Unit)Optimum GHG Emissions
(kgCo2eq Sqft−1)
Emission Reductions (kgCo2eq Sqft−1)Emissions Reduction (%) Contribution to Total Emissions Reduction (%)
1. Electricity (kWh)0.025400.0448663.8599.76
2. Pesticides (kg)0.000040.0001173.330.24
Total GHG emissions (kgCo2eq)0.025440.0449763.86100
Table 9. Tobit regression results on TE, PTE, and SE.
VariableTE PTE SE
Coefficientt-RatioCoefficientt-RatioCoefficientt-Ratio
C−6.76255 ***−3.064190.308320.31196−6.73695 ***−3.11295
Capital−0.05930−0.273270.026860.27529−0.07368−0.34631
Size0.056240.22803−0.17494−1.565460.102720.42478
Plank1.50957 ***4.651270.41069 ***2.803341.45602 ***4.57479
R20.473940.115190.49026
Adj. R20.459430.090790.47620
No. of Obs.150150150
Note: *** indicates significance at the 1% level.
Publisher’s Note: MDPI stays neutral with regard to jurisdictional claims in published maps and institutional affiliations.