Article

Microclimatic and Environmental Improvement in a Mediterranean City through the Regeneration of an Area with Nature-Based Solutions: A Case Study

1
Department of Architecture and Design (DAD), University of Genoa, 16124 Genoa, Italy
2
Department of Earth, Environment and Life Sciences (DISTAV), University of Genoa, 16124 Genoa, Italy
*
Author to whom correspondence should be addressed.
Sustainability 2022, 14(10), 5847; https://doi.org/10.3390/su14105847
Submission received: 22 March 2022 / Revised: 7 May 2022 / Accepted: 10 May 2022 / Published: 11 May 2022

Abstract

:
Dense urban areas are facing relevant issues related to their high vulnerability to the impacts of climate change and ecosystem health. The study presents a case study of a regeneration project with Nature-based Solutions in the city of Genoa (Italy) and, more specifically, in a neighbourhood characterised by relevant health and well-being issues. The performances of three design scenarios for a city hotspot, including plant species selected with a systemic approach and light pavements, are analysed in terms of improved microclimate by means of the ENVI-met software V4.4.5. The results show different benefits on the microclimate compared to the current state depending on the different scenarios: A UTCI decrease from 4.1 °C to 5.4 °C, a reduction of mean radiant temperature from 12.3 °C to 17.3 °C, a relative humidity increase from 3.8% to 5.6%, and a progressive decrease in wind speed are detected in a directly proportional way to the gradual increase in greenery inside the scenarios. In reverse, better results for air temperatures are detected for the scenario with less greening (Δt = 1.8 °C). The study relies on the re-parametrisation of plant species characteristics in the ENVI-met database to reach a high level of accuracy.

1. Introduction

Most cities are currently facing significant social, health, environmental, and economic challenges. Today, over two-thirds of the EU’s population live in urban areas, with a 80% of total energy use and over 70% of global CO2 emissions [1,2]. Today’s cities are characterised by a built and cemented area [3], which causes the degradation or disappearance of the pre-existing native green areas [4] and leads to the high vulnerability of cities to climate change effects, such as extreme weather events (heat waves, hurricanes and floods, sea level rise) [5,6].
Epidemiological studies carried out for some Italian cities (including the metropolitan city of Genoa) show a close correlation between UHI (Urban Heat Island) and mortality among the most vulnerable groups of the population (elderly, children, people with multimorbidity) [7,8,9,10], with a clear difference among the areas/districts of the city characterised by socio-economic inequalities [11,12,13]. The Italian National Heat Health Plan, the objective of which is to draft guidelines for the creation of a forecasting and prevention system for the effects of heat on health [14], plays a significant role in facing these issues [15].
The Heat Health Plan highlights importance of greenery within the urban fabric as a means to prevent chronic diseases such as diabetes, cardiovascular disease, and mental disorders [16,17,18].
Nature-based solutions (NbS)—i.e., solutions inspired by, continuously supported by, and using nature, designed to address various societal challenges in a resource-efficient and adaptable manner and to provide simultaneously economic, social, and environmental benefits [19]—inside the urban fabric can represent an important strategy to mitigate the effects of climate change and to improve urban environmental conditions (e.g., decrease in stormwater run-off, air quality improvement, increase in biodiversity) [20,21,22]. NbS can protect, sustainably manage, and restore natural or modified ecosystems, effectively and adaptively addressing societal challenges and simultaneously providing human well-being and biodiversity benefits [23,24]. NbS also need to be strategically distributed within the built environment to contribute to the creation of an ecological network [3].
The plant component of NbS provides a variety of ecosystem services—for instance, climate regulation by transpiration (i.e., release as vapour at the leaf level of the of water absorbed by roots), evaporation, shading, filtering of direct sunlight [25], control of air flows, and reduction of wind speed [26]; improvement of air quality through the sequestration of fine dust (e.g., PM2.5 and PM10) and gaseous air pollutants [27]; rainwater management as flood contrast [28]; and reduction of noise level [27]; biodiversity increase through the use of native species, the removal of invasive ones, and the choice of entomophilous species that ensure an increase in pollination [29].
The use of the plant component in urban areas can, however, be associated with ecosystem disservices: infrastructure damage, plant allergies or poisoning, spread of diseases, biogenic volatile organic compound emission, unpleasant odours, vision and traffic obstruction caused by trees, and invasive species [30,31]. Moreover, different stressful microenvironments within urban areas can affect plant life [32,33], altering trees’ natural defences in the long term and reducing carbohydrate reserves in the short term. In addition, complementary factors (e.g., phytopathogenic insects or fungi) may opportunistically invade the plant and eventually lead to its death [4].
Several studies also underline the importance of using high albedo coating materials to improve microclimatic conditions of urban environments [34,35], which allow light/reflective surfaces to store less heat than the darkest ones (e.g., dark asphalt) [36,37,38] and reduce the peak surface temperature by up to 20 °C [39].
In order to study the potential benefits on urban microclimate of NbS and light/reflecting surfaces, a widely used approach is to run simulations using the ENVI-met software [40]. Validations of the accuracy of the model results have been widely shown by several previous studies [41,42,43,44]. However, most of the microclimate studies carried out with ENVI-met have focused on wide urban areas [45,46,47,48] or on urban street canyons [38,49,50], whereas microscale studies are less frequent [51].
The ENVI-met V4.4.5 software allows models to be built with simple plants and 3D-plants. Simple plants essentially consist of simplified vegetation models, defined by plant height, 10-layer LAD, and 10-layer RAD [52]. 3D plants are digitized by the plant editing tool Albero, capable of digitising complex plant models (e.g., trees) using groups of cells with a LAD and a RAD [53]. In ENVI-met V4 and later versions, the 3D modelling of a plant requires more detailed data on the physical features compared to the previous version V3, which used simple vertical structures, similar to simple plants [41]. However, the software plant database of V4.4.5 lists only the most common plants—specifically, trees—and the plant properties partly match real data (e.g., crown dimension, total height, kind of foliage, seasonality) [54,55]; therefore, further research is needed increase the accuracy of simulations to evaluate the effects of NbS to identify effective strategies to improve citizen health and cities’ ecological functions.

Aims

The aim of the study is to evaluate the microclimatic effects of Nature-based Solutions on a dense city in the Mediterranean area and to optimise the ecosystem services provision by means of a targeted selection of plant species.
The study focuses on a microscale case study in order to fill the literature gap (i.e., few studies on such a scale). A methodology to increase the accuracy of simulations, taking into account the right plant dimensions and related performances, is also developed and tested as means to evaluate the effects of NbS at a small scale.
The main objectives of the study can be summarised as follows:
  • Evaluate the effects of different plant species and their arrangement to quantify, through simulations, the beneficial effects of greening and other technical solutions to counteract the UHI and maximise the ecosystem functions and the ecosystem services provision.
  • Quantify the potential microclimatic benefits of NbS in a small but critical and densely populated urban area, comparing different design scenarios.
  • Model the selected plant species with a high level of accuracy in terms of canopy shape, plant dimensions, and ecology.
  • Define the most effective strategy for the draft of a final design for a pilot redevelopment project.

2. Materials and Methods

The study evaluated the microclimatic effects of Nature-based Solutions in a case study in the city of Genoa (site characteristics in Section 2.1). Criteria for plant species selection are outlined in Section 2.2 and three different design scenarios are presented in Section 2.3. All scenarios were analysed by means of a microclimatic model (described in Section 2.4), in terms of environmental parameters, plant species parametrisation, and data analysis.

2.1. Study Site

Genoa is a densely built and populated city, with a mix of residential and industrial areas; most of the municipalities are coastal and are characterised by industrial and/or maritime activities [56]. Genoa presents an average annual population of approximately 591,000 people (in 2009–2020) on a surface of 240.29 km² and a population density of 2484.3 inhabitants/km² [12,57], of which 28.9% is composed of vulnerable people over 65, with an average age of 49.3 years [58].
Morabito et al., 2015 mapped the HERI (Heat-related Elderly Risk Index) in the summer period for some of the main Italian cities, including Genoa, identifying the urban area of Genoa Cornigliano (Municipio VI) as the one with the most dangerous HERI level compared to the rest of the city [10]. In addition, Contiero et al. 2021 [12] identified Cornigliano as the district with the highest SMRs (standardised mortality ratios) of Genoa, with an overall increase in SDRs (standardised death rates) of 24.5% for the entire city between 2019 and 2020 [12].
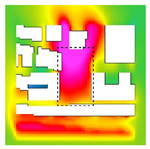
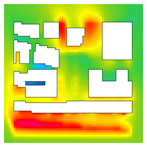
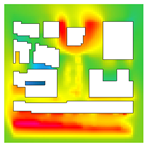
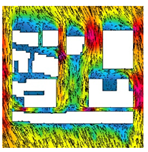
Based on these results, [59] examined the microclimatic characteristics of some specific areas of the Cornigliano district with the aid of the ENVI-met software V4.4.5. the results highlighted various critical issues for a hot summer day (Figure 1) in terms of air temperature (1 August 2020, 2:00 p.m., Tair = 31.5 °C), mean radiant temperature (1 August 2020, 2:00 p.m., Tmr = 65 °C), and UTCI (Universal Thermal Climate Index), which presented peaks of over 41 °C in the hottest hours [59].
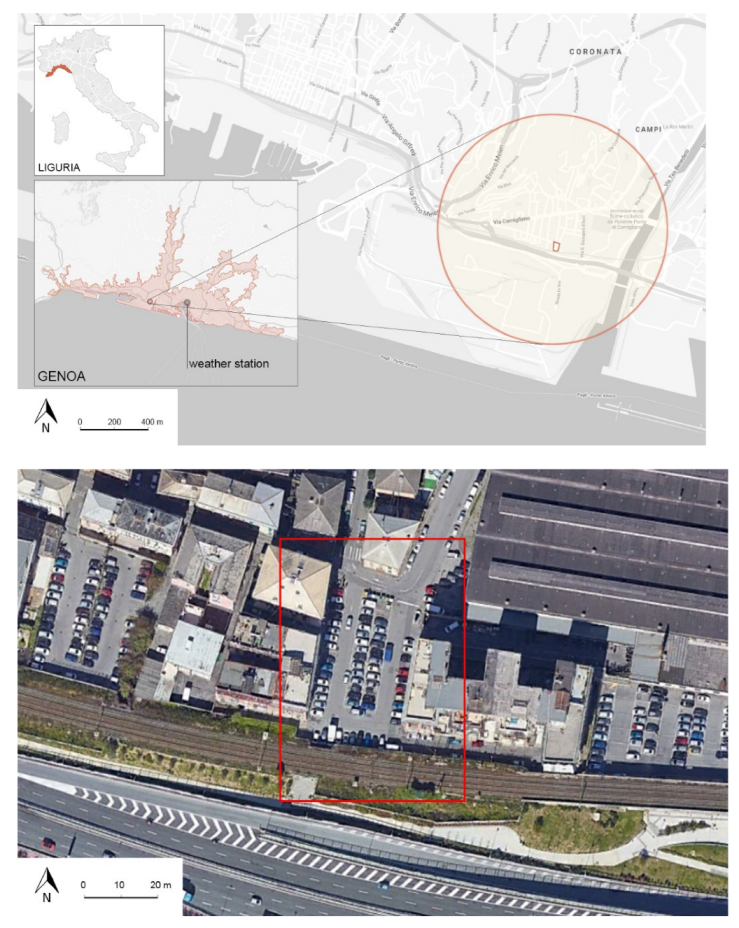
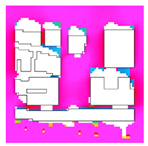
Considering microclimate and HERI data collected, and the preferences reported by the Municipality of Genoa, a specific area in the Cornigliano district was selected for a pilot redevelopment project. The project site (Figure 2), corresponding to Piazza Pietro Metastasio (44°24′49.80″ N 8°52′17.26″ E), is located in a densely built area closed to a factory (this latter is bordered by residential buildings, around 20 m in height) with a dark asphalt coating and is currently used as parking.

2.2. Criteria for Plant Selection

As regards the selection of plant species for planting at the pilot site, a checklist of criteria was prepared considering the ecosystem services provided and the urban context, with attention to the mitigation of the heat island effect (Table 1).
Other key aspects to be considered for the plant species choice are a stratification of vegetation to achieve a large amount of planned and associated biodiversity [62] and a benefit in terms of microclimate mitigation [63]; an appropriate number of arboreal, shrubby, and herbaceous species, avoiding both monospecificity and excessive diversity [61]; and the use of indigenous species to prevent the spread of invasive alien species [64,65].
In addition, a monitoring of the green areas surrounding the pilot site was carried out to identify the species used in the existing green areas. To maximise connectivity, a list of autochthonous species within the pilot site, consistent with the climate context, was drawn up.
The characteristic and properties of the selected species to set up the ENVI-MET simulations were collected, specifically regarding shape and size. In accordance with local data, several plant parameters were checked and modified to obtain a more realistic shape and performance. In general, it is assumed that in such an environment the plants will be different in size and shape from the best possible conditions of rearing mainly due to the influence of air pollution, which with the action of PM10 seems to reduce the growth rate of trees [66].

2.3. Design Scenarios

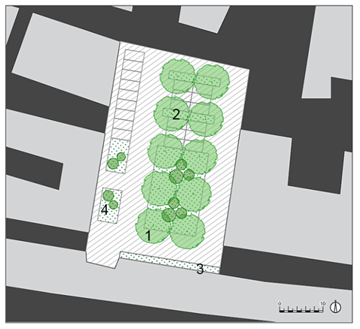
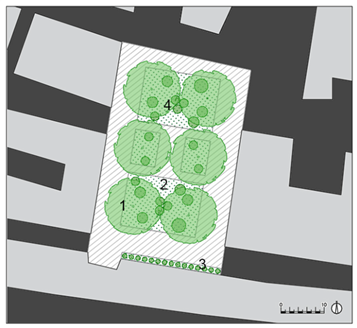
Three scenarios were designed and analysed (Table 2). They were schematically based on the progressive increase in the percentage of biomass and high albedo pavements within the investigated area. Furthermore, the quantity of biomass of the selected plant species and the size of the tree species crowns were important elements for their application within the scenarios (e.g., tree species with smaller crowns were included in scenario 1, species with wider crowns in scenario 3).
The material chosen for the ground was light concrete pavement, which has an albedo coefficient 0.8 and emissivity 0.9 (reported values in the data sheet of the material on ENVI-met). The use of this pavement material in the different scenarios is shown in Table 2.

2.4. Microclimatic Model

2.4.1. Model Dimensions

The dimensions of the simulated scenarios were approximately 120 × 120 m, with project site dimensions (i.e., Pietro Metastasio square) of 30 × 50 m. A grid of cells with dimensions 120 × 120 × 40 (height), with the size of the grid cells 2.00 × 2.00 m, was therefore set on the ENVI-met Spaces module for the simulations.

2.4.2. Environmental Parameters

All weather and climate data used for the simulations were collected from the Meteorological Historical Observatory of the University of Genoa (44°24′53.37” N 8°55′35.99” E) for the years 2002–2020. All hourly data of temperature (min, max, mean), rain (cumulative), wind (direction, speed min, max, mean gusts), humidity (min, max, mean), pressure (min, max, mean), instant solar radiation (min, max, mean), and integral solar radiation (min, max, mean) were extracted from the weather database. To provide input data for the ENVI-met software, all the days exceeding the 95th percentile of mean temperature in the last 20 years were first selected, and then the hottest day among these were picked to simulate the worst possible scenarios.
The hottest day, selected as input data for the microclimatic model, was 5 August 2003 (Table 3), and specifically, the range of 13:00–15:00 h (i.e., the hours with the greatest direct solar radiation on surfaces) was considered for the microclimate simulations in ENVI-met. Regarding the choice of summer 2003, an excess of mortality for elderly persons (>74 years) in the city of Genoa for the period of July–August 2003 was reported, with the greatest correlation between the number of observed deaths, causes of death, and the maximum temperature values [9]. In addition, for the Central–Western European areas, for August 2003, studies showed an increase in UTCI (Universal Thermal Climate Index) values up to 10 °C above the seasonal average and heat stress up to 2 categories above the seasonal average [67].
To carry out a microclimatic survey able to accurately simulate the meteorological conditions regarding the different scenarios and the relative comfort and discomfort thermal conditions, a series of parameters were extracted from each simulation and compared with each other: air temperature, mean radiant temperatures, relative humidity, wind speed, and the UTCI. In particular, the thermal comfort was evaluated through the UTCI parameter (Universal Thermal Comfort Index), as suggested by EU COST Action 730 [59,68]. The UTCI is a bioclimatic index that considers the relationships between meteorological conditions such as air temperature, mean radiant temperature, air relative humidity, wind speed, and water vapour pressure to represent the thermal stress induced by them on the human body [67].

2.4.3. Plant Species Parametrisation

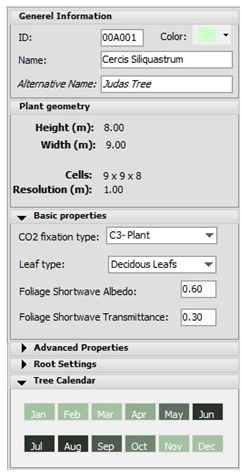
ENVI-met V4.4.5 takes into account shading and evapotranspiration to evaluate the effect of vegetation on different microclimatic parameters. The plant species (i.e., trees, shrubs) available in the ENVI-met database (accessed in September 2021) often showed clear differences compared to the characteristics of the species in most of the nursery catalogues [69] (e.g., differences related to the overestimated size, seasonality, leaf type). The database does not include some of the selected species for simulations, especially shrub and herbaceous species (e.g., Cistus monspeliensis L., Phillyrea angustifolia L., Festuca glauca Blaufuchs, Salvia leucantha “Waverly” Cav.), and part of the data stored, with regard to the tree component, are not coherent with the characteristics (e.g., evergreen or deciduous) and dimensions of the plants [69].
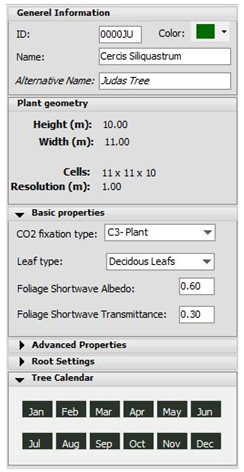
Considering these issues, the database was expanded by inserting all the species selected for the simulations, with the related data collected from the nursery sheets [69]. In terms of plant dimensions, the standard dimensions registered in the database correspond to the maximum dimensions reachable by the species in its natural environment; however, reaching those dimensions is difficult in urban areas due to the stresses to which it is subjected (e.g., pollution, excessive heat, lack of sufficient ground space; see an example of comparison between existing and new species in Table 4).
A comparison test for scenario 3 (i.e., maximum greening) was performed a priori (on 5 August 2003, 13:00 h) to verify the gap between the outputs of the simulations with the ENVI-met default plant species and the re-parametrised and/or newly inserted species.

2.4.4. Data Analysis

The statistical analyses were performed with Statistica 8.0 (Statsoft Inc., Tulsa, OK, USA) software.
One-way ANOVA with Tukey post-hoc test was performed to evaluate significant differences among the thermal comfort parameters in the three greening scenarios, using p < 0.05 as statistically significant. Data are presented as average ± standard deviation.
Pearson’s correlations between thermal comfort variables and plant coverage within the three scenarios of simulation were analysed using p < 0.05 to indicate statistical significance.

3. Results and Discussion

Table 5 reports the first list of the plant species, following the criteria highlighted in Table 1. Among them, only the ones that matched most of the criteria were included in the scenarios (and therefore inserted in the ENVI-met user database) as the best ones in terms of the required characteristics.
Specifically, Cercis siliquastrum L. was included in the first two scenarios. It is a deciduous species widely used in urban environments. Jacaranda mimosifolia D. Don. (scenario 3) is an exotic, allochthonous, non-invasive species largely used in urban green areas and allowed by local regulations [60].
As for the shrub component, greater importance was given to the choice of species with a strong rusticity and adaptability to various stress conditions, as well as to the choice of an evergreen species that can ensure shading and sequestration of pollutants in winter, when trees lose their leaves. The selected species used for scenario 3 is typical of the local flora, of Mediterranean character, such as Cistus monspeliensis L., Phillyrea angustifolia L., Pistacia lentiscus L., and Viburnum tinus L. The herbaceous layer, to support connectivity and maximise ecosystem services, can be obtained by the presence of a herbaceous layer with a continuous cover of wildflowers, or by planting other herbaceous species such as Festuca glauca Vill.
Finally, it is important to also include climbers covering vertical surfaces. Hedera helix L. was chosen because it is consistent with the climatic context and is able to suckle the larvae of insects as well as entomophilous pollinators.
The outputs of the microclimatic simulations showed significant differences among the scenarios analysed. All the data were extracted at 1.4 m height except for mean radiant temperature, which consisted of h = 0.2 m.
The air temperature analysis for Piazza Pietro Metastasio (Table 6 and Table 7) showed an overall decrease of 1.5–2 °C compared to the current state (t max = 34.4 °C). Specifically, the data showed a significantly greater decrease for the first scenario (i.e., with less greening and light pavements, t max = 32.6 °C, Δt = 1.8 °C) compared to the two scenarios with greater greening and light pavements (t max= 33.2 °C, Δt = 1.2 °C), corresponding to the tree crowns (Table 6). The increase in air temperature in scenarios 2 and 3 (i.e., with greater greening) compared to scenario 1 may have been due to the lesser ventilation of the area caused by the presence of the gradual vegetation amounts in the scenarios, which could have reduced the wind flow [70,71,72].
The mean radiant temperature decreased considerably corresponding to the combination of different layers of herbaceous plants, shrubs, and trees, with an evident significant difference between scenario 1 and scenario 3 (Table 6 and Table 7). I current state revealed temperatures over 65.7 °C, instead of temperatures of 53.4 °C for scenario 1, corresponding to the tree crowns (ΔtT = 12.3 °C); of 49.4 °C for scenario 2, corresponding to the south herbaceous shrub cover (Δt = 16.3 °C); and of 48.4 °C for scenario 3, corresponding to the north and south herbaceous shrub covers (Δt = 17.3 °C), in accordance with [73], who highlighted that grass cover significantly decreases the mean radiant temperature. It is indeed known that lawn grass can effectively reduce the overall ground surface temperature [74] and can contribute to the decrease in air temperature thanks to the homogeneous, permeable coverage that allows the heat exchange between soil and atmosphere. In addition, [75] also documented a cooling ability in terms of surface temperature decrease by different plant layers with the sequence lawn > shrubs > trees.
It is worth mentioning that our results on the shrub layer could have been affected by the re-parametrisation of the chosen species, which could have shown missing values from the default software database, resulting in a bias.
Relative humidity showed an increase from 39.2% for the current state up to 43.0% (Δt = 3.8%) for scenario 1, up to 44.0% for scenario 2 (Δt = 4.8%), and up to 44.8% for scenario 3 (Δt = 5.6%) (Table 6), related to the proportional increase of the biomass and tree crown size in the scenarios, but did not show any significant correlation with the coverage by the different plant layers (Table 8). Specifically, the maximum greening scenario (scenario 3) for the amount and dimension of plant species (e.g., higher trees with larger canopies compared to scenarios 1 and 2) had a less important effect on air temperature, but higher relative humidity.
Wind speed was significantly negatively correlated (p < 0.01, r = −0.93 for total plant coverage%) with the different percentage of coverage by plant layers (herbaceous layer r = −0.93; shrub layer r = −0.94, tree layer r = −0.83; p < 0.01; Table 8), proportionally decreasing with the increase in greenery (Table 6 and Table 7) from approximately 0.9–1.0 m/s for the current state to 0.7–0.8 m/s for scenario 1, 0.5 m/s for scenario 2, and down to 0.3–0.4 m/s for scenario 3, especially in the centre of the square, where the trees, able to create a wind barrier [26], are located. Several studies also showed the role of wind on the urban microclimate, although there may be many factors that can affect it [70,72,76,77]. However, no worsening of the UTCI, linked to the wind speed decrease, was detected. This result could be related to the trapping effect of trees, as supported by the positive correlation between air temperature and plant coverage (Table 8). Regarding this aspect, studies show that the use of greenery in urban environments is useful for air temperature mitigation, but also highlight the influence of the landscaping design to reach a climatic improvement, e.g., spatial distribution of vegetation within the selected area, type of vegetation, analysis of urban characteristics, and specific climate conditions [78,79,80].
The UTCI showed an overall decrease for all scenarios (Table 6 and Table 7), going from a temperature of 41.3 °C to 42.0 °C for the current state, down to 37.9 °C for scenario 1 (corresponding to the tree crowns), 36.7 °C for scenario 2 (corresponding to the south herbaceous shrub cover), and 36.6 °C for scenario 3 (corresponding to the north and south herbaceous shrub covers). The difference in temperature in scenario 1 was Δt = 4.1 °C, in scenario 2 was Δt = 5.3 °C, and in scenario 3 was Δt = 5.4 °C, compared to the current state.
An interesting result is related to the UTCI and mean radiant temperature decreases for scenarios 2 and 3, in which layered vegetation (i.e., grass, shrubs, trees) were used in combination with light paving. The difference in temperature in the area with herbaceous coverings and shrubs was Δt = 5.4 °C for the UTCI and for mean radiant temperature was Δt = 17.3 °C. The combination of the use of light pavements and vegetation is therefore a good strategy to fight urban overheating, as found by similar results of other studies (e.g., [39,50]). The reduction of mean radiant temperature results in a reduction of the UTCI, as also reported by Perini et al. [81].
Since studies show that with a mortality increase due to moderate and strong stress with a UTCI exceeding 26 and 32 °C [67], the maximum UTCI decreasing from 42 °C (current state) to 37 °C (scenario 3), reached thanks to the design scenarios assumed, would seem to not be enough. However, it is worth mentioning that the simulations refer to the hottest day recorded in Genoa in the last 20 years. To further improve thermal comfort, the integration of various types of NbS is advisable for the whole neighbourhood.
In general, the best results in terms of microclimatic benefit were obtained where a certain degree of vegetation stratification was achieved. In addition, the use of herbaceous and shrub species is essential in terms of supporting local biodiversity.
Furthermore, a correlation between the geometry of the tree (height, shape, and width of the crown) and the localized effect of the benefits under the crown can be found in all scenarios analysed (as also reported by [50]). Therefore, the identification and use of correct geometry-related parameters for the simulations seems very relevant.
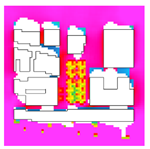
The t-test for independent samples (Figure 3) between standard default settings of the ENVI-met versus re-parametrised plant data in scenario 3 (maximum greening, as described in Section 2.4.3) within two different points showed highly significant differences in point A for all the microclimatic data (p < 0.01) (Table 9). With the default settings, the air temperature was lower than 0.2 °C at the tree crowns (Table 9). A maximum difference in wind speed up to 0.15 m/s (point A) was also noticed between the two analyses. These results could be related to the different height and shape of the trees (Jacaranda mimosifolia) in the two simulations (trees in the default database were 3 m higher and the crown was 2 m tighter than the re-parametrised ones). At the flowerbed level (layer covered by wildflowers and shrubs) the mean radiant temperature was up to 6.0 °C higher with default vegetation compared to the re-parametrised data (point A), whereas the UTCI was up to 1.5 °C higher (point A). These outcomes could be related to the default database manager (Albero component) that showed a strong bias in relation to the poor shrub characterisation and differentiation (i.e., only two species and related parameters are listed), as also mentioned by Yilmaz et al. [54]. These findings support the importance of creating accurate models to obtain realistic simulations at microscale.

4. Conclusions

The study shows the microclimatic effects of a small-scale regeneration project in the city of Genoa, more specifically, in a dense urban area in Mediterranean areas characterised by relevant well-being and health issues (i.e., with high HERI and SMRs). Design scenarios with NbS, using a targeted selection of plant species, were designed and their microclimatic performances simulated by means of the software ENVI-met.
The main conclusions of the study are the following:
  • Different design scenarios with selected plant species, compared with the current state (no NbS), can play a key role in improving microclimatic conditions during summer (hot day) and thermal comfort, mitigating air temperature (up to 1.8 °C for the scenario with the less greening, with herbaceous and tree layers), mean radiant temperature (up to 17.3 °C for the scenario with the maximum greening with herbaceous, shrub, and tree layers), and increasing relative humidity (up to 5.6% for the scenario with the maximum greening), resulting in a relevant improvement in the UTCI (up to 5.4 °C for the scenario with maximum greening), despite the air flow reduction (up to 0.3 m/s less for the scenario with maximum greening). It is worth mentioning that the mean radiant temperature in scenario 3 (maximum greening) was <5.0 °C compared to scenario 1 (minimal greening), corresponding to the trees layer and flower beds. Overall, the type and coverage percentage of plant layers plays a key role in all microclimate parameters except for relative humidity.
  • The re-parametrisation of the plant species characteristics in the ENVI-met database is fundamental to reach a high level of accuracy, as demonstrated by the significant differences highlighted when comparing a simulation with standard values and a simulation with a re-parametrisation of all the plant species (ΔT = 5.4 °C for punctual mean radiant temperature for scenario 3 with the maximum greening).
  • Plant species can be selected with a systemic approach to maximise the ecosystem functions and the ecosystem services provision.
The study allowed the most effective design strategy to be selected for the drafting of a final design for a pilot redevelopment project. The most effective was the scenario with the highest coverage by herbaceous, shrub, and tree layers, in combination with light pavements (3); however, the other scenarios with less greening and light pavements also provided less but significant microclimate benefits and can be applied, implying less economic effort for local administrations.

Author Contributions

Conceptualisation, E.R. and K.P.; methodology, E.R. and K.P.; validation, P.C. and C.C.; formal analysis, E.R. and P.C.; investigation, C.C. and P.C.; resources, E.R.; data curation, E.R. and K.P.; writing—original draft preparation, C.C. and P.C.; writing—review and editing, E.R. and K.P.; visualisation, E.R. and P.C.; project administration, E.R. and K.P.; funding acquisition, E.R. All authors have read and agreed to the published version of the manuscript.

Funding

This research was funded by the National Centre for Disease Prevention and Control CCM 2019, Project CLIMACTIONS Adattamento e mitigazione ai Cambiamenti CLIMAtici: intervenTI urbani per la promOzioNe della Salute. CUP: G39C20000030001.

Informed Consent Statement

Not applicable.

Data Availability Statement

Not applicable.

Acknowledgments

The authors wish to thank E. Mora for the scientific support and QUALIVIVA Project promoted by the Ministero delle Politiche Agricole Alimentari e Forestali for the tree data used for plant re-parametrisation.

Conflicts of Interest

The authors declare no conflict of interest.

References

  1. European Commission Urban Development. Available online: https://ec.europa.eu/regional_policy/en/policy/themes/urban-development/ (accessed on 26 November 2021).
  2. Edenhofer, O.; Pichs-Madruga, R.; Sokona, Y.; Agrawala, S.; Bashmakov, I.A.; Blanco, G.; Broome, J.; Bruckner, T.; Brunner, S.; Bustamante, M.; et al. Summary for Policymakers; Cambridge University Press: Cambridge, UK, 2014. [Google Scholar]
  3. Jim, C.Y. Green-Space Preservation and Allocation for Sustainable Greening of Compact Cities. Cities 2004, 21, 311–320. [Google Scholar] [CrossRef]
  4. Fini, A.; Ferrini, F. Influenza Dell’ambiente Urbano Sulla Fisiologia e La Crescita Degli Alberi. Italus Hortus 2007, 14, 9–24. [Google Scholar]
  5. IPCC Global Warming of 1.5 °C. Available online: https://www.ipcc.ch/sr15/ (accessed on 26 November 2021).
  6. WEF The Global Risks Report 2020. Available online: https://www.weforum.org/reports/the-global-risks-report-2020/ (accessed on 26 November 2021).
  7. Michelozzi, P.; De’ Donato, F.K.; Bargagli, A.M.; D’Ippoliti, D.; De Sario, M.; Marino, C.; Schifano, P.; Cappai, G.; Leone, M.; Kirchmayer, U.; et al. Surveillance of Summer Mortality and Preparedness to Reduce the Health Impact of Heat Waves in Italy. Int. J. Environ. Res. Public. Health 2010, 7, 2256–2273. [Google Scholar] [CrossRef] [PubMed]
  8. De’Donato; Leone, M.; Stafoggia, M.; Marino, C.; Fabrizi, R.; Michelozzi, P. Urban Heat Island and Socio-Economic Position as Factors that Increase the Risk of Heat-Related Mortality in Rome, Italy. ISEE Conf. Abstr. 2011. [Google Scholar] [CrossRef]
  9. Conti, S.; Masocco, M.; Meli, P.; Minelli, G.; Palummeri, E.; Solimini, R.; Toccaceli, V.; Vichi, M. General and Specific Mortality among the Elderly during the 2003 Heat Wave in Genoa (Italy). Environ. Res. 2007, 103, 267–274. [Google Scholar] [CrossRef]
  10. Morabito, M.; Crisci, A.; Gioli, B.; Gualtieri, G.; Toscano, P.; Stefano, V.D.; Orlandini, S.; Gensini, G.F. Urban-Hazard Risk Analysis: Mapping of Heat-Related Risks in the Elderly in Major Italian Cities. PLoS ONE 2015, 10, e0127277. [Google Scholar] [CrossRef] [Green Version]
  11. Alaimo, L.S.; Ivaldi, E.; Landi, S.; Maggino, F. Measuring and Evaluating Socio-Economic Inequality in Small Areas: An Application to the Urban Units of the Municipality of Genoa. Socioecon. Plann. Sci. 2021, 101170. [Google Scholar] [CrossRef]
  12. Contiero, P.; Tagliabue, G.; Tittarelli, A.; Bertoldi, M.; Tresoldi, C.; Barigelletti, G.; Perotti, V.; Balbo, V.; Rizzieri, S.; D’Orazi, M.; et al. Municipality Data as a Rapid and Effective Tool to Analyse Spatial and Temporal Variations of All-Cause Mortality by Town District: The Experience in Genoa (Italy). Int. J. Environ. Res. Public. Health 2021, 18, 8250. [Google Scholar] [CrossRef]
  13. Vercelli, M.; Lillini, R. Application of Socio-Economic and Health Deprivation Indices to Study the Relationships between Socio-Economic Status and Disease Onset and Outcome in a Metropolitan Area Subjected to Aging, Demographic Fall and Socio-Economic Crisis. J. Prev. Med. Hyg. 2021, 62, E718–E727. [Google Scholar] [CrossRef]
  14. Ministero della Salute Piano Nazionale per la Prevenzione Degli Effetti Del Caldo Sulla Salute. Available online: https://www.salute.gov.it/portale/caldo/dettaglioContenutiCaldo.jsp?area=emergenzaCaldo&id=408&lingua=italiano&menu=vuoto (accessed on 14 February 2022).
  15. De’Donato, F.; Scortichini, M.; De Sario, M.; de Martino, A.; Michelozzi, P. Temporal Variation in the Effect of Heat and the Role of the Italian Heat Prevention Plan. Public Health 2018, 161, 154–162. [Google Scholar] [CrossRef]
  16. Ccm Adattamento e Mitigazione Ai Cambiamenti CLIMAtici: IntervenTI Urbani per La PromOzioNe Della Salute—CLIMACTIONS CCM—Network. Available online: https://www.ccm-network.it/progetto.jsp?id=node/2021&idP=740 (accessed on 14 February 2022).
  17. Macintyre, H.L.; Heaviside, C. Potential Benefits of Cool Roofs in Reducing Heat-Related Mortality during Heatwaves in a European City. Environ. Int. 2019, 127, 430–441. [Google Scholar] [CrossRef] [PubMed]
  18. WHO. Urban Green Spaces and Health; World Health Organization, Regional Office for Europe: Copenhagen, Denmark, 2016. [Google Scholar]
  19. European Commission. Towards an EU Research and Innovation Policy Agenda for Nature-Based Solutions & Re-Naturing Cities: Final Report of the Horizon 2020 Expert Group on ’Nature Based Solutions and Re Naturing Cities’: (Full Version); Publications Office of the European Union: Louxemburg, 2015; ISBN 978-92-79-46051-7. [Google Scholar]
  20. EEA. EEA Report No 1/2021, Nature-Based Solutions in Europe. Available online: https://www.eea.europa.eu/publications/nature-based-solutions-in-europe (accessed on 26 November 2021).
  21. Gago, E.J.; Roldan, J.; Pacheco-Torres, R.; Ordóñez, J. The City and Urban Heat Islands: A Review of Strategies to Mitigate Adverse Effects. Renew. Sustain. Energy Rev. 2013, 25, 749–758. [Google Scholar] [CrossRef]
  22. Lee, H.; Mayer, H.; Chen, L. Contribution of Trees and Grasslands to the Mitigation of Human Heat Stress in a Residential District of Freiburg, Southwest Germany. Landsc. Urban Plan. 2016, 148, 37–50. [Google Scholar] [CrossRef]
  23. Cohen-Shacham, E.; Walters, G.; Janzen, C.; Maginnis, S. (Eds.) Nature-Based Solutions to Address Global Societal Challenges; IUCN International Union for Conservation of Nature: Gland, Switzerland, 2016; ISBN 978-2-8317-1812-5. [Google Scholar]
  24. Sowińska-Świerkosz, B.; García, J. What Are Nature-Based Solutions (NBS)? Setting Core Ideas for Concept Clarification. Nat.Based Solut. 2022, 2, 100009. [Google Scholar] [CrossRef]
  25. Morakinyo, T.E.; Kong, L.; Lau, K.K.-L.; Yuan, C.; Ng, E. A Study on the Impact of Shadow-Cast and Tree Species on in-Canyon and Neighborhood’s Thermal Comfort. Build. Environ. 2017, 115, 1–17. [Google Scholar] [CrossRef]
  26. Perini, K.; Chokhachian, A.; Auer, T. Green Streets to Enhance Outdoor Comfort. In Nature Based Strategies for Urban and Building Sustainability; Elsevier: Amsterdam, The Netherlands, 2018; pp. 119–129. ISBN 978-0-12-812150-4. [Google Scholar]
  27. Pereira, P.; Inácio, M.; Karnauskaitė, D.; Bogdzevič, K.; Gomes, E.; Kalinauskas, M.; Barcelo, D. Nature-Based Solutions Impact on Urban Environment Chemistry: Air, Soil, and Water. In The Handbook of Environmental Chemistry; Springer: Berlin/Heidelberg, Germany, 2021. [Google Scholar]
  28. Davies, H.J.; Doick, K.J.; Hudson, M.D.; Schreckenberg, K. Challenges for Tree Officers to Enhance the Provision of Regulating Ecosystem Services from Urban Forests. Environ. Res. 2017, 156, 97–107. [Google Scholar] [CrossRef] [PubMed] [Green Version]
  29. Johnson, L.; Handel, S. Restoration Treatments in Urban Park Forests Drive Long-Term Changes in Vegetation Trajectories. Ecol. Appl. 2016, 26, 940–956. [Google Scholar] [CrossRef]
  30. Von Döhren, P.; Haase, D. Risk Assessment Concerning Urban Ecosystem Disservices: The Example of Street Trees in Berlin, Germany. Ecosyst. Serv. 2019, 40, 101031. [Google Scholar] [CrossRef]
  31. Tian, Y.; Wu, H.; Zhang, G.; Wang, L.; Zheng, D.; Li, S. Perceptions of Ecosystem Services, Disservices and Willingness-to-Pay for Urban Green Space Conservation. J. Environ. Manag. 2020, 260, 110140. [Google Scholar] [CrossRef]
  32. Boselli, M. Ecosistemi Urbani Ed Adattabilità Delle Specie Vegetali. Acer 1989, 6, 15–19. [Google Scholar]
  33. Noè, N. Ambiente Urbano e Adattabilità Della Specie. Folia di Acer 1996, 2, a9–a11. [Google Scholar]
  34. Santamouris, M.; Synnefa, A.; Karlessi, T. Using Advanced Cool Materials in the Urban Built Environment to Mitigate Heat Islands and Improve Thermal Comfort Conditions. Sol. Energy 2011, 85, 3085–3102. [Google Scholar] [CrossRef]
  35. Carnielo, E.; Zinzi, M. Optical and Thermal Characterisation of Cool Asphalts to Mitigate Urban Temperatures and Building Cooling Demand. Build. Environ. 2013, 60, 56–65. [Google Scholar] [CrossRef]
  36. Doulos, L.; Santamouris, M.; Livada, I. Passive Cooling of Outdoor Urban Spaces. The Role of Materials. Sol. Energy 2004, 77, 231–249. [Google Scholar] [CrossRef]
  37. Akbari, H.; Matthews, H.D. Global Cooling Updates: Reflective Roofs and Pavements. Energy Build. 2012, 55, 2–6. [Google Scholar] [CrossRef]
  38. Faragallah, R.N.; Ragheb, R.A. Evaluation of Thermal Comfort and Urban Heat Island through Cool Paving Materials Using ENVI-Met. Ain Shams Eng. J. 2022, 13, 101609. [Google Scholar] [CrossRef]
  39. Qin, Y. A Review on the Development of Cool Pavements to Mitigate Urban Heat Island Effect. Renew. Sustain. Energy Rev. 2015, 52, 445–459. [Google Scholar] [CrossRef]
  40. Tsoka, S.; Tsikaloudaki, A.; Theodosiou, T. Analyzing the ENVI-Met Microclimate Model’s Performance and Assessing Cool Materials and Urban Vegetation Applications–A Review. Sustain. Cities Soc. 2018, 43, 55–76. [Google Scholar] [CrossRef]
  41. Liu, Z.; Cheng, W.; Jim, C.Y.; Morakinyo, T.E.; Shi, Y.; Ng, E. Heat Mitigation Benefits of Urban Green and Blue Infrastructures: A Systematic Review of Modeling Techniques, Validation and Scenario Simulation in ENVI-Met V4. Build. Environ. 2021, 200, 107939. [Google Scholar] [CrossRef]
  42. Alsaad, H.; Hartmann, M.; Hilbel, R.; Voelker, C. ENVI-Met Validation Data Accompanied with Simulation Data of the Impact of Facade Greening on the Urban Microclimate. Data Brief 2022, 42, 108200. [Google Scholar] [CrossRef]
  43. Morakinyo, T.E.; Lam, Y.F. Simulation Study on the Impact of Tree-Configuration, Planting Pattern and Wind Condition on Street-Canyon’s Micro-Climate and Thermal Comfort. Build. Environ. 2016, 103, 262–275. [Google Scholar] [CrossRef]
  44. Yilmaz, S.; Mutlu, B.E.; Aksu, A.; Mutlu, E.; Qaid, A. Street Design Scenarios Using Vegetation for Sustainable Thermal Comfort in Erzurum, Turkey. Environ. Sci. Pollut. Res. 2021, 28, 3672–3693. [Google Scholar] [CrossRef] [PubMed]
  45. McRae, I.; Freedman, F.; Rivera, A.; Li, X.; Dou, J.; Cruz, I.; Ren, C.; Dronova, I.; Fraker, H.; Bornstein, R. Integration of the WUDAPT, WRF, and ENVI-Met Models to Simulate Extreme Daytime Temperature Mitigation Strategies in San Jose, California. Build. Environ. 2020, 184, 107180. [Google Scholar] [CrossRef]
  46. Gusson, C.S.; Duarte, D.H.S. Effects of Built Density and Urban Morphology on Urban Microclimate—Calibration of the Model ENVI-Met V4 for the Subtropical Sao Paulo, Brazil. Procedia Eng. 2016, 169, 2–10. [Google Scholar] [CrossRef]
  47. Cortes, A.; Rejuso, A.J.; Santos, J.A.; Blanco, A. Evaluating Mitigation Strategies for Urban Heat Island in Mandaue City Using ENVI-Met. J. Urban Manag. 2022, 11, 97–106. [Google Scholar] [CrossRef]
  48. Yang, J.; Hu, X.; Feng, H.; Marvin, S. Verifying an ENVI-Met Simulation of the Thermal Environment of Yanzhong Square Park in Shanghai. Urban For. Urban Green. 2021, 66, 127384. [Google Scholar] [CrossRef]
  49. Qaid, A.; Ossen, D.R. Effect of Asymmetrical Street Aspect Ratios on Microclimates in Hot, Humid Regions. Int. J. Biometeorol. 2015, 59, 657–677. [Google Scholar] [CrossRef]
  50. Lobaccaro, G.; Acero, J.A. Comparative Analysis of Green Actions to Improve Outdoor Thermal Comfort inside Typical Urban Street Canyons. Urban Clim. 2015, 14, 251–267. [Google Scholar] [CrossRef]
  51. Crank, P.J.; Sailor, D.J.; Ban-Weiss, G.; Taleghani, M. Evaluating the ENVI-Met Microscale Model for Suitability in Analysis of Targeted Urban Heat Mitigation Strategies. Urban Clim. 2018, 26, 188–197. [Google Scholar] [CrossRef]
  52. Huttner, S. Further Development and Application of the 3D Microclimate Simulation ENVI-Met. Ph.D. Thesis, Johannes Gutenberg-Universität Mainz, Mainz, Germany, 2012. [Google Scholar]
  53. Simon, H. Modeling Urban Microclimate: Development, Implementation and Evaluation of New and Improved Calculation Methods for the Urban Microclimate Model ENVI-Met. Ph.D. Thesis, Johannes Gutenberg-Universität Mainz, Mainz, Germany, 2016. [Google Scholar]
  54. Yilmaz, S.; Külekçi, E.A.; Mutlu, B.E.; Sezen, I. Analysis of Winter Thermal Comfort Conditions: Street Scenarios Using ENVI-Met Model. Environ. Sci. Pollut. Res. 2021, 28, 63837–63859. [Google Scholar] [CrossRef]
  55. Liu, Z.; Zheng, S.; Zhao, L. Evaluation of the ENVI-Met Vegetation Model of Four Common Tree Species in a Subtropical Hot-Humid Area. Atmosphere 2018, 9, 198. [Google Scholar] [CrossRef] [Green Version]
  56. Comune di Genova I Municipi Comune Di Genova. Available online: http://www.comune.genova.it/content/i-municipi-del-comune-di-genova (accessed on 1 February 2022).
  57. Comune di Genova Comune Di Genova. Available online: http://statistica.comune.genova.it/municipi/municipi.php (accessed on 1 February 2022).
  58. ISTAT ISTAT Indicatori Demografici. Available online: http://dati.istat.it/viewhtml.aspx?il=blank&vh=0000&vf=0&vcq=1100&graph=0&view-metadata=1&lang=it&QueryId=18462# (accessed on 1 February 2022).
  59. Mosca, F.; Dotti Sani, G.M.; Giachetta, A.; Perini, K. Nature-Based Solutions: Thermal Comfort Improvement and Psychological Wellbeing, a Case Study in Genoa, Italy. Sustainability 2021, 13, 11638. [Google Scholar] [CrossRef]
  60. Comune di Genova Regolamento Comunale del Verde. Available online: https://smart.comune.genova.it/node/945 (accessed on 10 March 2022).
  61. MATTM. Linee Guida per La Gestione Del Verde Urbano e Prime Indicazioni per Una Pianificazione Sostenibile; MATTM: Roma, Italy, 2017. [Google Scholar]
  62. Lin, B.B.; Philpott, S.M.; Jha, S. The Future of Urban Agriculture and Biodiversity-Ecosystem Services: Challenges and next Steps. Basic Appl. Ecol. 2015, 16, 189–201. [Google Scholar] [CrossRef]
  63. Didham, R.; Ewers, R. Edge Effects Disrupt Vertical Stratification of Microclimate in a Temperate Forest Canopy. Pac. Sci. 2014, 68, 493–508. [Google Scholar] [CrossRef]
  64. European Union. EU Regolamento (UE) N. 1143/2014 Del Parlamento Europeo E Del Consiglio Del 22 Ottobre 2014 Recante Disposizioni Volte a Prevenire e Gestire l’introduzione e La Diffusione Delle Specie Esotiche Invasive; European Union: Maastricht, The Netherlands, 2014. [Google Scholar]
  65. MITE Decreto Legislativo 15 Dicembre 2017, n. 230-Adeguamento Della Normativa Nazionale Alle Disposizioni Del Regolamento (UE) n. 1143/2014 Del Parlamento Europeo e Del Consiglio Del 22 Ottobre 2014 Ministero Della Transizione Ecologica. Available online: https://www.mite.gov.it/normative/decreto-legislativo-15-dicembre-2017-n-230-adeguamento-della-normativa-nazionale-alle (accessed on 9 March 2022).
  66. Locosselli, G.M.; de Camargo, E.P.; Moreira, T.C.L.; Todesco, E.; de Andrade, M.F.; de André, C.D.S.; de André, P.A.; Singer, J.M.; Ferreira, L.S.; Saldiva, P.H.N.; et al. The Role of Air Pollution and Climate on the Growth of Urban Trees. Sci. Total Environ. 2019, 666, 652–661. [Google Scholar] [CrossRef]
  67. Di Napoli, C.; Pappenberger, F.; Cloke, H.L. Assessing Heat-Related Health Risk in Europe via the Universal Thermal Climate Index (UTCI). Int. J. Biometeorol. 2018, 62, 1155–1165. [Google Scholar] [CrossRef] [Green Version]
  68. Blazejczyk, K.; Jendritzky, G.; Broede, P.; Fiala, D.; Havenith, G.; Epstein, Y.; Psikuta, A.; Kampmann, B. An Introduction to the Universal Thermal Climate Index (UTCI). Geogr. Pol. 2013, 86, 5–10. [Google Scholar] [CrossRef] [Green Version]
  69. Mipaaf Mipaaf-Progetto Qualiviva. Available online: https://www.politicheagricole.it/flex/cm/pages/ServeBLOB.php/L/IT/IDPagina/9785 (accessed on 1 March 2022).
  70. Zhang, L.; Zhan, Q.; Lan, Y. Effects of the Tree Distribution and Species on Outdoor Environment Conditions in a Hot Summer and Cold Winter Zone: A Case Study in Wuhan Residential Quarters. Build. Environ. 2018, 130, 27–39. [Google Scholar] [CrossRef]
  71. Taleghani, M.; Kleerekoper, L.; Tenpierik, M.; van den Dobbelsteen, A. Outdoor Thermal Comfort within Five Different Urban Forms in the Netherlands. Build. Environ. 2015, 83, 65–78. [Google Scholar] [CrossRef]
  72. Yilmaz, S.; Mutlu, E.; Yilmaz, H. Alternative Scenarios for Ecological Urbanizations Using ENVI-Met Model. Environ. Sci. Pollut. Res. 2018, 25, 26307–26321. [Google Scholar] [CrossRef]
  73. Gatto, E.; Buccolieri, R.; Aarrevaara, E.; Ippolito, F.; Emmanuel, R.; Perronace, L.; Santiago, J.L. Impact of Urban Vegetation on Outdoor Thermal Comfort: Comparison between a Mediterranean City (Lecce, Italy) and a Northern European City (Lahti, Finland). Forests 2020, 11, 228. [Google Scholar] [CrossRef] [Green Version]
  74. Liu, S.; Zhao, J.; Xu, M.; Ahmadian, E. Effects of Landscape Patterns on the Summer Microclimate and Human Comfort in Urban Squares in China. Sustain. Cities Soc. 2021, 73, 103099. [Google Scholar] [CrossRef]
  75. Zheng, S.; Zhao, L.; Li, Q. Numerical Simulation of the Impact of Different Vegetation Species on the Outdoor Thermal Environment. Urban For. Urban Green. 2016, 18, 138–150. [Google Scholar] [CrossRef]
  76. Fang, Z.; Lin, Z.; Mak, C.M.; Niu, J.; Tse, K.T. Investigation into Sensitivities of Factors in Outdoor Thermal Comfort Indices. Build. Environ. 2018, 128, 129–142. [Google Scholar] [CrossRef]
  77. Maggiotto, G.; Buccolieri, R.; Santo, M.A.; Leo, L.S.; Di Sabatino, S. Validation of Temperature-Perturbation and CFD-Based Modelling for the Prediction of the Thermal Urban Environment: The Lecce (IT) Case Study. Environ. Model. Softw. 2014, 60, 69–83. [Google Scholar] [CrossRef]
  78. Ng, E.; Chen, L.; Wang, Y.; Yuan, C. A Study on the Cooling Effects of Greening in a High-Density City: An Experience from Hong Kong. Build. Environ. 2012, 47, 256–271. [Google Scholar] [CrossRef]
  79. Berardi, U.; Jandaghian, Z.; Graham, J. Effects of Greenery Enhancements for the Resilience to Heat Waves: A Comparison of Analysis Performed through Mesoscale (WRF) and Microscale (Envi-Met) Modeling. Sci. Total Environ. 2020, 747, 141300. [Google Scholar] [CrossRef]
  80. Abu Ali, M.; Alawadi, K.; Khanal, A. The Role of Green Infrastructure in Enhancing Microclimate Conditions: A Case Study of a Low-Rise Neighborhood in Abu Dhabi. Sustainability 2021, 13, 4260. [Google Scholar] [CrossRef]
  81. Perini, K.; Chokhachian, A.; Dong, S.; Auer, T. Modeling and Simulating Urban Outdoor Comfort: Coupling ENVI-Met and TRNSYS by Grasshopper. Energy Build. 2017, 152, 373–384. [Google Scholar] [CrossRef]
Figure 1. UTCI of Cornigliano district on 1 August 2020 at 14:00 [59].
Sustainability 14 05847 g001
Figure 2. The location of the study area in Genoa—Piazza Pietro Metastasio.
Sustainability 14 05847 g002
Figure 3. Point data sampling to extract climate data from different scenarios elaborated by ENVI-met.
Sustainability 14 05847 g003
Table 1. Selection criteria for plant species.
RequirementDescription
Resistance to drought *Herbaceous, shrubby, and arboreal plants to reduce water consumption adapted to conditions of aridity and lack of water.
Resistance to pathogens **Herbaceous, shrubby, and tree species resistant to diseases and pests, resulting in a reduction in the use of plant pesticides.
Resistance to pollutantsHigh resistance to water, soil, and air pollutants by roots and shoots.
Resistance to soil stress **Plants that can tolerate stress factors in urban environments (scarcity and poor soil quality, soil compaction).
Climate coherence *Consistent with the climatic zone of planting (evergreen species of Mediterranean scrub or similar).
Deciduous/evergreen speciesTo promote the sequestration of pollutants even during winter and constant shade (pollutant sequestration) even during winter (30–50%).
Entomophilous reproductive strategy *Herbaceous, shrubby, and arboreal species to promote pollination by insects and nutrient species on which pollinators may feed, thus increasing the biodiversity.
MaintenanceLow maintenance requirements after planting.
Ecosystem disservices *,**Herbaceous, shrubby, and arboreal species that do not present allergenic, toxic, stinging properties or species that are densely thorny or have a high tendency to dirty.
* key requirements obtained from [60]; ** key requirements obtained from [61].
Table 2. Different design scenarios.
Scenario 1Scenario 2Scenario 3
Layout plan Sustainability 14 05847 i001 Sustainability 14 05847 i002 Sustainability 14 05847 i003
Plant typology
(1)
Small trees (up to 10 m) (1 taxon)
(2)
Set of herbaceous species (wildflowers)
(3)
Climbers (1 taxon)
(1)
Small trees (up to 10 m) (1 taxon)
(2)
Set of herbaceous species (wildflowers)
(3)
Climbers (1 taxon)
(4)
Shrubs (4 taxa)
(1)
Small trees (up to 12 m) (1 taxon)
(2)
Set of herbaceous species (wildflowers)
(3)
Climbers (1 taxon) + grass (1 taxon)
(4)
Shrubs (5 taxa)
Surface material Sustainability 14 05847 i004 Light concrete pavement Sustainability 14 05847 i005 Light concrete pavement Sustainability 14 05847 i006 Light concrete pavement
Table 3. Meteorological data from 5 August 2003.
TimeAT (°C)RH (%)WS (m/s)WD
00:0030.8441.720
1:0031.3401.951
2:0031390.7350
3:0030.9390.9359
4:0030430.9306
5:0029.5440.93
6:0029.4430.934
7:0029.7430.76
8:0031.1390.4152
9:0032.1360.8213
10:0032.4351.3225
11:0031.1441.4220
12:0031.9411.6224
13:0032.8351.7223
14:0033.1391.9219
15:0033.5362.4226
16:0034.2272.7225
17:0034262.5222
18:0033.6272.4222
19:0032.8291.1234
20:0032.7290.620
21:0032291.335
22:0031.7291.1355
23:0031.1300.936
AT: air temperature; RH: relative humidity; Ws: wind speed; WD: wind direction.
Table 4. Examples of trees’ reparameterization in ENVI-met V4.4.5 (‘Albero’ component).
ENVI-Met Existing DatabaseNew Project Database
Sustainability 14 05847 i007 Sustainability 14 05847 i008
Table 5. Plant characteristics and selection for scenarios.
Resistance to DroughtResistance to Pathogens Resistance to PollutantsResistance to
Soil Stress
Climate Coherence Deciduous/EvergreenEntomophilous Reproductive StrategyMaintenanceEcosystem DisservicesSelected and Used in Scenarios
Tree Species
Albizia julibrissin Durazz.High *High *High *Medium *NoDeciduous *YesHigh *No-
Ceratonia siliqua L.High *High *Medium *High *YesEvergreen *YesMedium *No-
Cercis siliquastrum L.High *High *Medium *Medium *YesDeciduous *YesLow *No1; 2
Jacaranda mimosifolia D.DonHigh *High *Medium *High *NoEvergreen *YesMedium *No3
Koelreuteria paniculata LaxmMedium *High *High *Medium *NoDeciduous *YesMedium *No-
Schinus molle L.High *High *Medium *High *NoEvergreen *YesMedium *Yes-
Shrub Species
Cistus monspeliensis L.HighHighHighHighYesEvergreenYesLowNo3
Teucrium fruticans L.HighHighHighHighYesEvergreenYesLowNo-
Jacobaea maritima (L.) Pelser & MeijdenHighHighMediumHighYesEvergreenYesLowNo-
Lavandula angustifolia L.HighHighHighMediumYesEvergreenYesLowNo-
Phillyrea angustifolia L.HighHighHighHighYesEvergreenYesMediumNo2; 3
Pistacia lentiscus L.HighHighHighHighYesEvergreenYesMediumNo2; 3
Polygala myrtifolia L.HighHighHighMediumNoEvergreenYesLowNo-
Salvia rosmarinus Spenn.HighHighHighHighYesEvergreenYesLowNo-
Viburnum tinus L.HighHighHighMediumYesEvergreenYesMediumNo2; 3
Herbaceous Species
Centranthus ruber (L.) DCHighHighHighHighYes-YesLowNo-
Festuca glauca BlaufuchsHighHighHighHighNo-YesLowNo3
Salvia leucantha “Waverly” Cav.HighMediumMediumMediumNo-YesLowNo2; 3
Climbers
Hedera helix L.HighHighHighHighYesEvergreenYesMediumNo1; 3
Hedera hibernica (G. Kirchn.) beanHighHighHighHighNoEvergreenYesMediumNo-
Ficus pumila L.HighHighMediumMediumNoEvergreenYesMediumNo-
* data obtained from [69].
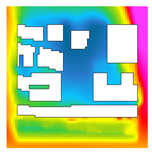
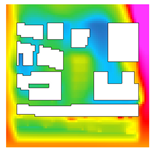
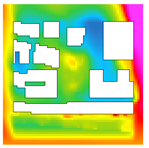
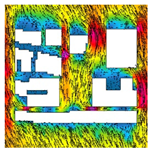
Table 6. ENVI-met analysis of 5 August 2003, 13:00 h. Minimum and maximum values are reported for each analysis for the area corresponding to Piazza Metastasio, as highlighted in the table (i.e., current state, air temperature).
Current StateScenario 1Scenario 2Scenario 3Legend
Air temperature Sustainability 14 05847 i009
Min: 33.42 °C
Max: 34.43 °C
Sustainability 14 05847 i010
Min: 32.19 °C
Max: 32.62 °C
Sustainability 14 05847 i011
Min: 32.25 °C
Max: 32.82 °C
Sustainability 14 05847 i012
Min: 32.42 °C
Max: 33.09 °C
Sustainability 14 05847 i013
Mean radiant temperature Sustainability 14 05847 i014
Min: 65.66 °C
Max: 70.06 °C
Sustainability 14 05847 i015
Min: 53.41 °C
Max: 68.40 °C
Sustainability 14 05847 i016
Min: 49.41 °C
Max: 68.97 °C
Sustainability 14 05847 i017
Min: 48.42 °C
Max: 68.75 °C
Sustainability 14 05847 i018
Relative humidity Sustainability 14 05847 i019
Min: 36.53%
Max: 39.23%
Sustainability 14 05847 i020
Min: 40.26%
Max: 42.98%
Sustainability 14 05847 i021
Min: 40.31
Max: 43.99%
Sustainability 14 05847 i022
Min: 40.44%
Max: 44.78%
Sustainability 14 05847 i023
Wind speed Sustainability 14 05847 i024
Min: 0.62 m/s
Max: 1.08 m/s
Sustainability 14 05847 i025
Min: 0.44 m/s
Max: 1.02 m/s
Sustainability 14 05847 i026
Min: 0.36 m/s
Max: 0.98 m/s
Sustainability 14 05847 i027
Min: 0.32 m/s
Max: 0.98 m/s
Sustainability 14 05847 i028
UTCI Sustainability 14 05847 i029
Min: 41.27 °C
Max: 42.05 °C
Sustainability 14 05847 i030
Min: 37.91 °C
Max: 41.38 °C
Sustainability 14 05847 i031
Min: 36.67 °C
Max: 41.63 °C
Sustainability 14 05847 i032
Min: 36.59 °C
Max: 41.73 °C
Sustainability 14 05847 i033
Table 7. Tukey’s HSD post-hoc test for thermal comfort parameters extracted from grid coordinates at point A (see Figure 3) in the three greening scenarios. Significant differences (p < 0.05) for each microclimatic parameter within different scenarios are marked with a superscript letter.
ParameterScenario
123
Air temperature (°C)32.48 ± 0.03 a32.59 ± 0.05 b32.73 ± 0.01 c
Mean radiant temperature (°C)60.16 ± 5.99 a58.13 ± 5.65 a42.80 ± 0.96 b
Relative humidity (%)41.78 ± 0.18 a43.21 ± 0.34 b41.93 ± 0.08 a
Wind speed (m/s)0.77 ± 0.04 a0.64 ± 0.07 b0.49 ± 0.03 c
UTCI (°C)39.17 ± 0.69 a38.94 ± 0.71 a35.13 ± 0.39 b
herbaceous layer (%)9.70 ± 0.02 a25.19 ± 0.02 b37.45 ± 0.02 c
shrub layer (%)0.00 a3.39 ± 0.02 b6.96 ± 0.02 c
tree layer (%)32.91 ± 0.05 a32.89 ± 0.02 a51.87 ± 0.02 b
Total plant coverage (%)42.57 ± 0.02 a61.43 ± 0.02 b96.25 ± 0.02 c
Table 8. Pearson’s correlation coefficient r between thermal comfort parameters and coverage by the different plant layers. Significant differences are marked in bold. ** p < 0.01.
ParameterHerbaceous Layer (%)Shrub Layer (%)Tree Layer (%)Total Plant Coverage (%)
Air temperature (°C)0.96 **0.96 **0.86 **0.96 **
Mean radiant temperature (°C)−0.77 **−0.81 **−0.87 **−0.85 **
Relative humidity (%)0.160.08−0.39−0.07
Wind speed (m/s)−0.93 **−0.94 **−0.83 **−0.93 **
UTCI (°C)−0.82 **−0.86 **−0.96 **−0.91 **
Table 9. T-test for independent samples between standard versus re-parametrised plant data (in the ENVI-met Albero component) in scenario 3 (maximum greening), at two different points A and B (Figure 3), for all the thermal comfort parameters. Data are average ± standard deviation. N = 5 each point (data extracted form adjacent point of grid coordinates for each point and scenario). Significant differences are marked in bold. Input climate data from 5 August 2003, 13:00 h.
ParameterStandard (Default Parameters)Re-ParametrisedpPoint
Air temperature (°C)32.56 ± 0.0332.73 ± 0.010.000001A
32.37 ± 0.0432.46 ± 0.030.005B
mean radiant temperature (°C)49.07 ± 2.0842.81 ± 0.960.0003A
43.31 ± 2.6642.62 ± 0.870.60B
Relative humidity (%)42.03 ± 0.1841.93 ± 0.080.65A
43.90 ± 0.1843.99 ± 0.250.55B
Wind speed (m/s)0.64 ± 0.040.49 ± 0.030.0001A
0.62 ± 0.090.55 ± 0.080.25B
UTCI (°C)36.59 ± 0.6535.13 ± 0.390.003A
35.02 ± 0.8134.86 ± 0.370.71B
Publisher’s Note: MDPI stays neutral with regard to jurisdictional claims in published maps and institutional affiliations.