Abstract
The environmental footprint of photovoltaic electricity is usually assessed using nominated power or life cycle energy output. If performance degradation is considered, a linear reduction in lifetime energy output is assumed. However, research has shown that the decrease in energy output over time does not necessarily follow a linear degradation pattern but can vary at different points in the module’s lifetime. Further, photovoltaic modules follow different degradation patterns in different climate zones. In this study, we address the influence of different degradation aspects on the greenhouse gas (GHG) emissions of PV electricity. Firstly, we apply different non-linear degradation scenarios to evaluate the GHG emissions and show that the differences in GHG emissions in comparison to a linear degradation can be up to 6.0%. Secondly, we use the ERA5 dataset generated by the ECMWF to calculate location-dependent degradation rates and apply them to estimate the location-specific GHG emissions. Due to the reduction in lifetime energy output, there is a direct correlation between the calculated degradation rate and GHG emissions. Thirdly, we assess the impact of climate change on degradation rates and on the respective GHG emissions of photovoltaic electricity using different climate change scenarios. In a best-case scenario, the GHG emissions are estimated to increase by around 5% until the year 2100 and by around 105% by 2100 for a worst-case scenario.
1. Introduction
The use of energy and raw materials during the production of photovoltaic (PV) modules has decreased significantly over the last years, while cell and module efficiencies are steadily increasing. Accordingly, greenhouse gas (GHG) emissions of electricity produced by photovoltaic systems have decreased from 125–164 g CO2 eq./kWh in 1992 [1] to 13–57 g CO2 eq./kWh [2,3,4] today. This development is extending the lead of PV electricity as one of the cleanest energy sources compared to conventional electricity-producing technologies. While PV systems’ production emissions have been decreasing, lifetime energy output has become more and more relevant for the assessment of the environmental footprint of PV systems. The energy output is influenced by factors like the PV module’s rated power and solar irradiation. Degradation reduces the energy output irreversibly over the lifetime of a PV system. In general, a linear degradation of 0.7% points per year is to be assumed in life-cycle-based approaches to determine the environmental footprint of PV systems [5,6], without accounting for differences between technologies or conditions of installation. However, research has shown that the ageing pattern of PV modules typically follows a non-linear degradation curve [7,8]. Indeed, different factors such as the operating climatic condition (influences like temperature, wind and a corrosive atmosphere) and the type of module technology (glass–glass or glass–backsheet modules, thin-film, or silicon based modules) can lead to different degradation patterns, thereby influencing the economic and environmental performance of PV systems [9].
There is an emerging interest in exploring the effects of non-linearity on PV performance’s degradation rate. For example, in [10] the authors evaluated the effects of non-linear degradation rates on the Levelized Cost of Electricity (LCOE). The authors highlighted that this impact exhibited differences up to 6.14% on the LCOE analysis. Additionally, in our recent study [7], we showed that using non-linearity in performance and degradation rate could improve the accuracy of PV lifetime predictions.
Moreover, because PV systems are installed in different climate zones worldwide, using a constant degradation rate in lifetime evaluations for all climate zones is a very generic approximation. It has been shown in previous studies [9,11,12] that PV modules degrade differently in different climate zones. This direct correlation between operating climate and PV lifetime implies that the temporal changes in climate variables such as temperature and solar irradiation caused by global climate change will, in turn, have a direct impact on PV degradation rates, lifetime, and energy yield [13,14]. Temperature cannot only influence the module’s energy conversion efficiency and, thereby the overall GHG emissions of the PV system, but also, higher temperatures act as an accelerator for degradation mechanisms [15,16]. The mentioned temperature increase and impacts on degradation rates are also related to climate change and predictions under different scenarios evidence a continuous increase on this variable if no mitigation and adaptation actions are taken [17].
2. Goal and Scope
This study aims at providing a better understanding of the effect that climatic conditions have on the GHG emissions of PV electricity by highlighting three different mechanisms: (1) non-linear PV performance degradation, (2) climate-specific degradation rate and (3) changing temperature and irradiation values caused by climate change. The schematic Figure 1 shows the link between these three aspects of GHG emissions.
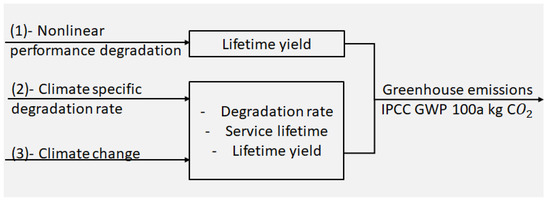
Figure 1.
Schematic showing the general objective of the study.
From Figure 1 the specific links are summarized as:
- Non-linear performance degradation: In [7], we used PV module and system field data to show that performance degradation does not always follow a linear path. In the same study, it was demonstrated that even at the same failure threshold, the degradation profile taken to reach this threshold influences the lifetime yield of a given PV module or system. Therefore, in this study, we assess the variations in GHG emissions that can be caused by different non-linear degradation profiles at the same defined failure threshold in comparison with a linear degradation profile.
- Climate-specific degradation rate: The climatic conditions of a specific location will influence the stress that is acting on the PV module. Degradation rates of PV modules have been shown to be climate dependent [12,18]. Therefore, the PV service lifetime and the lifetime energy yield vary from location to location. In this study, climate specific degradation rates are evaluated and applied in the calculation of GHG emissions instead of using a constant degradation rate for the different climate locations. Irradiation values for the lifetime yield calculation are adapted according to the location.
- Climate change: Global climate change will cause a change in climate variables (like temperature and solar irradiation), which is described in the form of different climate change scenarios in several studies [19]. Based on our knowledge about the effect of climatic conditions on the degradation mechanism and in turn, GHG emissions, it is to be expected that climate change will have an effect on PV degradation rates, service lifetime, lifetime yield and hence GHG emissions. Therefore, we assess how different climate change scenarios will cause changes in GHG emissions from PV electricity.
3. Methods and Materials
The paper is structured as follows: After the introduction in Section 1 and the elaboration on the goal and scope in Section 2, the materials and methods used in this study are described in Section 3, followed by the results of the study in Section 4. Section 3 and Section 4 will be structured along the threefold approach of our analysis: (1) non-linear PV performance degradation, (2) climate specific degradation rate, and (3) climate change. In Section 5, an extended discussion of the results is given, followed by the conclusion of the study in Section 6.
3.1. Lifetime Yield and PV System
The primary objective of this study is to assess the differences in GHG emissions of PV systems between different degradation scenarios. To calculate the lifetime yield, a life cycle assessment according to DIN EN ISO 14040-44 [20,21] is conducted. In accordance with the International Energy Agency (IEA) LCA guidelines for PV systems [5], the functional unit is 1 kWh of DC electricity. Values for degradation and lifetime have been adapted from linear degradation (0.7% points per year over a period of 30 years) to location specific degradation and lifetime. Location specific irradiation values have been used. GHG emissions have been calculated according to IPCC 2013 GWP 100a using the software SimaPro 9. Foreground data have been modelled according to the life-cycle-inventory from [2,3] whereas background data are based on ecoinvent 3.6.
The system under study is a crystalline silicon glass–backsheet (p-Mono PERC c-Si) module produced in the EU. This technology is chosen in this study because it has the highest market share, globally. According to the ITRPV-report [22], more than 80% of the modules in 2020 are estimated to have a glass–backsheet design. The parameters used to calculate the lifetime yield of the studied system are shown in Table 1. The upstream production chain of c-Si PV modules, as well as the balance of system components are included. Further, the transport to the installation location and to the end-of-life treatment are taken into account. However, the end-of-life treatment itself is out of scope in this study.

Table 1.
Specifications of the PV system under investigation and assumptions for the baseline scenario, where solar irradiation and degradation rate are constant.
The total environmental impact per kWh of electricity is inversely proportional to the lifetime electricity generation of PV systems. The lifetime electricity yield is on the one hand affected by technological parameters (e.g., module efficiency and power), which stay constant over our analysis. On the other hand, the influencing factors such as degradation rate, lifetime, and solar irradiation vary from location to location, and therefore, they are adapted within our calculations as expressed. A linear degradation (0.7% points per year over a period of 30 years) will be used for the baseline calculation, whereas in all different climate locations, location specific degradation rates and lifetimes are calculated and applied. Similarly, corresponding location specific irradiation values have been used.
3.2. Modelling the Degradation Aspects
3.2.1. Modelling the Impact of Non-Linear PV Performance Degradation
The description in this subsection is necessary for assessing the impact of non-linear performance degradation on GHG emissions. Several authors have reported non-linearity in performance (power) degradation in fielded PV modules and systems. For example, Köntges et al. [23] show that the loss in power can take different shapes, (e.g., exponential-shaped, linear-shaped, and step and saturating power degradation loss over time). To model these non-linear behaviours, we developed a non-linear power degradation model with an adaptable shape parameter to optimize different degradation shapes observed in the field as [11]:
where and are the power at evaluation time and initial power respectively, k is the degradation rate [year], and is parameters associated with the material.
We analysed the degradation trends of five different PV systems named System A–E (see Figure 2A) based on our previous study [7] to illustrate the different degradation profiles observed in the field. In the same study, it was shown that even at similar failure thresholds, the lifetime yield was affected by the degradation profile followed by a PV module/system. To assess the variations in GHG emissions due to the different degradation profiles, we applied a non-linear performance model (1) to simulate four different profiles by changing the values shape parameter and the model parameter as shown in Table 2. The four profiles are simulated as scenarios S01, S02, S03 and S04 as shown in Figure 2B. Although the degradation profiles shown by fielded PV systems in Figure 2A are linked to different PV technologies, other factors such as the bill of materials and dominating degradation mechanisms can lead to different degradation profiles. Moreover, one can expect that even for modules with the same cell technology, the differences in module design and manufacturing could result in different failure profiles. For example, one speculation is that for glass–glass modules there are fewer moisture pathways and moisture ingress compared to glass–backsheet modules. Therefore, moisture-induced degradation modes are expected to be slower at the earlier stages of the module lifetime for glass–glass modules in comparison to glass–backsheet modules. However, at the same time, the compacted design of the glass–glass modules implies that the breathable pathways and drying are also limited, causing the moisture to accumulate inside the module over the years, leading to a dramatic increase in the degradation rate. Hence, one could expect degradation scenarios similar to S01 and S02 in Figure 2B.

Figure 2.
(A) Different degradation profiles observed in the field. (B) Simulated degradation scenarios based on the different failure profiles.

Table 2.
Different degradation curve scenarios and corresponding parameters.
3.2.2. Modelling the Impact of Location Specific Degradation Rate
The impact of climate-specific degradation rate on GHG emissions can be assessed by using climate-based physical models. Therefore, a physics-based degradation model is applied to simulate the degradation rates in different climates as proposed in our previous study [11]. According to the model, four climate stressors (module temperature, relative humidity, UV irradiation, and temperature cycles) were assumed to be the main precursors of PV degradation. It was also assumed that these climate stressors induce three main degradation mechanisms: hydrolysis, photo-degradation, and thermo-mechanical degradation and the total degradation rate was derived from these three mechanisms as:
where (%/year) is the total degradation rate, is the normalization constant of the physical quantities: , , and are the degradation rates for hydrolysis, photodegradation, and thermo-mechanical degradation, respectively expressed as:
where , and (eV) are the activation energies of power degradation due to hydrolysis, photo-degradation and thermo-mechanical mechanism respectively. (year), (m/kWh) and ( cycle) are the pre-exponential constants. is the Boltzmann constant eVK, n, and X are model parameters that indicate the impact of relative humidity and UV dose (kWh/a/m) on power degradation. (K) is the module temperature, is the temperature difference (Kelvin), (cycles/year) is the cycling rate, and are the module maximum and minimum temperatures.
In [24] a PV based climate scheme, (so called Köppen–Geiger Photovoltaic (KGPV) scheme) was proposed, and in [12], calculated degradation rates were compared using this scheme as shown in Figure 3. A summary of each KGPV climate zone letter is given in the Table 3.

Figure 3.
Spatial distribution of the total degradation rates in view of the KGPV climate zones. The average of total degradation rate per climate zone is indicated below each label in %/year [12].

Table 3.
Definition of KGPV letter. Each KGPV climate zone is defined by two letters, the first one implies the relation of temperature and precipitation (TP-zones) and the second is related to the irradiation level (H-zones) [12].
3.2.3. Estimating the Impact of Climate Change
To evaluate the impact of climate change on the GHG emissions of PV, we apply the latest versions of climate change scenarios in the frame of phase 6 of the Coupled Model Intercomparison Project (CMIP6) [19]. These scenarios are defined by two main concepts: Shared Socio-economic Pathways (SSP) and Representative Concentration Pathways (RCP), or Radiative Forcing levels (RF). In the CMIP6 framework, five SSPs are proposed based on the socio-economic challenges for mitigation of climate change and the socio-economic challenges for adaptation of climate change: SSP1—Sustainability, SSP2—Middle of the Road, SSP3—Regional Rivalry, SSP4—Inequality, and SSP5—Fossil Fueled Development.
For simplicity, only two climate change scenarios are considered in this study. The authors have considered the best and worst case scenarios to be the SSP1 and SSP5, respectively. They are defined as follows:
- SSP1—sustainability: also called the “Green road”, where the world shifts gradually, but pervasively, toward a more sustainable path and emphasizes more inclusive development respective the environmental boundaries.
- SSP5—fossil fueled development: described as “taking the highway” to increase faith in competitive markets, innovation, and participatory societies to produce rapid technological progress and development of human capital as the path to sustainable development. This scenario pushes society to increase the exploitation of abundant fossil fuel resources and the adoption of resource and energy-intensive lifestyles worldwide.
In the same framework, seven different RF levels (1.9, 2.6, 3.4, 4.5, 6.0, 7.0, and 8.5 W/m) are linked to SSPs as indicated in the Figure 4. Radiative forcing indicates the change in energy flux in the atmosphere caused by climate change factors. Again, the best and worst scenarios have been chosen in this study: SSP119 and SSP585, respectively.
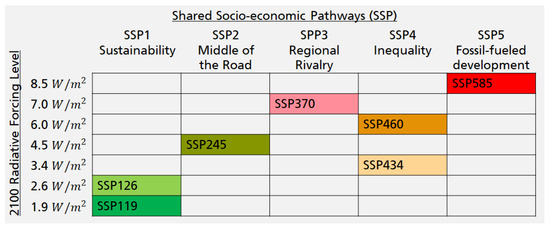
Figure 4.
Radiative forcing levels in W/m combined with the SSP scenarios to build the SSP–RF matrix.
Generally, from Global Climate Models (GCM) different variables such as ambient temperature and solar irradiation can be extracted to access the impact of the different climate change scenarios. The evolution of ambient temperature and solar irradiation have a direct effect on PV degradation rate, service lifetime, and also on the lifetime energy yield. In this case, we focus mainly on the long-term evolution of temperature and solar irradiation and how these will influence the degradation rates, and hence the CO emissions. Data from two stations: Station A (55.0, 8.4) and station B (53.5, 13.1) located in Germany are used. These locations are selected because of high long-term historical data availability based on ground measurements. The evaluation and validation of site-specific climate change trends based on the different scenarios is extensive and has been described separately in [17].
3.3. Climatic and PV Data Sources and Uncertainties
The climatic data used in this paper come from different sources with different temporal and spatial resolutions. While climate reanalysis and projections are based on temporal-spatial modelling that provides global coverage, ground measurements will get a higher accuracy but for a single location. The combination of both results in a more accurate representation of the past, present and future weather. The datasets used in this paper are described as follows:
- To demonstrate the non-linearity in PV performance degradation, we used the data and methods of extracting degradation trends of the PV systems in our previous study [7]. The underlying values contain an average relative uncertainty of 7.0%, which is outstanding in comparison with similar studies [25].
- To assess the effects of climate-specific degradation rates, processed and validated data [12] from ERA5 re-analysis [26] was used.
- To assess the impact of climate change, the data used is extracted from the ground measurements of the German meteorological service (Deutscher Wetterdienst: DWD) [27]. The data consist of long-time series from the 1940s to the present of global horizontal irradiation (GHI), ambient temperature, wind speed, and relative humidity. The modelled climate change data for scenarios SSP119 and SSP585 have been retrieved through the Earth System Grid Federation (ESGF) Peer-to-Peer (P2P) enterprise system [28]. Further details on the generation of climate change scenarios are given in [29,30]. Data projecting climate change scenarios into the future naturally contain high uncertainty. In this analysis, uncertainty is reduced by comparing two different scenarios (best-case and worst-case). Still, our analysis only contains climate change projections from one source [19]. Future analysis should ideally consider the combination of different datasets generated by different research institutions in the frame of the IPCC.
3.4. Statistical Analysis
We use the relative difference () (Equation (6)) as a metric to compare the variations of linear and non-linear degradation scenarios and to calculate the percentage increase in climate variables and in CO emission for the climate change scenarios.
where,
- for assessing the effect of non-linear performance degradation, P is the CO emission evaluated using non-linear degradation scenarios and m is the CO emission value evaluated using the linear degradation.
- for assessing the effect of climate change, p is the value of climate variable or CO emission evaluated in 2021 and m is the value of climate variable or CO emission evaluated in 2100.
4. Results
4.1. Assessing the Effect of Non-Linear Performance Degradation on the GHG Emissions of PV Electricity
The results are shown in kg CO-eq./kWh for a 3 kWp slanted-roof PV plant installed in the EU (see Table 1). The four degradation scenarios (S01–S04, see Table 2) were benchmarked to the baseline scenario (linear degradation of 0.7% annually). Figure 5A shows the absolute GHG emissions for linear and non-linear performance degradation. Figure 5B shows the relative difference in GHG emissions of the four non-linear degradation scenarios in relation to linear degradation.

Figure 5.
(A) Calculated GHG emissions of 1 kWh PV electricity in kg CO-eq. for different degradation scenarios. (B) Relative difference of the GHG emissions for other degradation scenarios in relation to linear degradation scenario.
It is visible that assuming a linear performance degradation for systems undergoing non-linear performance degradation trends leads to under- or overestimation of GHG emissions. For example, if the system is undergoing degradation following a degradation pattern as in scenario S01, using a linear approximation would lead to an overestimation of GHG emissions of about −4.0%. On the contrary, if the system is following a degradation pattern as presented in scenario S04, using a linear approximation would lead to an underestimation of GHG emissions of about 6.0%.
4.2. Assessing the Effect of Climate Specific Degradation Rates on the GHG Emissions of PV Electricity
To assess the impact of climate specific degradation rates on the GHG emissions of PV electricity, the degradation rate parameters of the studied system given in Table 1 have been adjusted. That is, instead of using a constant degradation rate of 0.7%/year in all the different locations, climate specific degradation rates were evaluated using Equation (2). The distribution of degradation rates in different climate zones are already shown in Figure 3. The lifetime electricity generation and hence the GHG emissions of the studied PV system are then evaluated based on location specific degradation rates and solar irradiation. For comparison the carbon footprint is also calculated using the constant 0.7%/year degradation rate but with location specific solar irradiation. Figure 6 shows the evaluated spatial distribution of GHG emissions for both cases.

Figure 6.
Spatial distribution of GHG emissions (IPCC GWP 100a kg CO eq) in view of the KGPV climate zones. The average GHG emissions in kg CO eq. per climate zone is indicated below each label for the two cases (Rd: degradation rate).
From Figure 6, it is visible that assuming a constant degradation rate in all the climate zones over-/underestimates the GHG emissions. The 0.7%/year degradation rate matches only one climate zone, CK. In most of the climate zones (e.g., FL, EL, EM, DL, DM, CH, BH, and BK), the degradation rates are estimated to be lower than 0.7%/year, thus the GHG emissions are overestimated. On the contrary, in tropical areas with very high and high irradiation (i.e., AH and AK) where the degradation rates are estimated to be higher than 0.7%/year, the GHG emissions are underestimated. For example, due to the very high irradiation in the AH zone, assuming linear degradation would lead to GHG emissions of around 0.017 kg CO-eq. per kWh. Taking into account the higher degradation rates and shorter lifetimes associated with the tropical climate, GHG emissions would almost double to 0.030 kg CO-eq. per kWh.
For visualization purposes, the GHG emissions are plotted on the maps in Figure 7 and Figure 8 for GHG emissions calculated using climate specific degradation rates and GHG emissions calculated using a fixed degradation rate, respectively. The thresholds to define geographical regions were defined arbitrarily with on steps of 0.01 kg CO eq.
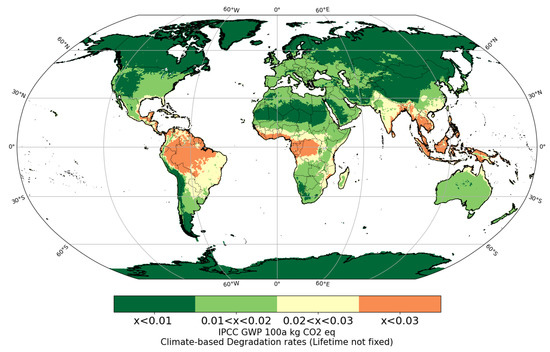
Figure 7.
Map showing the GHG emissions of 1 kWh PV electricity calculated from climate-based degradation rates (lifetime not fixed).
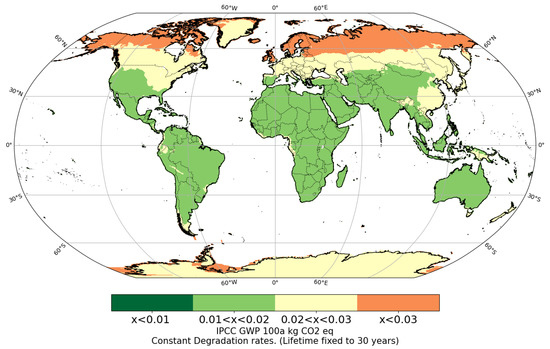
Figure 8.
Map showing the GHG emissions of 1 kWh PV electricity calculated using a constant degradation rate (lifetime fixed to 30 years).
Generally, the maps show that the GHG emissions of PV systems are highly influenced not only by the solar irradiation, but also by the different degradation rates. The GHG emissions vary widely depending on regional irradiation and degradation profiles.
If linear degradation is considered, the carbon footprint follows the irradiation pattern: the higher the irradiation, the lower the carbon footprint (Figure A2). For example, regardless of the expected lower degradation rates in cold climates with low irradiation (EL zone, e.g., Moscow, Russia), the evaluated GHG emissions only depend on the lower values of solar irradiation in these areas. The linear degradation rate approximation leads to an overestimation of the GHG emissions in this region. Similarly, in the tropical areas the GHG emissions are underestimated because the impact of higher degradation rates in these areas is neglected by assuming a linear degradation rate.
However, when assuming climate-based degradation rates, high irradiation does not automatically lead to a lower carbon footprint since high irradiation is often accompanied by strong degradation factors like heat, a corrosive atmosphere or moisture (Figure 7). It can be seen that higher GHG emissions are estimated in AK and AH zones (i.e, tropical areas with very high and high irradiation respectively). Since these areas are characterized by very high and high irradiation levels, one would expect lower GHG emissions because of a higher lifetime energy output. However, the higher degradation rates in these zones lead to reduced lifetimes and hence higher GHG emissions per kWh. In contrast, in the EL zone (i.e., cold with low irradiation—e.g., Moscow, Russia), higher GHG emissions could be expected due to the lower energy yield; however, the lower degradation rates calculated in this region result in an extended PV system lifetime reducing the GHG emissions per kWh.
Again, it can be seen that linear degradation leads to an over- or underestimation of GHG emissions in most regions.
4.3. Assessing the Impact of Climate Change on the GHG Emissions of PV Electricity
Here we present the results of the best-case (SSP119) and worst-case (SPP585) climate change scenarios. The annual climate change related evolution of solar irradiation, module temperature, and total degradation rate are shown in Figure 9. Note that the module temperature is estimated from ambient temperature, solar irradiation, and wind speed using the Faiman model [31].
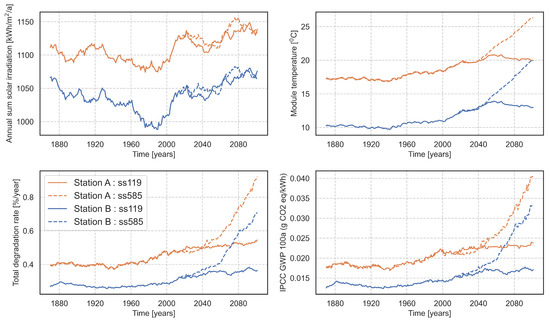
Figure 9.
Evolution of solar irradiation, module temperature, degradation rate, and CO footprint under the best (bold lines) and worst (dotted lines) climate change scenarios for two stations: A (orange), B (blue). The legend applies to all figures.
From Figure 9 it is visible that there is an increasing trend of all the variables, and hence an increasing trend in GHG emissions. The percentage increase of the variables and the corresponding percentage increase in GHG emissions are presented in Table 4.

Table 4.
Percentage of increase in annual solar irradiation, module temperature, degradation rate and CO emission from 2021 to 2100 using best (SSP119) and worst (SSP585) climate change scenarios.
Depending on the location and the climate change scenario, the GHG emissions are estimated to increase from 5.32% to 105.12%. In the best case scenario SSP119, an increase between 5.32% and 7.38% is to be expected, whereas in the worst case scenario SSP585 the increase in GHG emissions can be as high as 93.84% to 105.12%. This estimated increase in GHG emissions can be mainly attributed to the increase in module temperature as the module temperature shows a significant increase compared to solar irradiation. Moreover, the module temperature has the highest influence on the degradation rates compared to other degradation stress factors [32,33].
5. Discussion
The lifetime energy output of a photovoltaic system strongly influences the greenhouse gas emissions of PV electricity. Degradation is reducing the energy output irreversibly over the lifetime of a PV system. The inclusion of degradation effects in life-cycle assessments (LCA) is an area that still needs optimization since linear performance degradation can lead to an over- or under estimation of GHG emissions for certain locations.
We found that assuming a linear degradation rate can lead to over- or underestimation of GHG emissions of around 4% to 6%, which in our analysis is a variation of around 0.8 to 1 g of CO eq.
More important are the differences between GHG emissions calculated from climate-specific degradation rates compared to linear degradation. In regions where climatic stressors like temperature, humidity and corrosion are relatively high, the GHG emissions per kWh almost double in our calculations when we use climate-specific degradation rates. From our visualization in (Figure 7 and Figure A2), it can be seen that if a linear degradation is applied, the GHG emissions follow the global irradiation pattern: the higher the irradiation, the lower the carbon footprint. When we consider the regional climatic conditions, this pattern changes to higher or lower degradation rates as well as longer or shorter module lifetimes. The analysis shows that not only regional irradiation has a large influence on GHG emissions, but also regional degradation rates influence the results to a remarkable amount.
Lastly, we analyze how climate change related changes in climatic conditions could affect the GHG emissions of PV electricity in the long run, by evaluating how increasing module temperatures and changing irradiation patterns lead to higher degradation rates and shorter PV lifetimes and hence higher GHG emissions of PV electricity produced for the example of Germany. In the worst-case scenario, an increase of up to 105.12% is to be expected. This analysis highlights one of the many self-accelerating effects that climate change will have not only on our atmosphere and ecosphere, but also on our technosphere. It is likely that more of these, up to now unaccounted for, climate change effects will influence not only our future energy production from solar but also from wind energy.
6. Conclusions
Overall, this study has shown that the accuracy of PV LCA can be significantly improved through PV performance modelling. Including climate specific degradation rates and patterns can make a difference of up to 6% in the carbon footprint per kWh. When the long-term effects of climate change are included in the analysis, the carbon footprint is expected to increase up to 105% compared to the standardized linear degradation pattern.
Based on these results, we argue that it is crucial to take into account location-specific, non-linear degradation models when using a life-cycle based approach as a decision support tool. While the recommended linear annual degradation is easy to implement, it leads to inaccurate results, especially in locations with extreme climates. In order to improve accuracy, the authors proposed a method to calculate location specific degradation rates.
Still, further research is necessary in this field. For instance, to minimize complexity, it may be useful to classify reference climate zones and corresponding degradation rates and patterns. This can facilitate the implementation of non-linear and location-specific degradation rates, while still improving the accuracy of the overall LCA results.
Author Contributions
Conceptualization, S.H. and I.K.; methodology, S.H., I.K. and J.A.-V.; software, S.H., I.K., J.A.-V. and M.F.; validation, S.H. and I.K.; formal analysis, S.H., I.K. and J.A.-V.; investigation, S.H. and I.K.; resources, S.H., I.K. and J.A.-V.; data curation, S.H., I.K. and J.A.-V.; writing—original draft preparation, S.H., I.K. and M.F.; writing—review and editing, K.-A.W. and L.S.; visualization, I.K. and J.A.-V.; supervision, K.-A.W. and L.S. All authors have read and agreed to the published version of the manuscript.
Funding
This research received no external funding.
Institutional Review Board Statement
Not applicable.
Informed Consent Statement
Not applicable.
Data Availability Statement
The data that support the findings of this study are available from the corresponding author upon request.
Acknowledgments
The authors would like to thank the following organizations: European Centre for Medium-Range Weather Forecasts ECMWF, Deutscher Wetterdienst DWD, Coupled Model Intercomparison Project Phase 6 CMIP6, Earth System Grid Federation ESGF, and IPSL Climate Modelling Centre for providing valuable climate datasets.
Conflicts of Interest
The authors declare no conflict of interest.
Appendix A. Maps of Total Degradation Rate and Solar Irradiation
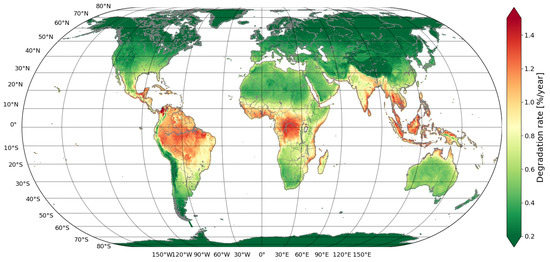
Figure A1.
Map showing the total degradation rate evaluated using climate-based physical model (2) and climate data from ERA5.
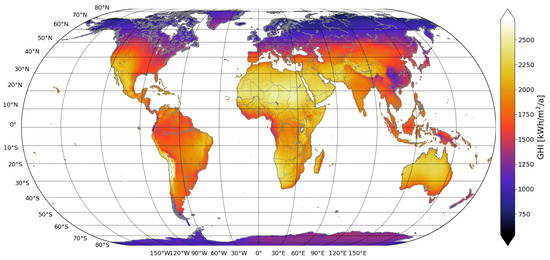
Figure A2.
Map showing annual global solar irradiation using climate data from ERA5.
References
- Doka, G.; Vollmer, M. Ökoinventare für Energiesysteme, 1st ed.; ETH Zürich, Gruppe Energie-Stoffe-Umwelt ESU: Zuerich, Switzerland, 1994. [Google Scholar]
- Müller, A.; Friedrich, L.; Reichel, C.; Herceg, S.; Mittag, M.; Neuhaus, D.H. A Comparative Life Cycle Assessment of Silicon PV Modules: Impact of Module Design, Manufacturing Location and Inventory. Sol. Energy Mater. Sol. Cells 2021, 230, 111277. [Google Scholar] [CrossRef]
- Friedrich, L.; Nold, S.; Müller, A.; Rentsch, J.; Preu, R. Global Warming Potential and Energy Payback Time Analysis of Photovoltaic Electricity by Passivated Emitter and Rear Cell (PERC) Solar Modules. J. Photovolta. 2021; submitted. [Google Scholar]
- Umweltbundesamt. Aktualisierung und Bewertung der Ökobilanzen von Windenergie- und Photovoltaikanlagen unter Berücksichtigung Aktueller Technologieentwicklungen; Umweltbundesamt: Dessau-Roßlau, Germany, 2021; ISSN 1862-4359. [Google Scholar]
- Rolf, F.; Stolz, P.; Heath, G.; Raugei, M.; Sinha, P.; de Wild-Scholten, M. Methodology Guidelines on Life Cycle Assessment of Photovoltaic; IEA PVPS Task 12 Technical Report; IEA International Energy Agency: Paris, France, 2020. [Google Scholar]
- European Commission. Product Environmental Footprint Category Rules (PEFCR). Photovoltaic Modules Used in Photovoltaic Power Systems for Electricity Generation. 2020. Available online: https://ec.europa.eu/environment/eussd/smgp/pdf/PEFCRPVelectricityfeb20202.pdf (accessed on 11 November 2021).
- Kaaya, I.; Lindig, S.; Weiss, K.-A.; Virtuani, A.; de Cardona Ortin, M.S.; Moser, D. Photovoltaic lifetime forecast model based on degradation patterns. Prog. Photovolt. Res. Appl. 2020, 28, 979–992. [Google Scholar] [CrossRef]
- Theristis, M.; Livera, A.; Micheli, L.; Ascencio-Vásquez, J.; Makrides, G.; Georghiou, G.E.; Stein, J.S. Comparative Analysis of Change-Point Techniques for Nonlinear Photovoltaic Performance Degradation Rate Estimations. IEEE J. Photovolta. 2021, 11, 1511–1518. [Google Scholar] [CrossRef]
- Rajput, P.; Malvoni, M.; Kumar, N.M.; Sastry, O.S.; Jayakumar, A. Operational Performance and Degradation Influenced Life Cycle Environmental—Economic Metrics of mc-Si, a-Si and HIT Photovoltaic Arrays in Hot Semi-arid Climates. Sustainability 2020, 12, 1075. [Google Scholar] [CrossRef] [Green Version]
- Theristis, M.; Livera, A.; Jones, C.B.; Makrides, G.; Georghiou, G.E.; Stein, J.S. Nonlinear Photovoltaic Degradation Rates: Modeling and Comparison Against Conventional Methods. IEEE J. Photovolta. 2020, 10, 1112–1118. [Google Scholar] [CrossRef]
- Kaaya, I.; Köhl, M.; Mehilli, A.; de Cardona Ortin, M.S.; Weiss, K.-A. Modeling outdoor service lifetime prediction of PV modules: Effects of combined climatic stressors on PV module power degradation. IEEE J. Photovolt. 2019, 9, 1105–1112. [Google Scholar] [CrossRef]
- Ascencio-Vásquez, J.; Kaaya, I.; Brecl, K.; Weiss, K.-A.; Topič, M. Global Climate Data Processing and Mapping of Degradation Mechanisms and Degradation Rates of PV Modules. Energies 2019, 12, 4749. [Google Scholar] [CrossRef] [Green Version]
- Gil, V.; Gartner, M.-A.; Gutierrez, C.; Losada, T. Impact of climate change on solar irradiation and variability over the Iberian Peninsula using regional climate models. Int. J. Climatol. 2018, 39, 1733–1747. [Google Scholar] [CrossRef] [Green Version]
- Burnett, D.; Barbour, E.; Harrison, G.P. The UK solar energy resource and the impact of climate change. Renew. Energy 2014, 71, 333–343. [Google Scholar] [CrossRef] [Green Version]
- Rajput, P.; Tiwari, G.; Sastry, O. Thermal modelling with experimental validation and economic analysis of mono crystalline silicon photovoltaic module on the basis of degradation study. Energy 2017, 120, 731–739. [Google Scholar] [CrossRef]
- Bouaichi, A.; Merrouni, A.A.; Hajjaj, C.; Messaoudi, C.; Ghennioui, A.; Benlarabi, A.; Ikken, B.; El Amrani, A.; Zitouni, H. In-situ evaluation of the early PV module degradation of various technologies under harsh climatic conditions: The case of Morocco. Renew. Energy 2019, 143, 1500–1518. [Google Scholar] [CrossRef]
- Ascencio-Vásquez, J. Modeliranje in Globalno Vrednotenje Ucinkovitosti Delovanja ter Staranja Fotonapetostnih Modulov in Sistemov. Ph.D. Thesis, University of Ljubljana, Ljubljana, Slovenia, 2021. Available online: https://repozitorij.uni-lj.si/IzpisGradiva.php?lang=eng&id=131079 (accessed on 19 April 2022).
- Jordan, D.C.; Kurtz, S.R.; VanSant, K.; Newmiller, J. Compendium of photovoltaic degradation rates. Prog. Photovolt. Res. Appl. 2016, 24, 978–989. [Google Scholar] [CrossRef]
- CMIP6 Special Issue in GMD. Available online: https://gmd.copernicus.org/articles/special_issue590.html (accessed on 15 September 2021).
- ISO 14040; European Committee for Standardization, DIN EN ISO 14040: Environmental Management—Life Cycle Assessment— Principles and Framework (ISO 14040: 2006). ISO: Geneva, Switzerland, 2006.
- ISO 14044; European Committee for Standardization, DIN EN ISO 14044: Environmental Management—Life Cycle Assessment— Requirements and Guidelines. ISO: Geneva, Switzerland, 2006.
- VDMA Phovoltaic Equipment International. Technology Roadmap for Photovoltaic (ITRPV) 2019 Results, 8th ed. Available online: https://itrpv.vdma.org\T1\guilsinglrightITRPV02020.pdf (accessed on 24 April 2020).
- Köntges, M.; Kurtz, S.; Packard, C.E.; Jahn, U.; Berger, K.A.; Kato, K.; Friesen, T.; Liu, H.; Van Iseghem, M.; Wohlgemuth, J.; et al. Review of Failures of Photovoltaic Modules; IEA International Energy Agency: Paris, France, 2014. [Google Scholar]
- Ascencio-Vásquez, J.; Brecl, K.; Topič, M. Methodology of Köppen-Geiger-Photovoltaic climate classification and implications to worldwide mapping of PV system performance. Sol. Energy 2019, 191, 672–685. [Google Scholar] [CrossRef]
- Jordan, D.C.; Deline, C.; Deceglie, M.G.; Nag, A.; Kimball, G.M.; Shinn, A.B.; John, J.J.; Alnuaimi, A.A.; Elnosh, A.B.; Luo, W.; et al. Reducing interanalyst variability in photovoltaic degradation rate assessments. IEEE J. Photovolt. 2020, 10, 206–212. [Google Scholar] [CrossRef]
- Copernicus Climate Change Service (C3S). ERA5: Fifth Generation of ECMWF Atmospheric Reanalyses of the Global Climate. Copernicus Climate Change Service Climate Data Store (CDS). 2017. Available online: Https://Cds.Climate.Copernicus.Eu/Cdsapp#!/Home (accessed on 16 November 2020).
- Deutscher Wetterdienst, DWD, DWD Opendata. Available online: https://opendata.dwd.de/climate_environment/CDC/ (accessed on 30 April 2021).
- Cinquini, L.; Crichton, D.; Mattmann, C.; Harney, J.; Shipman, G.; Wang, F.; Ananthakrishnan, R.; Miller, N.; Denvil, S.; Morgan, M.; et al. The Earth System Grid Federation: An open infrastructure for access to distributed geospatial data. Future Gener. Comput. Syst. 2014, 36, 400–417. [Google Scholar] [CrossRef]
- Olivier, B.; Sébastien, D.; Guillaume, L.; Anne, C.; Arnaud, C.; Marie-Alice, F.; Yann, M.; Patricia, C.; Marion, D.; Josefine, G.; et al. IPSL IPSL-CM6A-LR model output prepared for CMIP6 CMIP. Version 20190429. Earth Syst. Grid Fed. 2018. [Google Scholar] [CrossRef]
- Swart, N.C.; Cole, J.N.S.; Kharin, V.V.; Lazare, M.; Scinocca, J.F.; Gillett, N.P.; Anstey, J.; Arora, V.; Christian, J.R.; Jiao, Y.; et al. CCCma CanESM5 model output prepared for CMIP6 ScenarioMIP. Version 20190429. Earth Syst. Grid Fed. 2019. [Google Scholar] [CrossRef]
- Faiman, D. Assessing the outdoor operating temperature of photovoltaic modules. Prog. Photovolt. Res. Appl. 2008, 16, 307–315. [Google Scholar] [CrossRef]
- Kaaya, I.; Ascencio-Vasquez, J.; Weiss, K.-A.; Topič, M. Assessment of uncertainties and variations in PV modules degradation rates and lifetime predictions using physical models. Sol. Energy 2021, 218, 354–367. [Google Scholar] [CrossRef]
- Rolf, F.; Philippe, S.; Luana, K.; de Wild-Scholten, M.; Parikhit, S. Life Cycle Inventories and Life Cycle Assessments of Photovoltaic Systems; IEA Task 12 PV Sustainability; IEA International Energy Agency: Paris, France, 2020. [Google Scholar]
Publisher’s Note: MDPI stays neutral with regard to jurisdictional claims in published maps and institutional affiliations. |
© 2022 by the authors. Licensee MDPI, Basel, Switzerland. This article is an open access article distributed under the terms and conditions of the Creative Commons Attribution (CC BY) license (https://creativecommons.org/licenses/by/4.0/).