
Application of Multifractal Analysis in Estimating the Reaction of Energy Markets to Geopolitical Acts and Threats


Abstract
:1. Introduction
2. Literature Review
3. Materials and Methods
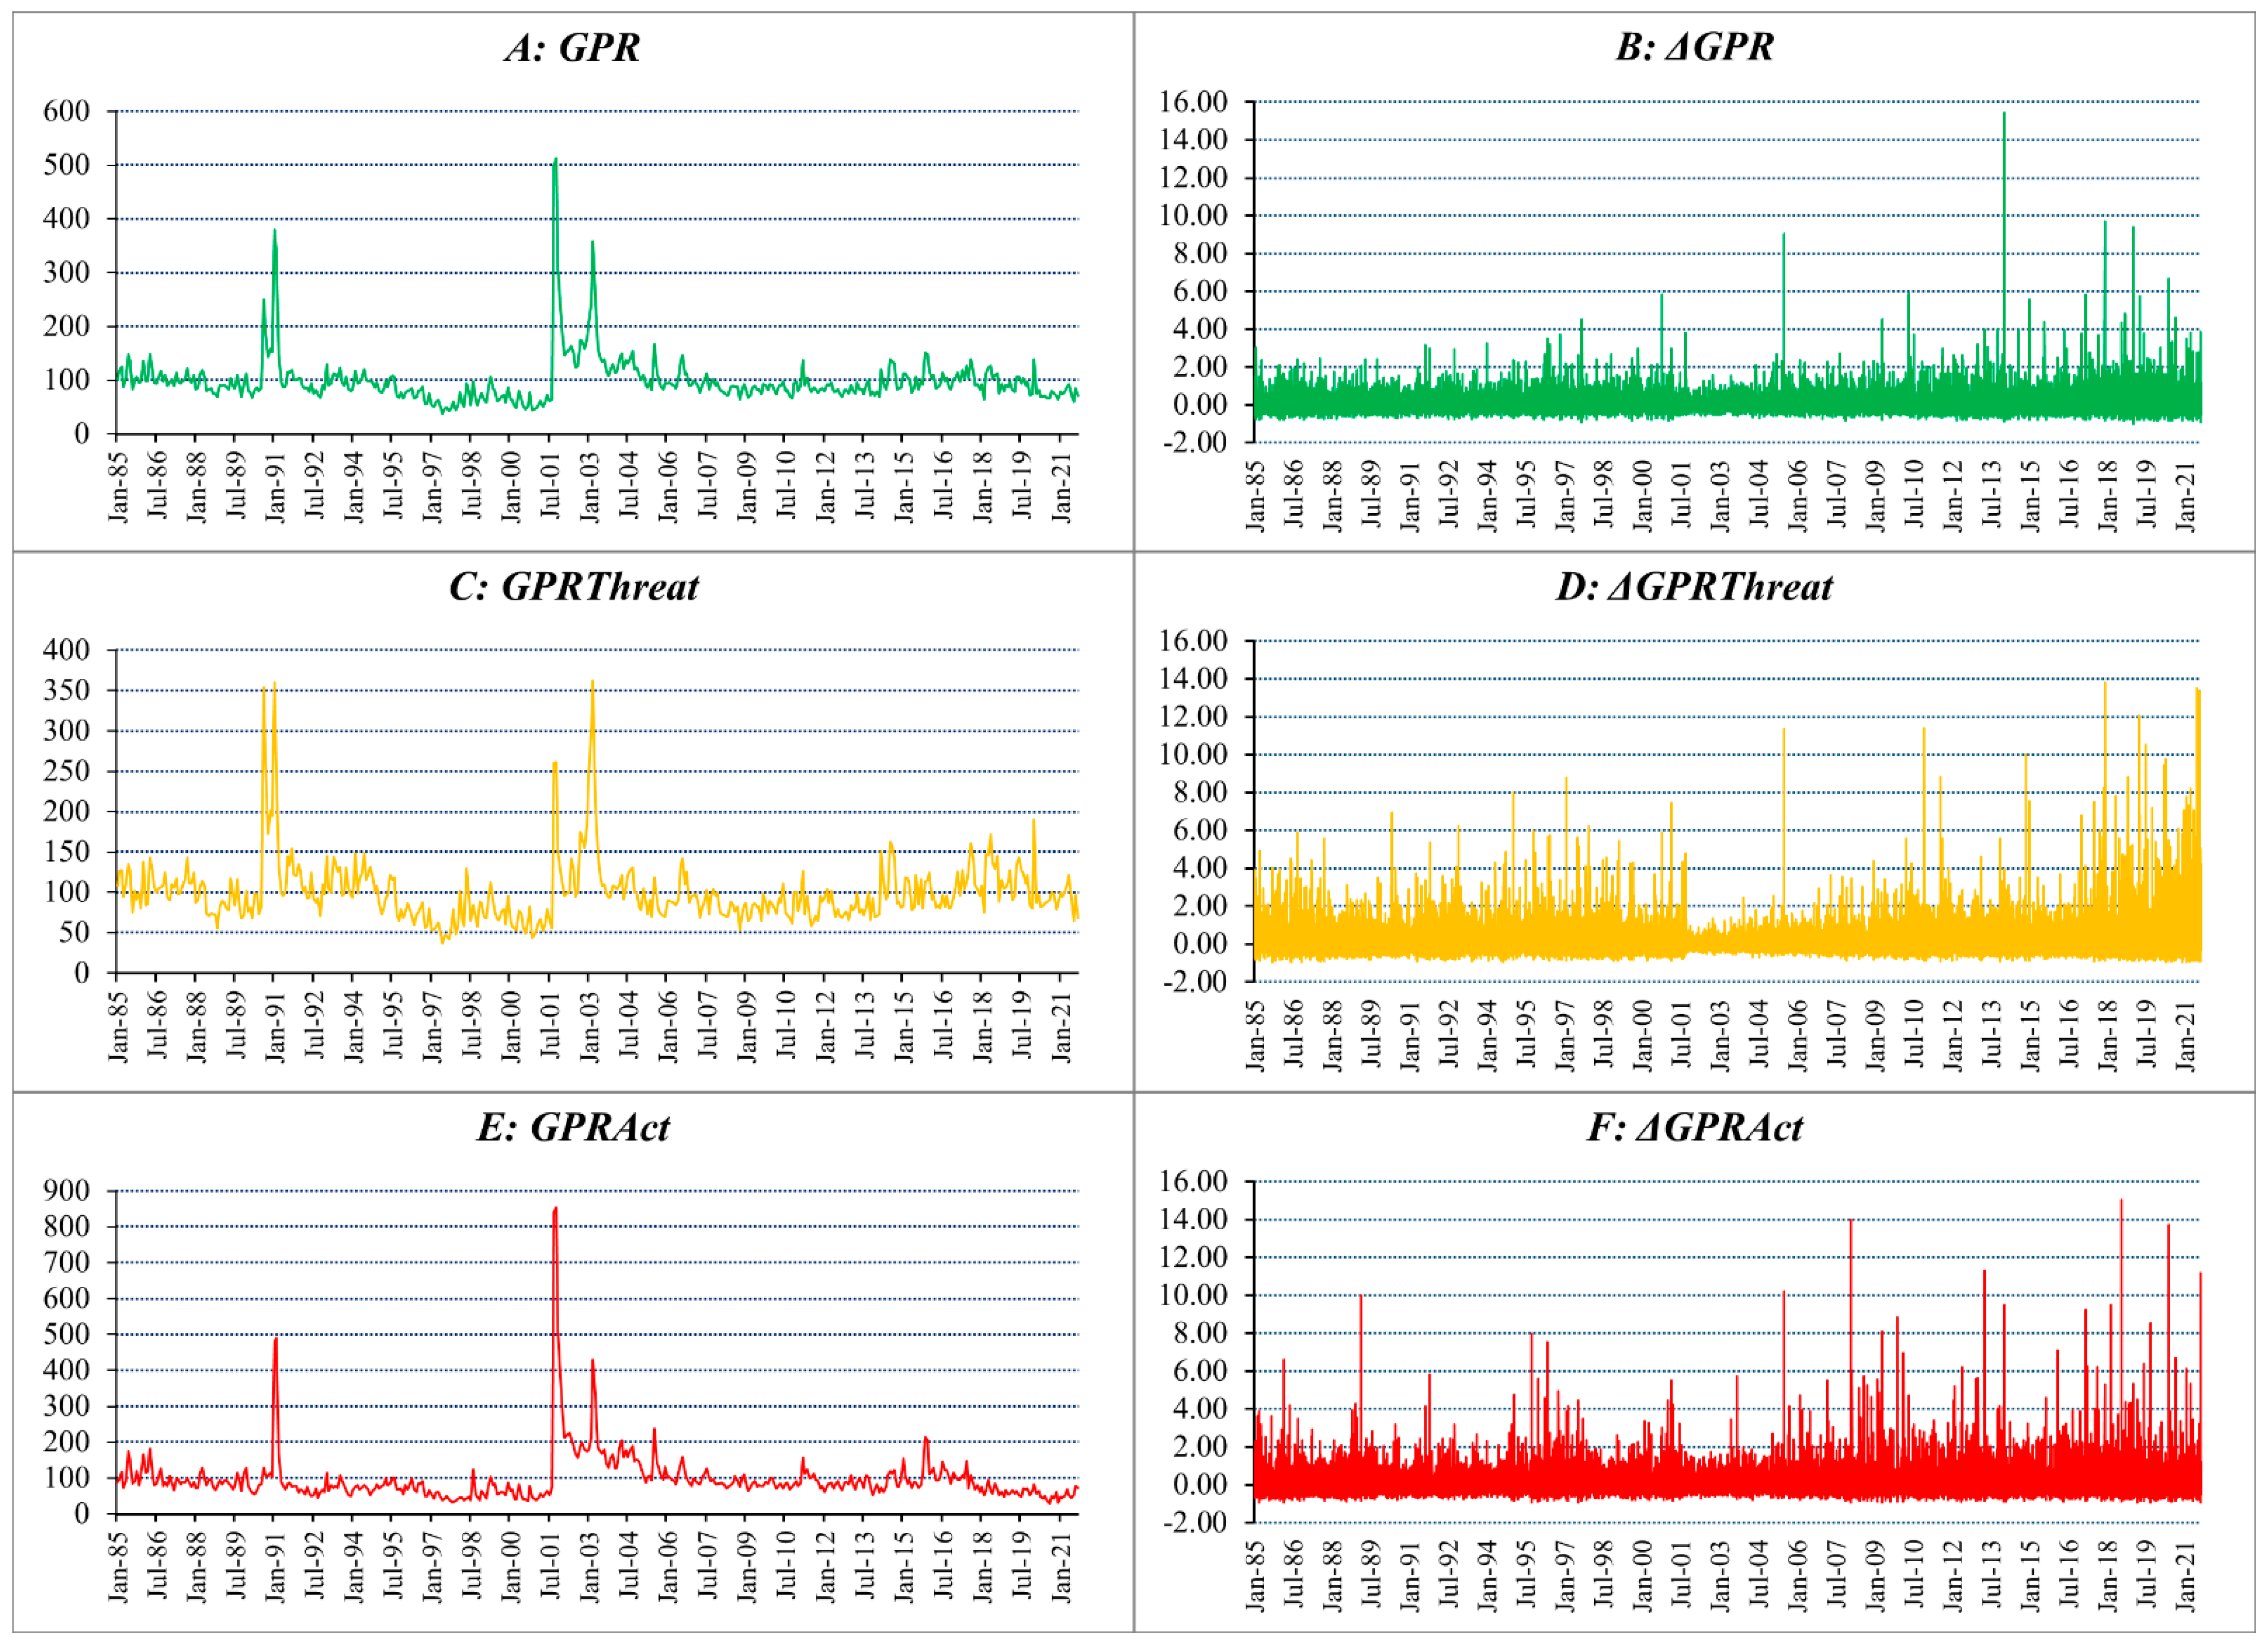
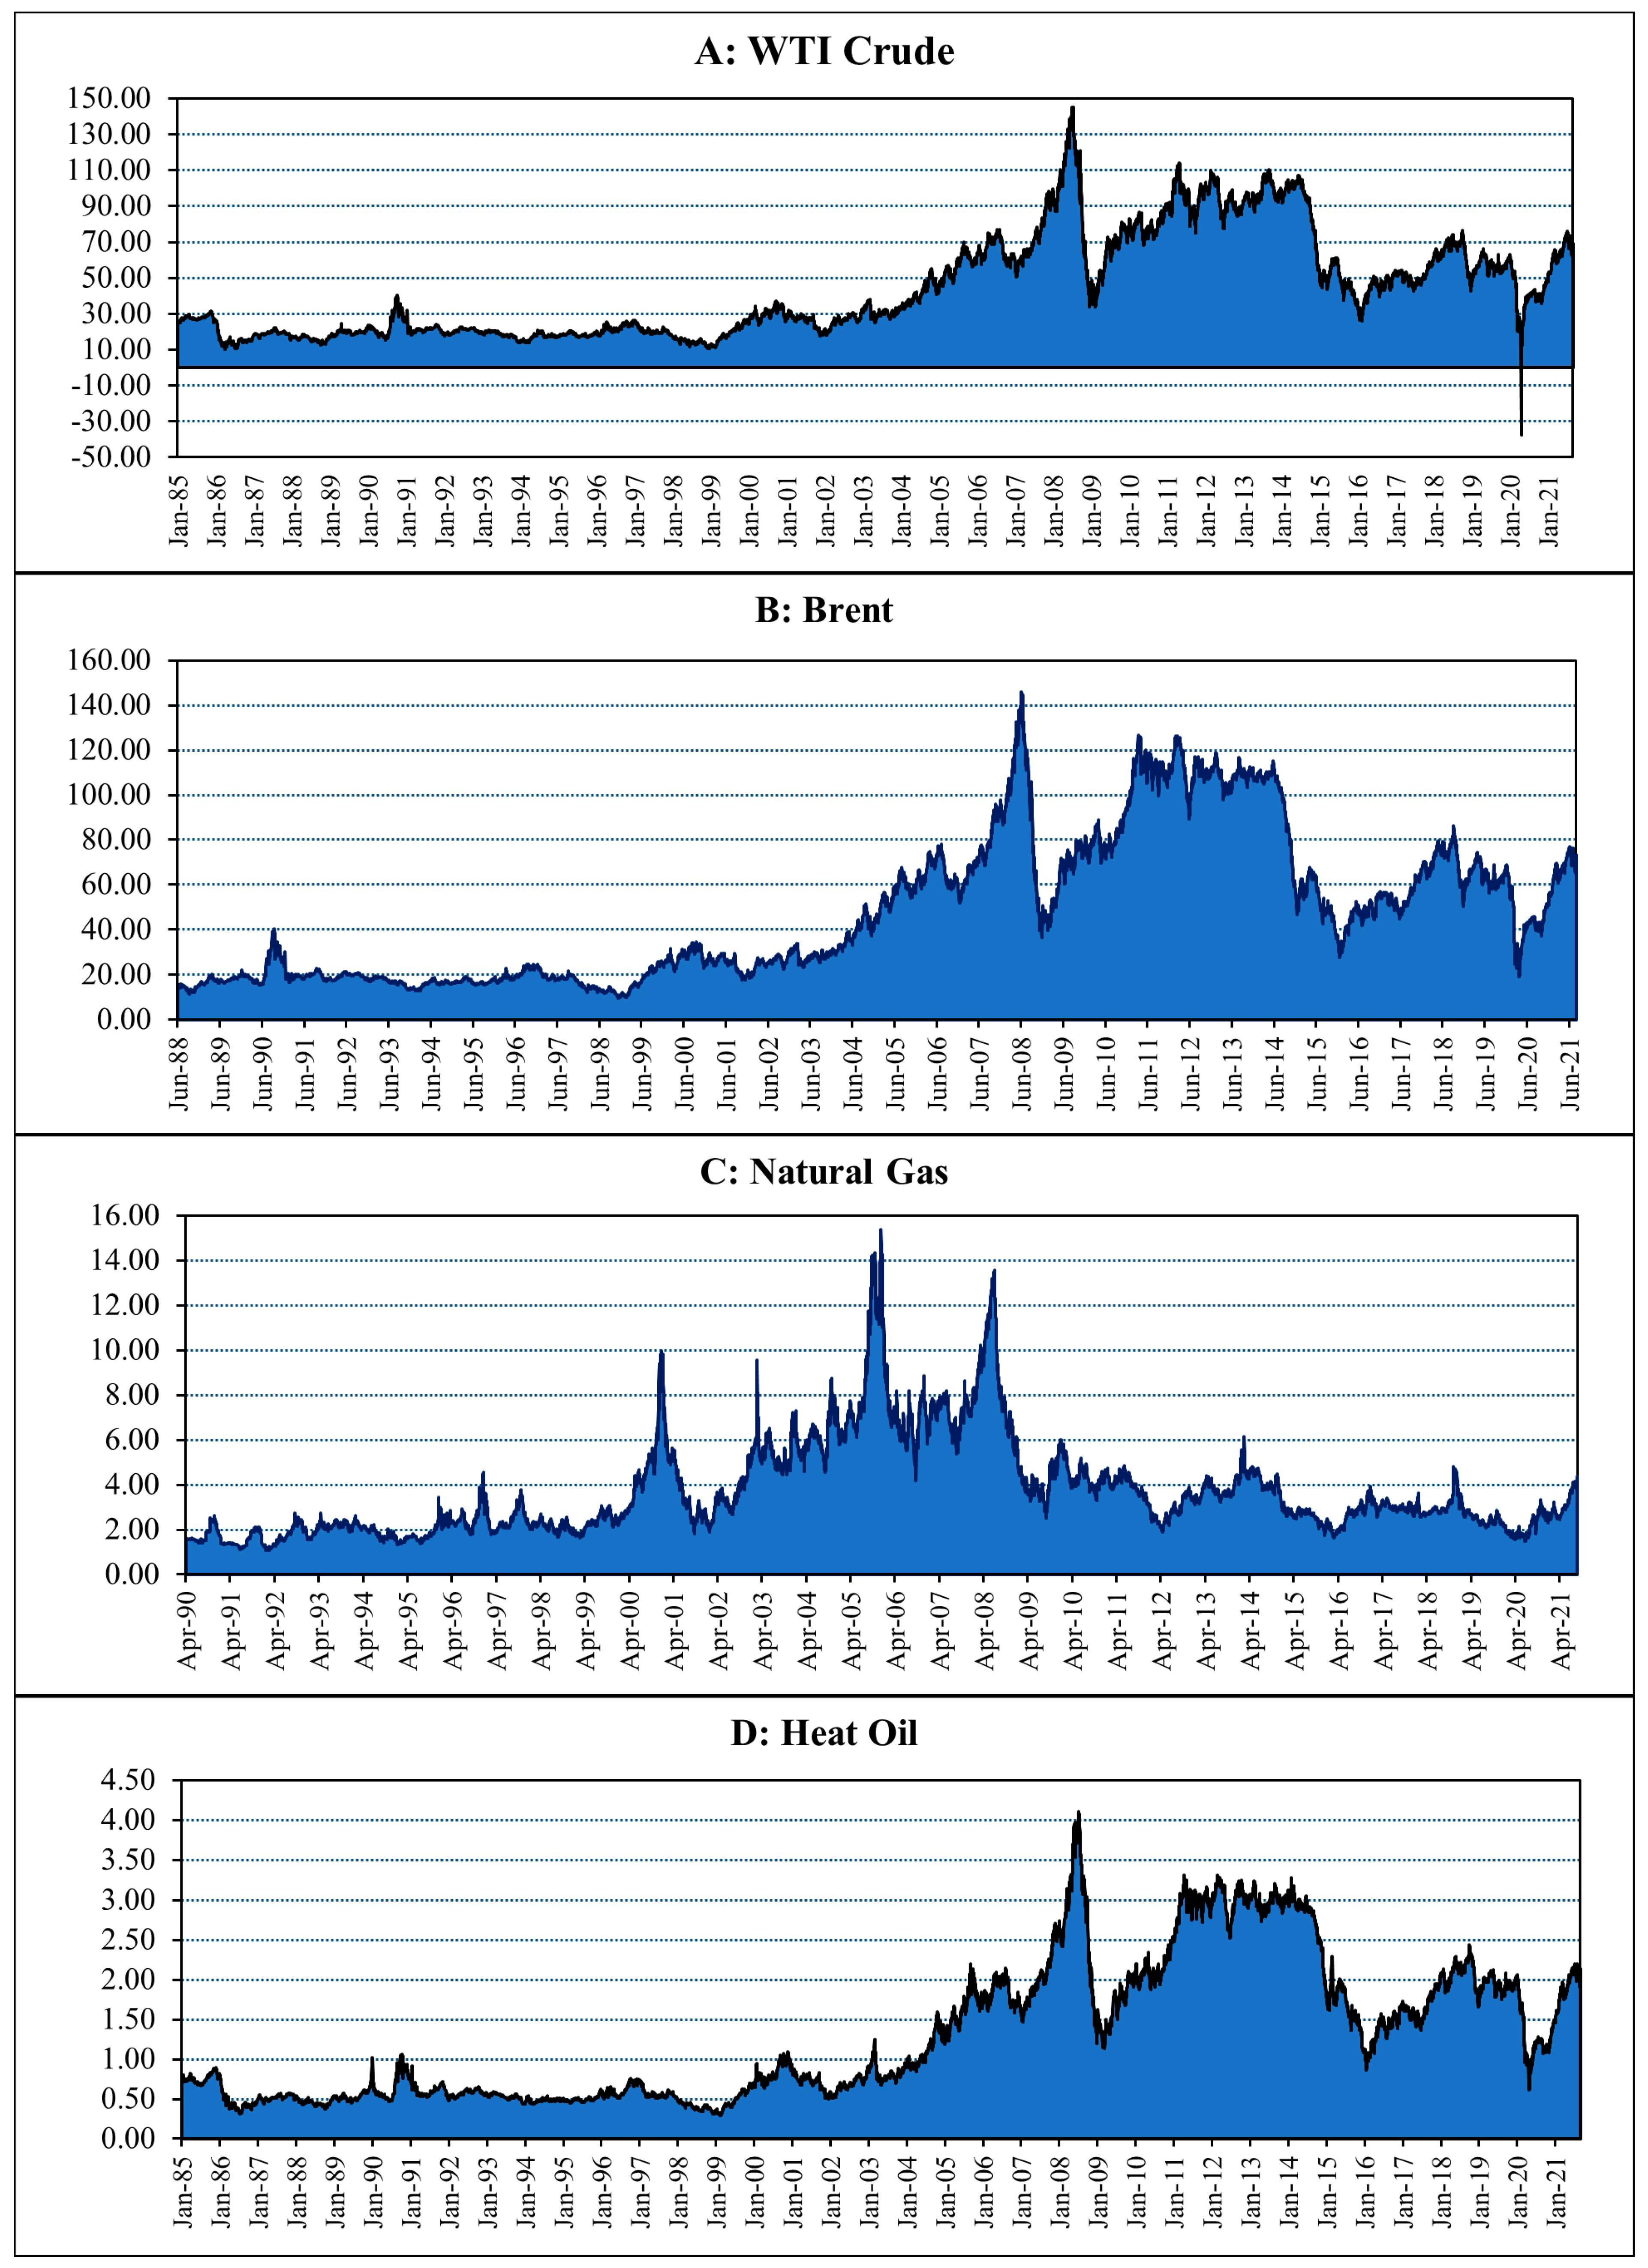
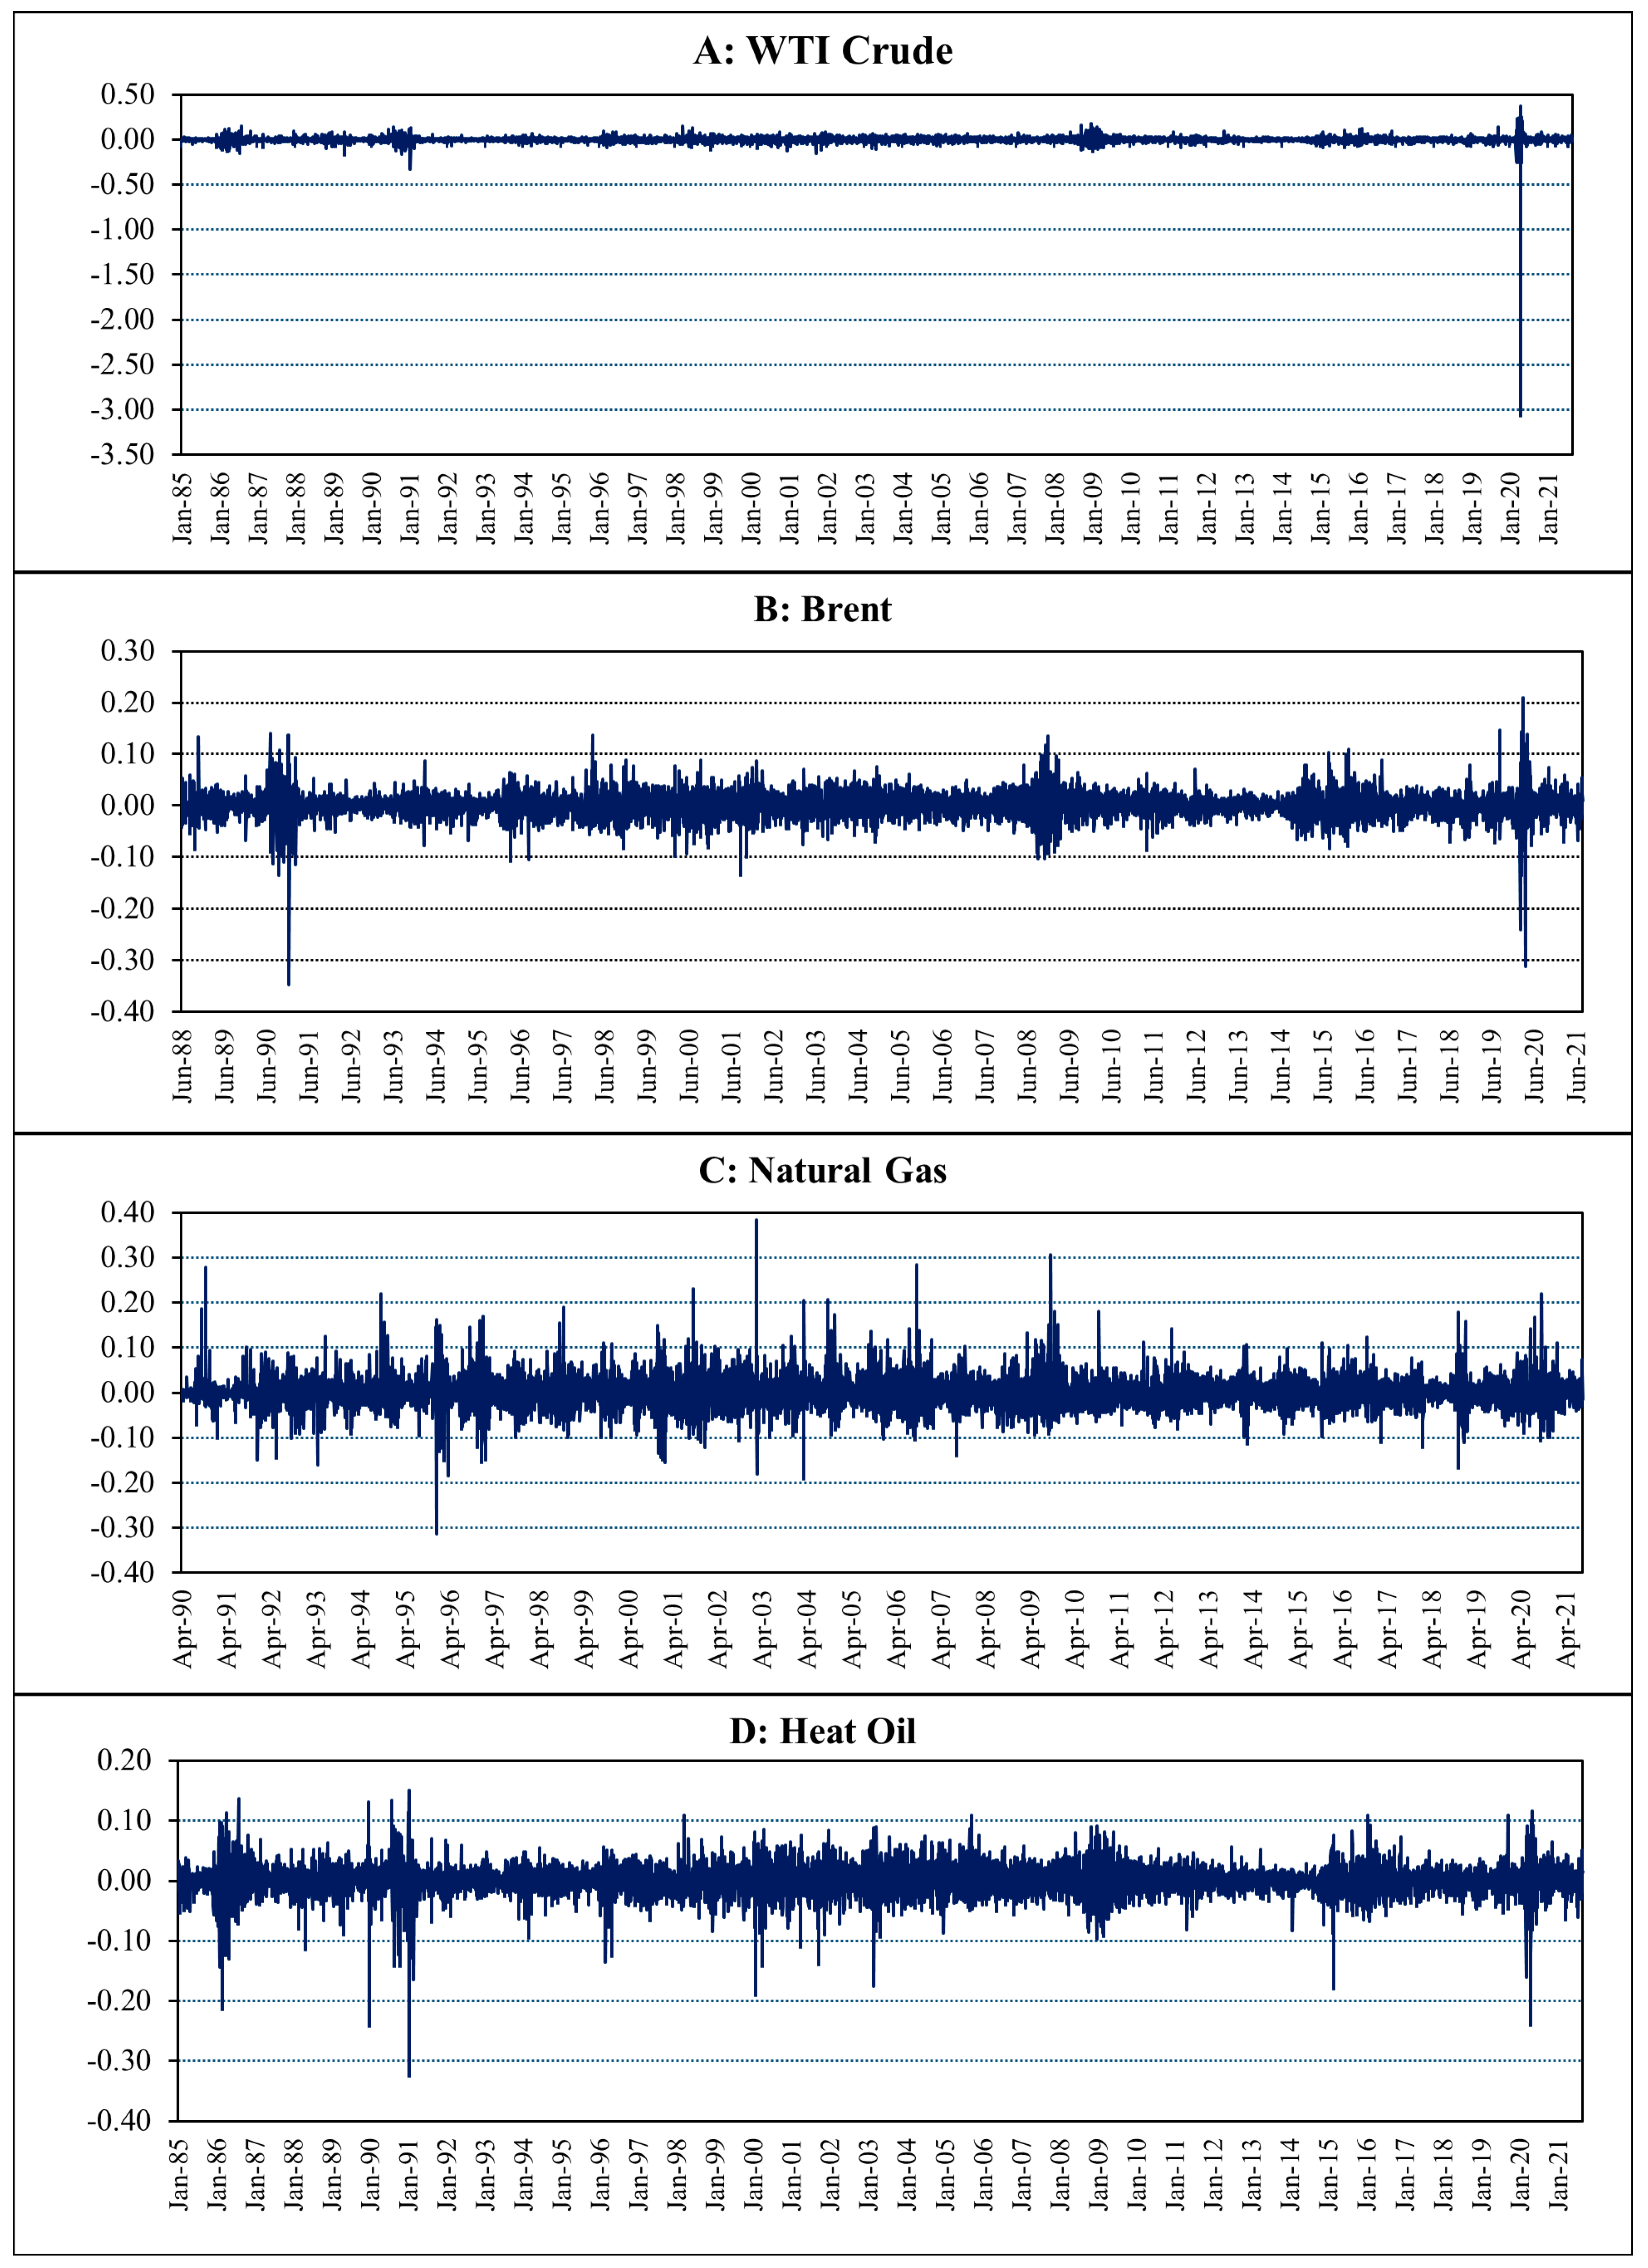
3.1. Data Description
3.2. Multifractal Detrended Cross-Correlation Analysis (MF-DCCA)
4. Empirical Results
5. Conclusions and Discussion
Author Contributions
Funding
Institutional Review Board Statement
Informed Consent Statement
Data Availability Statement
Conflicts of Interest
References
- Caldara, D.; Iacoviello, M. Measuring Geopolitical Risk. Am. Econ. Rev. 2022, 112, 1194–1225. [Google Scholar] [CrossRef]
- Legrenzi, G.; Heinlein, R.; Mahadeo, S. Ukraine and the Financial Markets: The Winners and Losers so Far. 2022. Available online: https://researchportal.port.ac.uk/en/publications/ukraine-and-financial-markets-the-winners-and-losers-so-far (accessed on 4 March 2022).
- Moritsch, S. The Geopolitical Impact of the Conflict in Ukraine. 2022. Available online: https://home.kpmg/xx/en/home/insights/2022/03/the-geopolitical-impact-of-the-conflict-in-ukraine.html (accessed on 4 March 2022).
- Salisu, A.A.; Pierdzioch, C.; Gupta, R. Geopolitical risk and forecastability of tail risk in the oil market: Evidence from over a century of monthly data. Energy 2021, 235, 121333. [Google Scholar] [CrossRef]
- Bouoiyour, J.; Selmi, R.; Hammoudeh, S.; Wohar, M.E. What are the categories of geopolitical risks that could drive oil prices higher? Acts or threats? Energy Econ. 2019, 84, 104523. [Google Scholar] [CrossRef]
- Carney, M. Uncertainty, the Economy and Policy; Bank of England: London, UK, 2016; Available online: https://www.bis.org/review/r160704c.pdf (accessed on 4 March 2022).
- Levy, O.; Galili, I. Terror and trade of individual investors. J. Socio-Econ. 2006, 35, 980–991. [Google Scholar] [CrossRef]
- Sharif, A.; Aloui, C.; Yarovaya, L. COVID-19 pandemic, oil prices, stock market, geopolitical risk and policy uncertainty nexus in the US economy: Fresh evidence from the wavelet-based approach. Int. Rev. Financ. Anal. 2020, 70, 101496. [Google Scholar] [CrossRef]
- Yang, J.; Yang, C. The impact of mixed-frequency geopolitical risk on stock market returns. Econ. Anal. Policy 2021, 72, 226–240. [Google Scholar] [CrossRef]
- Aslam, F.; Kang, H.-G. How different terrorist attacks affect stock markets. Def. Peace Econ. 2015, 26, 634–648. [Google Scholar] [CrossRef]
- Kyriazis, Ν.A. The effects of geopolitical uncertainty on cryptocurrencies and other financial assets. SN Bus. Econ. 2021, 1, 1–14. [Google Scholar] [CrossRef]
- Colon, F.; Kim, C.; Kim, H.; Kim, W. The effect of political and economic uncertainty on the cryptocurrency market. Financ. Res. Lett. 2021, 39, 101621. [Google Scholar] [CrossRef]
- Baur, D.G.; Smales, L.A. Hedging geopolitical risk with precious metals. J. Bank Financ. 2020, 117, 105823. [Google Scholar] [CrossRef]
- Yilanci, V.; Kilci, E.N. The role of economic policy uncertainty and geopolitical risk in predicting prices of precious metals: Evidence from a time-varying bootstrap causality test. Resour. Policy 2021, 72, 102039. [Google Scholar] [CrossRef]
- Yang, K.; Wei, Y.; Li, S.; He, J. Geopolitical risk and renewable energy stock markets: An insight from multiscale dynamic risk spillover. J. Clean. Prod. 2021, 279, 123429. [Google Scholar] [CrossRef]
- Alsagr, N.; van Hemmen, S. The impact of financial development and geopolitical risk on renewable energy consumption: Evidence from emerging markets. Environ. Sci. Pollut. Res. 2021, 28, 25906–25919. [Google Scholar] [CrossRef] [PubMed]
- Liu, J.; Ma, F.; Tang, Y.; Zhang, Y. Geopolitical risk and oil volatility: A new insight. Energy Econ. 2019, 84, 104548. [Google Scholar] [CrossRef]
- Su, C.-W.; Khan, K.; Tao, R.; Nicoleta-Claudia, M. Does geopolitical risk strengthen or depress oil prices and financial liquidity? Evidence from Saudi Arabia. Energy 2019, 187, 116003. [Google Scholar] [CrossRef]
- Lee, C.-C.; Lee, C.-C.; Li, Y.-Y. Oil price shocks, geopolitical risks, and green bond market dynamics. N. Am. J. Econ. Financ. 2021, 55, 101309. [Google Scholar] [CrossRef]
- Lang, K.; Auer, B.R. The economic and financial properties of crude oil: A review. N. Am. J. Econ. Financ. 2020, 52, 100914. [Google Scholar] [CrossRef]
- Karasu, S.; Altan, A.; Bekiros, S.; Ahmad, W. A new forecasting model with wrapper-based feature selection approach using multi-objective optimization technique for chaotic crude oil time series. Energy 2020, 212, 118750. [Google Scholar] [CrossRef]
- Peng, J.; Li, Z.; Drakeford, B.M. Dynamic characteristics of crude oil price fluctuation—From the perspective of crude oil price influence mechanism. Energies 2020, 13, 4465. [Google Scholar] [CrossRef]
- Khan, K.; Su, C.-W.; Umar, M.; Yue, X.-G. Do crude oil price bubbles occur? Resour. Policy 2021, 71, 101936. [Google Scholar] [CrossRef]
- Akdoğan, K. Fundamentals versus speculation in oil market: The role of asymmetries in price adjustment? Resour. Policy 2020, 67, 101653. [Google Scholar] [CrossRef]
- Faseli, O. The relationship between European Brent crude oil price development and US macroeconomy. Int. J. Res. Bus. Soc. Sci. 2020, 9, 80–87. [Google Scholar] [CrossRef] [Green Version]
- Lyu, Y.; Tuo, S.; Wei, Y.; Yang, M. Time-varying effects of global economic policy uncertainty shocks on crude oil price volatility: New evidence. Resour. Policy 2021, 70, 101943. [Google Scholar] [CrossRef]
- Gong, X.; Wang, M.; Shao, L. The impact of macro economy on the oil price volatility from the perspective of mixing frequency. Int. J. Financ. Econ. 2020, 1–28. [Google Scholar] [CrossRef]
- Jiang, Z.; Yoon, S.-M. Dynamic co-movement between oil and stock markets in oil-importing and oil-exporting countries: Two types of wavelet analysis. Energy Econ. 2020, 90, 104835. [Google Scholar] [CrossRef]
- Alkathery, M.A.; Chaudhuri, K. Co-movement between oil price, CO2 emission, renewable energy and energy equities: Evidence from GCC countries. J. Environ. Manag. 2021, 297, 113350. [Google Scholar] [CrossRef]
- Tudor, C.; Anghel, A. The Financialization of Crude Oil Markets and Its Impact on Market Efficiency: Evidence from the Predictive Ability and Performance of Technical Trading Strategies. Energies 2021, 14, 4485. [Google Scholar] [CrossRef]
- Liu, P.; Vedenov, D.; Power, G.J. Commodity financialization and sector ETFs: Evidence from crude oil futures. Res. Int. Bus. Financ. 2020, 51, 101109. [Google Scholar] [CrossRef]
- Bredin, D.; O’Sullivan, C.; Spencer, S. Forecasting WTI crude oil futures returns: Does the term structure help? Energy Econ. 2021, 100, 105350. [Google Scholar] [CrossRef]
- Leng, N.; Li, J.-C. Forecasting the crude oil prices based on Econophysics and Bayesian approach. Phys. A Stat. Mech. Its Appl. 2020, 554, 124663. [Google Scholar] [CrossRef]
- Ghazani, M.M.; Khosravi, R. Multifractal detrended cross-correlation analysis on benchmark cryptocurrencies and crude oil prices. Phys. A Stat. Mech. Its Appl. 2020, 560, 125172. [Google Scholar] [CrossRef]
- Yao, C.-Z.; Liu, C.; Ju, W.-J. Multifractal analysis of the WTI crude oil market, US stock market and EPU. Phys. A Stat. Mech. Its Appl. 2020, 550, 124096. [Google Scholar] [CrossRef]
- Anser, M.K.; Syed, Q.R.; Apergis, N. Does geopolitical risk escalate CO2 emissions? Evidence from the BRICS countries. Environ. Sci. Pollut. Res. 2021, 28, 48011–48021. [Google Scholar] [CrossRef] [PubMed]
- Escribano, G.; Valdes, J. Oil prices: Governance failures and geopolitical consequences. Geopolitics 2017, 22, 693–718. [Google Scholar] [CrossRef]
- Kutcherov, V.; Morgunova, M.; Bessel, V.; Lopatin, A. Russian natural gas exports: An analysis of challenges and opportunities. Energy Strategy Rev. 2020, 30, 100511. [Google Scholar] [CrossRef]
- Umar, M.; Su, C.H.; Rizvi, S.; Lobont, O.R. Driven by fundamentals or exploded by emotions: Detecting bubbles in oil prices. Energy 2021, 231, 120873. [Google Scholar] [CrossRef]
- Li, F.; Yang, C.; Li, Z.; Failler, P. Does Geopolitics Have an Impact on Energy Trade? Empirical Research on Emerging Countries. Sustainability 2021, 13, 5199. [Google Scholar] [CrossRef]
- Alsagr, N.; Almazor, S.F.V.H. Oil rent, geopolitical risk and banking sector performance. Int. J. Energy Econ. Policy 2020, 10, 305. [Google Scholar] [CrossRef]
- Gkillas, K.; Gupta, R.; Pierdzioch, C. Forecasting realized gold volatility: Is there a role of geopolitical risks? Financ. Res. Lett. 2020, 35, 101280. [Google Scholar] [CrossRef] [Green Version]
- Das, D.; Kannadhasan, M.; Bhowmik, P. Geopolitical risk and precious metals. J. Econ. Res. 2019, 24, 49–66. [Google Scholar]
- Plakandaras, V.; Gupta, R.; Wong, W.-K. Point and density forecasts of oil returns: The role of geopolitical risks. Resour. Policy 2019, 62, 580–587. [Google Scholar] [CrossRef] [Green Version]
- Alqahtani, A.; Bouri, E.; Vo, X.V. Predictability of GCC stock returns: The role of geopolitical risk and crude oil returns. Econ. Anal. Policy 2020, 68, 239–249. [Google Scholar] [CrossRef] [PubMed]
- Uddin, G.S.; Bekiros, S.; Ahmed, A. The nexus between geopolitical uncertainty and crude oil markets: An entropy-based wavelet analysis. Phys. A Stat. Mech. Appl. 2018, 495, 30–39. [Google Scholar] [CrossRef]
- Ding, Z.; Zhang, X. The Impact of Geopolitical Risk on Systemic Risk Spillover in Commodity Market: An EMD-Based Network Topology Approach. Complexity 2021, 2021, 2226944. [Google Scholar] [CrossRef]
- Bouri, E.; Gupta, R.; Hosseini, S.; Lau, C.K.M. Does global fear predict fear in BRICS stock markets? Evidence from a Bayesian Graphical Structural VAR model. Emerg. Mark. Rev. 2018, 34, 124–142. [Google Scholar] [CrossRef] [Green Version]
- Mandelbrot, B.B. The Fractal Geometry of Nature; WH Freeman: New York, NY, USA, 1982; Volume 1. [Google Scholar]
- Leary, C.C.; Ruppe, D.A.; Hartvigsen, G. Fractals, average distance and the Cantor set. Fractals 2010, 18, 327–341. [Google Scholar] [CrossRef]
- Mandelbrot, B.B. The variation of the prices of cotton, wheat, and railroad stocks, and of some financial rates. In Fractals and Scaling in Finance; Springer: Berlin/Heidelberg, Germany, 1997; pp. 419–443. [Google Scholar]
- Mandelbrot, B.B. The variation of certain speculative prices. In Fractals and Scaling in Finance; Springer: Berlin/Heidelberg, Germany, 1997; pp. 371–418. [Google Scholar]
- Muzy, J.-F.; Bacry, E.; Baile, R.; Poggi, P. Uncovering latent singularities from multifractal scaling laws in mixed asymptotic regime. Application to turbulence. EPL (Europhys. Lett.) 2008, 82, 60007. [Google Scholar] [CrossRef] [Green Version]
- Subramaniam, A.R.; Gruzberg, I.A.; Ludwig, A.W. Boundary criticality and multifractality at the two-dimensional spin quantum Hall transition. Phys. Rev. B 2008, 78, 245105. [Google Scholar] [CrossRef] [Green Version]
- Stanley, H.E.; Meakin, P. Multifractal phenomena in physics and chemistry. Nature 1988, 335, 405–409. [Google Scholar] [CrossRef]
- Udovichenko, V.; Strizhak, P. Multifractal properties of copper sulfide film formed in self-organizing chemical system. Theor. Exp. Chem. 2002, 38, 259–262. [Google Scholar] [CrossRef]
- Rosas, A.; Nogueira Jr, E.; Fontanari, J.F. Multifractal analysis of DNA walks and trails. Phys. Rev. E 2002, 66, 061906. [Google Scholar] [CrossRef] [PubMed] [Green Version]
- Makowiec, D.; Dudkowska, A.; Gałaska, R.; Rynkiewicz, A. Multifractal estimates of monofractality in RR-heart series in power spectrum ranges. Phys. A Stat. Mech. Appl. 2009, 388, 3486–3502. [Google Scholar] [CrossRef]
- Telesca, L.; Lapenna, V.; Macchiato, M. Multifractal fluctuations in earthquake-related geoelectrical signals. New J. Phys. 2005, 7, 214. [Google Scholar] [CrossRef]
- Farjah, E. Proposing an Efficient Wind Forecasting Agent Using Adaptive MFDFA. J. Power Technol. 2019, 99, 152–162. [Google Scholar]
- Drożdż, S.; Oświȩcimka, P.; Kulig, A.; Kwapień, J.; Bazarnik, K.; Grabska-Gradzińska, I.; Rybicki, J.; Stanuszek, M. Quantifying origin and character of long-range correlations in narrative texts. Inf. Sci. 2016, 331, 32–44. [Google Scholar] [CrossRef] [Green Version]
- Nagy, Z.; Mukli, P.; Herman, P.; Eke, A. Decomposing multifractal crossovers. Front. Physiol. 2017, 8, 533. [Google Scholar] [CrossRef] [Green Version]
- Kelty-Stephen, D.G. Threading a multifractal social psychology through within-organism coordination to within-group interactions: A tale of coordination in three acts. Chaos Solitons Fractals 2017, 104, 363–370. [Google Scholar] [CrossRef]
- Stephen, D.G.; Hsu, W.-H.; Young, D.; Saltzman, E.L.; Holt, K.G.; Newman, D.J.; Weinberg, M.; Wood, R.J.; Nagpal, R.; Goldfield, E.C. Multifractal fluctuations in joint angles during infant spontaneous kicking reveal multiplicativity-driven coordination. Chaos Solitons Fractals 2012, 45, 1201–1219. [Google Scholar] [CrossRef]
- Ihlen, E.A.; Vereijken, B. Multifractal formalisms of human behavior. Hum. Mov. Sci. 2013, 32, 633–651. [Google Scholar] [CrossRef]
- Drożdż, S.; Kwapień, J.; Oświȩcimka, P.; Rak, R. The foreign exchange market: Return distributions, multifractality, anomalous multifractality and the Epps effect. New J. Phys. 2010, 12, 105003. [Google Scholar] [CrossRef]
- Jafari, G.; Pedram, P.; Hedayatifar, L. Long-range correlation and multifractality in Bach’s inventions pitches. J. Stat. Mech. Theory Exp. 2007, 2007, P04012. [Google Scholar] [CrossRef] [Green Version]
- Ali, H.; Aslam, F.; Ferreira, P. Modeling Dynamic Multifractal Efficiency of US Electricity Market. Energies 2021, 14, 6145. [Google Scholar] [CrossRef]
- Barunik, J.; Aste, T.; Di Matteo, T.; Liu, R. Understanding the source of multifractality in financial markets. Phys. A Stat. Mech. Appl. 2012, 391, 4234–4251. [Google Scholar] [CrossRef] [Green Version]
- Hurst, H.E. Long-term storage capacity of reservoirs. Trans. Am. Soc. Civ. Eng. 1951, 116, 770–799. [Google Scholar] [CrossRef]
- Peng, C.-K.; Buldyrev, S.V.; Havlin, S.; Simons, M.; Stanley, H.E.; Goldberger, A.L. Mosaic organization of DNA nucleotides. Phys. Rev. E 1994, 49, 1685. [Google Scholar] [CrossRef] [Green Version]
- Lo, A.W. Long-term memory in stock market prices. Econom. J. Econom. Soc. 1991, 59, 1279–1313. [Google Scholar] [CrossRef]
- Green, E.; Hanan, W.; Heffernan, D. The origins of multifractality in financial time series and the effect of extreme events. Eur. Phys. J. B 2014, 87, 1–9. [Google Scholar] [CrossRef]
- Kantelhardt, J.W.; Zschiegner, S.A.; Koscielny-Bunde, E.; Havlin, S.; Bunde, A.; Stanley, H.E. Multifractal detrended fluctuation analysis of nonstationary time series. Phys. A Stat. Mech. Its Appl. 2002, 316, 87–114. [Google Scholar] [CrossRef] [Green Version]
- He, L.-Y.; Chen, S.-P. Are crude oil markets multifractal? Evidence from MF-DFA and MF-SSA perspectives. Phys. A Stat. Mech. Its Appl. 2010, 389, 3218–3229. [Google Scholar] [CrossRef]
- Aslam, F.; Ferreira, P.; Ali, H.; Kauser, S. Herding behavior during the COVID-19 pandemic: A comparison between Asian and European stock markets based on intraday multifractality. Eurasian Econ. Rev. 2021, 1–27. [Google Scholar] [CrossRef]
- Aslam, F.; Ferreira, P.; Mohti, W. Investigating Efficiency of Frontier Stock Markets using Multifractal Detrended Fluctuation Analysis. Int. J. Emerg. Mark. 2021, 1–27, ahead-of-print. [Google Scholar] [CrossRef]
- Aslam, F.; Ferreira, P.; Mughal, K.S.; Bashir, B. Intraday Volatility Spillovers among European Financial Markets during COVID-19. Int. J. Financ. Stud. 2021, 9, 5. [Google Scholar] [CrossRef]
- Mnif, E.; Jarboui, A.; Mouakhar, K. How the cryptocurrency market has performed during COVID-19? A multifractal analysis. Financ. Res. Lett. 2020, 36, 101647. [Google Scholar] [CrossRef] [PubMed]
- Aslam, F.; Ferreira, P.; Amjad, F.; Ali, H. The Efficiency of Sin Stocks: A Multifractal Analysis of Drug Indices. Singap. Econ. Rev. 2021, 1–22. [Google Scholar] [CrossRef]
- Podobnik, B.; Jiang, Z.-Q.; Zhou, W.-X.; Stanley, H.E. Statistical tests for power-law cross-correlated processes. Phys. Rev. E 2011, 84, 066118. [Google Scholar] [CrossRef] [Green Version]
- Ferreira, P.; Dionísio, A.; Zebende, G. Why does the Euro fail? The DCCA approach. Phys. A Stat. Mech. Appl. 2016, 443, 543–554. [Google Scholar] [CrossRef]
- Ferreira, P.J.S.; Dionísio, A. G7 stock markets: Who is the first to defeat the DCCA correlation? Rev. Socio-Econ. Perspect. 2016, 1, 107–120. [Google Scholar]
- Zhou, W.-X. Multifractal detrended cross-correlation analysis for two nonstationary signals. Phys. Rev. E 2008, 77, 066211. [Google Scholar] [CrossRef] [Green Version]
- Devi, P.; Kumar, P.; Kumar, S. Multi-fractal detrended cross-correlation analysis (MFDCCA) approach to study effect of global crisis and demonetization on financial sector of India. Math.Eng. Sci. Aerosp. (MESA) 2021, 12, 601–614. [Google Scholar]
- Gu, D.; Huang, J. Multifractal detrended cross-correlation analysis of high-frequency stock series based on ensemble empirical mode decomposition. Fractals 2020, 28, 2050035. [Google Scholar] [CrossRef]
- Aslam, F.; Bibi, R.; Ferreira, P. Cross-correlations between economic policy uncertainty and precious and industrial metals: A multifractal cross-correlation analysis. Resour. Policy 2022, 75, 102473. [Google Scholar] [CrossRef]
- Ivanovski, K.; Hailemariam, A. Time-varying geopolitical risk and oil prices. Int. Rev. Econ. Financ. 2022, 77, 206–221. [Google Scholar] [CrossRef]
- Mei, D.; Ma, F.; Liao, Y.; Wang, L. Geopolitical risk uncertainty and oil future volatility: Evidence from MIDAS models. Energy Econ. 2020, 86, 104624. [Google Scholar] [CrossRef]
- Agnew, J. Geopolitics: Re-Visioning World Politics; Routledge: London, UK, 2002. [Google Scholar]
- Kaplanski, G.; Levy, H. Sentiment and stock prices: The case of aviation disasters. J. Financ. Econ. 2010, 95, 174–201. [Google Scholar] [CrossRef]
- Hudson, R.; Urquhart, A. War and stock markets: The effect of World War Two on the British stock market. Int. Rev. Financ. Anal. 2015, 40, 166–177. [Google Scholar] [CrossRef] [Green Version]
- Yang, M.; Zhang, Q.; Yi, A.; Peng, P. Geopolitical risk and stock market volatility in emerging economies: Evidence from GARCH-MIDAS model. Discret. Dyn. Nat. Soc. 2021, 2021, 1159358. [Google Scholar] [CrossRef]
- Das, D.; Kannadhasan, M.; Bhattacharyya, M. Do the emerging stock markets react to international economic policy uncertainty, geopolitical risk and financial stress alike? N. Am. J. Econ. Financ. 2019, 48, 1–19. [Google Scholar] [CrossRef]
- Kannadhasan, M.; Das, D. Do Asian emerging stock markets react to international economic policy uncertainty and geopolitical risk alike? A quantile regression approach. Financ. Res. Lett. 2020, 34, 101276. [Google Scholar] [CrossRef]
- Hui, H.C. The long-run effects of geopolitical risk on foreign exchange markets: Evidence from some ASEAN countries. Int. J. Emerg. Mark. 2021. [Google Scholar] [CrossRef]
- Kisswani, K.M.; Elian, M.I. Analyzing the (a) symmetric impacts of oil price, economic policy uncertainty, and global geopolitical risk on exchange rate. J. Econ. Asymmetries 2021, 24, e00204. [Google Scholar] [CrossRef]
- Antonakakis, N.; Gupta, R.; Kollias, C.; Papadamou, S. Geopolitical risks and the oil-stock nexus over 1899–2016. Financ. Res. Lett. 2017, 23, 165–173. [Google Scholar] [CrossRef] [Green Version]
- Huang, J.; Ding, Q.; Zhang, H.; Guo, Y.; Suleman, M.T. Nonlinear dynamic correlation between geopolitical risk and oil prices: A study based on high-frequency data. Res. Int. Bus. Financ. 2021, 56, 101370. [Google Scholar] [CrossRef]
- Chen, G.; Wu, X. Energy overview for globalized world economy: Source, supply chain and sink. Renew. Sustain. Energy Rev. 2017, 69, 735–749. [Google Scholar] [CrossRef]
- Tian, M.; Li, W.; Wen, F. The dynamic impact of oil price shocks on the stock market and the USD/RMB exchange rate: Evidence from implied volatility indices. N. Am. J. Econ. Financ. 2021, 55, 101310. [Google Scholar] [CrossRef]
- Chen, J.; Zhu, X. The effects of different types of oil price shocks on industrial PPI: Evidence from 36 sub-industries in China. Emerg. Mark. Financ. Trade 2021, 57, 3411–3434. [Google Scholar] [CrossRef]
- Qin, Y.; Hong, K.; Chen, J.; Zhang, Z. Asymmetric effects of geopolitical risks on energy returns and volatility under different market conditions. Energy Econ. 2020, 90, 104851. [Google Scholar] [CrossRef]
- Aloui, C.; Hamida, H.B. Oil-stock Nexus in an Oil-rich Country: Does Geopolitical Risk Matter in Terms of Investment Horizons? Def. Peace Econ. 2021, 32, 468–488. [Google Scholar] [CrossRef]
- Bouri, E.; Gupta, R.; Vo, X.V. Jumps in Geopolitical Risk and the Cryptocurrency Market: The Singularity of Bitcoin. Def. Peace Econ. 2020, 33, 150–161. [Google Scholar] [CrossRef]
- Triki, M.B.; Maatoug, A.B. The GOLD market as a safe haven against the stock market uncertainty: Evidence from geopolitical risk. Resour. Policy 2021, 70, 101872. [Google Scholar] [CrossRef]
- Kotcharin, S.; Maneenop, S. Geopolitical risk and corporate cash holdings in the shipping industry. Transp. Res. Part E Logist. Transp. Rev. 2020, 136, 101862. [Google Scholar] [CrossRef]
- Le, A.-T.; Tran, T.P. Does geopolitical risk matter for corporate investment? Evidence from emerging countries in Asia. J. Multinatl. Financ. Manag. 2021, 62, 100703. [Google Scholar] [CrossRef]
- Lee, C.-C.; Wang, C.-W. Firms’ cash reserve, financial constraint, and geopolitical risk. Pac.-Basin Financ. J. 2021, 65, 101480. [Google Scholar] [CrossRef]
- Lee, C.-C.; Lee, C.-C. Insurance activity, real output, and geopolitical risk: Fresh evidence from BRICS. Econ. Model. 2020, 92, 207–215. [Google Scholar] [CrossRef]
- Shen, H.; Liang, Y.; Li, H.; Liu, J.; Lu, G. Does geopolitical risk promote mergers and acquisitions of listed companies in energy and electric power industries. Energy Econ. 2021, 95, 105115. [Google Scholar] [CrossRef]
- Dogan, E.; Majeed, M.T.; Luni, T. Analyzing the impacts of geopolitical risk and economic uncertainty on natural resources rents. Resour. Policy 2021, 72, 102056. [Google Scholar] [CrossRef]
- Baek, S.; Lee, K.Y. The risk transmission of COVID-19 in the US stock market. Appl. Econ. 2021, 53, 1976–1990. [Google Scholar] [CrossRef]
- Finlan, A. The Gulf War 1991; Routledge: London, UK, 2003. [Google Scholar]
- Noguera-Santaella, J. Geopolitics and the oil price. Econ. Model. 2016, 52, 301–309. [Google Scholar] [CrossRef]
- Peters, E.E. Chaos and Order in the Capital Markets: A New View of Cycles, Prices, and Market Volatility; John Wiley & Sons: Hoboken, NJ, USA, 1996. [Google Scholar]
- Fama, E.F. Efficient capital markets: A review of theory and empirical work. J. Financ. 1970, 25, 383–417. [Google Scholar] [CrossRef]
- Perron, P.; Vogelsang, T.J. Nonstationarity and level shifts with an application to purchasing power parity. J. Bus. Econ. Stat. 1992, 10, 301–320. [Google Scholar]
- Perron, P. Further evidence on breaking trend functions in macroeconomic variables. J. Econom. 1997, 80, 355–385. [Google Scholar] [CrossRef] [Green Version]
- Kantelhardt, J.W. Fractal and Multifractal Time Series. In Mathematics of Complexity and Dynamical Systems; Meyers, R.A., Ed.; Springer: New York, NY, USA, 2011; pp. 463–487. [Google Scholar]
- Kristoufek, L. Multifractal height cross-correlation analysis: A new method for analyzing long-range cross-correlations. EPL (Europhys. Lett.) 2011, 95, 68001. [Google Scholar] [CrossRef] [Green Version]
- Yuan, Y.; Zhuang, X.-T.; Jin, X. Measuring multifractality of stock price fluctuation using multifractal detrended fluctuation analysis. Phys. A Stat. Mech. Appl. 2009, 388, 2189–2197. [Google Scholar] [CrossRef]
- Zunino, L.; Tabak, B.M.; Figliola, A.; Pérez, D.; Garavaglia, M.; Rosso, O. A multifractal approach for stock market inefficiency. Phys. A Stat. Mech. Its Appl. 2008, 387, 6558–6566. [Google Scholar] [CrossRef]
- Laib, M.; Golay, J.; Telesca, L.; Kanevski, M. Multifractal analysis of the time series of daily means of wind speed in complex regions. Chaos Solitons Fractals 2018, 109, 118–127. [Google Scholar] [CrossRef] [Green Version]
- Laib, M.; Telesca, L.; Kanevski, M. Long-range fluctuations and multifractality in connectivity density time series of a wind speed monitoring network. Chaos Interdiscip. J. Nonlinear Sci. 2018, 28, 033108. [Google Scholar] [CrossRef] [Green Version]
- Oświȩcimka, P.; Drożdż, S.; Forczek, M.; Jadach, S.; Kwapień, J. Detrended cross-correlation analysis consistently extended to multifractality. Phys. Rev. E 2014, 89, 023305. [Google Scholar] [CrossRef] [Green Version]
- Lo, A.W. The adaptive markets hypothesis. J. Portf. Manag. 2004, 30, 15–29. [Google Scholar] [CrossRef]
- Ferreira, P. Assessing the relationship between dependence and volume in stock markets: A dynamic analysis. Phys. A Stat. Mech. Its Appl. 2019, 516, 90–97. [Google Scholar] [CrossRef]
- Hasan, R.; Salim, M.M. Power law cross-correlations between price change and volume change of Indian stocks. Phys. A Stat. Mech. Its Appl. 2017, 473, 620–631. [Google Scholar] [CrossRef]
- Ruan, Q.; Jiang, W.; Ma, G. Cross-correlations between price and volume in Chinese gold markets. Phys. A Stat. Mech. Its Appl. 2016, 451, 10–22. [Google Scholar] [CrossRef]
- Podobnik, B.; Grosse, I.; Stanley, H.E. Stochastic processes with power-law stability and a crossover in power-law correlations. Phys. A Stat. Mech. Appl. 2002, 316, 153–159. [Google Scholar] [CrossRef]
- Podobnik, B.; Stanley, H.E. Detrended cross-correlation analysis: A new method for analyzing two nonstationary time series. Phys. Rev. Lett. 2008, 100, 084102. [Google Scholar] [CrossRef] [PubMed] [Green Version]
- Yuan, Y.; Zhuang, X.-t.; Liu, Z.-y. Price–volume multifractal analysis and its application in Chinese stock markets. Phys. A Stat. Mech. Its Appl. 2012, 391, 3484–3495. [Google Scholar] [CrossRef]
- Chen, Y.-W.; Chiu, C.-Y.; Hsiao, M.-C. An Auxiliary Index for Reducing Brent Crude Investment Risk—Evaluating the Price Relationships between Brent Crude and Commodities. Sustainability 2021, 13, 5050. [Google Scholar] [CrossRef]
- Zhang, S.; Guo, Y.; Cheng, H.; Zhang, H. Cross-correlations between price and volume in China’s crude oil futures market: A study based on multifractal approaches. Chaos Solitons Fractals 2021, 144, 110642. [Google Scholar] [CrossRef]
- Ji, Q.; Fan, Y. Dynamic integration of world oil prices: A reinvestigation of globalisation vs. regionalisation. Appl. Energy 2015, 155, 171–180. [Google Scholar] [CrossRef]
- Demirer, R.; Gupta, R.; Ji, Q.; Tiwari, A.K. Geopolitical risks and the predictability of regional oil returns and volatility. OPEC Energy Rev. 2019, 43, 342–361. [Google Scholar] [CrossRef]
- Ji, Q.; Geng, J.-B.; Tiwari, A.K. Information spillovers and connectedness networks in the oil and gas markets. Energy Econ. 2018, 75, 71–84. [Google Scholar] [CrossRef]
- Tiwari, A.K.; Suleman, M.T.; Ullah, S.; Shahbaz, M. Analyzing the connectedness between crude oil and petroleum products: Evidence from USA. Int. J. Financ. Econ. 2021. [Google Scholar] [CrossRef]
- Ftiti, Z.; Jawadi, F.; Louhichi, W.; Madani, M.E.A. Are oil and gas futures markets efficient? A multifractal analysis. Appl. Econ. 2021, 53, 164–184. [Google Scholar] [CrossRef]
- Cao, G.; Xu, W. Nonlinear structure analysis of carbon and energy markets with MFDCCA based on maximum overlap wavelet transform. Phys. A Stat. Mech. Its Appl. 2016, 444, 505–523. [Google Scholar] [CrossRef]


| GPR | GPRAct | GPRThreat | WTI Crude | Brent Oil | Natural Gas | Heating Oil | |
|---|---|---|---|---|---|---|---|
| Data Range | 1 January 1985–30 August 2021 | 1 January 1985–30 August 2021 | 1 January 1985–30 August 2021 | 1 January 1985–30 August 2021 | 28 June 1988–30 August 2021 | 5 April 1990–30 August 2021 | 1 January 1985–30 August 2021 |
| N | 13,336 | 13,336 | 13,336 | 9174 | 8377 | 7883 | 9277 |
| Mean | 0.1018 | 0.1888 | 0.1590 | 0.0004 | 0.0005 | 0.0007 | 0.0004 |
| Median | −0.0071 | −0.0045 | −0.0108 | 0.0009 | 0.0003 | −0.0004 | 0.0007 |
| Min | −0.9511 | −0.9273 | −0.9001 | −0.3300 | −0.3477 | −0.3132 | −0.3236 |
| Max | 15.4331 | 13.8347 | 15.0303 | 0.2510 | 0.2102 | 0.3831 | 0.1502 |
| S.D. | 0.5660 | 0.8719 | 0.7754 | 0.0255 | 0.0230 | 0.0344 | 0.0233 |
| Kurtosis | 67.1510 | 37.2597 | 51.9419 | 14.5694 | 16.3020 | 8.1301 | −0.8772 |
| Skewness | 4.5892 | 4.4100 | 4.8600 | −0.1225 | −0.6401 | 0.6870 | 0.4738 |
| Asset | IO Test | AO Test | ||
|---|---|---|---|---|
| SB Test | UR t-Test | SB Test | UR t-Test | |
| WTI | −0.149 | −33.697 ** | −0.123 | −37.319 ** |
| Brent | −1.267 | −38.988 ** | −1.035 | −28.526 ** |
| Natural gas | −1.03 | −34.781 ** | −0.785 | −24.152 ** |
| Heating oil | −0.173 | −36.464 ** | −0.214 | −27.508 ** |
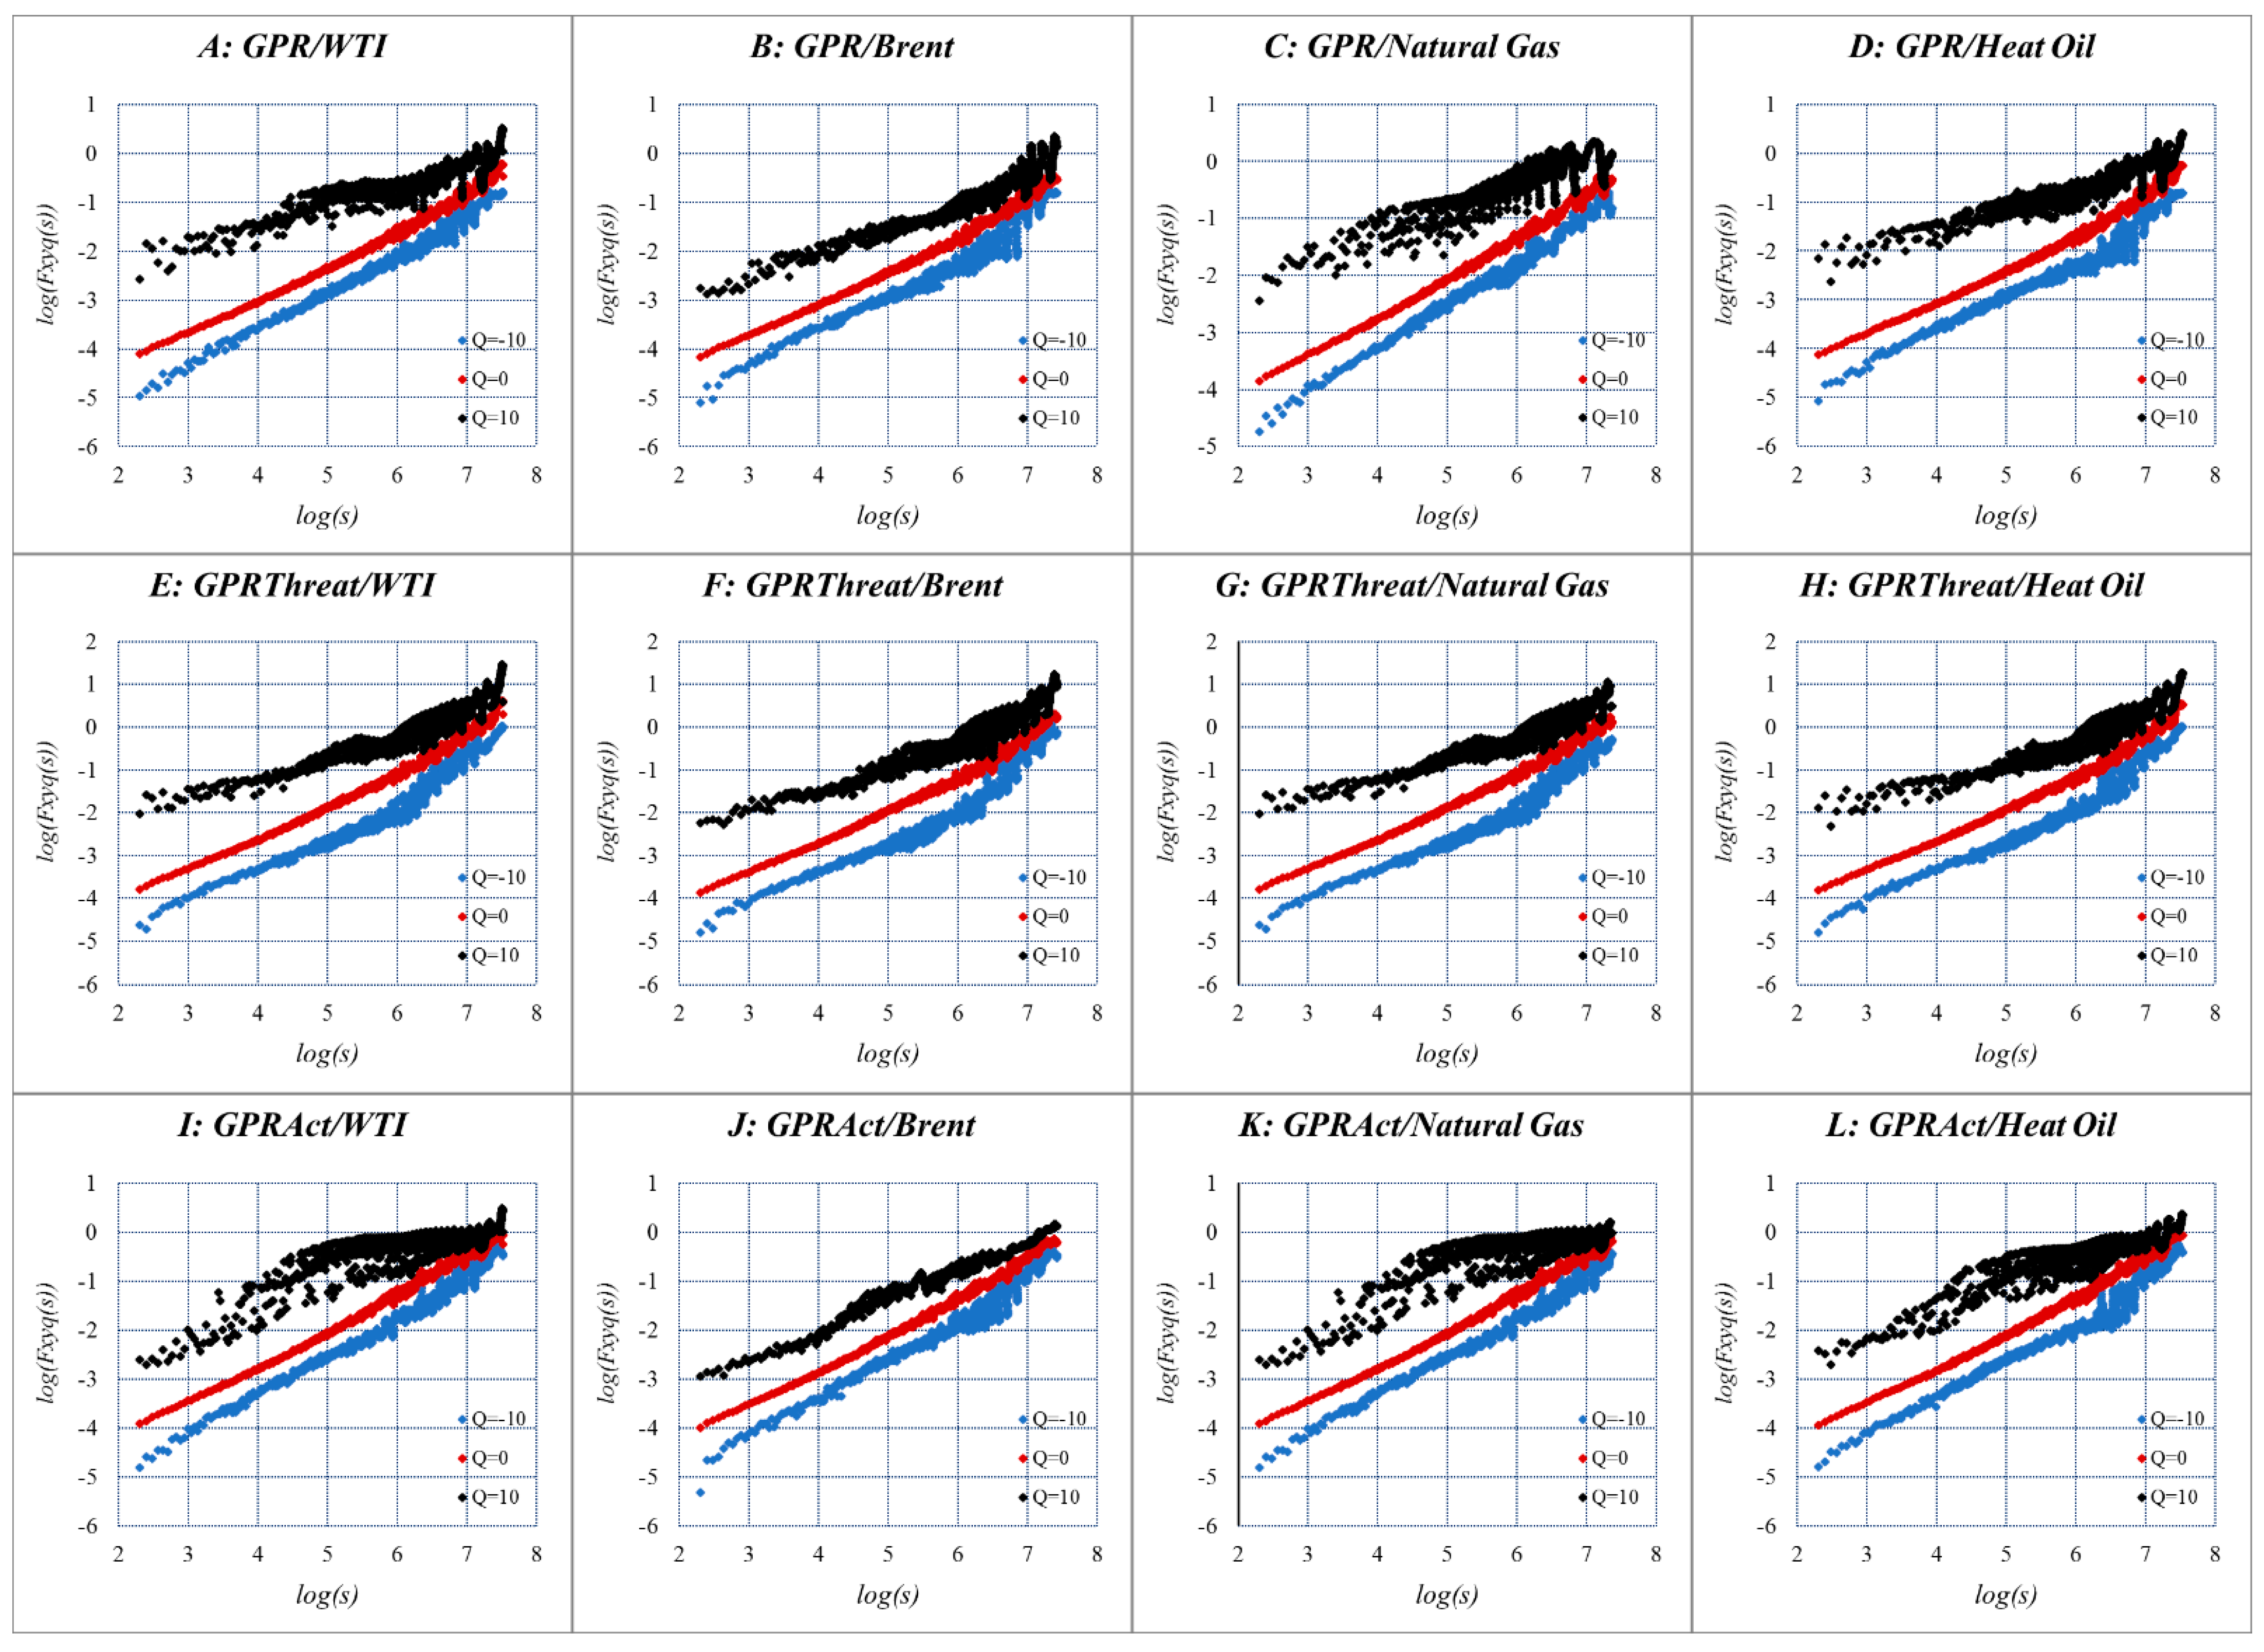
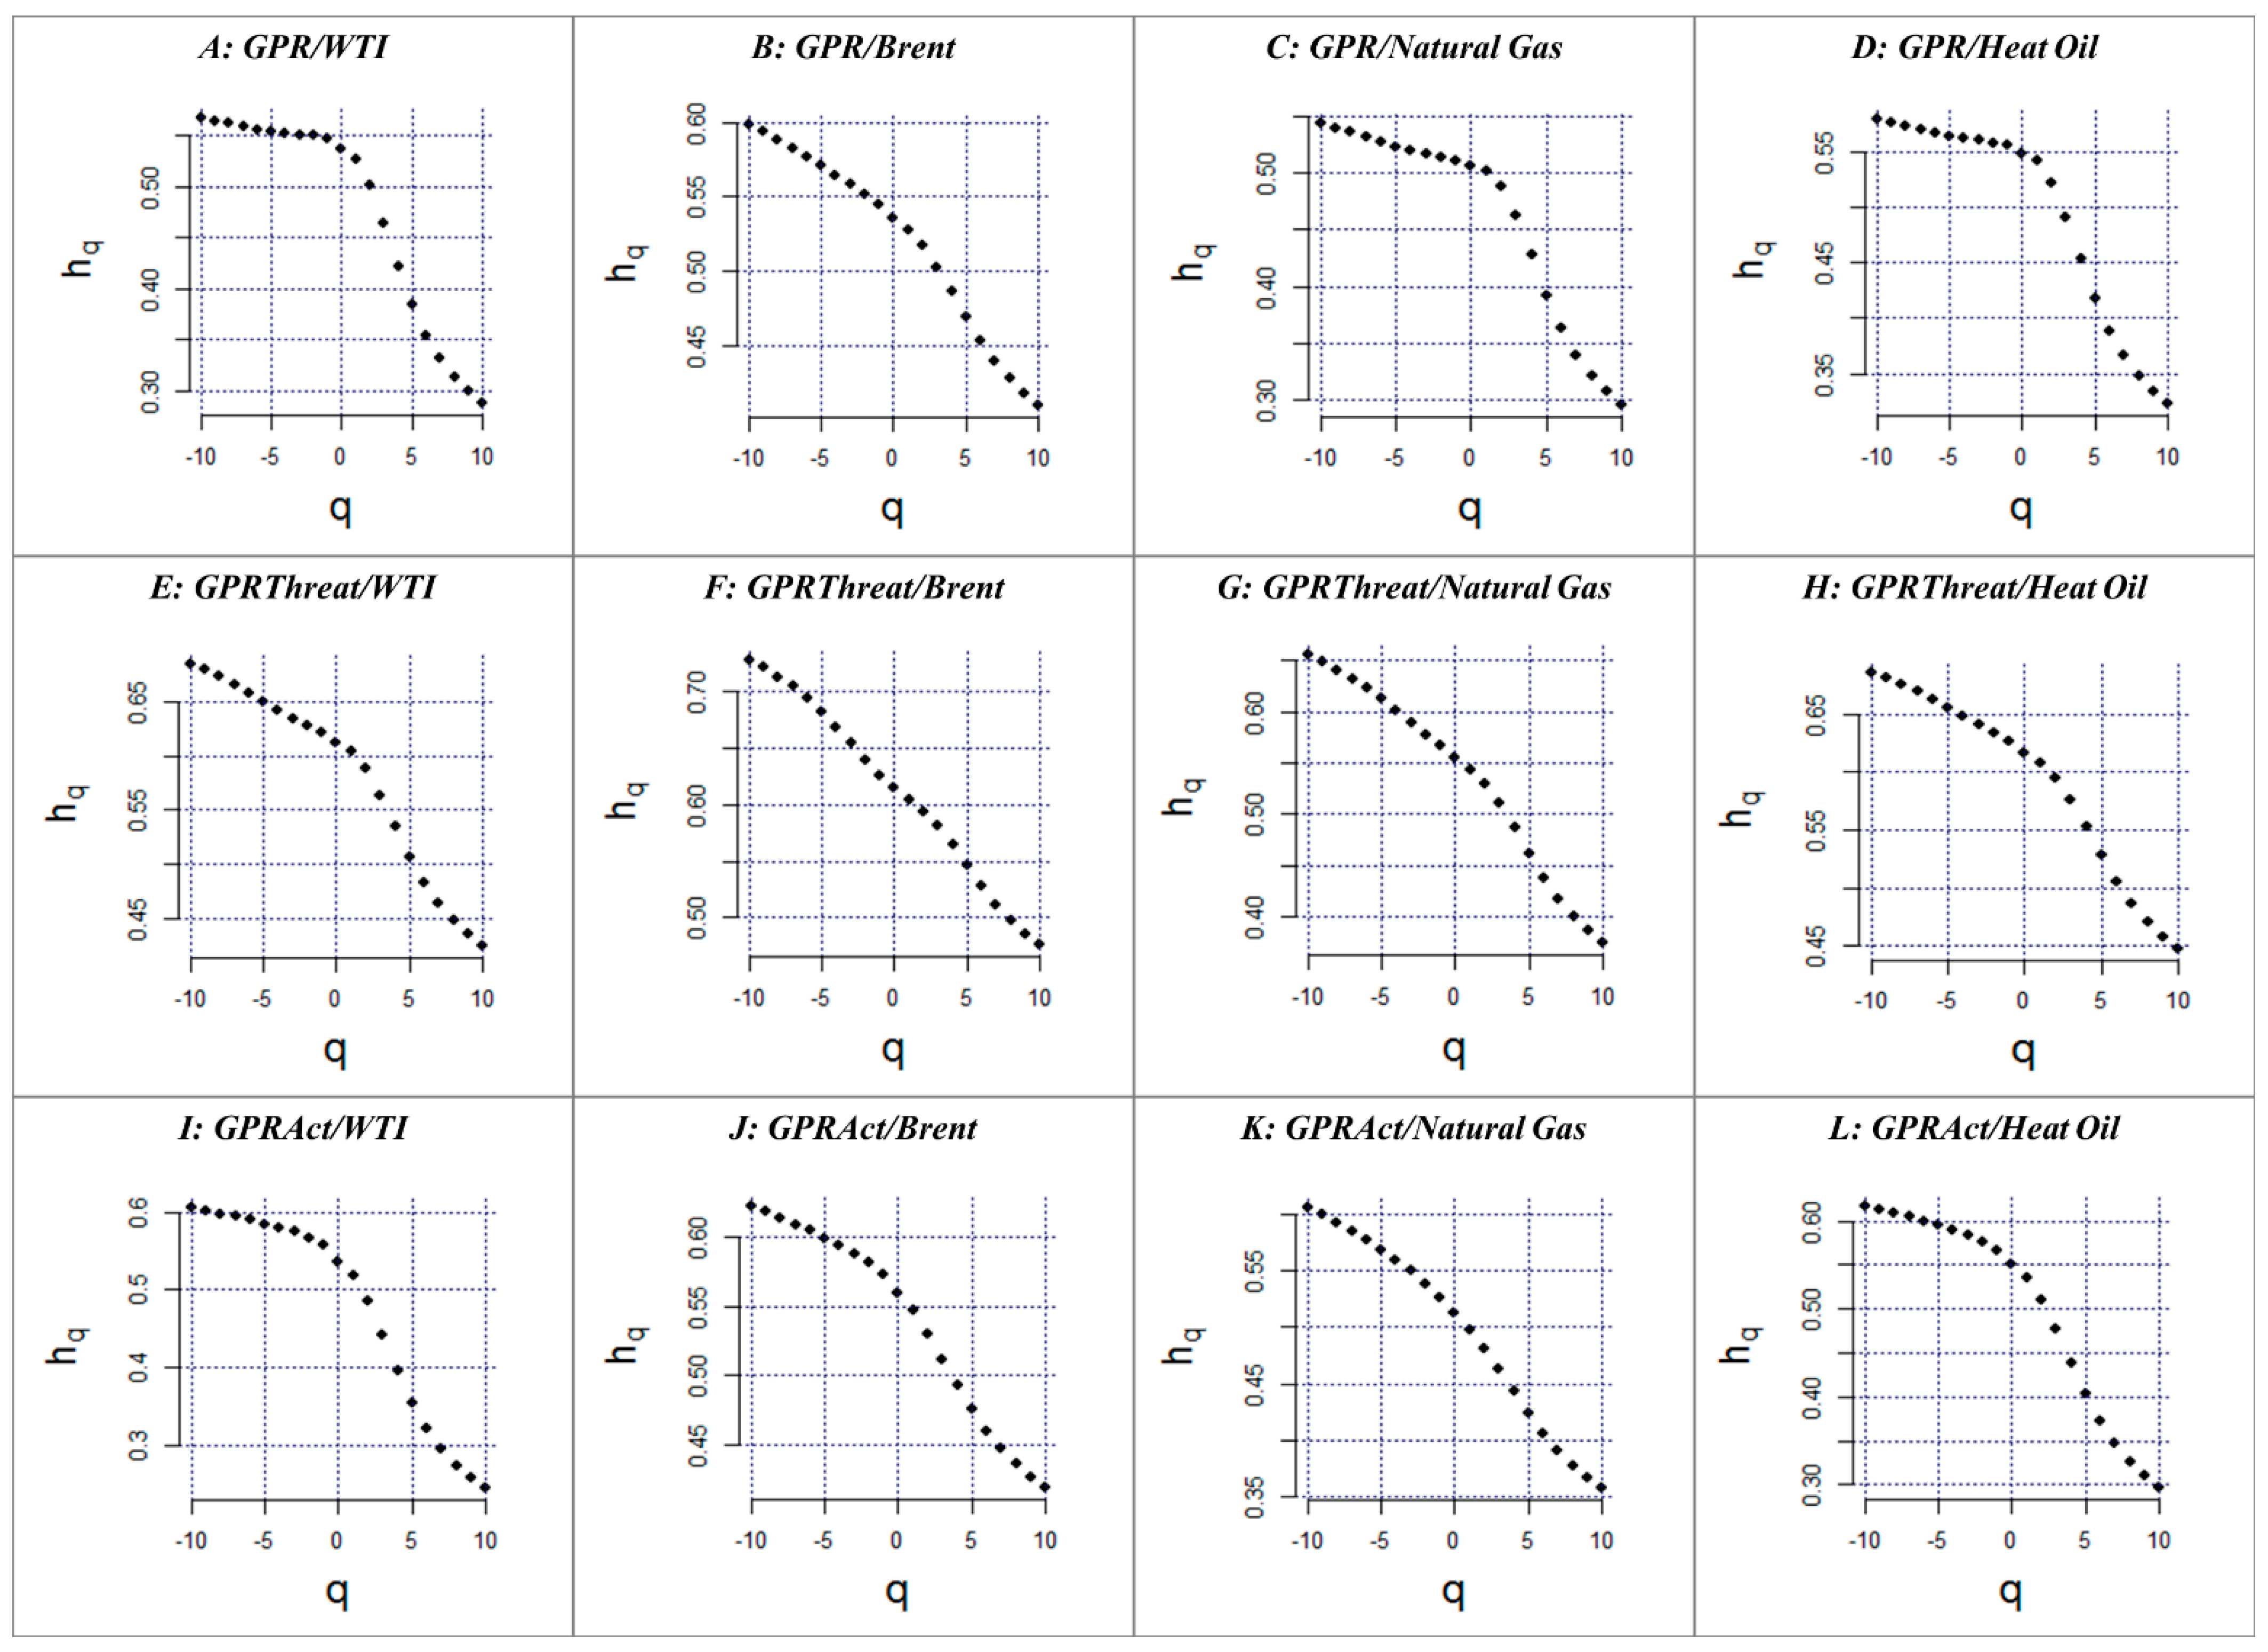
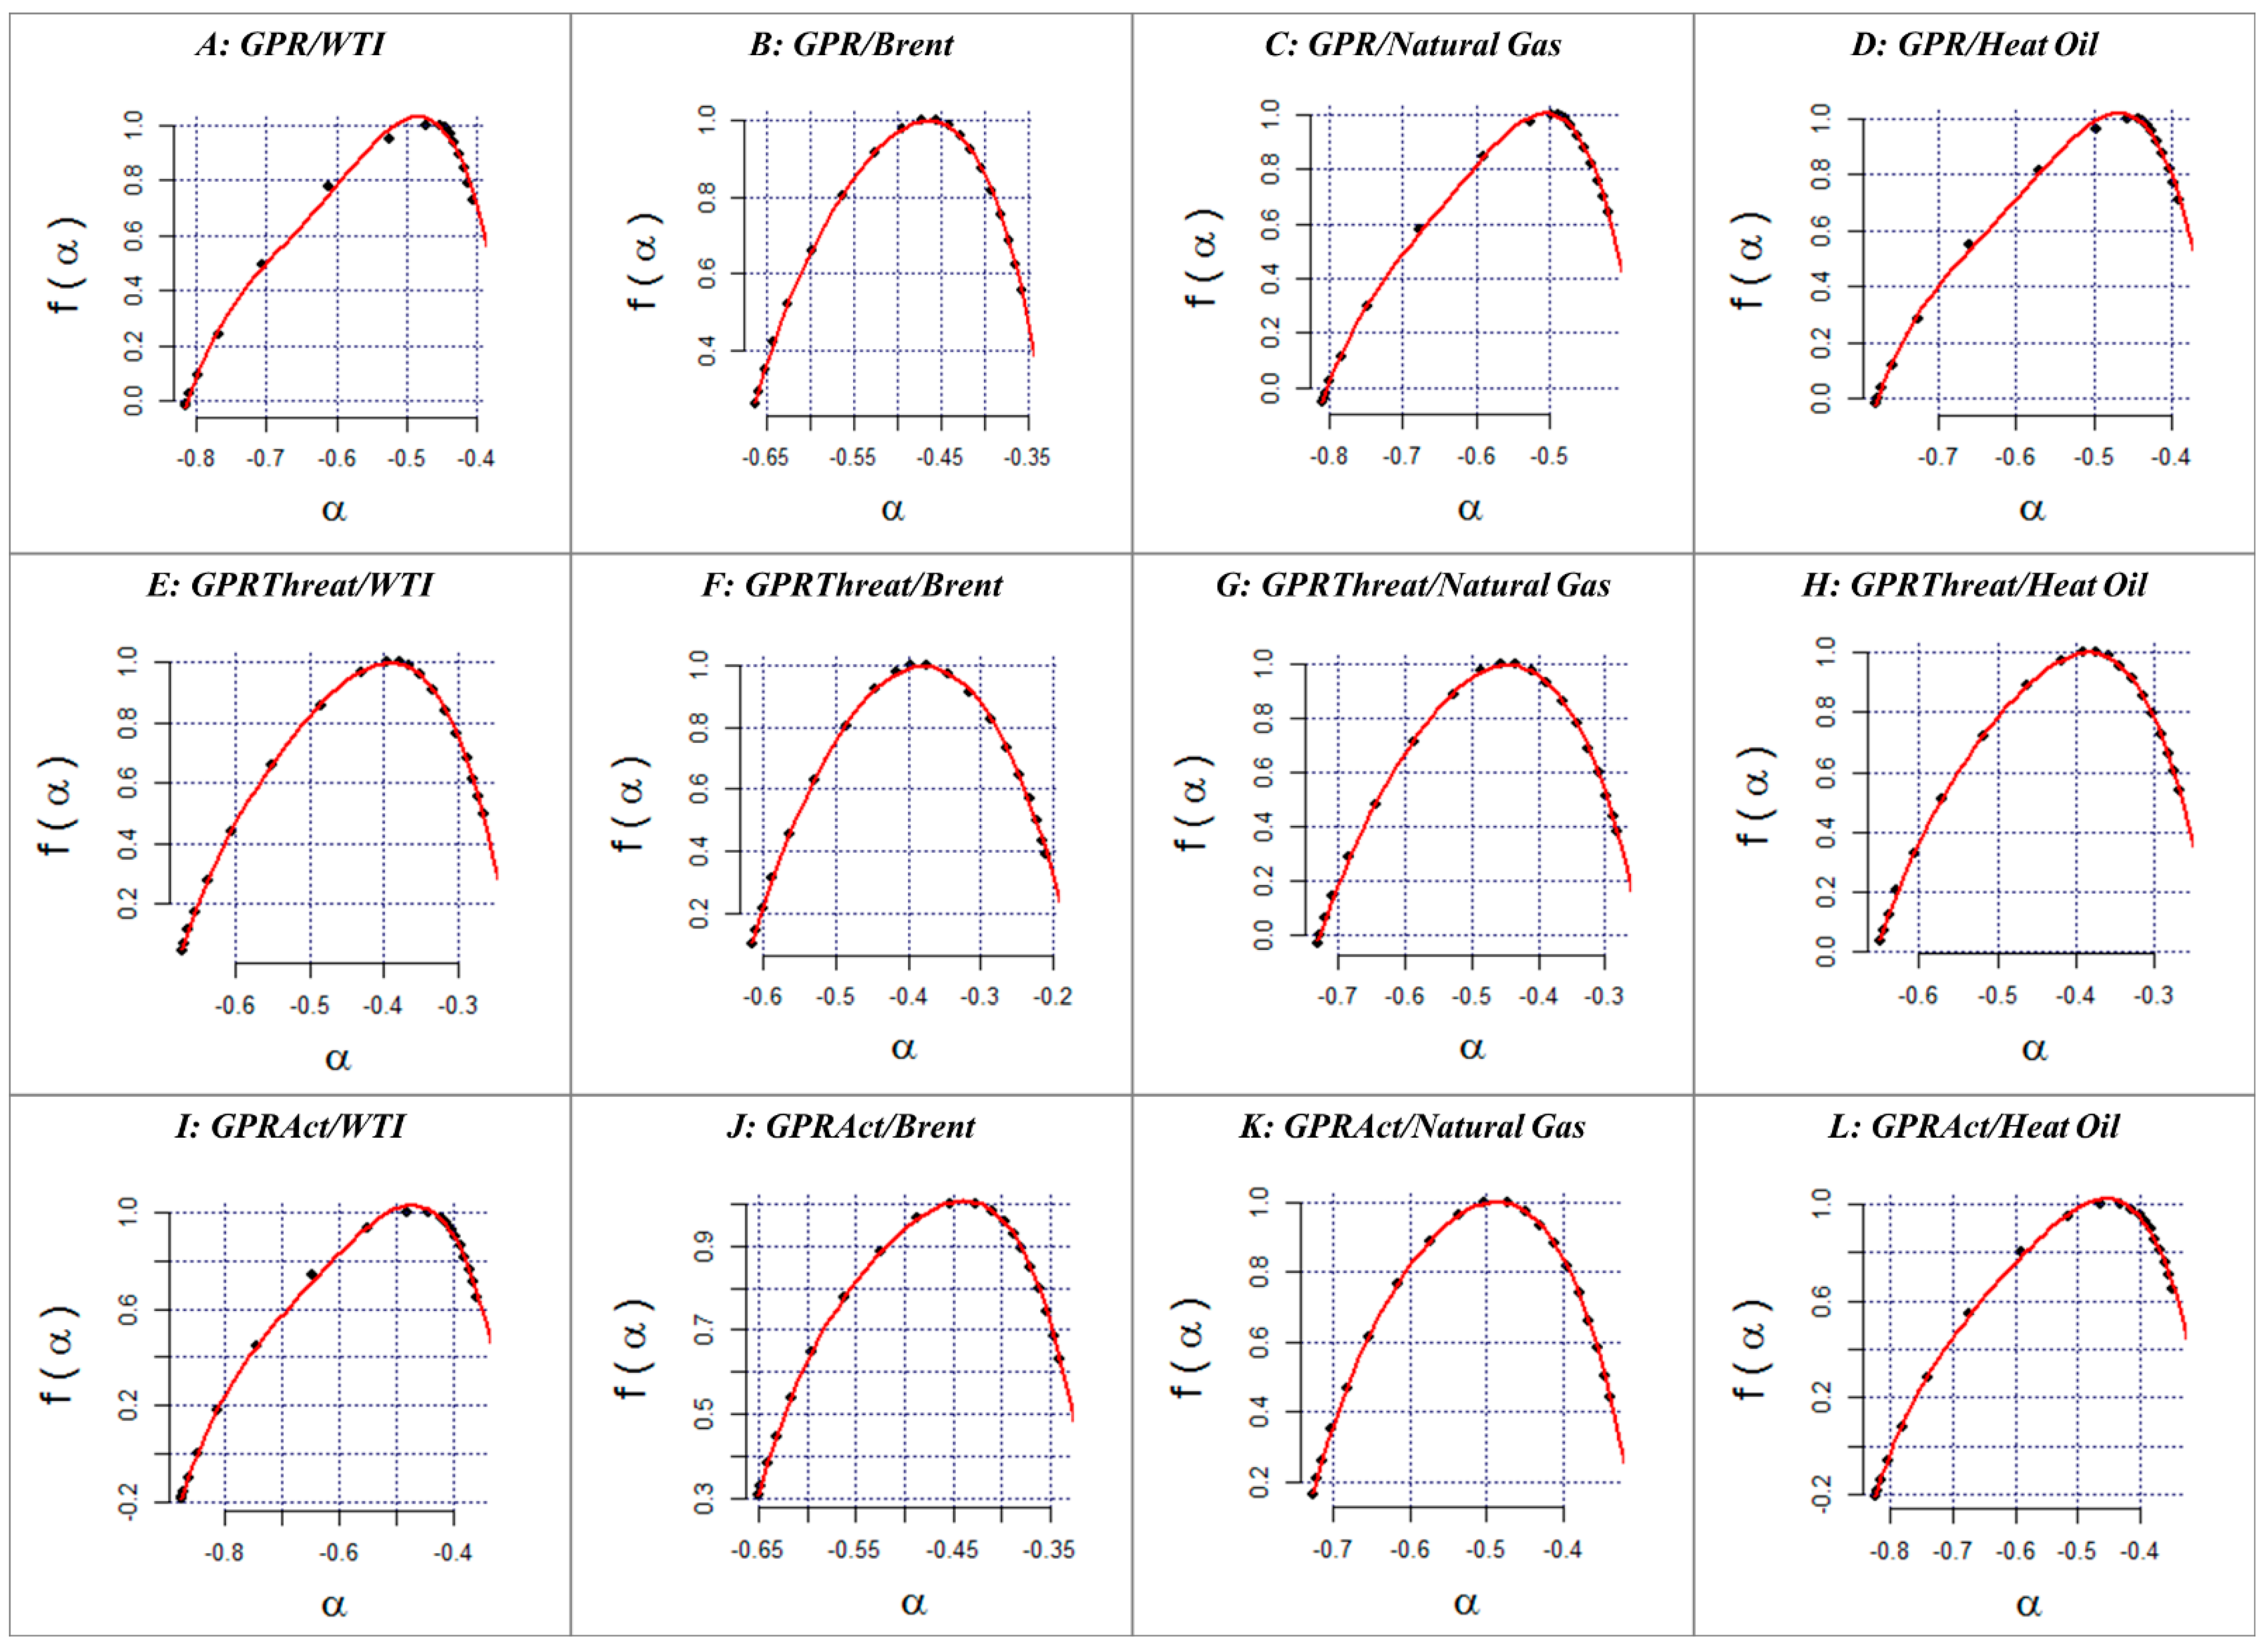
| Q | GPR/WTI | GPRAct/WTI | GPRThreat/WTI | GPR/Brent | GPRAct/Brent | GPRThreat /Brent | GPR/Natural Gas | GPRAct/Natural Gas | GPRThreat/Natural Gas | GPR/Heating Oil | GPRAct/Heating Oil | GPRThreat/Heating Oil |
|---|---|---|---|---|---|---|---|---|---|---|---|---|
| −10 | 0.5671 | 0.6849 | 0.6062 | 0.5984 | 0.7284 | 0.6226 | 0.5441 | 0.6559 | 0.6056 | 0.5801 | 0.6858 | 0.6167 |
| −9 | 0.5641 | 0.6793 | 0.6023 | 0.5935 | 0.7216 | 0.6185 | 0.5401 | 0.649 | 0.5994 | 0.5769 | 0.6807 | 0.6128 |
| −8 | 0.5612 | 0.6731 | 0.5983 | 0.5883 | 0.7137 | 0.6141 | 0.5359 | 0.6412 | 0.5925 | 0.5737 | 0.6752 | 0.6087 |
| −7 | 0.5584 | 0.6662 | 0.5941 | 0.5827 | 0.7047 | 0.6095 | 0.5316 | 0.6325 | 0.5851 | 0.5705 | 0.6692 | 0.6044 |
| −6 | 0.5559 | 0.6586 | 0.5897 | 0.5768 | 0.6944 | 0.6047 | 0.5274 | 0.6229 | 0.577 | 0.5675 | 0.6627 | 0.5998 |
| −5 | 0.5538 | 0.6506 | 0.5851 | 0.5707 | 0.6825 | 0.5996 | 0.5233 | 0.6125 | 0.5683 | 0.5648 | 0.6558 | 0.595 |
| −4 | 0.5521 | 0.6424 | 0.5802 | 0.5645 | 0.6692 | 0.5943 | 0.5195 | 0.6014 | 0.5591 | 0.5625 | 0.6486 | 0.5898 |
| −3 | 0.5508 | 0.6346 | 0.5744 | 0.5581 | 0.6548 | 0.5883 | 0.5163 | 0.5898 | 0.5492 | 0.5606 | 0.6412 | 0.5839 |
| −2 | 0.5495 | 0.6276 | 0.5671 | 0.5515 | 0.6401 | 0.5813 | 0.5136 | 0.578 | 0.5384 | 0.5589 | 0.6337 | 0.5766 |
| −1 | 0.5469 | 0.6213 | 0.5568 | 0.5445 | 0.6262 | 0.5726 | 0.5113 | 0.5664 | 0.5265 | 0.5566 | 0.6262 | 0.5671 |
| 0 | 0.5364 | 0.6122 | 0.5369 | 0.5359 | 0.6146 | 0.5594 | 0.5066 | 0.5544 | 0.5118 | 0.5489 | 0.6166 | 0.5505 |
| 1 | 0.527 | 0.6042 | 0.5188 | 0.5281 | 0.6044 | 0.5473 | 0.5022 | 0.5437 | 0.4981 | 0.542 | 0.6083 | 0.5354 |
| 2 | 0.5015 | 0.5876 | 0.4853 | 0.517 | 0.5943 | 0.5305 | 0.4883 | 0.5297 | 0.4813 | 0.5225 | 0.5947 | 0.5097 |
| 3 | 0.464 | 0.5635 | 0.4417 | 0.5028 | 0.5814 | 0.5119 | 0.4624 | 0.5108 | 0.4628 | 0.4916 | 0.5757 | 0.4763 |
| 4 | 0.4218 | 0.5349 | 0.3954 | 0.4863 | 0.5648 | 0.4932 | 0.4275 | 0.4866 | 0.4434 | 0.4539 | 0.5522 | 0.4388 |
| 5 | 0.384 | 0.5069 | 0.3542 | 0.4692 | 0.5462 | 0.4756 | 0.3925 | 0.4606 | 0.4242 | 0.4181 | 0.5278 | 0.4029 |
| 6 | 0.3538 | 0.4829 | 0.3209 | 0.4533 | 0.528 | 0.4602 | 0.363 | 0.4367 | 0.4065 | 0.3888 | 0.5055 | 0.3721 |
| 7 | 0.3306 | 0.4632 | 0.2947 | 0.4396 | 0.5117 | 0.447 | 0.3397 | 0.4162 | 0.3911 | 0.3659 | 0.4866 | 0.3468 |
| 8 | 0.3126 | 0.4474 | 0.274 | 0.428 | 0.4977 | 0.436 | 0.3215 | 0.3994 | 0.3779 | 0.3481 | 0.471 | 0.3264 |
| 9 | 0.2985 | 0.4345 | 0.2576 | 0.4182 | 0.4858 | 0.4267 | 0.3071 | 0.3855 | 0.3669 | 0.334 | 0.4581 | 0.31 |
| 10 | 0.2872 | 0.4239 | 0.2444 | 0.41 | 0.4758 | 0.419 | 0.2954 | 0.374 | 0.3576 | 0.3227 | 0.4474 | 0.2966 |
| ΔH | 0.2799 | 0.261 | 0.3618 | 0.1884 | 0.2526 | 0.2036 | 0.2487 | 0.2819 | 0.248 | 0.2574 | 0.2384 | 0.3201 |
Publisher’s Note: MDPI stays neutral with regard to jurisdictional claims in published maps and institutional affiliations. |
© 2022 by the authors. Licensee MDPI, Basel, Switzerland. This article is an open access article distributed under the terms and conditions of the Creative Commons Attribution (CC BY) license (https://creativecommons.org/licenses/by/4.0/).
Share and Cite
Aslam, F.; Ferreira, P.; Ali, H.; José, A.E. Application of Multifractal Analysis in Estimating the Reaction of Energy Markets to Geopolitical Acts and Threats. Sustainability 2022, 14, 5828. https://doi.org/10.3390/su14105828
Aslam F, Ferreira P, Ali H, José AE. Application of Multifractal Analysis in Estimating the Reaction of Energy Markets to Geopolitical Acts and Threats. Sustainability. 2022; 14(10):5828. https://doi.org/10.3390/su14105828
Chicago/Turabian StyleAslam, Faheem, Paulo Ferreira, Haider Ali, and Ana Ercília José. 2022. "Application of Multifractal Analysis in Estimating the Reaction of Energy Markets to Geopolitical Acts and Threats" Sustainability 14, no. 10: 5828. https://doi.org/10.3390/su14105828
APA StyleAslam, F., Ferreira, P., Ali, H., & José, A. E. (2022). Application of Multifractal Analysis in Estimating the Reaction of Energy Markets to Geopolitical Acts and Threats. Sustainability, 14(10), 5828. https://doi.org/10.3390/su14105828