Article

Spatiotemporal Differences and Ecological Risk Assessment of Heavy Metal Pollution of Roadside Plant Leaves in Baoji City, China

1
College of Geography and Environment, Baoji University of Arts and Sciences, Baoji 721013, China
2
Shaanxi Key Laboratory of Disasters Monitoring and Mechanism Simulation, Baoji University of Arts and Sciences, Baoji 721013, China
3
College of Geography and Environmental Sciences, Zhejiang Normal University, Jinhua 321004, China
4
College of Earth and Environment Sciences, Lanzhou University, Lanzhou 730000, China
*
Author to whom correspondence should be addressed.
Sustainability 2022, 14(10), 5809; https://doi.org/10.3390/su14105809
Submission received: 16 March 2022 / Revised: 1 May 2022 / Accepted: 3 May 2022 / Published: 11 May 2022

Abstract

:
The concentration of heavy metals in plants’ leaves can effectively indicate the spatiotemporal differences of environmental pollution, providing a scientific basis for the monitoring of urban air quality. The concentration of Ni, Cu, Cd, Pb and Zn in the leaves of five different species (Ophiopogon japonicus, Ligustrum vicaryi, Platanus acerifolia, Sophora japonica and Cedrus deodara) were measured, which were from I, II, III, IV (0.05 m, 0.25 m, 1 m, 4 m) at different times (May and November) in the green belt of Baoji city. The degree of heavy metal pollution and potential ec ological risk were analyzed. The results revealed that the concentration of Zn, Cu and Pb in roadside plant leaves was relatively high. In May, the heavy metal concentration was the highest in the leaves of C. deodara, whereas this was the case for S. japonica in November. Arbors were more effective at capturing particles from the atmosphere than low plants. At the same height, areas with high levels of heavy metal pollution in May were basically the same as that in November, and areas with high levels of pollution were affected by traffic and industry. The pollution index and the comprehensive index of potential ecological risk of element Cd were the highest, indicating that the potential harm of Cd to the environment should receive more attention from the Government.

1. Introduction

In recent years, rapid urbanization has resulted in increasingly serious urban environmental problems. Atmospheric particulate pollution is among the leading urban environmental problems and has received increasing research attention [1,2,3,4,5]. There are two main reasons for the increase of atmospheric particles in cities: one is that the development of cities has changed the temperature, wind direction and humidity of the city; the other is that human activities such as traffic and industrial production increase the emission of exhaust gas and dust [6,7,8,9]. Previous studies showed that traffic pollution is one of the main sources of urban environment pollution, contributing 40–80% of the total air pollution; this is mainly because moving vehicles not only cause ground dust to become secondary dust in the air but also release new atmospheric particulate matter in the form of exhaust gas emissions and mechanical wear [10,11,12,13]. In addition, high-rise buildings form narrow streets, which reduce the circulation of wind and hinder the diffusion of particulate matter [14,15]. Heavy metals adsorbed on particle surfaces can pose a threat to human health. In particular, particles less than 10 μm in size can enter the lungs via the respiratory tract and penetrate the alveoli, causing respiratory diseases and a series of cardiopulmonary diseases, resulting in human dysfunction [16,17,18]. Therefore, monitoring the atmospheric environmental quality in cities and other urban areas has important practical and scientific significance.
At present, traditional monitoring instruments can be used to collect and monitor atmospheric particles for air quality; however, the collection of samples is limited, and the process of evaluating particulate matter is time-consuming and expensive, which limits the research on heavy metals in the atmosphere. Plants are natural “receivers” of atmospheric particulate matter; they can directly adsorb, block, and filter atmospheric heavy metal pollutants through leaf surface structures, such as leaf morphology, leaf insertion angle, surface secretion, and surface roughness, reducing the amount of dust in the air and effectively purifying the latter [19]. Urban green space can help dust control by adsorption and retaining particles through plant branches and leaves, changing the air circulation between green spaces and open spaces [20]. In addition, air quality and human health can be improved by increasing the canopy coverage of urban trees [21]. Plant leaves show differences in particle adsorption capacity and particulate matter accumulation in relation to plant species (e.g., herb, shrub, arbor), the density of branches and leaves, leaf morphology (e.g., epidermal hairs on the back of leaves and protuberances on the leaf surface), leaf growth period (e.g., exposure time and maturity of leaves), and human activities [22,23,24]. After atmospheric particles are deposited on the surface of plant leaves, metals can be transferred and accumulated in plant leaves [25]. Although some heavy metals, such as Zn, Cu and Ni are needed for plant growth, they can induce harmful effects on plants at high levels; some heavy metals such as Zn, Cu and Ni are needed for plant growth, they can induce harmful effects on plants at high levels [26,27]. Other non-essential elements, such as Pb, Cd and As, can be toxic to organisms even at low levels [27]. Plants growing near traffic roads and industrial areas display more increased foliar concentrations of heavy metals [28]; therefore, it is necessary to monitor the concentration of heavy metals in plant leaves near traffic roads and industrial areas. Most of the research on the accumulation of heavy metals in plant leaves is in the eastern coastal areas or key industrial areas. Based on the analysis of common greening tree species in the Beijing area, it is concluded that Sophora japonica L. and Platycladus orientalis L. have strong enrichment ability to Cr and PB, and the heavy metal content is strongly correlated with the heavy metal pollution degree in leaves [29,30]. Based on the analysis of metal contents in the leaves of greening plants along a traffic route in Lanzhou and their correlation, it was found that there were significant differences in heavy metal contents in plants in different road environments [31]. Some scholars, through the study of 23 plant leaves, found that Buxus sinica, Buxus megistophylla, Prunus cerasifera, and Ligustrum×vicaryi were the most effective plant species for accumulating particles [32].
The existing research mainly analyzes the environmental pollution recorded by plant leaves in a single time period, and there is a lack of comprehensive studies on the accumulation of heavy metals in plant leaves of different heights and different types during different time periods, and on the potential ecological risk assessment of plant leaves under different pollution intensities.
Therefore, this study focused on Baoji city, on the Western Fen-Wei plain in China, and 180 km from Xi’an. The proportion of the secondary industry is high, among which automobile manufacturing, non-ferrous metal smelting, special equipment manufacturing and railway transport equipment manufacturing and other heavy industries account for a large proportion. Energy consumption is dominated by coal. In addition, the traffic in Baoji city is heavy and, thus, industry and transportation combined exert significant pressure on the urban environment. In addition, the traffic in Baoji city is heavy—industry and transportation combined exert significant pressure on the urban environment. The heavy metal concentrations of different plant leaves in main green belts in Baoji city were measured and the time and space distribution characteristics of heavy metals in plant leaves were analyzed. The Hakanson potential ecological risk index was used for the ecological risk assessment of heavy metals in different leaves, revealing the regional environmental pollution situation. Our results provide a scientific basis for monitoring the quality of the urban atmospheric environment using plant leaves.

2. Materials and Methods

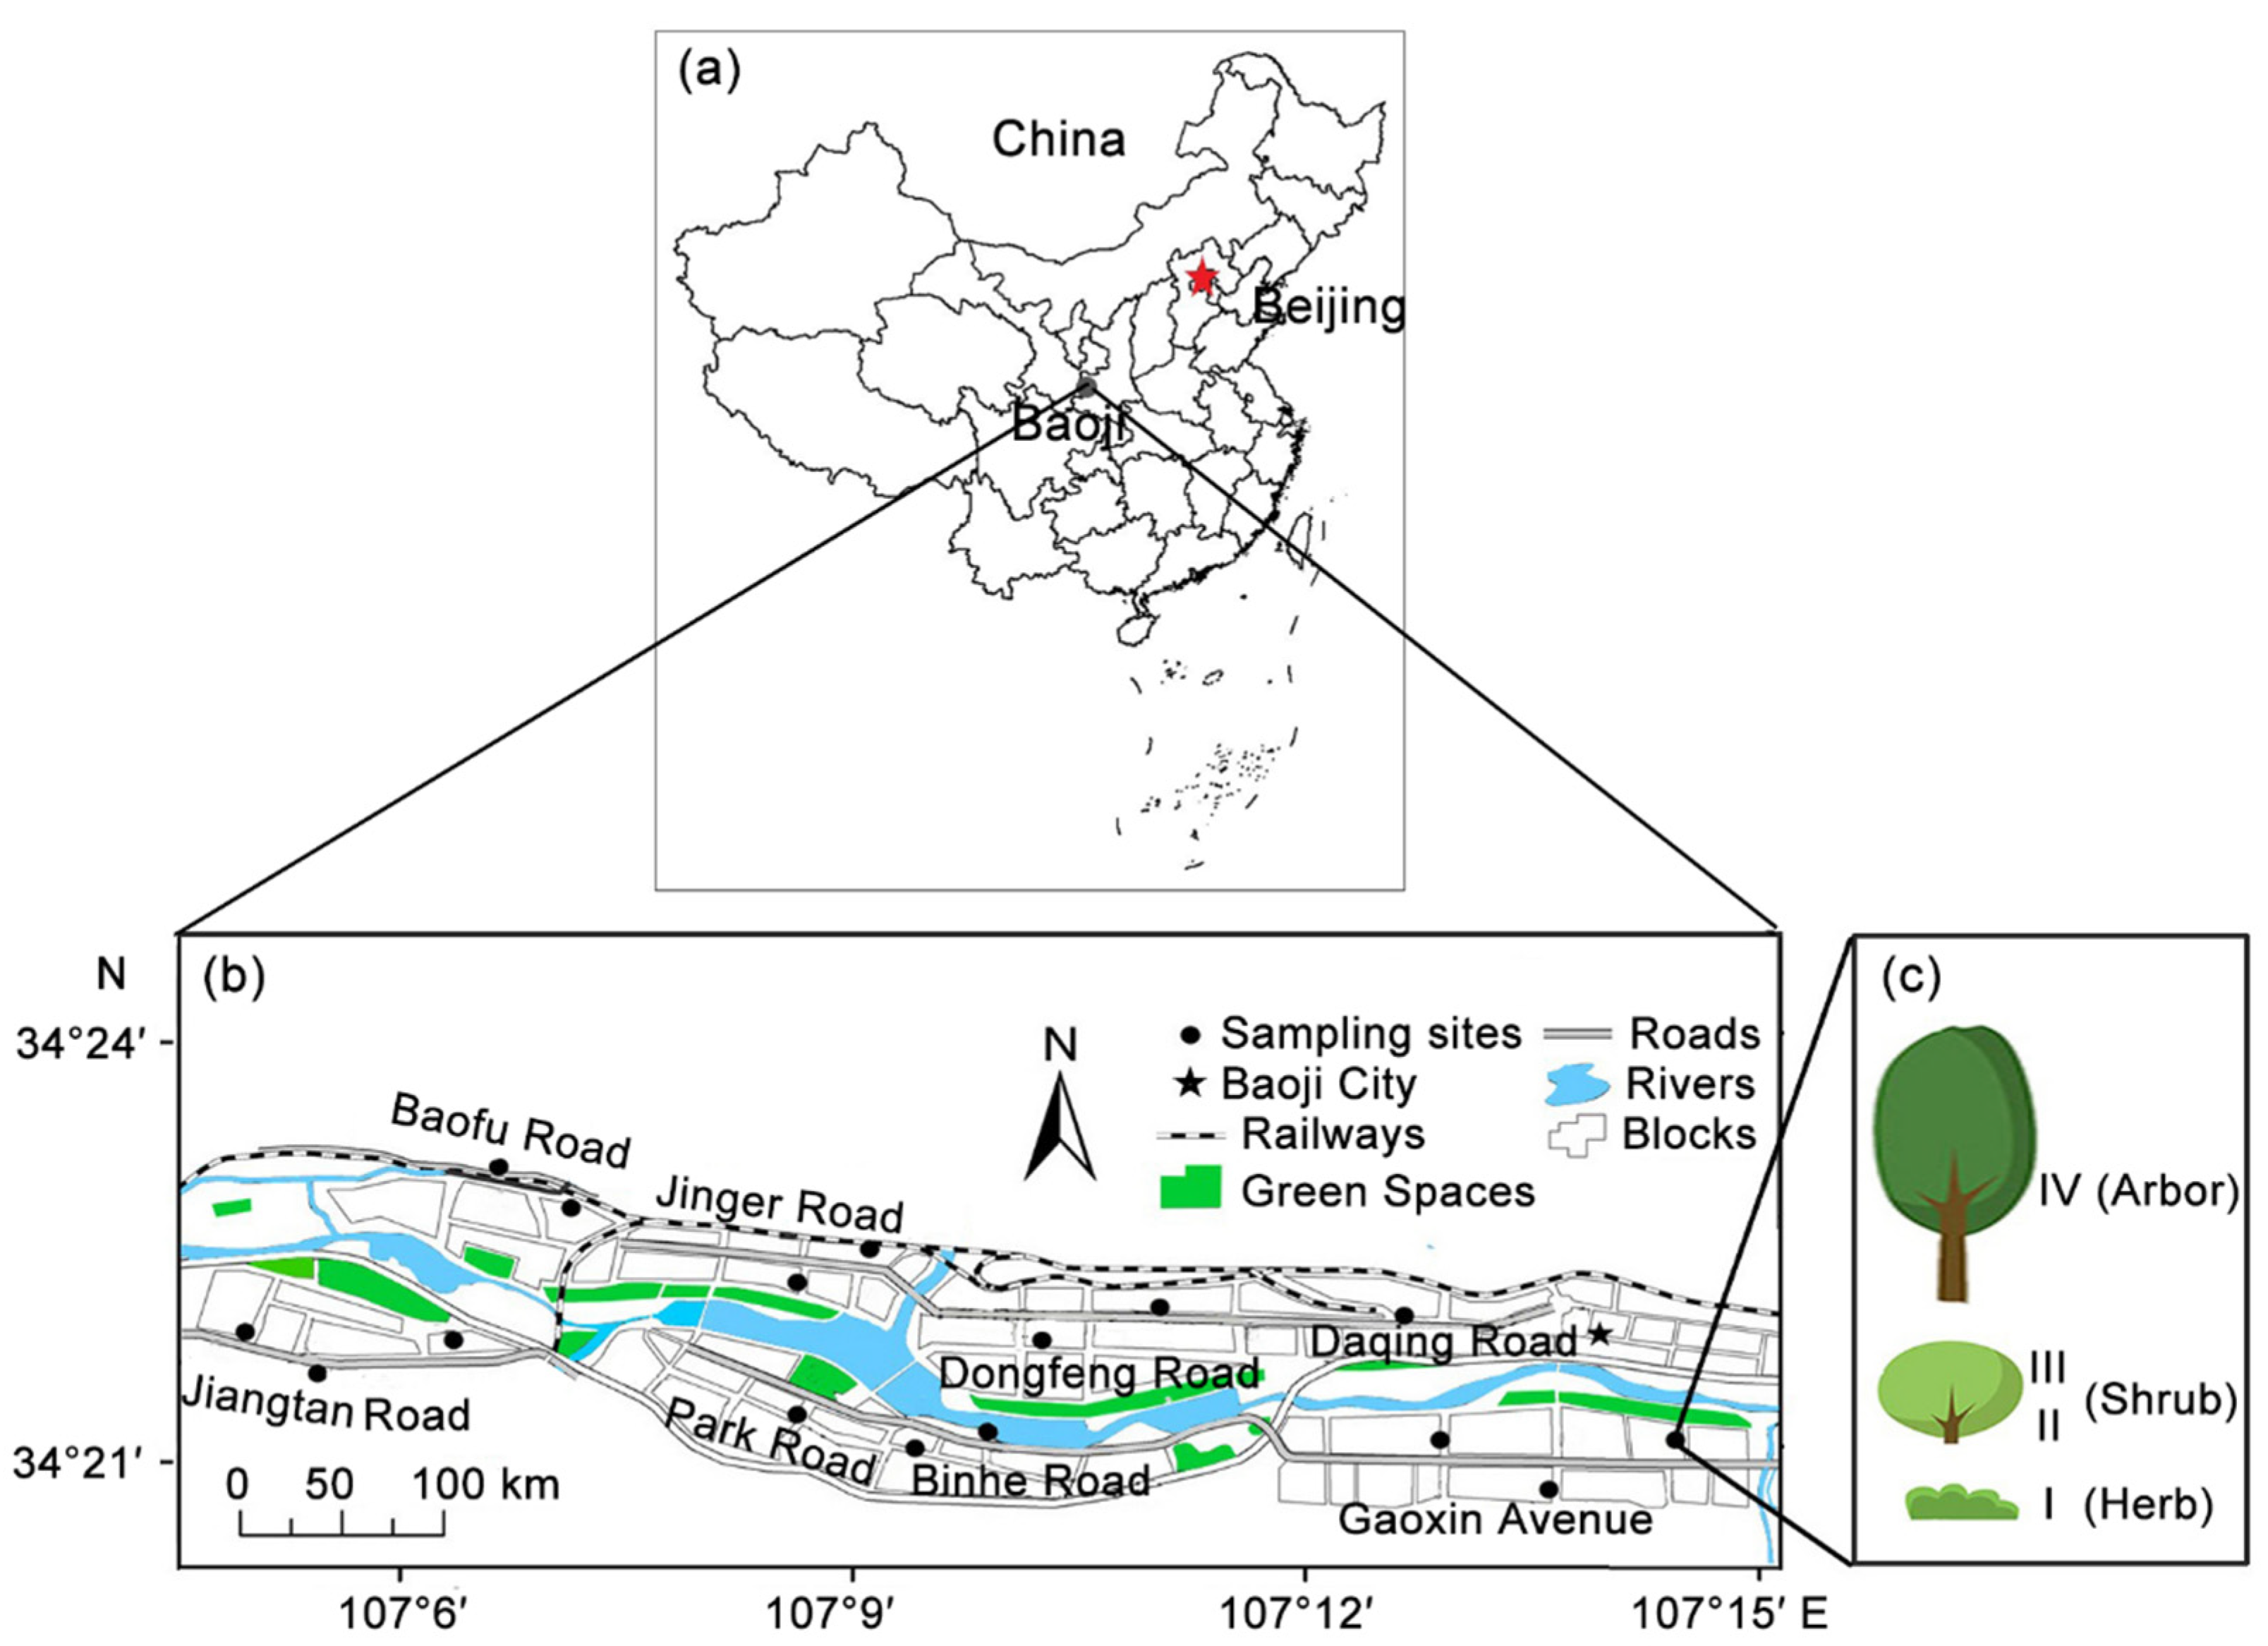
2.1. Sample Collection

Plant leaves from trees in the green belt on both sides of the main traffic streets (Gaoxin Avenue, Binhe Road, Park Road, Jiangtan Road, Baofu Road, Jinger Road, Dongfeng Road and Daqing Road) in Baoji city were used ins the study (Figure 1). The plants were provided by the Baoji Government of Shaanxi Province, China. At each sampling site, leaves were collected from four different heights (0.05 m, 0.25 m, 1 m and 4 m, representing Layers I, II, III, and IV, respectively). At each height, the leaves were collected from four directions (east, west, south, north) and mixed into a sample; therefore, four samples were collected at each sampling site at the same time. Plant growth is influenced by local climate. In May, new leaves have basically grown completely, and in November, the leaves have been mature and would fall off. Leaves of these two periods were compared to observe changes of heavy metals adsorbed by leaves during the growth. Sampling occurred during mid-May and mid-November 2017 following a 2-week period with no rain. The same sites were sampled for each time period. In total, 128 samples were collected. Leaves of herbaceous Ophiopogon japonicus (https://www.ncbi.nlm.nih.gov/search/all/?term=Ophiopogon%20japonicus, accessed on 20 March 2018) were collected from Layer I. The lower and upper leaves of the shrub Ligustrum vicaryi (https://www.ncbi.nlm.nih.gov/search/all/?term=Ligustrum+vicaryi, accessed on 20 March 2018) were selected from Layers II and III, respectively. Leaf samples of Platanus acerifolia (https://www.ncbi.nlm.nih.gov/search/all/?term=Platanus+acerifolia, accessed on 20 March 2018), Sophora japonica (https://www.ncbi.nlm.nih.gov/search/all/?term=Sophora+japonica, accessed on 20 March 2018) and Cedrus deodara (https://www.ncbi.nlm.nih.gov/search/all/?term=Cedrus+deodara, accessed on 20 March 2018) were collected from Layer IV. Not all tree species occurred on all roads in the study area. Leaves were collected according to the conditions of the plants on each road; therefore, leaves of S. japonica were collected along with Dongfeng and Baofu Roads, those from C. deodara were collected along Binhe and Daqing Roads, whereas P. acerifolia leaves were collected along all other roads. As background reference samples, leaves from each layer were collected from an area with relatively little human disturbance on the campus of Baoji University of Arts and Sciences. Background Plants of reference samples were provided by Baoji University of Arts and Sciences, Baoji city, Shaanxi Province, China. The time of collecting the sample was chosen in mid-May and mid-November in order to avoid the influence of the plant growth period. The adsorption ability of leaves regarding heavy metal elements is unstable during the growth period. The sampling was carried out after two weeks of no precipitation in the month in order to avoid the influence of rain erosion on the concentration of heavy metal elements on the surface of plant leaves.

2.2. Experimental Methods

After collection, the samples were quickly brought back to the laboratory, without cleaning, and for pretreatment: they were dried at 40 °C to a constant weight and ground into a powder with a mortar. Then, 0.2 g of the powder was weighed and placed in a digestion tube, followed by the addition of nitric acid-hydrofluoric acid-perchloric acid (2:1:1) for digestion. After digestion, the digestion solution was moved to a 50 mL colorimetric tube. The five elements (Ni, Cu, Cd, Pb and Zn) are relatively common elements, which are closely related to human health. Previous studies have reported [33,34] that the concentration of Ni, Cu, Cd, Pb and Zn were relatively high in soil and street dust in Baoji city. The five elements can basically reflect the situation of environmental pollution in Baoji city; however, studies on the concentrations of the five elements in the leaves of plants in Baoji city have rarely been reported, and therefore, the concentrations of Ni, Cu, Cd, Pb, and Zn were measured using an inductively coupled plasma mass spectrometry (ICP-MS) (Agilqient, Japan). The spectrometry was first optimized using an optimized solution. When the low, medium, and high-quality numbers met the sensitivity requirements, the oxide and double charge parameters were adjusted. The measurement method was edited, and, measurements were performed according to the characteristic mass of each element, and an appropriate element was selected as an internal standard. The instrument parameters are shown in Table 1.
The above experiments were completed in the Shaanxi Key Laboratory of Disasters Monitoring and Mechanism Simulation of Baoji University of Arts and Sciences.

2.3. Determining the Degree of Pollution

Because leaves are polluted by multiple pollutants of different elements, it is difficult to evaluate the pollution degree of heavy metals in leaves by a single index. In order to reflect the present situation of heavy metal pollution and the different contribution of various heavy metals to compound pollution, the method of Nemero comprehensive pollution index can be adopted. The single factor pollution index (Pi) directly reflects the degree of leaves pollution caused by a certain factor. The comprehensive pollution index (Psum) can comprehensively reflects the different effects of various pollutants on leaves [35,36] (Equations (1) and (2)):
Pi = Ci/Si
where Pi is the single factor pollution index, Ci is the measured value of metal element i, and Si is the reference value of metal element i. Here, the values of the heavy metal content of plant leaves from the campus were used as background values. Pi can be divided into four levels according to its magnitude: Pi ≤ 1 represents no pollution; 1 < Pi < 2 represents slight pollution; 2 < Pi < 3 represents moderate pollution; and Pi > 3 represents heavy pollution
Psum = [ ave   ( Pi ) ] 2 + [ max   ( Pi ) ] 2 2
where Psum is the Nemero comprehensive pollution index, ave (Pi) is the average value of the single factor pollution index, and max (Pi) is the maximum value of the single factor pollution index. Psum can be divided into five levels according to its magnitude: Psum ≤ 0.7 represents safe; 0.7 < Psum ≤ 1.0 represents a warning line; 1.0 < Psum ≤ 2.0 represents slight pollution; 2.0 < Psum ≤ 3.0 represents moderate pollution; and Psum > 3.0 represents heavy pollution.
The Kriging interpolation method in Surfer was used to calculate the Psum interpolation, and the spatial distribution of Psum in the leaves of street vegetation in Baoji city was obtained.

2.4. Potential Ecological Risk Assessment Method

The potential ecological risk assessment method was used to assess the impact of pollution levels. The comprehensive index of potential ecological risk (RI) reflects the comprehensive effects of multiple pollutants. The single index of potential ecological risk (E) reflects the environmental impact of a single pollutant in sediments [37]. Equation (3):
E r i = T r i × C r i C r i = C i   /   C f i RI = i = 1 n E r i
where RI is the comprehensive index of potential ecological risk; E r i is the single index of potential ecological risk of metal element i;   T r i is the toxicity response coefficient of metal element i; C r i   is the single pollution coefficient of metal element i;   C i is the measured concentration of heavy metal elements; and   C n i is the reference value. In this experiment, the leaves of campus vegetation with slight pollution were used as the background value for reference.
Formula (3) shows that the size of RI is related to the type and quantity of pollutants. Therefore, the grading standard of the evaluation method must be adjusted according to the type and quantity of pollutants studied. According to the previous research methods [38], the single index of potential ecological risk (E) can be divided into five levels according to its magnitude: E ≤ 30 represents slight ecological risk; 30 < E ≤ 60 represents moderate ecological risk; 60 < E ≤ 120 represents considerable ecological risk; 120 < E ≤ 240 represents high ecological risk; and E ≥ 240 represents very high ecological risk. According to the previous research methods, the comprehensive index of potential ecological risk (RI) can be divided into four levels according to its magnitude: RI ≤ 50 represents a slight ecological risk; 50 < RI ≤ 100 represents a moderate ecological risk; 100 < RI ≤ 200 represents a considerable ecological risk, and RI ≥ 200 represents high ecological risk.

2.5. Statistical Analysis

Data analysis was performed using SPSS 23.0 (IBM, Solutions Statistical Package for the Social Sciences) and Origin 9.0 (Origin-Lab). Significant differences in heavy metals concentrations between plant species (O. japonicas, L. vicaryi, P. acerifolia, S. japonica and C. deodara), height (0.5 m, 0.25 m, 1 m and 4 m) and time (May and November) ranges were tested using analysis of variance (ANOVA).

3. Results

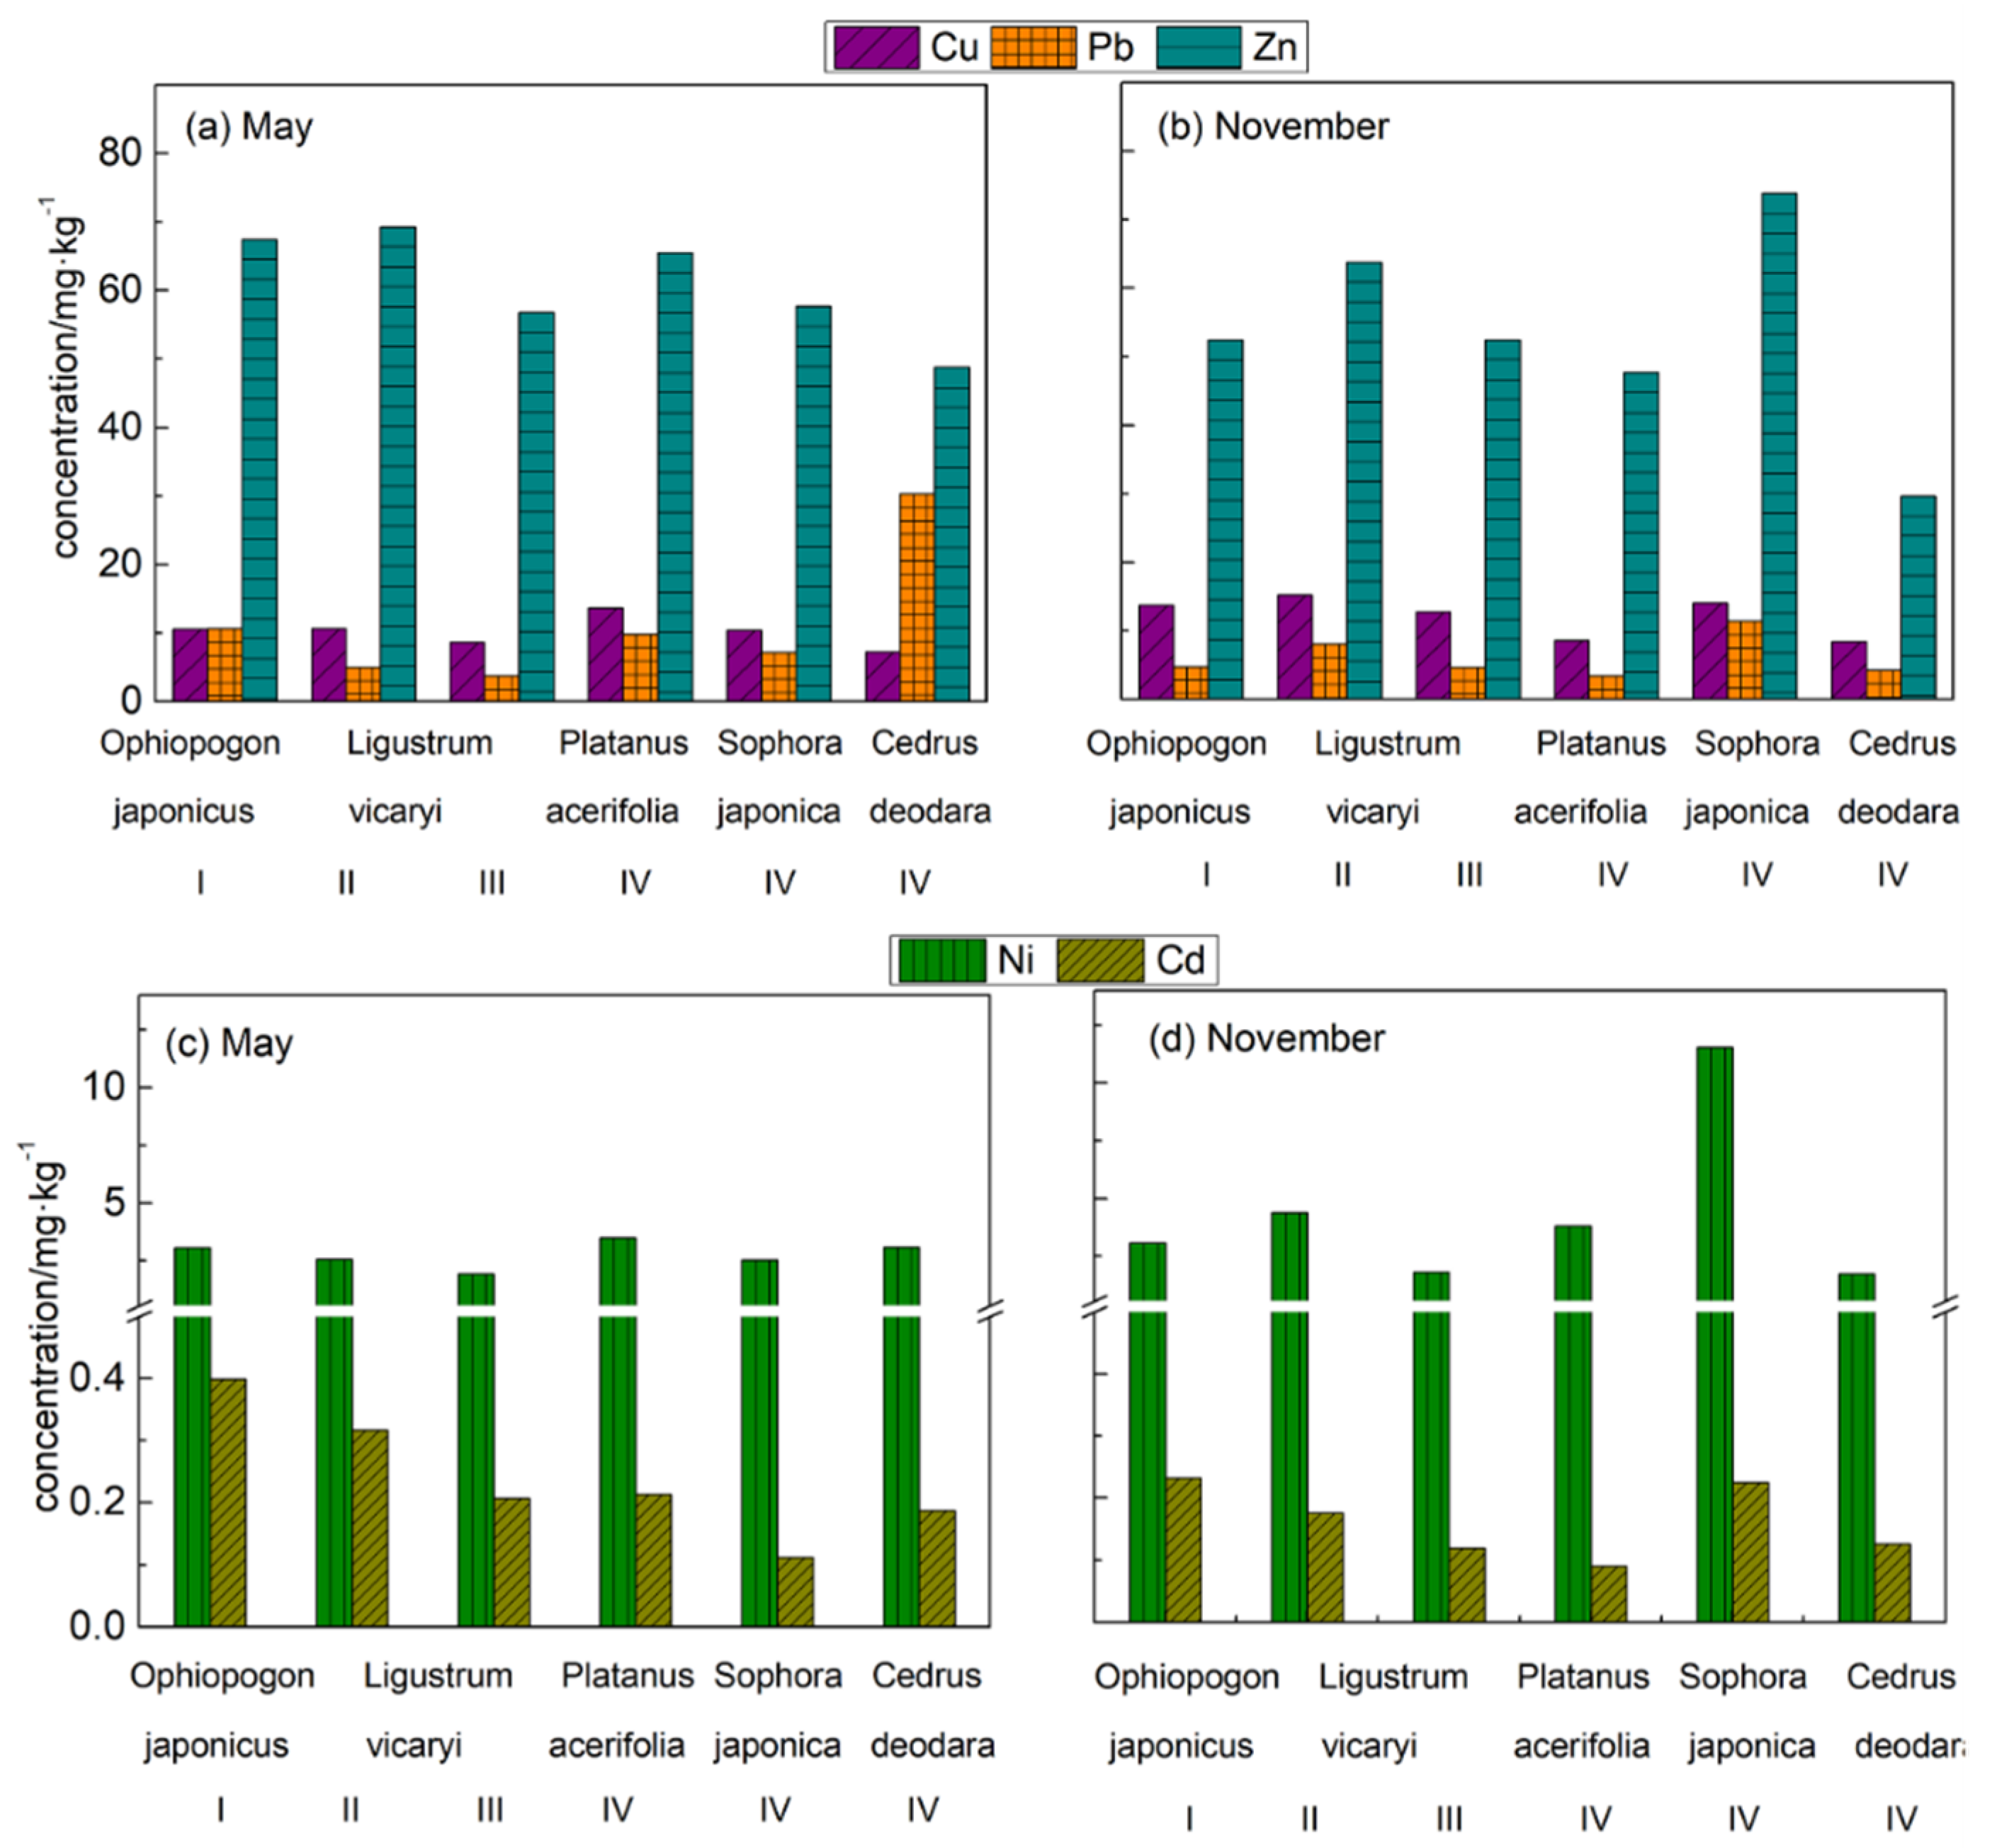
3.1. Distribution Characteristics of Heavy Metal Elements in Leaves of Different Plants

The heavy metal content in the leaves of different plants along the roads in Baoji city in May and November is provided in Table 2. The concentration of heavy metals (Ni, Cu, Cd, Pb and Zn) showed large differences in plant leaves of different species (herbs, shrubs and arboreal vegetation) at different times of the year (May and November). All the plant leaves sampled along the roads had higher heavy metal concentrations than those from the campus (Table 3). The variation coefficient of 80% of samples was more than 0.3, with moderate variation, indicating that some leaves were contaminated to some extent (Table 2).
The accumulation concentration of the same heavy metal in leaves of different species was different, and the concentration of Ni (p < 0.05) and Pb (p < 0.05) in different species were significantly different (Table 4). The Ni concentration in leaves of S. japonica was the highest, with an average of 7.04 mg·kg−1, while the Ni concentration in leaves of L. vicaryi (III) was the lowest, with an average value of 1.86 mg·kg−1. The Pb concentration in C. deodara leaves was the highest with an average of 17.24 mg·kg−1, and the Pb concentration in L. vicaryi (III) was the lowest with an average of 4.19 mg·kg−1. The concentration of other heavy metal elements (Cu, Cd and Zn) was not significantly different in the leaves of different species, indicating that the response of plant species to pollution was not significantly different, and all the plant species could be used as heavy metal pollution monitoring.
The concentrations of heavy metals in the leaves of the same plant species were different, among which the Zn, Cu and Pb concentrations were higher than that of Ni and Cd, with Zn being the highest, followed generally by Cu and then Pb; by contrast, Cd concentration was relatively low, followed by that of Ni. In May, the highest Zn and Pb concentrations occurred in C. deodara, whereas Cu was preferably enriched in P. acerifolia. In November, S. japonica showed the highest Zn and Pb concentrations, whereas L. vicaryi (Layer II) were enriched in Cu. Although Zn and Cu are heavy metals, they are also essential nutrients and participate in plant metabolism. Thus, it was unsurprising that plant leaves accumulate Zn and Cu [39,40,41]; however, Pb is not an essential element for plant growth, and can negatively impact the latter. Given that Pb adsorbed by roots mainly remains there, it is likely that the Pb concentration of leaves was mainly from atmospheric particles. In this study, Pb concentration in plant leaves in May ranged from 0.24 to 81.31 mg·kg−1 (mean 8.18 mg·kg−1). In November, the range was 0.1–34.33 mg·kg−1 (mean 5.79 mg·kg−1). These average results were similar to those reported elsewhere [42,43]; however the maximum concentration of Pb in this study was higher than that in other studies, and there were significant differences in Pb concentration (p < 0.05) among different plant leaves. This suggested more Pb-containing heavy metal particulate matter in the atmosphere in Baoji city, and its spatial distribution was not uniform.

3.2. Level of Heavy Metal Pollution in Plant Leaves

The single factor pollution index and Nemero comprehensive pollution index were used to evaluate the degree of heavy metal pollution in plant leaves of different species in different seasons in Baoji city (Table 5). The leaf samples in May had Pi values ranging from 0.64 to 11.73. In May, O. japonicas showed Pi values less than 1 for Ni and Cu, whereas those for other metals were greater than 1. Except for Zn, the pollution indexes of other heavy metals in L. vicaryi (Layer II) were all less than 2, whereas for Pb and Zn in L. vicaryi (Layer III) they were greater than 2. All the single factor pollution indexes of P. acerifolia, S. japonica and C. deodara were high, especially for Cd, which had the highest pollution index. The single factor pollution index of leaf samples for each of these three species were as follows: P. acerifolia, Cd > Zn > Ni > Pb > Cu; S. japonica: Cd > Zn > Ni > Pb > Cu; C. deodara: Cd > Pb > Zn > Ni > Cu.
Pi values of the samples in November ranged from 0.34 to 15.47. O. japonicas had Pi values less than 1 for Ni and Cu, but greater than 1 for all other metals. The single pollution indexes of the other plants (L. vicaryi, P. acerifolia, S. japonica and C. deodara) were greater than 1. The order of the single pollution index in these four species were as follows: L. vicaryi (Layer II), Cd > Zn > Pb > Cu > Ni; L. vicaryi (Layer III), Cd > Zn > Cu > Pb > Ni; P. acerifolia, Cd > Zn > Ni > Pb > Cu; S. japonica, Cd > Ni >Zn > Pb > Cu; and C. deodara, Cd > Zn > Pb > Cu > Ni.
Overall, Cd and Zn were the heavy metal elements causing the most serious degree of pollution in plant leaves in both May and November (Table 5). Although the Cd concentration in plant leaves was the lowest among the heavy metals, its relatively high Pi value indicated that it is an element that can harm plants. According to the Nemero comprehensive index, Psum of O. japonicas in May and November was less than 2, indicating slight pollution; that of L. vicaryi in May was less than 3, indicating moderate pollution; but of all other plant leaves in May and November it was greater than 3, indicating serious heavy metal pollution.

4. Discussion

4.1. Temporal Variation of the Heavy Metal Pollution in Plant Species

Heavy metals, such as Zn, Cu, Ni and Pb, are released from vehicle emissions and mechanical wear of brake pads, braking systems or tires, increasing the content of heavy metals in suspended atmospheric particulate matter [44,45,46,47]. Plant leaves can effectively adsorb, block, and immobilize atmospheric particulates through their external structures (e.g., hairs and waxy cuticles) and internal physiological characteristics [48,49,50]. The concentrations of heavy metals in plant leaves were significantly different between May and November (p < 0.05); however, from May to November, with the growth of plants, the concentrations of various heavy metal elements changed inconsistently. The heavy metal concentrations in the plant leaves of the current study not only relate to the growing season and the internal/external physiological characteristics of plants, but are also associated with the rainwater runoff and changes in the external environment [51].
As can be seen from Figure 2, the concentration of heavy metals in leaves of different species varied at different times, among which Pb in C. deodara leaves and Ni in S. japonica leaves changed significantly (p < 0.05). The total heavy metal concentration in C. deodara samples in May was higher than that in November, and Pb concentration was significantly higher than that in November (p < 0.05), which might be because of leaf surface characteristics, leaf density, and the leaf angle of C. deodara [52]. In May, air turbulence was more frequent than in November and strong winds could transfer heavy metal particles from the ground to the air in this area. Notably, C. deodara has small leaves and complex branches and leaf density, which could effectively block atmospheric particles; however, the dust retention capacity of C. deodara decreases with the increasing rainfall [52], and thus, the heavy metal concentration of C. deodara samples in November was lower than in May. Similarly, under the influence of the rainy season, heavy metals on the surface of S. japonica leaves would have also been likely to decrease; however, according to the experimental results, the heavy metal concentration of S. japonica samples in November was higher than in May, particularly of Ni (p < 0.05). The S. japonica samples were collected from along the Baofu Roads, near the Longhai railway, where a new railway had been under construction in July 2017. Large trucks needed to transport materials, such as steel and cement, would have released exhaust gases and disturbed ground dust, which would have both entered into the atmosphere, possibly leading to increased pollution levels. S. japonica trapped a large number of suspended particles in the tiny epidermal hairs on the back of its leaves and on protuberances on the leaf surface.

4.2. Spatiotemporal Distribution of the Degree of Heavy Metal Pollution in Plant Leaves

It can be seen from the Table 6 that height has a significant impact on Psum (p < 0.05). The order of plant contamination in May was: arbor (Layer IV) > shrub (Layer III) > shrub (Layer II) > herb (Layer I); the order of plant contamination in November was: arbor (Layer IV) > shrub (Layer II) > shrub (Layer III) > herb (Layer I). Both in May and November, the highest levels of pollution were found for arbors and the lowest for herbs. Other studies have shown that arbors are higher off the ground, with relatively strong air flow, and arbors are more effective at capturing particles from the atmosphere through wet and dry deposition than low plants [53]. Herb grows near the ground, and its leaf surface heavy metal content may be diluted by the soil splashed on the leaves [54]. The contaminated areas of the herb, shrubs and arbors in May and November were approximately the same (except for areas E and F; Figure 3). As shown in Figure 3, the area with the highest degree of pollution of arbors (Layer IV) was area D. Although there are no industrial factories in this area, the overpass here is an important factor affecting the level of pollution. The overpass is above the ground, with the deck height almost comparable to the position of the arbor canopy. Many vehicles use this route on a daily basis. Thus, vehicle exhaust emissions and secondary dust fall on the leaves of arbors next to the overpass. The hairs and rough surface of the P. acerifolia leaves collected here increased their ability to adsorb particulate matter. The highly polluted area of herb Layer I was in Area A, which is a prosperous business area in Baoji city, with many shopping malls, and a large flow of people and numerous small vehicles every day. Herb leaves are closest to the ground, enabling them to adsorb several heavy metal elements, such as Ni, and Pb, resulting from vehicle exhausts and friction loss of vehicle parts (e.g., tires). The areas with a high degree of pollution for shrubs (Layer II and III) were similar, with Layer II in Area B and Layer III in area C. In addition, the arbor pollution in Jiangtan Road area is also more serious. Jiangtan Road and Binhe Road had the highest pollution levels in May (Figure 4a). The exhaust gases from industries, particulate matter from the exhausts of large delivery vehicles, tire wear debris, and secondary dust caused by disturbed airflow resulted in the higher degree of heavy metal pollution of shrub and arbor leaves in this area. The herbs in Layer I in this area were less polluted because they were planted 5 m away from the traffic line, which is less affected by the secondary dust of motor vehicles. It is worth noting that in November, the pollution level in Area F of Layer IV increased compared with May, whereas the pollution level in Area E decreased. As discussed earlier, this might be because of the new railway under construction in Area F from July onwards, and the resulting emissions increasing the level of pollution in November. Baofu Road and Binhe Road had the highest pollution levels in November (Figure 4b). As also discussed earlier, factories in Area E was stopped production during November by the Government to reduce the air pollution level in Baoji city during winter, thus resulting in decreased levels of heavy metal pollutants recorded in this study.

4.3. Potential Ecological Risk Assessment of Heavy Metal Pollution in Plant Leaves

The E and RI of heavy metal elements in leaves of different species at different times were compared and analyzed (Table 7). As can be seen from Table 7, the average of E values of the five heavy metals in May was in the order of Cd > Pb > Ni > Cu > Zn. The average of E values of the five heavy metals in November was in the order of Cd >Ni > Pb > Cu > Zn. The E values of Cu and Zn in all samples were less than 30 in May and November, which showed a slight ecological risk. Ni in all sampling points in May showed a slight ecological risk, whereas, in November, there were 3 sampling points with Ni with an E-value of more than 30, all of which were located in industrial areas. The E-value of Pb with only one sample in May and November showed considerable ecological risk, and the other samples all showed slight ecological risk. In May, the E-value of Cd reached a moderate level or above, accounting for 58.62% of the sample points, and 17.24% of the sample points reached a very high ecological risk. In November, the sample points the E-value of Cd reached the moderate level or above accounted for 69.84% of the total sample points, and 16.13% of the sample points reached very high ecological risk. Cd is a highly toxic element, and even if its concentration is very low, it can cause serious harm to human beings and living things. It has been reported by scholars that Cd was the element with the highest ecological risk index among the plant leaves in Binhe Road, Baoji city, which was consistent with our results [34]. Industrial production and fossil fuel combustion can release large amounts of particulate matter containing Cd into the atmosphere, some of which accumulates on leaves through wet and dry deposition. In addition to the high concentration of Cd in leaves, many studies have reported that the content of Cd in the soil of Baoji city was also high [55,56,57]. Therefore, the potential harm of Cd to the environment of Baoji city should receive more attention from the Government.
In May, the RI of plant leaves ranged from 17.02 to 713.93, and the P. acerifolia, S. japonica and C. deodara samples showed high ecological risk. The range of RI in November was 15.66–956.39, and the leaf samples of P. acerifolia, S. japonica and C. deodara showed a high ecological risk. The RI of O. japonicas, L. vicaryi (II) and L. vicaryi (III) in May and November showed below considerable ecological risk; therefore, the potential risk level of arboreal vegetation was higher than that in herb and shrubs.

5. Conclusions

The most concentrated heavy metals in the leaves sampled from Baoji streets were Zn, Cu and Pb, whereas the Ni and Cd contents were lower. In May, the heavy metal concentration was the highest in the leaves of C. deodara; however, in November, the concentration of heavy metals in leaves of S. japonica was the highest. In addition, the increase of particulate matter in local atmospheric environment caused more particulate matter to be contained by the leaves of S. japonica because of the changes in the external environment.
The Psum values of plant leaves at different heights were significantly different (p < 0.05), indicating that the pollution level of plant leaves at different heights was different. Both in May and November, the highest levels of pollution were found for arbors and lowest for herbs. Compared with low plants, arbor can capture particles from the atmosphere through wet and dry deposition. At the same altitude, areas with high levels of heavy metal pollution in May were basically the same as that in November. An area with high levels of heavy metal pollution in Layer I was the business district of Jinger Road, for Layer II and III was around Jiangtan Road, and that for Layer IV was near the overpass. Areas with high levels of pollution were affected by transportation and industry.
The leaves of P. acerifolia, S. japonica and C. deodara sample reached a very high level of risk. The pollution index and potential ecological risk index of Cd were the highest, indicating that the potential harm of Cd to the environment of Baoji city should receive more attention from the Government.
Considering the planting differences of urban street greening vegetation, we collected the leaves of three kinds of vegetation as the research object of Layer IV. Data analysis found that the concentrations of heavy metal elements in the three kinds of vegetation were not significantly different; therefore, different types of plant leaves were used to analyze the pollution changes of each street in Layer IV, but the adsorption capacity of these three kinds of plant leaves to heavy metal elements still needs further study and analysis. In order to minimize the impact of rain erosion on the results, sampling was carried out after two weeks of no precipitation in the month; however, the meteorological observation data of Baoji city showed that rainfall in the study area increased significantly from May to November after 2019, which may have an impact on the future. The research object is relatively common street greening plants, which can provide a reference for other scholars to explore pollution changes in other cities.

Author Contributions

J.Z. conceived and designed the study, coordinated sampling, laboratory measurements, and data analysis, and presided over the writing of the first draft of the manuscript. Y.G. and Q.L. participated in the conception and design of the study, performing sampling, laboratory measurements, and analyzing and interpreting the data. Y.W., B.W. (Bowen Wu) and X.L. participated in sampling and laboratory measurements, and contributed to the interpretation of the data. B.W. (Bo Wang) and D.X. participated in the analysis and interpretation of the data. All authors participated in the revision of the manuscript and read and agreed with the submitted version. All authors have read and agreed to the published version of the manuscript.

Funding

This work was supported by the National Natural Science Foundation of China (Grant No. 41871147).

Informed Consent Statement

Not applicable.

Data Availability Statement

Data that support the findings of this study are available from the corresponding author upon reasonable request.

Acknowledgments

Special thanks to Dongxing Li, Bin Liu, Xionghui Zhou and Xiuli Kang for their support and help with the field investigation and manuscript editing.

Conflicts of Interest

The authors declare no conflict of interest.

References

  1. Liu, T.; Marlier, M.E.; DeFries, R.S.; Westervelt, D.M.; Xia, K.R.; Fiore, A.M.; Mickley, L.J.; Cusworth, D.H.; Milly, G. Seasonal impact of regional outdoor biomass burning on air pollution in three Indian cities: Delhi, Bengaluru, and Pune. Atmos. Environ. 2018, 172, 83–92. [Google Scholar] [CrossRef]
  2. Battista, G.V.; de Lieto, R. Correlation between air pollution and weather data in urban areas: Assessment of the city of Rome (Italy) as spatially and temporally independent regarding pollutants. Atmos. Environ. 2017, 165, 240–247. [Google Scholar] [CrossRef]
  3. Masiol, M.; Hopke, P.; Felton, H.; Frank, B.; Rattigan, O.; Wurth, M.; LaDuke, G. Analysis of major air pollutants and submicron particles in New York City and Long Island. Atmos. Environ. 2017, 148, 203–214. [Google Scholar] [CrossRef] [Green Version]
  4. Jang, B.-K.; Park, K.; Lee, S.Y.; Lee, H.; Yeon, S.H.; Ji, B.; Lee, C.H.; Cho, J.-S. Screening of particulate matter reduction ability of 21 indigenous Korean evergreen species for indoor use. Int. J. Environ. Res. Public Health 2021, 18, 9803. [Google Scholar] [CrossRef]
  5. Obolkin, V.; Khodzher, T.; Sorokovikova, L.; Tomberg, I.; Netsvetaeva, O.; Golobokova, L. Effect of long-range transport of sulphur and nitrogen oxides from large coal power plants on acidification of river waters in the Baikal region, East Siberia. Int. J. Environ. Stud. 2016, 73, 452–461. [Google Scholar] [CrossRef]
  6. Maricq, M.M.; Podsiadlik, D.H.; Chase, R.E. Examination of the size-resolved and transient nature of motor vehicle particle emissions. Environ. Sci. Technol. 1999, 33, 1618–1626. [Google Scholar] [CrossRef]
  7. Salata, F.; Golasi, I.; Vollaro, R.d.L.; Vollaro, A.d.L. Outdoor thermal comfort in the Mediterranean area. A transversal study in Rome, Italy. Build. Environ. 2016, 96, 46–61. [Google Scholar] [CrossRef]
  8. Gargava, P.; Rajagopalan, V. Source prioritization for urban particulate emission control in India based on an inventory of PM_(10) and its carbonaceous fraction in six cities. Environ. Dev. 2015, 16, 44–53. [Google Scholar] [CrossRef]
  9. Jürgen, B.; Grantz, D.A. Plants and Atmospheric Aerosols; Springer: Cham, Switzerland, 2016; Volume 78. [Google Scholar]
  10. Sabin, L.D.; Lim, J.H.; Venezia, M.T.; Winer, A.M.; Schiff, K.C.; Stolzenbach, K.D. Dry deposition and resuspension of particle-associated metals near a freeway in Los Angeles. Atmos. Environ. 2006, 40, 7528–7538. [Google Scholar] [CrossRef]
  11. Sharma, K.; Singh, R.; Barman, S.C.; Mishra, D.; Kumar, R.; Negi, M.P.S.; Mandal, S.K.; Kisku, G.C.; Khan, A.H.; Kidwai, M.M.; et al. Comparison of trace metals concentration in PM_(10) of different locations of Lucknow City, India. Bull. Environ. Contam. Toxicol. 2006, 77, 419–426. [Google Scholar] [CrossRef]
  12. Rai, P.K. Environmental magnetic studies of participates with special reference to biomagnetic monitoring using roadside plant leaves. Atmos. Environ. 2013, 72, 113–129. [Google Scholar] [CrossRef]
  13. Gonzalez, C.M.; Gomez, C.D.; Rojas, N.Y.; Acevedo, H.; Aristizabal, B.H. Relative impact of on-road vehicular and point-source industrial emissions of air pollutants in a medium-sized Andean city. Atmos. Environ. 2017, 152, 279–289. [Google Scholar] [CrossRef]
  14. Chan, A.T.; So, E.S.; Samad, S.C. Strategic guidelines for street canyon geometry to achieve sustainable street air quality—Part II: Multiple canopies and canyons. Atmos. Environ. 2003, 37, 2761–2772. [Google Scholar] [CrossRef]
  15. Battista, G.C.; Carnielo, E.; Vollaro, R.D.L. Thermal impact of a redeveloped area on localized urban microclimate: A case study in Rome. Energy Build. 2016, 133, 446–454. [Google Scholar] [CrossRef]
  16. Zeng, X.-W.; Vivian, E.; Mohammed, K.; Jakhar, S.; Vaughn, M.; Huang, J.; Zelicoff, A.; Xaverius, P.; Bai, Z.; Lin, S.; et al. Long-term ambient air pollution and lung function impairment in Chinese children from a high air pollution range area: The Seven Northeastern Cities (SNEC) study. Atmos. Environ. 2016, 138, 144–151. [Google Scholar] [CrossRef] [Green Version]
  17. Maher, B.; Moore, C.; Matzka, J. Spatial variation in vehicle-derived metal pollution identified by magnetic and elemental analysis of roadside tree leaves. Atmos. Environ. 2008, 42, 364–373. [Google Scholar] [CrossRef] [Green Version]
  18. Cichowicz, R.; Dobrzański, M. Modeling pollutant emissions: Influence of two heat and power plants on urban air quality. Energies 2021, 14, 5218. [Google Scholar] [CrossRef]
  19. Zanhong, W.; Jibiao, L. Capacity of dust uptake by leaf surface of Euonymus Japonicus Thunb and the morphology of captured particle in air polluted city. Ecol. Environ. 2006, 15, 327–330. [Google Scholar] [CrossRef]
  20. Givoni, B. Impact of planted areas on urban environmental quality: A review. Atmos. Environ. Part B Urban Atmos. 1991, 25, 289–299. [Google Scholar] [CrossRef]
  21. Nowak, D.J.; Crane, D.E.; Stevens, J.C. Air pollution removal by urban trees and shrubs in the United States. Urban For. Urban Green. 2006, 4, 115–123. [Google Scholar] [CrossRef]
  22. Freer-Smith, P.; Holloway, S.; Goodman, A. The uptake of particulates by an urban woodland—Site description and particulate composition. Environ. Pollut. 1997, 95, 27–35. [Google Scholar] [CrossRef]
  23. Fantozzi, F.; Monaci, F.; Blanusa, T.; Bargagli, R. Holm oak (Quercus ilex L.) canopy as interceptor of airborne trace elements and their accumulation in the litter and topsoil. Environ. Pollut. 2013, 183, 89–95. [Google Scholar] [CrossRef] [PubMed]
  24. Chai, Y.; Zhu, N.; Han, H. Dust removal effect of urban tree species in Harbin. Chin. J. Appl. Ecol. 2002, 13, 1121–1126. [Google Scholar] [CrossRef]
  25. Xiong, T.-T.; Leveque, T.; Austruy, A.; Goix, S.; Schreck, E.; Dappe, V.; Sobanska, S.; Foucault, Y.; Dumat, C. Foliar uptake and metal(loid) bioaccessibility in vegetables exposed to particulate matter. Environ. Geochem. Health 2014, 36, 897–909. [Google Scholar] [CrossRef] [PubMed]
  26. Niazi, N.K.; Bishop, T.F.A.; Singh, B. Evaluation of spatial variability of soil arsenic adjacent to a disused cattle-dip site, using model-based geostatistics. Environ. Sci. Technol. 2011, 45, 10463–10470. [Google Scholar] [CrossRef]
  27. Harguinteguy, C.A.; Cofré, M.N.; Fernández-Cirelli, A.; Pignata, M.L. The macrophytes Potamogeton pusillus L. and Myriophyllum aquaticum (Vell.) Verdc. as potential bioindicators of a river contaminated by heavy metals. Microchem. J. Devot. Appl. Microtech. Branches Sci. 2016, 124, 228–234. [Google Scholar] [CrossRef]
  28. Shahid, M.; Xiong, T.; Castrec-Rouelle, M.; Leveque, T.; Dumat, C. Water extraction kinetics of metals, arsenic and dissolved organic carbon from industrial contaminated poplar leaves. J. Environ. Sci. 2013, 25, 2451–2459. [Google Scholar] [CrossRef]
  29. Fan, S.X.; Cai, Y.; Dong, L. Dust absorption capacities of eight evergreen broad-leaved plants in Beijing, China. Chin. J. Appl. Ecol. 2017, 28, 408–414. [Google Scholar] [CrossRef]
  30. Li, S.-N.; Kong, L.-W.; Lu, S.-W.; Chen, B.; Gao, C.; Shi, Y. Beijing common green tree leaves’ accumulation capacity for heavy metals. Environ. Sci. Pollut. Res. 2014, 35, 1891–1900. [Google Scholar] [CrossRef]
  31. Li, J.; Xu, Y.; Li, G.; Feng, G.; Jiang, X.; Si, L.; Yang, Y. Analyses of heavy metal accumulation and physiological characteristics in leaves of main arbor and shrub plants in traffic roads of Lanzhou City. Ecol. Environ. Sci. 2019, 28, 999–1006. [Google Scholar] [CrossRef]
  32. Chen, H.; Xia, D.-S.; Wang, B.; Liu, H.; Ma, X. Pollution monitoring using the leaf-deposited particulates and magnetism of the leaves of 23 plant species in a semi-arid city, Northwest China. Environ. Sci. Pollut. Res. 2022. [Google Scholar] [CrossRef] [PubMed]
  33. Wang, L.J.; Lu, X.W.; Kai, L. Analysis of content and environmental risk of heavy metal elements in street dust of Baoji City. Chin. J. Soil Sci. 2012, 43, 200–205. [Google Scholar] [CrossRef]
  34. Zhang, J.H.; Lin, Q.; Jiang, S.; Liu, B.; Li, D.X.; Wang, Y.H. Analysis of heavy metal pollution and ecological risk assessment on vegetation leaves in Baoji City. Environ. Sci. 2019, 40, 978–986. [Google Scholar] [CrossRef]
  35. Gao, J.X.; Dang, H.B.; Zheng, M.; Liu, L.; Jiang, L.Y. Heavy metal pollution assessment of farmland soil in suburb in Zhengzhou City. Chin. Agric. Sci. Bull. 2013, 29, 116–120. [Google Scholar] [CrossRef]
  36. Ming, H.U. Distribution characteristics and pollution assessment for the farmland soil heavy metals in Dali county. J. Arid. Land Resour. Environ. 2014, 28, 79–84. [Google Scholar] [CrossRef]
  37. Håkanson, L. An ecological risk index for aquatic pollution control. A sedimentological approach. Water Res. 1980, 14, 975–1001. [Google Scholar] [CrossRef]
  38. Ma, J.H.; Wang, X.Y.; Hou, Q.; Duan, H.J. Pollution and potential ecological risk of heavy metals in surface dust on urban kindergartens. Geogr. Res. 2011, 30, 486–495. [Google Scholar] [CrossRef]
  39. Yu, G.Y.; Wu, X.Y. Transfer and cycling of heavy metals in and out of the Larch trees before and after leaf fallen. Acta Ecol. Sin. 1998, 18, 203–209. [Google Scholar] [CrossRef]
  40. Guoying, Y.; Wu, Y.; Xin, W. Transferring and cycling of heavy metals in and out of poplar tree before and after its leaf fallen. Chin. J. Appl. Ecol. 1996, 7, 201–206. [Google Scholar] [CrossRef]
  41. Che, J.L.; Yu, S.Q.; Hui, L.; Qiu, W.X.; Wen, Y.T. Characteristics of heavy metal enrichment efficiency in different organs of urban green tree Cinnamomum camphora. Chin. J. Appl. Ecol. 2017, 28, 2907–2916. [Google Scholar] [CrossRef]
  42. Hu, S.Y.; Duan, X.M.; Shen, M.J.; Blaha, U.; Roesler, W.; Yan, H.T.; Hoffmann, E.A. Magnetic response to atmospheric heavy metal pollution recorded by dust-loaded leaves in Shougang industrial area, Western Beijing. Chin. Sci. Bull. 2008, 53, 1555–1564. [Google Scholar] [CrossRef] [Green Version]
  43. Cao, L.W.; Hu, S.Y.; Erwin, A.; Shi, S.L.; Yin, G. The spatio-temporal variation of magnetic properties of tree leaves in Linfen, China and its indication to the atmospheric pollution of heavy metals. Chin. J. Geophys. 2016, 59, 1729–1742. [Google Scholar] [CrossRef]
  44. Li, S.; Huayun, X.; She, W.D.; Congguo, T. Review on research on traffic-related heavy metals pollution. Earth Environ. 2012, 40, 445–459. [Google Scholar] [CrossRef]
  45. Guo, G.H.; Chen, T.-B.; Song, B.; Yang, J.; Huang, Z.C.; Li, M.; Chen, Y.-C. Emissions of heavy metals from road traffic and effect of emitted lead on land contamination in China: A primary study. Geogr. Res. 2007, 26, 922–930. [Google Scholar] [CrossRef]
  46. Zhu, M.; Tang, L.; Liu, D. Monitor and risk assessment of heavy metals in the soils along the main road—A review. Environ. Monit. China 2015, 31, 84–91. [Google Scholar] [CrossRef]
  47. Mohsen, M.; Ahmed, M.B.; Zhou, J.L. Particulate matter concentrations and heavy metal contamination levels in the railway transport system of Sydney, Australia. Transp. Res. Part D Transp. Environ. 2018, 62, 112–124. [Google Scholar] [CrossRef]
  48. Zhao, C.X.; Wang, Y.J.; Wang, Y.Q.; Zhang, H.L. Interactions between fine particulate matter (PM_(2.5)) and vegetation: A review. Chin. J. Ecol. 2013, 32, 2203–2210. [Google Scholar] [CrossRef]
  49. Shi-Yao, L.; Yu-bin, N.; Jin, F.; Hai-long, Y.; Ju-ying, H. Analysis on Dust Retention Capability of Greening Tree Species Surrounding Coal-Fired Power Plant Based on Leaf Surface Micro-Structure. Chin. J. Ecology 2021, 40, 604–614. [Google Scholar] [CrossRef]
  50. Fei, L.; Hui-Min, C.; Xiang-Min, Z. Magnetic response of dust-loaded leaves in parks of Shanghai to atmospheric heavy metal pollution. Environ. Sci. 2015, 36, 4374–4380. [Google Scholar] [CrossRef]
  51. Xiao-ying, C.; Qiu-ying, Z.; Xiao, Y.; Zhi-yun, J.; Ru-chen, X.; Yuan-mei, G.; Yi-hong, Z.; Da, Z.; Sheng-sheng, S.; Rui-bin, H.; et al. The Effects of Rainfall Partitioning on Heavy Metal Deposition for Three Typical Urban Tree Species in Guangzho. Chin. J. Ecol. 2021, 40, 1937–1946. [Google Scholar] [CrossRef]
  52. Lei, W.; Eerdun, H.; Lian-you, L.; Shang-Yu, G. Physico-chemical characteristics of ambient particles settling upon leaf surface of six conifers in Beijing. Chin. J. Appl. Ecol. 2007, 18, 487–492. [Google Scholar] [CrossRef]
  53. Chen, L.; Liu, C.; Zou, R.; Yang, M.; Zhang, Z. Experimental examination of effectiveness of vegetation as bio-filter of particulate matters in the urban environment. Environ. Pollut. 2016, 208, 198–208. [Google Scholar] [CrossRef] [PubMed]
  54. Chen, H.; Wang, B.; Xia, D.S.; Fan, Y.J.; Liu, H.; Tang, Z.R.; Ma, S. The influence of roadside trees on the diffusion of road traffic pollutants and their magnetic characteristics in a typical semi-arid urban area of Northwest China. Environ. Pollut. 2019, 252, 1170–1179. [Google Scholar] [CrossRef] [PubMed]
  55. Jun, Z.; Jie, D.; Qingfang, L.; Yani, G.; Wenke, W.; Zhoufeng, W. Spatial distribution and risk assessment of heavy metals in urban soils of Baoji city. J. Arid. Land Resour. Environ. 2018, 32, 100–106. [Google Scholar] [CrossRef]
  56. Wang, L.J.; Fan, S.X. Risk assessment of heavy metals in farmland soil in the outskirts of Baoji City. Chin. Agric. Sci. Bull. 2015, 31, 179–185. [Google Scholar] [CrossRef]
  57. Yi, W.L.; Dong, Q.; Yang, F.; Zhu, C.Y. Pollution characteristics, sources analysis and potential ecological risk assessment of heavy metals in different functional zones of Baoji City. Ecol. Environ. Sci. 2018, 27, 2142–2149. [Google Scholar] [CrossRef]
Figure 1. (a) Location of Baoji in China; (b) Sampling location of roadside plant leaves of Baoji; (c) Example of an individual sampling.
Sustainability 14 05809 g001
Figure 2. Histogram plots showing the concentrations of heavy metal in leaves from different plants. (a) Cu, Pb, and Zn concentration in leaves in May; (b) Cu, Pb, and Zn concentration in leaves in November; (c) Ni, Cd concentration in leaves in May; (d) Ni, Cd concentration in leaves in November; (I–IV: 0.05 m, 0.25 m, 1 m and 4 m, respectively).
Sustainability 14 05809 g002
Figure 3. Spatial distribution of heavy metal pollution in plant leaves in May (a) and in November (b). (A: Jinger Road; B: Jiangtan Road; C: Jiangtan Road; D: Park Road; E: Jiangtan Road; F: Baofu Road).
Sustainability 14 05809 g003
Figure 4. Spatial distribution of Heavy metal concentration in plant leaves in May (a) and in November (b).
Sustainability 14 05809 g004
Table 1. The parameters of ICP-MS.
Parameter NameParameterParameter NameParameter
Radio frequency power1550 WAtomizing chamber temperature2.6 ℃
Plasma gas flow15 L/minAnalysis time0.6 s
Carrier gas flow rate0.8 L/minPlasma cooling water velocity0.55 L/min
Atomizer velocity1.1818 L/minSampling depth5 mm
Flow rate of cooler13.94 L/minDetermination of the number3
Table 2. Mean element concentration, coefficient of variation (CV) of roadside plant leaves in Baoji.
Ni
(mg·kg1)
Cu
(mg·kg−1)
Cd
(mg·kg−1)
Pb
(mg·kg1)
Zn
(mg·kg1)
SpeciesTimeMeanCVMeanCVMeanCVMeanCVMeanCV
O. japonicus
(I)
May3.070.4510.570.300.400.8810.601.1567.490.35
Nov.3.070.4413.710.250.230.454.741.7352.430.45
L. vicaryi
(II)
May2.550.4510.650.570.321.425.000.9569.310.39
Nov.4.390.3915.200.340.180.778.050.6663.820.44
L. vicaryi
(III)
May1.920.288.630.380.210.783.710.5856.790.19
Nov.1.790.4712.730.290.120.574.670.5552.490.42
P. acerifolia
(IV)
May3.480.1913.610.320.210.599.780.6065.510.34
Nov.3.791.058.561.060.091.563.411.5647.690.77
S. japonica
(IV)
May2.520.2110.410.310.110.347.170.4557.690.23
Nov.11.550.8914.030.190.220.1511.370.3773.820.07
C. deodara
(IV)
May3.080.987.250.660.190.4630.281.4785.430.74
Nov.1.730.128.380.510.130.774.190.0329.650.55
Table 3. Heavy metals concentration of campus plant leaves in Baoji.
HerbShrubShrubArbor
TimeO. japonicus
(I)
L. vicaryi
(II)
L. vicaryi
(III)
P. acerifolia
(IV)
Ni
(mg·kg−1)
May4.831.291.051.33
Nov.2.253.571.531.47
Cu
(mg·kg−1)
May11.189.84.539.28
Nov.10.0611.616.816.36
Cd
(mg·kg−1)
May0.340.180.160.01
Nov.0.690.030.020.02
Pb
(mg·kg−1)
May9.674.681.525.72
Nov.7.704.392.992.94
Zn
(mg·kg−1)
May52.3133.7927.5223.49
Nov.65.7421.2220.0916.44
Table 4. Three-way ANOVA results of the heavy metals concentration of roadside plant leaves in Baoji. Fixed effects included “Height”, “Plant species, “Time”. Significant different (p < 0.05) are shown in bold.
NiCuCdPbZn
Height0.0070.0660.1540.30.068
Plant species0.0010.220.9880.0460.696
Time0.0040.0290.0650.0150.018
Height: Time0.10.8540.6460.6430.926
Plant species: Time0.0000.0940.5170.010.056
Table 5. Pi and Psum of roadside plant leaves in Baoji.
Pi
SpeciesTimeNiCuCdPbZnPsumLevel
O. japonicus
(I)
May0.640.951.181.091.291.51slight pollution
Nov.1.361.360.340.610.791.439slight pollution
L. vicaryi
(II)
May1.981.081.741.072.052.30moderate pollution
Nov.1.231.315.351.833.014.26heavy pollution
L. vicaryi
(III)
May1.821.901.332.432.062.48moderate pollution
Nov.1.171.874.281.562.613.57heavy pollution
P. acerifolia
(IV)
May2.491.4611.731.712.788.91heavy pollution
Nov.2.581.356.221.162.905.89heavy pollution
S. japonica
(IV)
May1.891.126.141.252.464.71heavy pollution
Nov.7.882.2115.473.874.4911.96heavy pollution
C. deodara
(IV)
May2.320.7810.255.243.497.93heavy pollution
Nov.1.181.328.691.431.806.49heavy pollution
Table 6. Two-way ANOVA results of the Linear mixed-effects model analysis of Psum. Fixed effects included “Height”, and ”Time”. Significant differences (p < 0.0001) are shown in bold.
F-Valuep-Value
Height25.718<0.0001
Time1.650.202
Height: time0.9630.413
Table 7. E-value and RI value of heavy metal elements in roadside plant leaves in Baoji.
E
TimeO. japonicas
(I)
L. vicaryi
(II)
L. vicaryi
(III)
P. acerifolia
(IV)
S. japonica
(IV)
C. deodara
(IV)
NiMay3.189.889.1112.449.4711.58
Nov.6.816.155.8512.9439.405.90
CuMay4.735.409.527.335.613.90
Nov.6.816.549.366.7311.036.59
CdMay35.3752.0939.89351.80184.07307.41
No.10.10160.56128.42186.74464.07260.70
PbMay5.485.3412.158.566.2726.19
Nov.3.079.157.805.8119.377.14
ZnMay1.292.052.062.792.463.50
Nov.0.803.012.612.904.491.80
RIMay53.5379.6277.77425.15276.36468.95
Nov.29.25196.81163.51241.66671.82375.57
Publisher’s Note: MDPI stays neutral with regard to jurisdictional claims in published maps and institutional affiliations.

