Article

Getting Started with Positive Energy Districts: Experience until Now from Maia, Reykjavik, Kifissia, Kladno and Lviv

1
Technical Research Centre of Finland, 02044 Espoo, Finland
2
University Centre for Energy Efficient Buildings, Czech Technical University in Prague, 273 43 Bustehrad, Czech Republic
3
Fraunhofer IAO, 70569 Stuttgart, Germany
*
Author to whom correspondence should be addressed.
Sustainability 2022, 14(10), 5799; https://doi.org/10.3390/su14105799
Submission received: 31 March 2022 / Revised: 5 May 2022 / Accepted: 7 May 2022 / Published: 11 May 2022

Abstract

:
Cities are at the centre of the debate to mitigate climate change. A considerable number of cities have already made commitments to sustainability transitions through the introduction and integration of green strategies. Moreover, in the past few years, Europe has witnessed an increase in the development of smart cities and advancement towards creating more sustainable cities. At the moment, an innovative concept in smart city development involves Positive Energy Districts (PEDs) that further encourage districts and cities to become carbon neutral. This paper looks at the five cities of Maia, Reykjavik, Kifissia, Kladno and Lviv that are a part of an ongoing H2020 project. The purpose of the paper was to understand the status quo of energy transition in these five cities as they embarked on the PEDs journey and identify associated challenges and benefits that PEDs brought to each city. The information was collected through a knowledge gap survey, City Vision 2050 workshop, discussions during the City Forum and individual interviews with city representatives. Cities across Europe and beyond may find themselves in a similar situation, and therefore, this paper also provides brief set of checkpoints to prepare new cities for the PED journey, thus enabling them to transition towards PEDs more efficiently.

1. Introduction

In 2020, as economies struggled with the weight of COVID-19 lockdowns, renewable sources of energy such as wind and solar photovoltaics (PV) continued to grow rapidly, and electric vehicles set new sales records. The new economy has characteristics of being more electrified, efficient, interconnected, and clean. Solar PV and wind are now the cheapest available sources of new electricity generation. However, this positive situation is countered by the sharp increase in prices in natural gas, coal, and electricity markets [1]. While there have been significant advances in renewables during the pandemic, 2021 witnessed a large rebound to coal and oil use. This led to the second largest annual increase in carbon emissions. Therefore, the energy sector must be at the heart of the efforts to tackle climate change [1].
Cities are the focal points for de-carbonization strategies relating to energy, transport, buildings, industry, and agriculture [2]. While cities occupy only 2% of the total land, they account for 40% of the total energy consumption, contribute to 70% of the greenhouse gas emissions and about two-thirds of global energy demand [3,4,5]. At the moment, 55% of the world’s population live in urban areas, and this is expected to increase to 68% by 2050 [6,7]. Cities have access to large capital and abundant know; therefore, they have the ability to create the economies of scale essential for the piloting and scaling up of new ideas [2]. In the past, services and infrastructure development ‘reacted’ to expanding cities instead of being ‘planned as a process’. This is a reason why utilities are not aligned with infrastructure and why cities often do not have fully integrated water supplies or electricity networks. In addition, the success is also heavily dependent on proper identification of any potential obstacles and rebound effects such as unintended indirect impacts [8].
Dealing with the climate emergency is not only the responsibility of cities but also of citizens who are not only political actors in a governance structure, but also users, producers, consumers, and owners. A combined effort from these actors may have a huge impact on urban areas, associations, and homes, thus propelling the climate transition, advancing the economy, and preserving the environment. As evidently said by the Mission Board for Climate-Neutral and Smart Cities, citizens and civil society have to be given more substantial roles, new platforms for action, and better resources [2,9].
The imperative role of cities in sustainability transitions is also emphasized in the Sustainable Development Goal 11 that aims to “make cities inclusive, safe, resilient and sustainable”. The United Nations has adopted the ‘New Urban Agenda’ [5] and the European Union has implemented the 2016 Pact of Amsterdam [10] to address societal challenges and include urban aspects in policies. Furthermore, the European Green Deal makes explicit reference to cities to reach the European Union’s (EU) climate-neutral and circular transition objectives [4].
Identifying the key trends in urbanization likely to unfold over the coming years is crucial for the implementation of the 2030 Agenda for Sustainable Development, including efforts to establish a new framework for urban development [7]. A significant number of cities has already made commitments to sustainability transitions: Copenhagen (Denmark) is focusing on being the first carbon-neutral city by 2025; Adelaide (Australia) aims to have zero net carbon emissions and 50% renewables by 2025; Amsterdam (The Netherlands) aims to halve the use of new raw materials by 2020 and be fully circular by 2025; while Oslo (Norway), Los Angeles (United States), Stockholm (Sweden), Beijing (China), London (United Kingdom), and the San Francisco Bay Area (United States) have announced their ambitions to become electric vehicle capitals or leaders [4].
Transforming the building stock, mobility systems, industries and urban infrastructure will nonetheless require heavy investment and requires an integrated approach across all government levels including housing, transportation, energy systems and simultaneously employment, education and other urban services. This, in turn, leads to positive outcomes such as better well-being, business opportunities, and increased growth for all [4]. The pace of urbanization is predicted to be the fastest in low-income and lower-middle-income countries. Focusing on the urban and rural poor as well as vulnerable groups must also be considered for the urban transformation and development processes [7].

1.1. Positive Energy Districts (PEDs)

The emerging trend of positive energy districts (PEDs) is a transition towards more energy-conscious behaviour that calls for extensive and innovative engagement approaches and co-creation practices [9,11,12]. However, it is first crucial to define and understand different types of PEDs. The SET Plan Action 3.2, JPI Urban Europe and the EERA Joint Program on Smart Cities describe PEDs as follows: “Energy-efficient and energy-flexible urban areas or groups of connected buildings producing net zero greenhouse gas emissions while also having an annual local or regional surplus production of renewable energy. PEDs require integration of various systems and infrastructures and interaction between buildings, users and the regional energy, mobility and ICT systems while securing the energy supply and a good life for all in line with social, economic and environmental sustainability” [11]. The European Energy Research Alliance (EERA) classifies three categories of PEDs [13,14]:
  • PED autonomous: a district having clear geographical boundaries that is completely self-sufficient energy-wise. This means the energy demand is covered by renewable energy produced within the district. The district is thus not allowed to import any energy from the external electricity grid or district heating/gas network. Energy generated in excess may be exported;
  • PED dynamic: a district having clear geographical boundaries with annual on-site renewable energy generation higher than its annual energy demand. The district may also openly interact with other PEDs as well as the external electricity grid and district heating/gas network;
  • PED virtual: a district that makes use of virtual renewable energy systems and energy storage located outside its geographical boundaries. The combined annual energy production of the virtual renewable energy systems and the on-site renewable energy systems must, however, be greater than the annual energy demand of the district.
Positive energy buildings or Plus Energy Buildings (PEBs) are also essential to mitigate climate change. PEBs refer to energy-efficient buildings that ‘produce more energy than they consume’. However, the concept of PEB is quite challenging in terms of, for example, renewables, time span, emissions, and building type. Similar to PEDs, there is not one definition of PEBs, and therefore there is a lack of technical solutions and business models to support the development [15].
When integrating decentralized renewable energy systems in cities, upgrading the district scale is much more beneficial than upgrading only one building. With PEDs, renewable energy may be evenly distributed throughout the district which allows the renewable energy systems to be installed in a much more strategic manner. Renewable energy plants and storage may also be constructed on a larger scale, thus leading towards cost efficiency [16]. With reference to replication of PEDs, the Smart City Information System (SCIS) defines replication of PEDs as the possibility of transporting or ‘copying’ results from a pilot case to other geographical areas with potentially different boundary conditions [8]. In other words, if a pilot PED was proven to work in one community or region, it could be exported to other communities or regions (indigenously or abroad), considering that the boundary conditions could differ from those in the piloted community or region. Replication may also involve the management process that was used in the pilot scheme or the cooperation structure between critical stakeholders.

1.2. Literature Review

Although many European cities are leading transitions to low-carbon energy, there is no common definition, roadmap or guidelines to ensure the actual feasibility of PED designs, mainly because cities are in planning or early implementation stages, According to Zhang et al. [17], most of the PED projects are in the implementation phase, i.e., 26 projects, and 17 projects are being planned. In total, 16 PED-related projects have already been implemented or are in operation, out of which 5 projects have completed implementation but have yet to integrate the energy systems into the existing local energy networks. The remaining 11 projects are in the operation stage. At the moment, Norway is leading with nine PED projects, closely following by Italy with eight PED projects.
Evidence also shows that real-life PEDs often go beyond the frames set by the definitions. As explained by Derkenbaeva [12] through their study of 11 implemented PEDs in Europe, this is because the concept fails to consider the contextual factors that are inherent in them: spatial (neighbourhood, city etc.); technological (energy system and infrastructure); economic (funding, cost savings etc.); environmental (weather conditions and pollution); and social (stakeholder partnerships, community etc.). According to the study [12], it could be beneficial to view PEDs by combining a complex adaptative systems (CAS) approach and the doughnut economics view. The CAS is a complex system that consists of a dynamic network of micro- and macro-interactions of component and emphasizes that any single component of the system cannot be understood separately but must be explained holistically as a system of components and their interactions. The doughnut view demands: (1) not to exceed the ecological ceiling by exhausting the natural resources, and (2) to ensure that every individual’s needs are met by creating a socially just space for humanity [18]. The combination of the two approaches is valid as PEDs bring together agents (end users, companies, governments) and technologies to form a complex system, impact other parts of the system and aim to resolve access to energy and climate change [12,19]. Krangas et al. [20] studied the needs for supporting PED development using the European Cooperation in Science and Technology (COST) Action as an expert platform. The study also highlights similar concerns as raised by Derkenbaeva [12] that PEDs require a thorough understanding of a city’s contextual conditions, policies, priorities, strategies, and resources. It is also essential that the city is well equipped with knowledge, skills and technologies to plan, design, implement, monitor and replicate PEDs. Lindholm et al. [14] explored the essential factors for planning and implementing different types of PEDs (autonomous, dynamic and virtual) in different regions in Europe. The authors assessed the European energy market by analysing the best suited renewable sources to integrate in PEDs (such as wind and hydro), finally proposing an onion model to construct PEDs. The model proposes that most of the PEDs can be built outside of the city center to produce more renewable energy than what is consumed; therefore, they can export renewable energy to the inner city and maintain overall self-sufficiency of the region. Zhang et al. [17] studied the characteristics of 60 existing PED projects in Europe such as geographical information, spatial-temporal scale, energy concepts, and building archetypes to finally develop a PED database for knowledge sharing and give useful guidance for future PED definitions. Mihalova et al. [21] studied residents’ preferences for PED configurations in Switzerland. The study revealed that the preference greatly depends on the resident’s car and home ownership, age, household size and values.
Despite PEDs being a hope for dealing with climate change and having the ability to transform cities into healthier environments, the journey leading to PEDs is indeed difficult as cities encounter similar challenges at various phases of their PED projects. Zhang et al. [17] describe several types of barriers faced at each phase of the PED development process such as the fact that administrative and stakeholder issues are evident in all three phases: planning, implementing and operation, while environmental issues such as pollution reduction are evident only in the operation phase. Krangas et al. [20] revealed seven prominent factors in PED development, ranked from highest to lowest: governance, incentive, social, process, market, technology and context. Good et al. [22] analysed barriers to smart, demand-side interventions for neighbourhoods and districts and highlighted similar challenges: political/regulatory, economic, social and technological. Similarly, SCIS [8] also outlines four main clusters that require ample consideration when approaching replication in a project: technical, financial and economic, regulatory and administrative, and lastly social (softer aspects such as stakeholder engagement). Bossi et al. [23] uncovered 21 success factors connected to PEDs with the top 5 factors including stakeholder involvement, integrated technology, funding and business models, political support, and citizen involvement and support. In addition, the study showcased 17 challenges that specifically highlight legislation and regulation as a large obstacle. It is interesting to note, however, that the success factors may become challenges, depending on the local circumstances. For example, good political support in one city could make the PED project a priority; however, lack of political support may create more obstacles in another city. Siddarth et al. [24] explored 10 questions related to PEDs and offered preliminary responses to each, such as the required conditions to support rapid scaling, essential engagement and governance strategies and reducing energy demand. In addition to expert advice, the study also highlights many of the same key PED barriers as those observed in earlier studies including lack of technical capacity and access to advisory services at the local level, inadequate citizen awareness and mobilisation, lack of resources for the city to conduct systematic outreach programmes and a tendency to have sporadic and ad hoc interventions instead of holistic deployment of complementary measures for interoperability across interventions and sectors within PEDs. Uspenskaia et al. [25] studied how Leipzig West could be transformed into a PED, the challenges that occur in the process and how the Leipzig model could support replication in other cities.
Rehman et al. [26] analysed energy technologies, control strategies and varying loads to support a demo building to reach the positive energy building status in the Nordic climate; however, the results revealed that it proved difficult to reach Net Zero even when including all energy demands. On the other hand, a similar study performed in Italy by Magrini et al. [27] showed the demo building producing an energy surplus and meeting the positive energy building requirement; however, the demo building was located on the outskirts of the city. This highlights yet again that PED boundaries have to expand and be made more flexible, as provided by Virtual PEDs.
An essential point to highlight here is also the importance of stakeholder participation, which is different from citizen and community engagement. Stakeholder engagement is about engaging experts who will be responsible for implementing a strategy, while citizen and community engagement is specific to a project in response to a strategy. Both are equally critical elements of any successful PED journey [8].
As PEDs are multidisciplinary, they also offer an opportunity for social and organizational learning. Within the context of urban transformation, social and organizational learning can be conceptualised as ‘learning that takes place in social units and occurs through social interactions between actors and their environment and can lead to changes in understating attitudes and norms in individuals as well as changes in social and organizational structures both formal and informal’ [28,29]. Social learning can shape rules, norms, roles and power relations within established social groups [30] and help establish new relationships, social structures and shared identity [31,32]. A broader and lasting change will occur in the urban governance and stakeholder ecosystem if stakeholders understand procedural, organizational and social aspects of the project [33,34].

1.3. Purpose of This Paper

This paper looks at the five cities of Maia (Portugal), Reykjavik (Iceland), Kifissia (Greece), Kladno (Czech Republic) and Lviv (Ukraine) that are a part of an ongoing Horizon 2020 smart city project Sustainable Energy Positive and Zero Carbon Communities (SPARCS) [35]. The SPARCS project has two Lighthouse cCties (Espoo and Leipzig) and five Fellow Cities. Lighthouse Cities develop and test integrated innovative solutions at a district scale and act as exemplars for their region in several aspects such as building energy efficiency, maximising use of renewables, electric fleet and ICT [36]. A city can be funded as a Lighthouse City only once under the Horizon2020 program. Fellow Cities are cities that have yet to acquire the technical competence to become a Lighthouse city. However, Fellow Cities are fully involved in a project from the beginning and work actively to replicate specific solutions that have been applied in Lighthouse Cities. Participating as a Fellow City gives cities an opportunity to possibly become a Lighthouse City in the future.
This study focuses on the five Fellow cities of Maia, Reykjavik, Kladno, Kifissia and Lviv. This the first analysis of its kind as it walks through the energy transition experience of each city until now, collects information on associated challenges and provides a future outlook for each city with regard to PEDs. Table 1 shows the profile of each of the five cities. It is envisioned that the analysis will also support other European cities in evaluating their energy transition status and how to move forward in implementing PED solutions.
The paper is structured as follows: Section 1 is the introduction to energy transition and PEDs. Section 2 presents the approach and method adopted for the paper. Section 3 presents and analyses the information collected from each city, and Section 4 provides the discussion and Section 5 is conclusion of the paper.

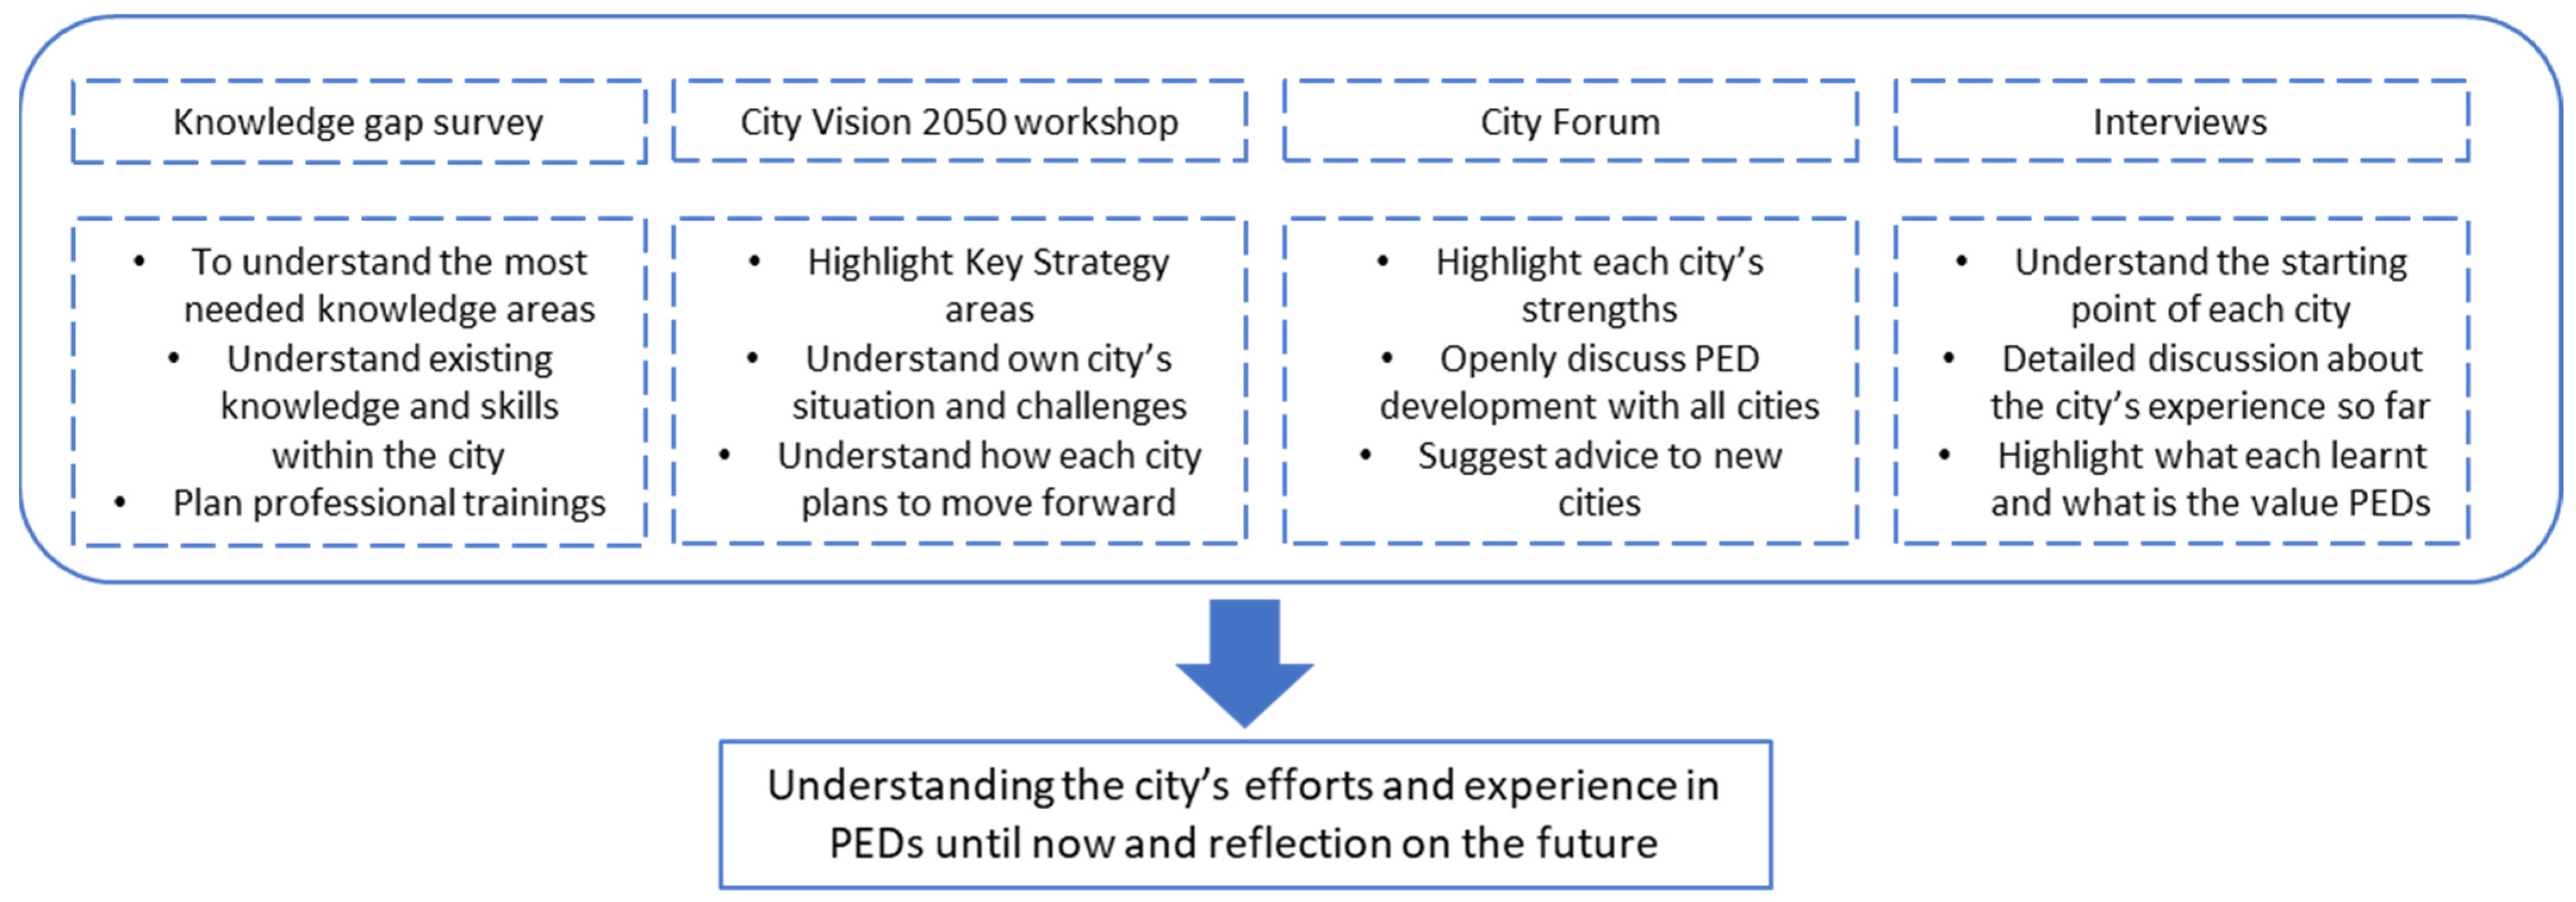
2. Materials and Methods

As the process of implementing PEDs in any city spreads over several years and demands much detailed data collection and analysis, the authors have provided a first overview of the cities in a simplified form in this paper and will be providing a deeper analysis in the papers that follow. Figure 1 shows the data collection approach adopted for the paper.

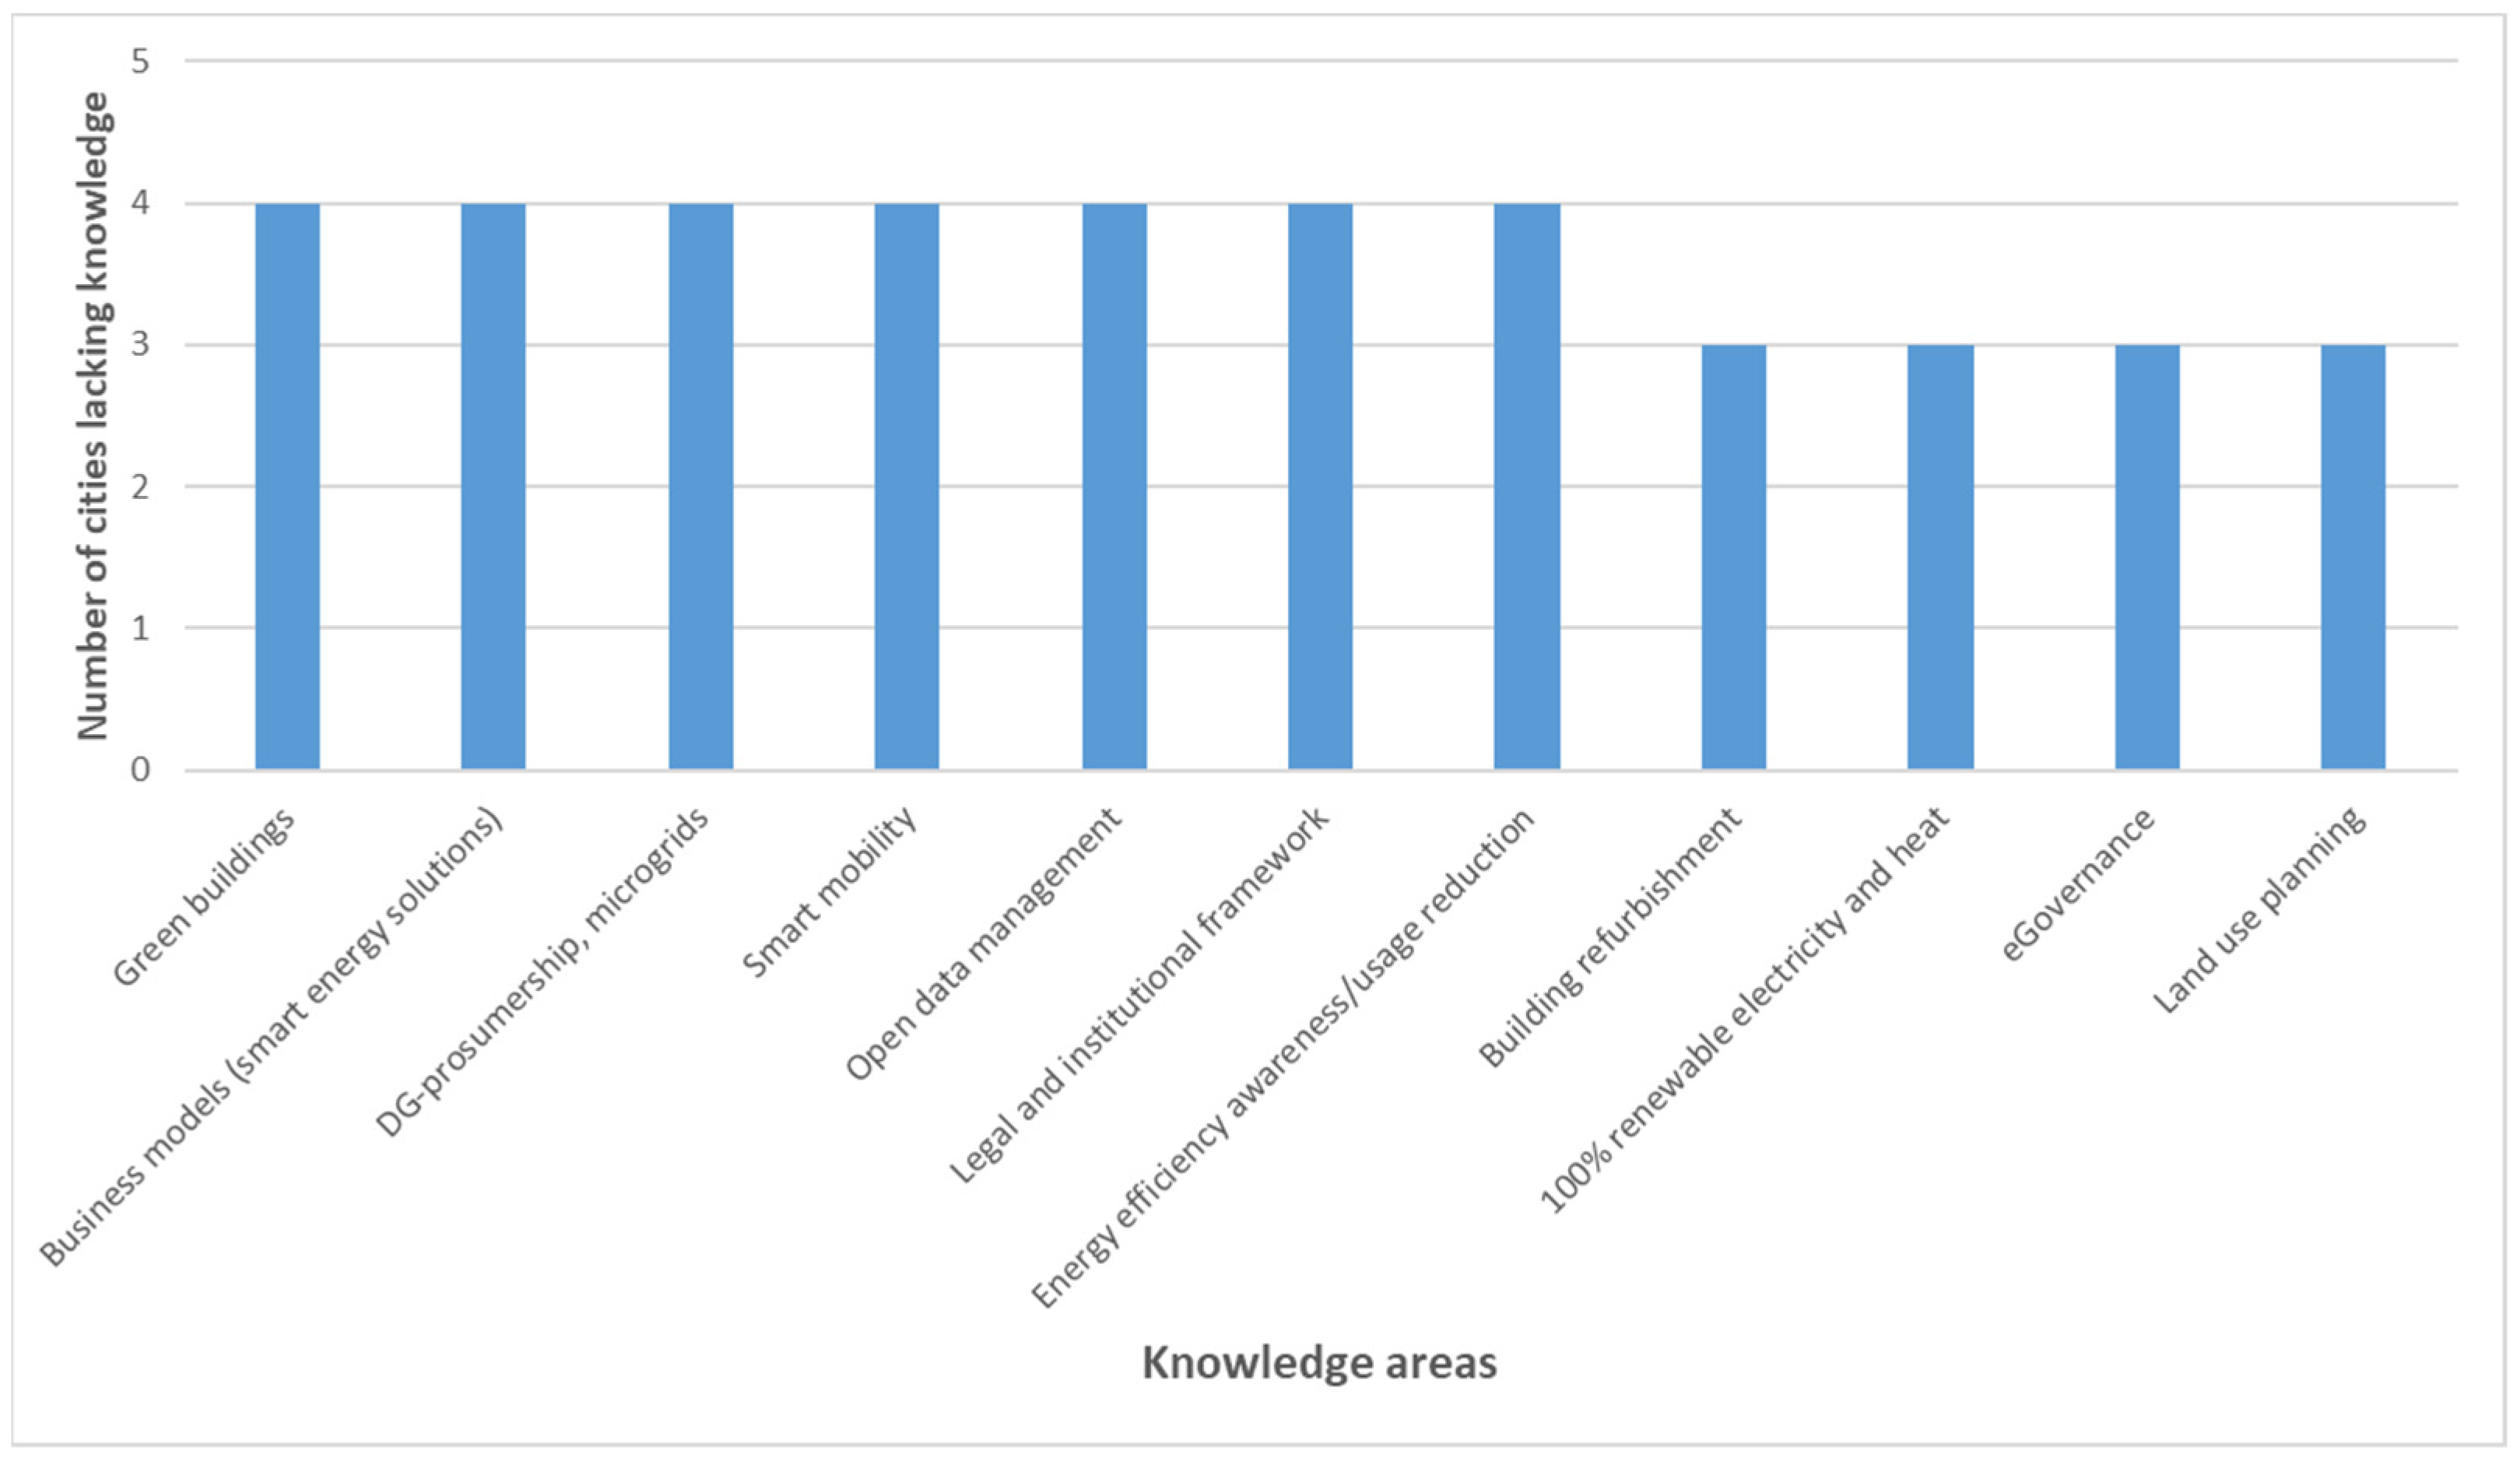
2.1. Knowledge Gap Survey

As a first step, an internal online knowledge gaps survey was conducted at the start of the project in 2019 to obtain a full picture of the initial situation in the five cities. The survey focused on technical aspects as well as topics such as data governance, innovation, business models and finance. The results served as a basis to align the needs of the five cities with the two Lighthouse Cities and also bring the missing knowledge areas to the attention of the project partners who also play the important role of providing continuous support to the cities. Table 2 illustrates some of the information collected from the cities during the survey.

2.2. City Vision 2050

The purpose of City Vision 2050 was to cover the key strategic areas such as energy and mobility as well as any associated areas and to also involve policy makers, relevant stakeholders, citizens and communities in developing a realistic vision [37]. A city vision describes how the community envisions the desired future. It expresses the community’s ideal of what it wishes to become and gives a sense of direction about where the city is headed. The city vision is used as the starting point for transformation, usually defined by political leadership based on strong participatory processes. The city vision workshops were organized in all five cities of Maia, Reykjavik, Kifissia, Kladno and Lviv as well as the two Lighthouse Cities during September–November 2020. The five cities, including the two Lighthouse cities, also received practical guidelines on how to conduct the workshop. The guidelines provided important information such as creating a schedule, forming a task force, selecting key strategic areas and defining the status quo, setting up a participatory process and conducting the city vision workshops. Depending on the city, the city vision workshop could last one day or up to two days. It was organised by every city, respectively, together with local stakeholders in their respective native language, and the cities could decide whether they wanted a remote or a physical workshop. The cities will, nonetheless, continue to update their vision throughout the project and beyond.

2.3. City Forum

City forums are an internal project event held every three months with the objective of fostering knowledge exchange between cities and technical partners. The city forum held in February 2022 was arranged and specifically adapted for the purpose of following up on PED progress in the five cities and more importantly, to let cities openly discuss related issues. This forum had more than 30 participants including city representatives and also technical partners. The forum served as a complementary method to the semi-structured interviews (Table 3).

2.4. Interviews with City Representatives

Semi-structured interviews were held with city representatives to allow a deeper insight into the complexities of PED development. The interviews were held individually with the five cities in March 2022, and they took place virtually. Since the research on these five cities is particularly novel, the sampling of the interviewees was linked to city context and setting. Hence, the interviewees were mainly city project coordinators and local partners (Table 4). Furthermore, it is relevant to note that the interview responses are from the project representative’s perspective only. The interviews are a continual of the initial knowledge gap survey conducted at the very start of the project as well as the city vision workshop.
The interview questions were categorized into three topics: energy transition, PED learnings and value and reflection and way forward (Table 5). The questions were designed to elicit simple answers and to encourage the cities to share their experiences from being part of the project so far. The categories and related questions reflect the project work done in the five cities during the past two years and also reflect the fact that as a result of participating in various project activities, the cities now have some experience to share and have more knowledge about their respective cities.

3. Results

3.1. Maia

The city of Maia is located in the northwest part of Portugal and has 134,988 inhabitants (2020) with a density total of 1640 inhabitants/km2. It is also one of the most industrialized municipalities of Portugal and an important transportation hub. The municipality of Maia started its work in the field of sustainable energy in 2012. The city of Maia made its first energy matrix in 2014 where the city analysed the current state of energy consumption in Maia. The city later developed the sustainability strategy and in 2014 the Sustainable Energy Action Plan (SEAP) that consists of a set of technical measures, planned to be applied between 2015 and 2025. One of the goals of the city is to promote a change in citizens’ habits and behaviours as well as to apply specific strategies against actions resulting in a lower degree of energy waste and energy inefficiency. In Maia, energy efficiency is thought to be achieved through various measures focusing on service and residential buildings, the transport sector and public lighting. The city strives to create favourable conditions for significant energy efficiency policy development by increasing its energy efficiency and reducing energy use by 30% until 2020, 35% by 2030 and 45% by 2050. In addition, the city has planned to retrofit its older buildings and to increase the production of energy through PV. However, the city wishes to integrate all the policy documents instead of having separate documents to have a faster approach for energy transition. Also, despite having an energy and mobility division, the city claims there is a lack of qualified personnel. Other obstacles include acquiring relevant energy data from stakeholders, lack of interest of residents in sustainable behaviour, access to the best technology, regulatory barriers and an unpromising overall economic outlook which leads to a lack of financial resources for energy efforts. These obstacles lead to difficulties in planning and in communication with stakeholders, further delaying the work. It also happens very often that the decisions for the city of Maia are made ‘together’ with other municipalities which often does not create favourable circumstances for the city of Maia. Working in developing PEDs has nonetheless given an opportunity to learn how to scale up solutions and led to deeper discussions with city officials.

3.2. Reykjavik

The city of Reykjavik is the northernmost capital in the world. It has 131,136 inhabitants and a population density of 480 people/km2. Reykjavik is one of the cloudiest and coldest capitals of any nation in the world. It meets all of its electricity and heating needs from renewable sources (hydro 71% and geothermal 29%). Reykjavik is also the principal owner of Reykjavik Energy and subsidiaries who generate and distribute energy, water and waste in the capital as well as owning and operating the city’s ICT grid. Reykjavik was the first municipality in Iceland to make a policy on the reduction of greenhouse gas emissions in 2009. Among the city’s strategic plans targeting climate and sustainability issues is the Reykjavik Municipal Plan 2010–2030. Approved in 2014, it aims for a 35% reduction in greenhouse gas emissions by 2030 from 2007 and a 73% reduction by 2050. At the moment, approximately 80% of the houses are currently heated with geothermal energy. Production of electricity from wind will most likely grow in coming years following the rapid decline of cost, but it is unlikely that PV will play a large role because of how far north Iceland is positioned and because of the abundance of natural resources that allows it to produce electricity and heating very cheaply. However, the transport and housing sectors have not received much focus. The housing sector in particular requires much attention as the city must think of ‘sustainable housing’ from scratch. Transport is the biggest emission producer as residents are very much dependent on cars. The share of public transport such as buses is only 8%, and other methods of commuting such as walking or biking are only 19%. While the city witnessed a surge in electric vehicles, a new concern is to sustain, develop and maintain the infrastructure to support the rise in electric vehicles. Nonetheless, the city has provided several initiatives for supporting electric vehicles; for example, residents can apply for funding to have a charging station near their home.

3.3. Kladno

Kladno is a city in the Czech Republic with 69,000 inhabitants and a population density of 1852 inhabitants/km2. It is located 25 km from the Czech capital city of Prague and often suffers from the “sleep over city problem’’ as a stop on the way to the metropolitan area. The municipality aims to raise Kladno’s attractiveness and create its own set of niche-strengths. An existing good example is the e-bike sharing scheme at which Kladno is the forerunner in the Czech Republic (first municipality in the country to start e-bike sharing in 2018). Kladno has several strategic documents in different stages of development: an already agreed Strategy of Sustainable Development 2014–2020, the SECAP as a result of the SPARCS project activities, a sustainable mobility plan is currently being finalized, and the Program for Regional Development 2014–2020 is already in place. Nonetheless, the SPARCS project was the starting point of energy discussion in Kladno. There were earlier discussions, but it was not connected to the overall strategy goal. At the moment, the project activities are also supported by the pressure from the EU and the Green Deal which create a much more encouraging environment. Since the use of coal is banned in Europe from 2030 onwards, the country has to rethink energy supply, and this supports the development of PEDs. However, the city still faces the obstacle related to bureaucracy. It is challenging to persuade stakeholders as they lack time, or they may or may not be interested in energy efficiency. Often, there are only a limited number of people within the municipality who push for energy efficiency. The rest continue to have a ‘business as usual’ attitude towards construction and energy-related topics. The city of Kladno feels it must maintain the energy efficiency enthusiasm generated by SPARCS and continue it with future projects as much as possible because once the city’s participation in SPARCS ends, then all other energy efforts also come to a halt.

3.4. Kifissia

Kifissia is a municipality in northern Athens in Greece with 71,259 citizens and a population density of 2095.85 person/km2. Kifissia is situated 12 km northeast of Athens city centre and is the head of the regional Northern Sector which consists of an agglomeration of 12 municipalities. The city is characterized by a Mediterranean climate with cool summers compared to Athens centres. The city adopted SEAP in 2015 and simultaneously the Sustainable Urban Mobility Plan (SUMP). Moreover, the activities included in the subsequent action plan ultimately aim at improving social and economic well-being of inhabitants while enhancing the local economy and employment conditions as side impacts of the energy and environment-relevant interventions. Nonetheless, the city of Kifissia is in the early stages of energy transition, where most of the building stock was built in the 1980s and 1990s. Therefore, the buildings are not aligned with energy efficiency regulations. The transport sector also comprises traditional cars that use fuel. The city, nonetheless, has some plans for incorporating geothermal and solar PV into buildings. The first feasibility study for electric vehicles has also been conducted. The major problem in the city is bureaucracy, as many departments need to be involved for paperwork and approvals. In general, the city must push for a change in its energy culture since at the moment the residents have ‘non-energy efficient behaviour’.

3.5. Lviv

Lviv, located in western Ukraine, is an ever-growing city of ca 758,000 inhabitants with the population density that totals 4390 people/km2. Over 100,000 citizens living in the suburbs commute daily to study and work in the city. The greater Lviv agglomeration has approximately 1,229,000 inhabitants. In 2011, the Lviv city council approved the “Program of Sustainable Energy Development in Lviv by 2020” (SEAP). Its main goals included a reduction of CO2 emissions and energy consumption (both by 20%) and an increased share of renewables in city energy balance (20% by 2020). Preparation of the new plan is in progress. The city also has a green city action plan and an integrated urban development concept that emphasize e-mobility and renewable energy. The city is a working environment for 25% of all Ukrainian ICT specialists, and the IT sector is continuously attracting new businesses and professionals. A vivid start-up culture has emerged around the Lviv ICT cluster. That, in turn, poses a great opportunity for further development of the city set within a strong local innovation ecosystem. Energy efficiency efforts, nonetheless, are very dependent on the municipal leaders. The housing in the city is very old and requires refurbishment. Certain areas of the city are known as ‘sleeping districts’ in which the buildings date to the Soviet Union times, and these areas are not serving any function except being housing areas. The city believes that with the help from SPARCS, the city could be rejuvenated. The key problem for the city is to attract investment as very often the investors look for cities that are in a slightly better condition. In addition, 30% of the building residents are older people who cannot co-finance the energy refurbishment of the building which causes the work to halt. The city is also dependent on importing natural gas from other European countries which often does not have a direct line of supply, therefore increasing the price for the municipalities. This is also one of the reasons that there is minimum expenditure on energy efficiency.
Analysing the five cities in various steps revealed interesting similarities, despite each city being located in a different geographical location and having different starting points for energy transition. Figure 2 illustrates the top 11 identified knowledge gaps that were mentioned the most and selected by at least three cities based on the knowledge gap survey. A complete list of 64 knowledge gaps is provided in Appendix A. This helped with planning further project activities such as webinars and training sessions to support the five cities in the best way possible, as elaborated upon in the next section. In addition, during the city forum, the five cities described what they would like to learn from the other four cities, and this included electric vehicles and charging behaviour, digital platforms and data management.
Table 6 displays the challenges that the five cities are currently resolving to ease the implementation of PEDs. The existing challenges were highlighted during the city vision workshops, the city forum and were also raised during the interviews. To allow for a better understanding, the categories for challenges were selected based on studies conducted by [8,17,20].
An additional result of the city vision workshop was to highlight the key strategy areas in each of the five cities (Table 7). By identifying areas of focus, the cities were able to direct their project effort more strongly and at the same time bring together the various departments within the city to discuss common goals and avoid working in silos. In addition, the identification of local challenges also enabled better identification of key strategy areas. Each city chose the key strategy areas depending on their local context; however, it can be said that each of the strategy areas are also relevant for the other four cities as the goal for climate neutrality and to meet PED requirements is the same for all cities. All city activities, whether they result in an immediate or long-term result, lead to some learning and experiences. Table 8 shows each city’s learnings from PEDs and the added value of PEDs.

3.6. Limitations of the Research

The implementation of PEDs is a long process within a city. The authors recognize that a full picture of each city’s progress and work completed in every aspect would provide a better understanding; however, this is beyond the scope of the paper. The authors aimed to provide a simplified picture of the current status quo and also highlight how each city is currently moving forward with PEDs. With regard to replication, the five cities are currently going through intensive project development which aims to support them in scoping up to two projects. For this purpose, the cities and partners are in the process of creating extensive implementation plans, discussing with stakeholders, and securing investments. Further papers will follow to explain the implementation process in more detail and the selected solutions for replication.

4. Discussion

As many of the PED projects across Europe and beyond are still in the implementation or planning phase, there is no comprehensive set of reference points and knowledge set, as highlighted by several previous studies [14,17,20]. Evidence also shows that PEDs demand a deep understanding of the cities’ local conditions, policies, priorities, strategies, resources and solutions [38]. It has to be recognized that each city is different [14,39] and has varying internal situations in terms of governance, stakeholder relationships and institutional support mechanisms [4]. This paper focused on the five cities of Maia, Reykjavik, Kladno, Kifissia and Lviv and their journey of energy transition as they try to replicate and implement PED solutions. The paper highlighted how each city began energy transition, the associated challenges that the cities face, learning acquired during the progress and what has been the value of PEDs so far for each city.
By engaging the cities in surveys and internal discussions, it became clear what the current knowledge gaps were, the current attitudes for energy transition and the overall situation in the city. The knowledge gap survey revealed 63 areas that the cities needed help with regarding PEDs. In addition, the top 11 knowledge gap areas that at least three cities selected include: (1) green buildings, (2) business models, (3) microgrids, (4) smart mobility, (5) open data management, (6) legal and institutional framework, (7) energy efficiency awareness/usage reduction, (8) building refurbishment, (9) renewable electricity and heat, (10) eGovernance and (11) land use planning.
It is beyond the scope of any city to resolve local challenges. Nonetheless, as claimed by several authors in previous studies [17,20,22,23,24], the main challenges in the city revolve around governance, technology, funding and community/stakeholders interest. These were evident in the analysis for Maia, Reykjavik, Kladno, Kifissia and Lviv (Table 6). A clear understanding of PED is an ongoing challenge for all cities. In addition, difficulties caused due to legislation and bureaucracy are inherent in most of the cities. Lack of qualified personnel and adequate technical expertise were also cited by the cities. Educating the community and maintaining and aligning stakeholder interest in energy efficiency is also a concern. Additional challenges included unclear national energy policies, different starting points of each city, diverse technology maturity of the territory, difference in timing of local city agenda and SPARCS timeline, and lack of political support.
The City Vision 2050 was the first step in triggering wider and deeper urban transformation efforts. Although it will be continuously updated by the cities in the years to come, it will act as a point of reference for the cities. City vision brought awareness of the city as a whole, and this will not only support current decision making, but it is expected that the impact will go far beyond the project to influence future decisions, strategic options and investments. Furthermore, city vision has a direct influence on project development in Fellow Cities that aims to replicate chosen solutions in the next two years. With the help of the City Vision 2050 workshop, the cities were able to identify key strategy areas that they could improve and work upon in the coming years (Table 7). All five cities chose mobility as a key area. Green energy was also selected by all cities, excluding Reykjavik as it is already a leader in renewable energy. Spatial development, digital services, citizen education and circular economy also received considerable focus. However, energy efficient buildings were highlighted as a key area by only three cities.
The five cities have been supported from the start and will continue to receive support to help them as much as possible in their PED replication efforts. The following explains how the five cities have been supported to improve knowledge and expertise.
Packaged Solutions: To support the five cities in gaining technical knowledge, a set of information packages based on cases from the two Lighthouse Cities was formulated. There were 10 packaged solutions that included topics such as smart microgrid, virtual power plant, smart home systems and electric bus systems to help to serve as a building block in cities. Each city can utilize and adapt the packages depending on the local circumstances and need. In addition, each packaged solution was organized in a structure format such as benefits, functions, relevant business models and financing options and technological options. The solutions have been made available online through the BABLE platform to also have information available beyond the lifetime of the project.
Webinars and workshops: Based on the knowledge gap survey, a series of webinars and workshops were organized for the five cities in collaboration with the Lighthouse Cities. The goal was to enrich understanding as much as possible for the five cities. In total there were seven webinars and seven workshops that were organized. The webinar topics included governance models, citizen participation and introduction to some of the packaged solutions. The workshop topics included green building and retrofitting, mobility and e-charging and urban data.
Professional Training: The project also organized a six-month professional training for the five cities where each city nominated up to four people to receive the training. The training was to create and promote certified European smart city managers with a focus on urban energy. The courses comprised distance learning modules and aimed to go beyond the insights and expertise gained within SPARCS while also including best-practice knowledge in the field of smart city developments.
The cities have a long way to go before the goal to become climate-neutral is achieved. During further discussions, the cities also highlighted what they learned from their experience so far and how beneficial the PED related work has been to them so far. The cities claimed that translating knowledge to reality is much more difficult than expected. As part of developing PEDs, the cities also became aware that they need more technical knowledge, have to involve citizens more vigorously and must continuously collaborate with other cities across Europe to enrich their knowledge further and have opportunities to develop and implement PED solutions.
With regard to benefits of PEDs, it made the cities realize that all public sectors have to be connected and must develop in parallel, as seen in the case of Reykjavik where the energy sector developed massively over the last years, but the transport and housing sector have not advanced at the same pace. In addition, the cities claimed that City Vision 2050 will boost the existing city agendas and that the workshop brought together many departments which will help in working together in the future. Moreover, in some cities, for example in Kladno and Lviv, the stakeholders have shown a renewed interest in PEDs as compared to the lack of support at the start of the project work.
When the cities were asked what they would do differently if they had another chance, most of the cities claimed that they wished they had started the energy efficiency efforts earlier, such as having fewer private cars. Other changes could include reorganizing the energy sector, having more incentives, more funding opportunities, running all sectors in parallel and eliminating all administrative and bureaucratic issues. Nevertheless, as a result of the project activities and initiation efforts of the city, the city of Kifissia is also installing its first public PV systems on two school terraces and wishes to include it as part of an energy community. Moreover, the city of Lviv will be looking into procuring e-bikes and improving the existing transport to help avoid the use of private cars, while the city of Maia is closely working with the local energy company for the first time.
While it is beyond the scope of a city to completely eliminate obstacles, it may be possible for a city to be prepared well in advance. As recommendations to new cities that plan to embark on a PED transition journey, Table 9 illustrates the checkpoints that a new city should refer to, based on the experiences of Maia, Reykjavik, Kladno, Kifissia and Lviv. The recommendations are given in an order starting from acquiring thorough knowledge about the city’s circumstances, expertise and regulations and walking through other essential items such as exploring all funding options, being aware of available human resources, collaborating with political leaders from the start, and being in continuous communication with other European cities.

5. Conclusions

Despite the ongoing and long-lasting challenges, the five Fellow Cities agreed that being involved in a Horizon 2020 project provided awareness and momentum to the public and official body. In this sense, all cities have reported the added value of bringing a wider range of stakeholders on-board and starting a conversation on the importance of the energy transition in their cities as a result of the project.
It is well acknowledged that managing all the aspects of a smart city often lies beyond the capabilities of the city authorities. Furthermore, experiences and previous lessons are often not disseminated to the larger audience to improve learning and knowledge [4]. Accordingly, new and innovative forms of governance are needed in which various stakeholders, including citizens, could participate and influence the planning and decision-making process, development of initiatives and collaboratively address problems and set future priorities [20]. Successful replication demands appropriate strategies, procurement of technical solutions, integration of all city sectors, new business models and collaboration with the private sector and citizens [8].
This paper was a starting point to disseminate learnings and experiences during the PED replication in the five Fellow Cities of Maia, Reykjavik, Kladno, Kifissia and Lviv. The authors hope that this paper could provide a first overview to a new city embarking on the PED journey. Future research will analyse the project development in each city to replicate specific PED solutions and to support the cities’ efforts to become Lighthouse Cities in the coming years.

Author Contributions

Conceptualization, Z.F.; methodology, Z.F. and K.S.; writing—original draft preparation, Z.F., K.S., T.V. and R.Q.; writing—review and editing, Z.F. All authors have read and agreed to the published version of the manuscript.

Funding

This research was funded by SPARCS, grant number 864242, and the APC was funded by SPARCS.

Institutional Review Board Statement

Ethical review and approval were waived for this study, as Technical Research Centre of Finland (VTT) follows the TENK guidelines which exempts the paper from requiring an ethical review and approval. https://tenk.fi/en/ethical-review/ethical-review-human-sciences (accessed on 14 March 2022).

Informed Consent Statement

Informed consent was obtained from all subjects involved in the study.

Data Availability Statement

Not applicable.

Acknowledgments

We are deeply grateful to the SPARCS city representatives from city of Maia, Reykjavik, Kladno, Kifissia, and Lviv for their valuable time and providing a very thorough overview of the city’s energy transition journey. We also want to thank our project colleagues from FHG, BABLE and SPI in supporting us with information regarding the five cities.

Conflicts of Interest

The authors declare no conflict of interest.

Appendix A

Table A1. Complete list of knowledge gaps identified by the five cities related to PEDs.
CategoryKnowledge AreaNumber of Cities Lacking Knowledge
Building/infrastructureGreen buildings4
Building refurbishment3
Efficiency upgrades in historic districts/general retrofitting2
Life cycle consideration of construction waste1
Energy performance certification (implementation)1
Thermal insulation and passive energy efficiency improvement1
FinanceBusiness models (smart energy solutions)4
Public–private partnerships, investment, cooperation2
Economic modeling of PED/smart cities1
Proving financial viability1
Demand and distributionSmart metering2
EV integration (data-driven)/bidirectional charging/V2G2
Load management/electricity distribution1
Demand-side management1
Flexible hydrogen production…1
Predicting demand/load patterns1
Energy independence versus distribution system investment1
Energy productionDG-prosumership, microgrids4
100% renewable electricity and heat3
Photovoltaics (PV)2
District heating1
PED planning and function overview2
Wind1
Energy storage systems1
Exploring RES potential1
Waste CHP (specifically carbon-neutral)1
MobilitySmart mobility4
Multimodal/active transit2
EV uptake strategies2
Public EV charging2
Public transit investment2
Bike infrastructure1
Shared mobility1
Changing charging behaviour1
Increasing share of foot/bike/public transit trips1
DataOpen data management4
Modeling tools for planning1
Kera 5G/city and regional 5G legal implications1
Data integration1
Calculating energy balance of PED1
Artificial Intelligence/IoT1
Smart monitoring system1
Energy burden modeling of buildings/city level1
Efficiency increases in public transit1
Interoperable and integrated data platform1
PED impact assessment1
GovernanceLegal and institutional framework4
eGovernance3
Land use planning3
Smart city policies2
Coordinating with regional/national reform/regulation2
Knowledge of national policy in energy, renewables, and building efficiency1
Project management unit for energy and sustainability1
General public sector (utilities, etc.) development1
Post-communist innovation process1
Circular economy policies1
Stakeholder management1
Increasing R&D capacity, innovation potential1
Smart city management structure1
Public engagementEnergy efficiency awareness/usage reduction4
Industry efficiency/engagement2
Workshops and online surveys1
Focus groups1
Water consumption and rainwater collection1

References

  1. International Energy Agency. Energy Transitions Tracking Progress in Clean Energy Transitions through Key Indicators across Fuels and Technologies. 2021. Available online: https://www.iea.org/topics/energy-transitions (accessed on 15 January 2022).
  2. European Commission. 100 Climate-Neutral Cities by 2030—By and for the Citizens: INTERIM Report of the Mission Board for Climate-Neutral and Smart Cities; Publications Office of the European Union: Luxembourg, 2020. [Google Scholar] [CrossRef]
  3. Amores, A.; Álvarez, L.; Chico, J.; Ramajo, G.; Azabal, I.; Urgel, J.M. The Future of Sustainable Cities: Urban Energy Transition to 2030. 2019. Available online: https://www2.deloitte.com/eg/en/pages/energy-and-resources/articles/future-of-sustainable-cities-urban-energy-transition-to-2030.html (accessed on 20 February 2022).
  4. OECD. Managing Environmental and Energy Transitions for Regions and Cities. 2020. Available online: https://www.oecd-ilibrary.org/urban-rural-and-regional-development/managing-environmental-and-energy-transitions-for-regions-and-cities_f0c6621f-en (accessed on 20 February 2022).
  5. The United Nations. The New Urban Agenda. 2016. Available online: https://habitat3.org/the-new-urban-agenda/ (accessed on 22 January 2022).
  6. Pulselli, R.M.; Broersma, S.; Martin, C.L.; Keeffe, G.; Bastianoni, S.; van den Dobbelsteen, A. Future city visions. The energy transition towards carbon-neutrality: Lessons learned from the case of Roeselare, Belgium. Renew. Sustain. Energy Rev. 2021, 137, 110612. [Google Scholar] [CrossRef]
  7. UN Department of Economic and Social Affairs. 68% of the World Population Projected to Live in Urban Areas by 2050, Says UN. 2018. Available online: https://www.un.org/development/desa/en/news/population/2018-revision-of-world-urbanization-prospects.html (accessed on 15 January 2022).
  8. Ferrer, J.N.; Taranic, I.; Veum, K.; van den Oosterkamp, P.; Wilson, C. The Making of a Smart City: Replication and Scale-Up of Innovation in Europe. 2017. Available online: https://smart-cities-marketplace.ec.europa.eu/insights/publications/making-smart-city-replication-and-scale-innovation-europe (accessed on 10 March 2022).
  9. Fatima, Z.; Pollmer, U.; Santala, S.-S.; Kontu, K.; Ticklen, M. Citizens and Positive Energy Districts: Are Espoo and Leipzig Ready for PEDs? Buildings 2021, 11, 102. [Google Scholar] [CrossRef]
  10. European Commission. Urban Agenda for the EU. 2016. Available online: https://ec.europa.eu/regional_policy/en/policy/themes/urban-development/agenda/#:~:text=The%20Urban%20Agenda%20for%20the%20EU%20is%20an%20integrated%20and,of%20life%20in%20urban%20areas (accessed on 20 February 2022).
  11. JPI Urban Europe/SET Plan Action 3.2. White Paper on PED Reference Framework for Positive Energy Districts and Neighbourhoods. 2020. Available online: https://jpi-urbaneurope.eu/ped/ (accessed on 20 February 2022).
  12. Derkenbaeva, E.; Vega, S.H.; Hofstede, G.J.; van Leeuwen, E. Positive energy districts: Mainstreaming energy transition in urban areas. Renew. Sustain. Energy Rev. 2022, 153, 111782. [Google Scholar] [CrossRef]
  13. Wyckmans, A.; Karatzoudi, K.; Brigg, D.; Ahlers, D. D9.5: Report on Attendance at Events Held by Other SCC-01 Co-Ordinators 2. 2018. Available online: https://cityxchange.eu/wp-content/uploads/2019/11/D9.5_Report-on-Attendance-at-events-held-by-other-SCC-01-co-ordinators2.pdf (accessed on 18 January 2022).
  14. Lindholm, O.; Rehman, H.U.; Reda, F. Positioning Positive Energy Districts in European Cities. Buildings 2021, 11, 19. [Google Scholar] [CrossRef]
  15. Lavikka, R.; Rehman, H.U.; Reda, F.; Kazi, A.S. Positive Energy Buildings; Springer: Cham, Switzerland, 2022. [Google Scholar] [CrossRef]
  16. Hukkalainen, M.; Reda, F.; Klobut, K. Positive Energy District: Ad New Puzzle Piece for Cities’ Energy Transformation. 2021. Available online: https://cris.vtt.fi/en/publications/positive-energy-district-a-new-puzzle-piece-for-cities-energy-tra (accessed on 25 February 2022).
  17. Zhang, X.; Penaka, S.R.; Giriraj, S.; Sánchez, M.N.; Civiero, P.; Vandevyvere, H. Characterizing Positive Energy District (PED) through a Preliminary Review of 60 Existing Projects in Europe. Buildings 2021, 11, 318. [Google Scholar] [CrossRef]
  18. Raworth, K. Doughnut Economics: Seven Ways to Think Like a 21st-Century Economist; Chelsea Green Publishing: White River Junction, VT, USA, 2017. [Google Scholar]
  19. Bale, C.S.E.; Varga, L.; Foxon, T.J. Energy and complexity: New ways forward. Appl. Energy 2015, 138, 150–159. [Google Scholar] [CrossRef] [Green Version]
  20. Krangsås, S.G.; Steemers, K.; Konstantinou, T.; Soutullo, S.; Liu, M.; Giancola, E.; Prebreza, B.; Ashrafian, T.; Murauskaitė, L.; Maas, N. Positive Energy Districts: Identifying Challenges and Interdependencies. Sustainability 2021, 13, 10551. [Google Scholar] [CrossRef]
  21. Mihailova, D.; Schubert, I.; Martinez-Cruz, A.L.; Hearn, A.X.; Sohre, A. Preferences for configurations of Positive Energy Districts—Insights from a discrete choice experiment on Swiss households. Energy Policy 2022, 163, 112824. [Google Scholar] [CrossRef]
  22. Good, N.; Ceseña, E.A.M.; Mancarella, P.; Monti, A.; Pesch, D.; Ellis, K.A. Barriers, Challenges, and Recommendations Related to Development of Energy Positive Neighborhoods and Smart Energy Districts. In Energy Positive Neighborhoods and Smart Energy Districts: Methods, Tools, and Experiences from the Field; Academic Press: Aachen, Germany, 2017; pp. 251–274. [Google Scholar]
  23. Bossi, S.; Gollner, C.; Theierling, S. Towards 100 Positive Energy Districts in Europe: Preliminary Data Analysis of 61 European Cases. Energies 2020, 13, 6083. [Google Scholar] [CrossRef]
  24. Sareen, S.; Albert-Seifried, V.; Aelenei, L.; Reda, F.; Etminan, G.; Andreucci, M.-B.; Kuzmic, M.; Maas, N.; Seco, O.; Civiero, P.; et al. Ten questions concerning positive energy districts. Build. Environ. 2022, 216, 109017. [Google Scholar] [CrossRef]
  25. Uspenskaia, D.; Specht, K.; Kondziella, H.; Bruckner, T. Challenges and Barriers for Net-Zero/Positive Energy Buildings and Districts—Empirical Evidence from the Smart City Project SPARCS. Buildings 2021, 11, 78. [Google Scholar] [CrossRef]
  26. Rehman, H.U.; Hasan, A.; Reda, F. Challenges in reaching positive energy building level in apartment buildings in the Nordic climate: A techno-economic analysis. Energy Build. 2022, 262, 111991. [Google Scholar] [CrossRef]
  27. Magrini, A.; Lentini, G.; Cuman, S.; Bodrato, A.; Marenco, L. From nearly zero energy buildings (NZEB) to positive energy buildings (PEB): The next challenge—The most recent European trends with some notes on the energy analysis of a forerunner PEB example. Dev. Built Environ. 2020, 3, 100019. [Google Scholar] [CrossRef]
  28. Pahl-Wostl, C.; Mostert, E.; Tabara, D. The Growing Importance of Social Learning in Water Resources Management and Sustainability Science. Ecol. Soc. 2008, 13, 24. [Google Scholar] [CrossRef] [Green Version]
  29. Ison, R.; Watson, D. Illuminating the Possibilities for Social Learning in the Management of Scotland’s Water. Ecol. Soc. 2007, 12, 21. [Google Scholar] [CrossRef]
  30. Rist, S.; Chidambaranathan, M.; Escobar, C.; Wiesmann, U.; Zimmermann, A. Moving from sustainable management to sustainable governance of natural resources: The role of social learning processes in rural India, Bolivia and Mali. J. Rural Stud. 2007, 23, 23–37. [Google Scholar] [CrossRef]
  31. Lave, J.; Wenger, E. Situated Learning: Legitimate Peripheral Participation; Cambridge University Press: Cambridge, UK, 1991. [Google Scholar]
  32. Brown, J.S.; Duguid, P. Organizational Learning and Communities-of-Practice: Toward a Unified View of Working, Learning, and Innovation. Organ. Sci. 1991, 2, 40–57. [Google Scholar] [CrossRef]
  33. Bögel, P.; Pereverza, K.; Upham, P.; Kordas, O. Linking socio-technical transition studies and organisational change management: Steps towards an integrative, multi-scale heuristic. J. Clean. Prod. 2019, 232, 359–368. [Google Scholar] [CrossRef]
  34. Evans, J. Governing Cities for Sustainability: A Research Agenda and Invitation. Front. Sustain. Cities 2019, 1, 2. [Google Scholar] [CrossRef] [Green Version]
  35. SPARCS. H2020 SPARCS Project. Available online: https://www.sparcs.info/ (accessed on 1 February 2022).
  36. EU Commission. Smart Cities and Communities Lighthouse Projects. 2016. Available online: https://cordis.europa.eu/programme/id/H2020_SCC-1-2016-2017 (accessed on 1 February 2022).
  37. SPARCS. D1.11 City Vision 2050—Draft. 2021. Available online: https://www.sparcs.info/index.php/about/deliverables/d111-city-vision-2050-draft (accessed on 25 March 2022).
  38. Aghamolaei, R.; Shamsi, M.H.; Tahsildoost, M.; O’Donnell, J. Review of district-scale energy performance analysis: Outlooks towards holistic urban frameworks. Sustain. Cities Soc. 2018, 41, 252–264. [Google Scholar] [CrossRef]
  39. Kammen, D.M.; Sunter, D.A. City-integrated renewable energy for urban sustainability. Science 2016, 352, 922–928. [Google Scholar] [CrossRef] [Green Version]
Figure 1. Schematic diagram of the research materials and methods.
Sustainability 14 05799 g001
Figure 2. Top 12 knowledge areas that the cities require support with based on the knowledge gap survey.
Sustainability 14 05799 g002
Table 1. Profile of the five cities based on project information and the study by Uspenskaia [25].
MaiaReykjavikKladnoKifissiaLviv
Climate (Köppen–Geiger system)Warm and temperate (Csb)Marine West Coast Climate (Cfc) Warm and temperate (Cfb)Mediterranean climate (Cfa)Humid continental (Dfb)
Share of energy demand covered by RES (% of end energy demand)26.51001.82--
Share of electricity demand generated by RES (% of electricity demand)451002.05--
Renewable energy sources in useHydro, wind, solarHydro, geothermalSolar, partially hydro and wind--
Other sources of energyNatural gas, oilNoneCoal, natural gasCoal, natural gas, oilNatural gas (heating)
Note for Maia: % of RES in use in Maia depends on the national electricity production (and import) infrastructure. The values fluctuate in time and the current value is an approximate. Note for Kifissia: Kifissia does not own any RES production. The first public PV systems are being established through SPARCS. Note for Lviv: Lviv does not have RES production itself. The city is a part of the united energy system of Ukraine, and it is not possible to get information for Lviv separately, however, Lviv does provide heating using natural gas.
Table 2. Topics covered in the knowledge gap survey and example questions asked.
Examples Questions in the Survey
Knowledge Exchange Questions
  • What do you expect from the Knowledge exchange?
  • Is your city interested in knowledge transfer (webinars/workshops) regarding smart grids/distributed energy generation?
  • Is your city interested in knowledge transfer (webinars/workshops) regarding open data management?
City Vision and Civic Engagement
  • Has a city vision been developed in your city before?
  • Does your municipality have a unit dedicated to project management regarding energy and sustainability?
  • How do you think the local construction industry is responding to sustainability and energy challenges?
Table 3. City forum questions.
What challenges are you facing in your city regarding PEDs?
What do you wish to learn from other cities?
What is your advice to a new a city that wants to plan PEDs?
Table 4. City representatives interviewed.
Interviewees
MaiaSPARCS project coordinator—City of Maia (1)
Technical experts—City of Maia (1), EDP NEW (1), Porto Energy Agency (2)
ReykjavikSPARCS project coordinator—City of Reykjavik (1)
Technical expert—Reykjavik Energy (1)
KladnoSPARCS project coordinator—City of Kladno (1)
KifissiaSPARCS project coordinator—City of Kifissia (1)
Deputy Mayor (1)
LvivSPARCS project coordinator—City of Lviv (1)
Table 5. Research questions for direct semi-structured interviews.
TopicsInterview Questions
Energy transitionHow would you describe your energy transition efforts? For example, the starting point and where you are now.
PED learnings and value
(a)
What were your learnings during the work?
(b)
What was the added value of PED development?
Reflection and way forwardWhat would you do differently, if you could, to change or improve energy transition in your city?
Table 6. Existing PED challenges in Maia, Reykjavik (REK), Kladno (KLD), Kifissia (KFS) and Lviv.
CategoriesLocal Challenges in the Five CitiesMaiaREKKLDKFSLviv
GovernanceUnderstanding the PED definition and conceptxxxxx
Legislation, regulations and bureaucracyx xxx
Political priorities xx x
Lack of leadership in energy sector x
Weak cooperation between municipality and private service providers xx
Lack of communication and capacity and high individualism x
TechnologyUnderstanding of technologies (PV, BIPV) and technical implementationx
EV charging stationsx
Data availability and usex
Energy infrastructure to maintain load from e-charging x
Energy calculations on housing x
Replicating solutions in a given timeframe x
Lack of trust in new “innovative” solutions x
Low awareness about current technologies for energy modernization and RES potential x
Availability of areas for RES installations x
Lack of access to the best technologyx
Lack of qualified personnelx x
Continuous source of energy supply x x
Financial and economicHigh energy prices x x
Business as usual attitude x
High dependency on private energy companies x
Uncertainty: COVID, war, economic crisis x
Limited financial resources in municipal budgetx xxx
Social and culturalStakeholder engagement (who to involve and how)x x
Citizen engagement and commitment x
EnvironmentalBehaviour of citizens (non-energy efficient lifestyle) x
Heavy use of private cars x xx
Heat island effect, flooding, air quality x
Water and waste management x x
Table 7. Key strategy areas identified through the City Vision 2050.
MaiaReykjavikKladnoKifissiaLviv
Spatial Developmentx xxx
Mobilityxxxxx
Efficient buildings and materialsx xx
Green energyx xxx
Digital networks and eServicesx xx
Citizen Education and Participationxxx
Circular Economy (waste management etc.)xx xx
Nature-based solutionsx x
Table 8. Learnings and added value from PEDs.
MaiaREKKLDKFSLviv
Learnings from PED developmentScaling up of solutions
Understanding the concept of PEDs
Realization that the city needs more technical knowledge
Better know-how about the city situation
PEDs encouraged new efforts, such as taking the life cycle approach into use in the construction sector.
Inspired and motivated the city to fill in the gaps
Understanding the concept of PEDs
Technical understanding was missing
Concerned about how to raise interest in energy efficiency
High energy prices support PED development
Bureaucracy is an underlying issue—this leads to extraordinary delays and consumes much of the city’s time resources.
Citizen and stakeholder engagement could also be done more vigorously as citizens seem eager to participate in activities
Understanding the concept of PEDs
Which technologies to implement? Resolving issues through interactions with the two Lighthouse Cities and other four cities.
Value that PEDs broughtCity vision helped realize the challenge in translating the knowledge into the city’s own reality
PEDs initiated deeper discussions
Better relationship with stakeholders
PED has led the city to think about other sectors that should be developed in parallel.
Renewed interest when the stakeholders find out that SPARCS is a large European project with several partners. For example, the city recently attracted 400 applicants for further research into use of electric vehicles and load control.
PED attracted a lot of positive attention.
Realizing that PED discussions are not only meant for energy balance, but they are connected to people, economy, urbanism, etc.
Allows to attract more stakeholders
The project helped the city create a roadmap for itself.
Project webinars and workshops also continuously support the journey and help develop a system approach.
The city also shares the gathered knowledge within the city departments for more awareness.
The city was able to identify key strategy areas to work upon with the help with city vision workshop
Establishing the city’s first public PV system
The city gained new knowledge about existing solutions and how they can be implemented, for example, how should e-mobility be improved through scooters and e-bikes.
Became familiar with how to integrate energy, mobility and engage stakeholders.
The city is looking into procurement of e-bikes.
By being part of the PED project, the city of Lviv believes it could be a leader in energy efficiency in the country.
Identifying key strategy areas to work on helped understand how the different sectors can be combined.
Table 9. Checkpoints for PED development based on the experiences of five Fellow Cities.
Checkpoints for Initiating PED Development in a City
1Knowledge about the concept, best technologies, city context, regulatory concerns and baseline assessment
2Prepare a clear strategy with goals. Define legal, financial frameworks and other required documents
3Avoid large-scale projects in the beginning, start from small pilots that could give you quick wins and motivate
4Establish a local task force and governance model
5Establish local agreements with relevant stakeholders to assure data interoperability
6Define the business models and explore all funding options
7Analyse the current situation in your city
8Analyse potential locations accurately to implement PED solutions
9Ensure good project management from the start
10Identify all possible challenges and needs
11Have the support of the administration to ensure project ownership and awareness of project purpose
12Do resource assessment (finance, employees, funds etc.)
13Ensure close collaboration between city + technical partners of your city
14Create collaborative ecosystem (colleagues, other departments, other city stakeholders, other partners incl. distributors). Invite business partners, developers, investors, banks from the beginning. Engage the politicians and counsellor.
15Provide an open data for planning and implementing solutions
16Set up a data software solution and collect data regular or as much as possible
17Get information from other projects for examples
18Demonstrate advantages of new solutions
19Be flexible as local city situations may change abruptly
20Collaborate with NGOs and SMEs to reach citizens and better know the needs of citizens
21Communicate with other cities
Publisher’s Note: MDPI stays neutral with regard to jurisdictional claims in published maps and institutional affiliations.

