1. Introduction
An average for an economy corporate debt/loan interest rate spread is a useful sustainability performance indicator of monetary/economic conditions or risks for financial stability [
1,
2,
3]. However, in practice, corporate debt/credit interest rate spreads exhibit high cross-sectional heterogeneity [
4,
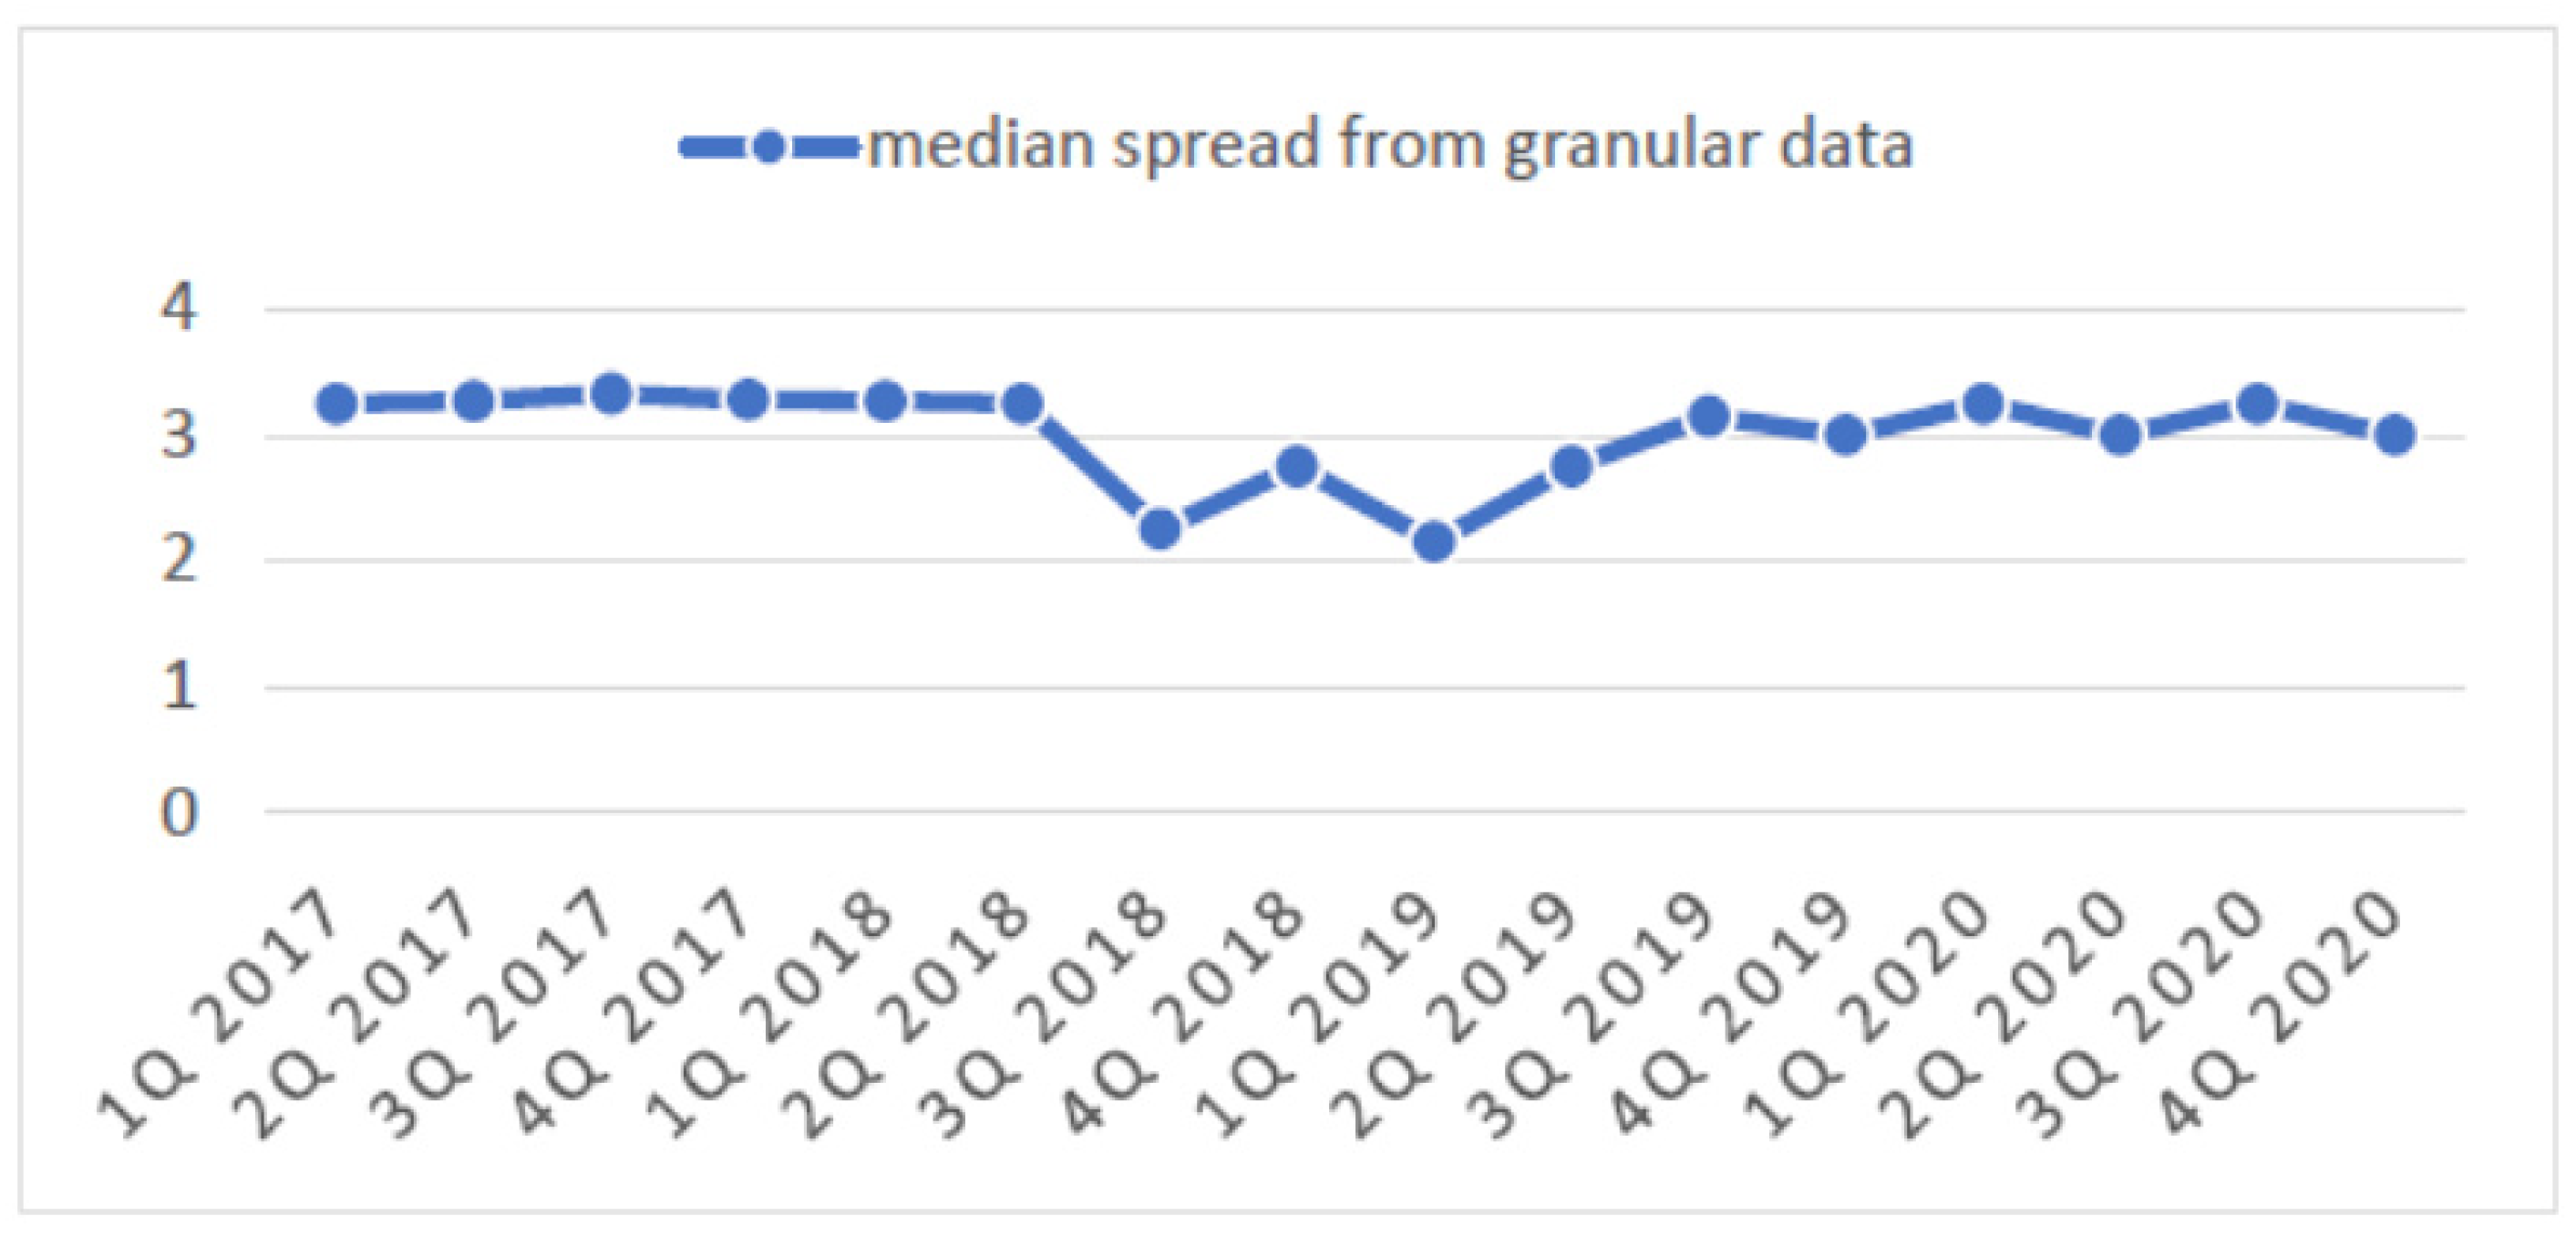
5]. Granular data on corporate loans (including credit lines) issued by Russian banks to all Russian corporates (with multiple bank–credit relationships) draw the same picture (
Figure 1).
The heterogeneity of credit spreads of corporate loan interest rates may have several sources related to the heterogeneity of borrowers, lenders, or loan terms [
5,
6,
7]. For example, if borrowers have different credit risk characteristics, banks tend to price loans to these firms differently. Loan terms (maturity, collateral attached, etc.) are also different. Furthermore, bank-specific factors, unrelated to the heterogeneity of borrowers or loan terms, may be responsible for the observed heterogeneity of loan interest rates. This last source, i.e., the heterogeneity of banks, is the main focus of our paper in order to achieve sustainable management. The heterogeneity of banks in interest rate setting for corporate loans can, therefore, be defined as how differently banks price a loan to the same borrower at the same moment in time and at the same loan terms [
5,
8,
9].
Figure 1.
Interest rate spread on granular corporate credit registry data (borrowers have multiple bank–credit relationships), pp over the benchmark interest rate. Note: in connection with the purpose and objective of the study, we exclude all FX loans, loans with rates in the first decile of the distribution (all loans with a rate less than 2.8%), and loans with an initial maturity of less than 30 days. The solid line is the median, and the 50th and 80th percentiles of the spread distribution across all loans issued to borrowers with multiple bank–credit relationships in a particular quarter. Sources: Bank of Russia—interest rate report detailing corporate credit registry data, 2020 [
10] (authors’ calculations).
Bank-specific heterogeneity thus defined can be considered as an indicator of credit/bond market fragmentation [
11,
12]. Fragmentation in the banking sector may have several policy implications. First, it may pose challenges to monetary policy setting and to its transmission mechanism in the context of sustainable management [
13,
14]. Fragmentation means that average spread becomes less informative regarding prevailing monetary conditions in the economy [
13,
15]. In addition, the transmission of changes in the policy rate may slow down in fragmented markets. Moreover, financial shocks that change spread may be a more important source of average interest rate volatility than monetary policy. Second, it may have implications for the expansion of sustainable financial policies after the COVID-19 pandemic [
14,
16,
17]. In particular, the heterogeneity of loan interest rate spreads, especially driven by bank-specific or industry-specific factors (e.g., lower spreads charged by some banks or charged to some particular industries), may point to risk-taking activities (“overheating”) by some part of the banking sector (cross-sectional dimension of financial stability) [
17,
18].
The goal of our paper is to decompose the heterogeneity of credit spreads in corporate loan interest rates using granular data of the credit registry for Russia, with a special focus on identifying bank-specific heterogeneity in the context of sustainable development. Granularity helps us to identify several heterogeneity factors and to compute several measures of bank-specific heterogeneity as well as firm-specific ones. We also study how different spread components behaved before and during the COVID-19 pandemic period. Understanding the reasons behind the theoretical or empirical heterogeneity of bank-specific factors is beyond the scope of this paper.
This paper proceeds as follows: In
Section 1, we describe the data. In
Section 2, we proceed with presenting our identification strategy to measure bank-specific and lender-specific components of the spread as well as market prices of loan terms. In
Section 3, we present empirical results—measures of bank-specific and borrower-specific heterogeneity of the spread, and evolution of the market prices for loan terms. Here, we compare the cross-sectional variation in bank-specific and borrower-specific components. In
Section 4, we assess the robustness of our results for alternative identification assumptions—monthly rather than quarterly frequency of defining “the same moment” of loans issuance for a firm with multiple bank relationships. In
Section 5, we draw conclusions and suggest policy implications.
2. Materials and Methods
We use a comprehensive micro-level database comprising all new loans issued by banks to the non-banking sector in Russia starting from 2017. The database used is a standard credit registry database that many other central banks collect and use [
19,
20,
21]. It contains detailed information on the currency and amount of loans issued to Russian companies, the amount of debt outstanding as of the end of each month, lending rates, original and remaining maturity, collateral attached, borrower–lender affiliation, and the amounts of debt repayment (including interest payments and the amortization of the principal amount of debt).
To study the heterogeneity of credit spreads in corporate loan interest rates, we use only domestic currency loans, i.e., we exclude FX loans (which are just 1% of the total number of loans) from our sample.
In connection with the purpose and objective of the study, we deal with a subset of loans issued to entities (borrowers) with multiple (n-banks, where n > 1) relationships in a particular quarter from 2017Q1 to 2020Q4. In the robustness assessment, we use monthly frequency to define firms having multiple bank relationships: if a firm has loans (credit lines) issued by more than one bank in a given month, it is selected in the sample.
We exclude loans with rates in the first decile of the distribution (all loans with a rate less than 2.8%). We have a practical rationale for this—in 2020Q2 the state program to support the economy during the COVID-19 pandemic was initiated with a 2% loan rate and a postponed interest payments scheme for qualified firms. We believe that such loans may not fully reflect market pricing conditions and would introduce some noise in the results. See the table with sample descriptive statistics after all corrections in
Appendix A.
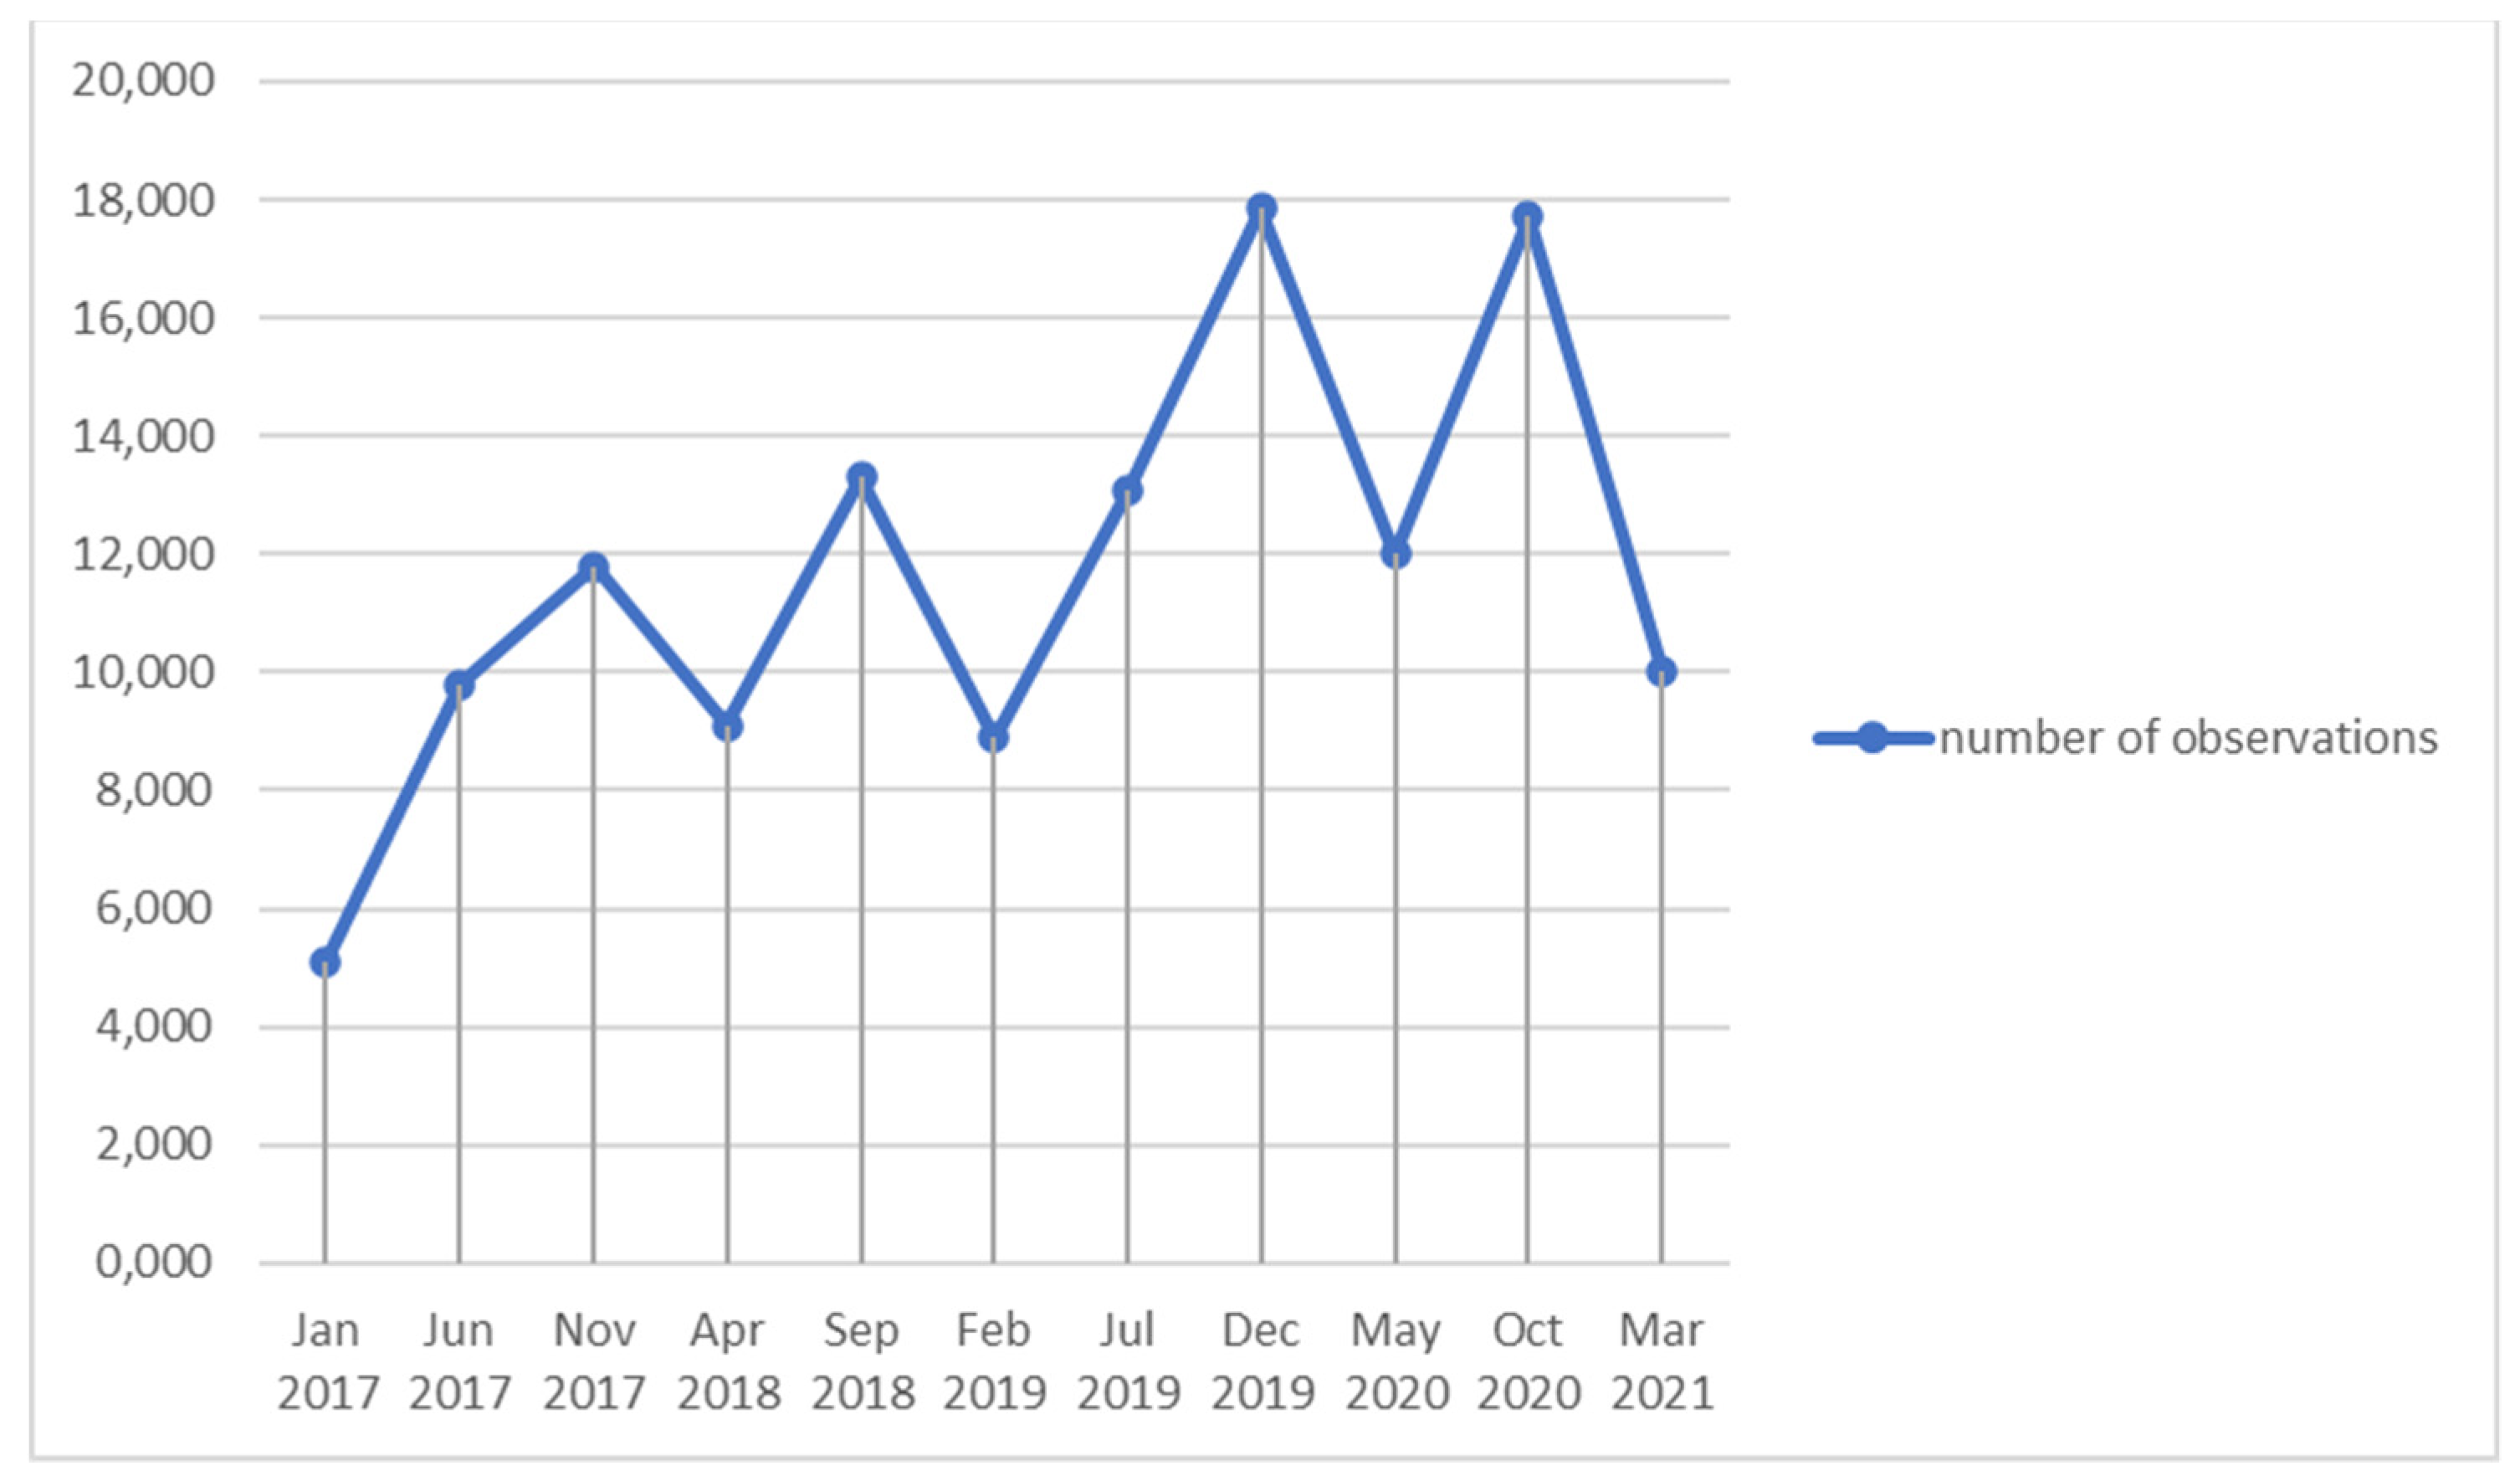
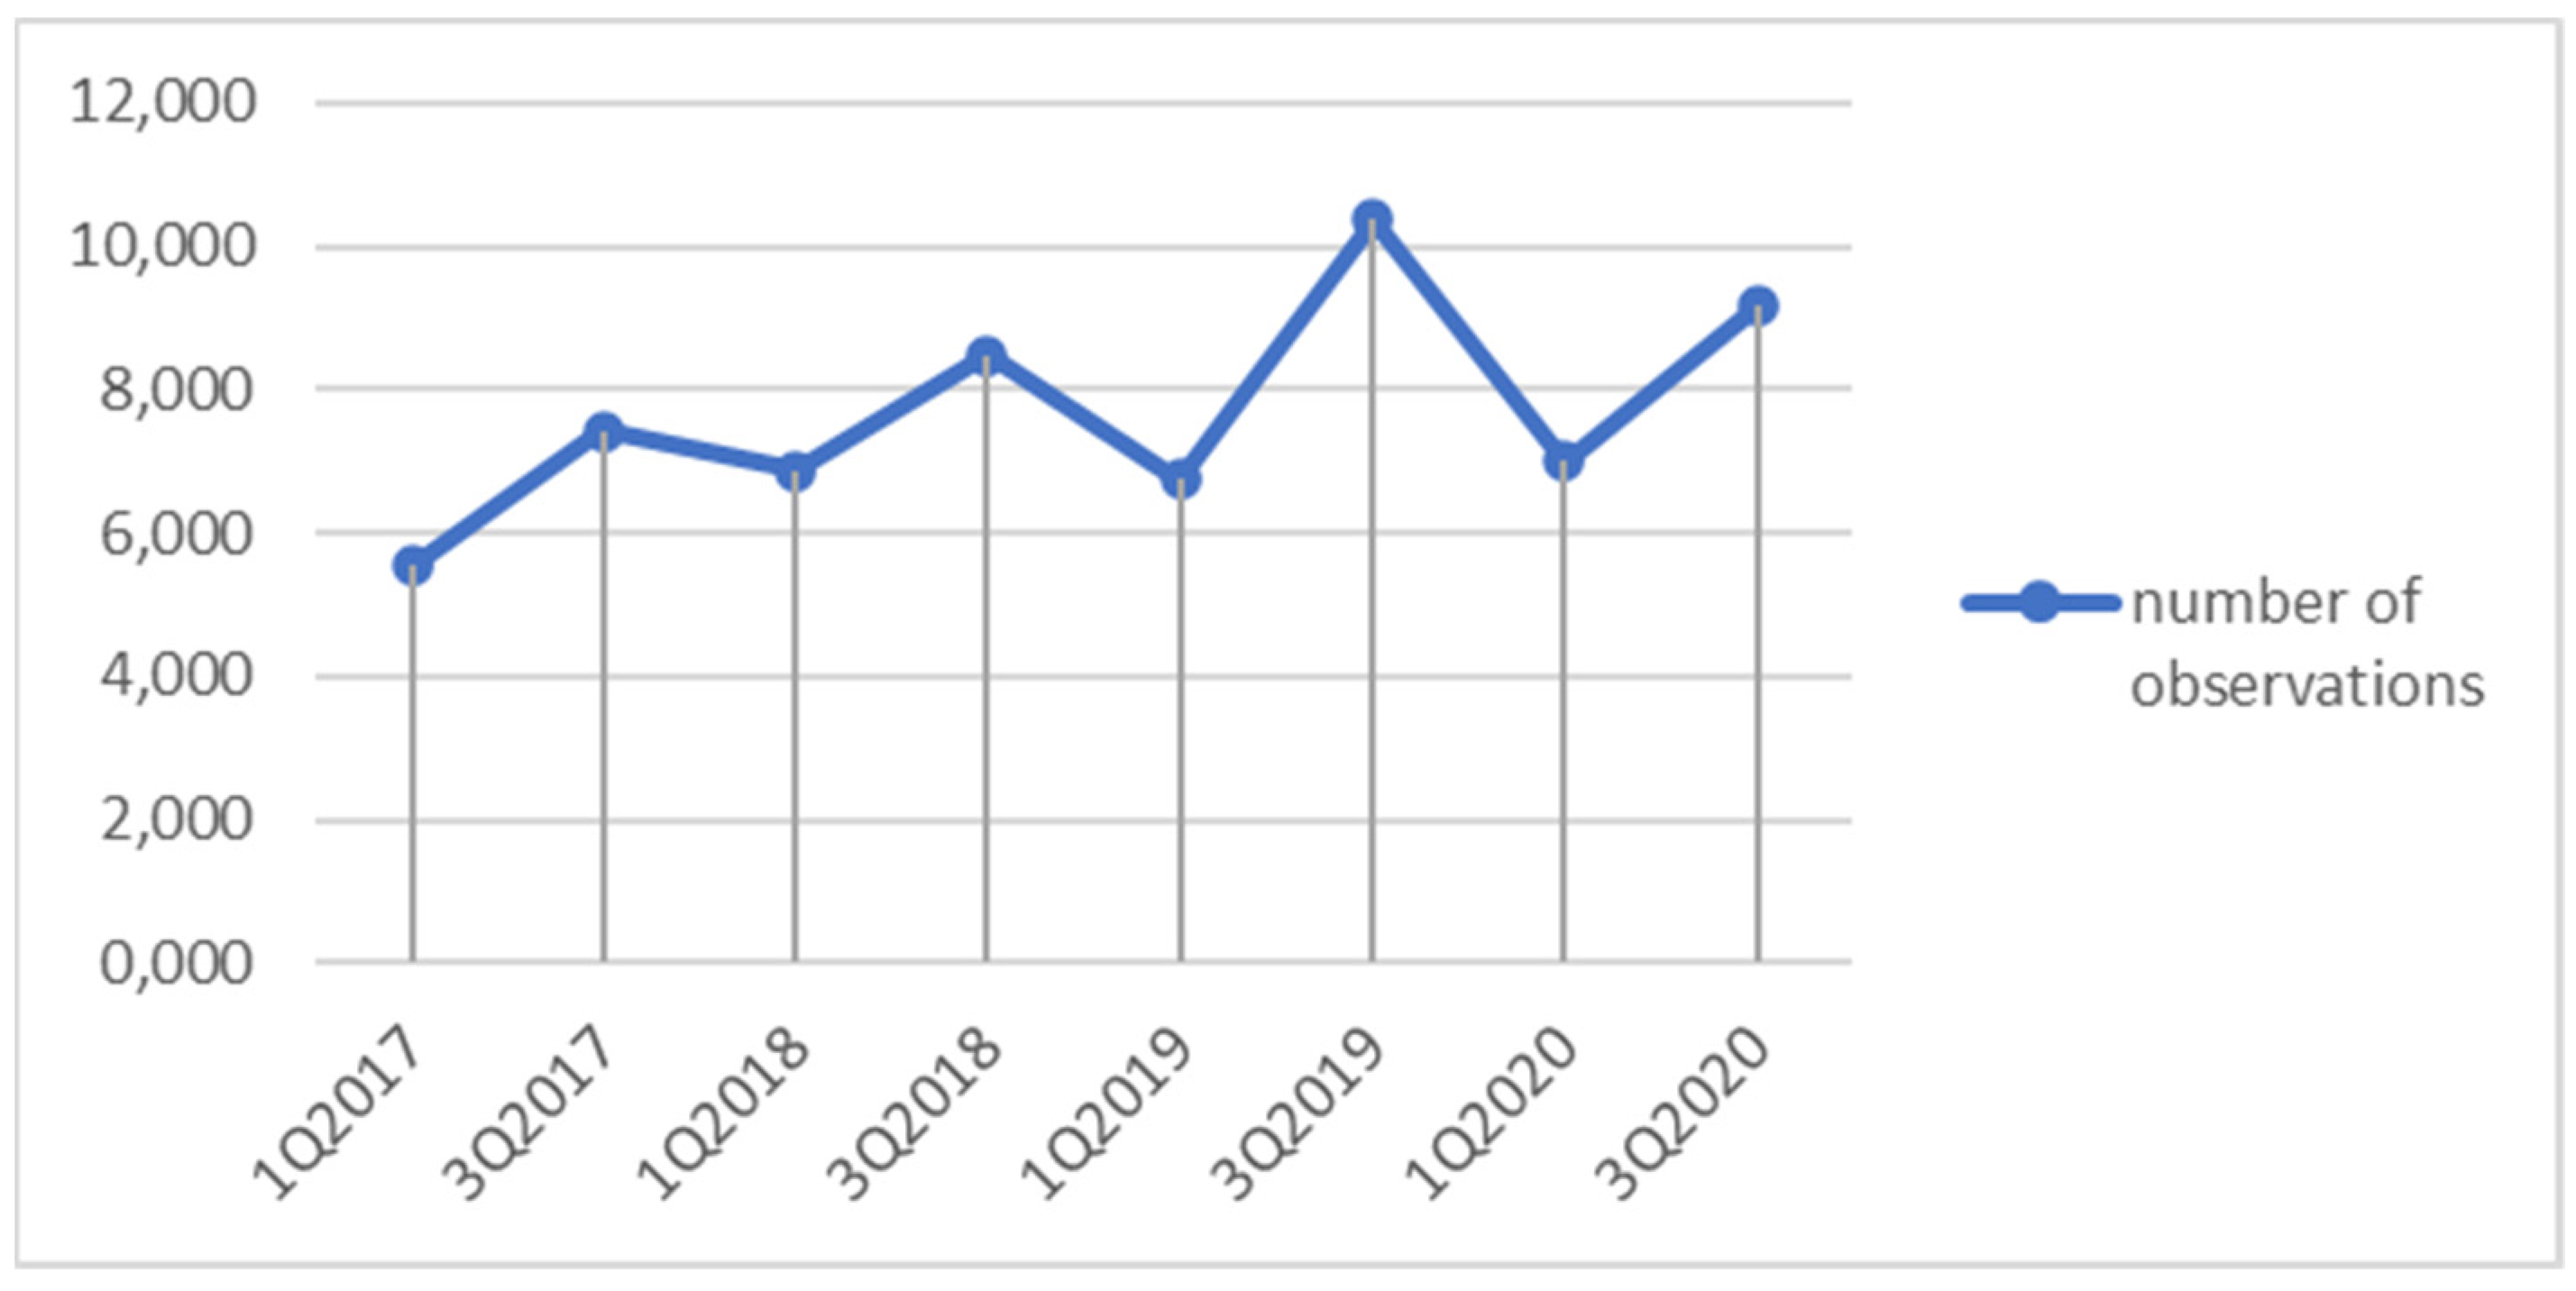
Considering data seasonality, one may want to discuss how it could translate into the results of fragmentation measures. We show that the potential effect of seasonality is rooted in the smaller number of observations (N) in the 1st quarter (
Figure 2) or month (
Figure 3) of each year. This translates into less stable and reliable estimates produced for these periods. Therefore, the fluctuations of lender- and borrower-related components (
and
) observed in such periods should be interpreted with caution.
As we deal with a subsample of firms having multiple bank relationships in a given quarter (month) only, a question naturally arises as to why such firms choose to have multiple credit relationships. We do not study this in detail, as the question is beyond the scope of this paper. However, we address the hypothesis claiming that only very large firms are subject to such multiple relationships due to credit constraints and the inability of any particular bank to meet the demand of such large borrowers.
To illustrate the identification approach, let us consider the following example. Two banks, Bank A and Bank B, issue a loan to the same firm at the same period of time (in a given quarter). The loan terms are also the same. How would the banks price the loan? If we observe that an interest rate spread of the loan charged by Bank A is smaller, we can assign the difference only to bank-specific factors.
The reason for lower spreads may be differences in capital or income on the deposit side or different risk attitudes of the banks [
21,
22]. For example, Bank A may charge a lower deposit rate and, as a result, may earn an additional margin on the deposit side. Whatever the reason for Bank A to assign a lower interest rate spread relative to Bank B’s spread (when the opportunity cost of money for both banks is the same), the lower spread implies that Bank A will not receive the same compensation for the loan to the same borrower with the same conditions [
23,
24,
25].
Turning to the technical side of identification, we use data that characterize a firm that borrowed from several banks in the same period of time (quarter) [
25]. We also control for the loan terms. To estimate the lender-related component of the credit spreads, we employ a dummy regression technique. We refer to Khwaja, A.I. and Mian, A. (AER, 2008) [
26], Gambacorta, L. and Mistrulli, P.E. (JMCB, 2014) [
21], and to Horny, G. et al. (2018) [
23] who used this methodology to measure financial fragmentation episodes in the EU area.
The spread of the loan rates (credit spreads) relative to the benchmark could be decomposed into lender-related, borrower-related, and loan-related components by estimating the following regression for a triple I = {borrower, bank, loan characteristics}:
: credit spread (difference between the loan
i rate and the benchmark rate);
: borrower-specific components;
: time-fixed effect (common macroeconomic conditions);
: dummy for the borrower (borrowing company)—borrower-time-fixed effect;
: dummy for the bank (lender)—bank-time-fixed effect;
: dummy for loan characteristics (maturity, 1 if maturity > 1 year), dummy for the type of interest rate (0 if fixed, 1 otherwise). We also include a dummy for collateral attached to the loan (1 if there is collateral), a dummy for affiliation of a bank, and a borrower (1, if there is an affiliation). All dummies are taken from corresponding fields of the credit registry database [
27,
28].
The objective is to estimate the coefficients
where the coefficients
and
are the primary focus of this paper. We use a time-varying dummy for each bank and for each borrower. The time-fixed effect absorbs macro factors and other factors that uniformly affect all loans and their pricing [
27,
29]. We construct an aggregate measure of bank-specific components for well-defined groups of banks (state-owned banks vs. private banks, banks with foreign capital vs. other domestic banks, top 30 banks vs. other banks) [
28,
30], and for the aggregate sectors of the economy the borrower operates in.
Following Horny, G. et al. (2018), we measure banking sector fragmentation as the average value of the bank-specific component
. We also tried other characteristics of
’s distribution (across banks): standard deviation and the difference between the 95th and 5th percentiles [
23].
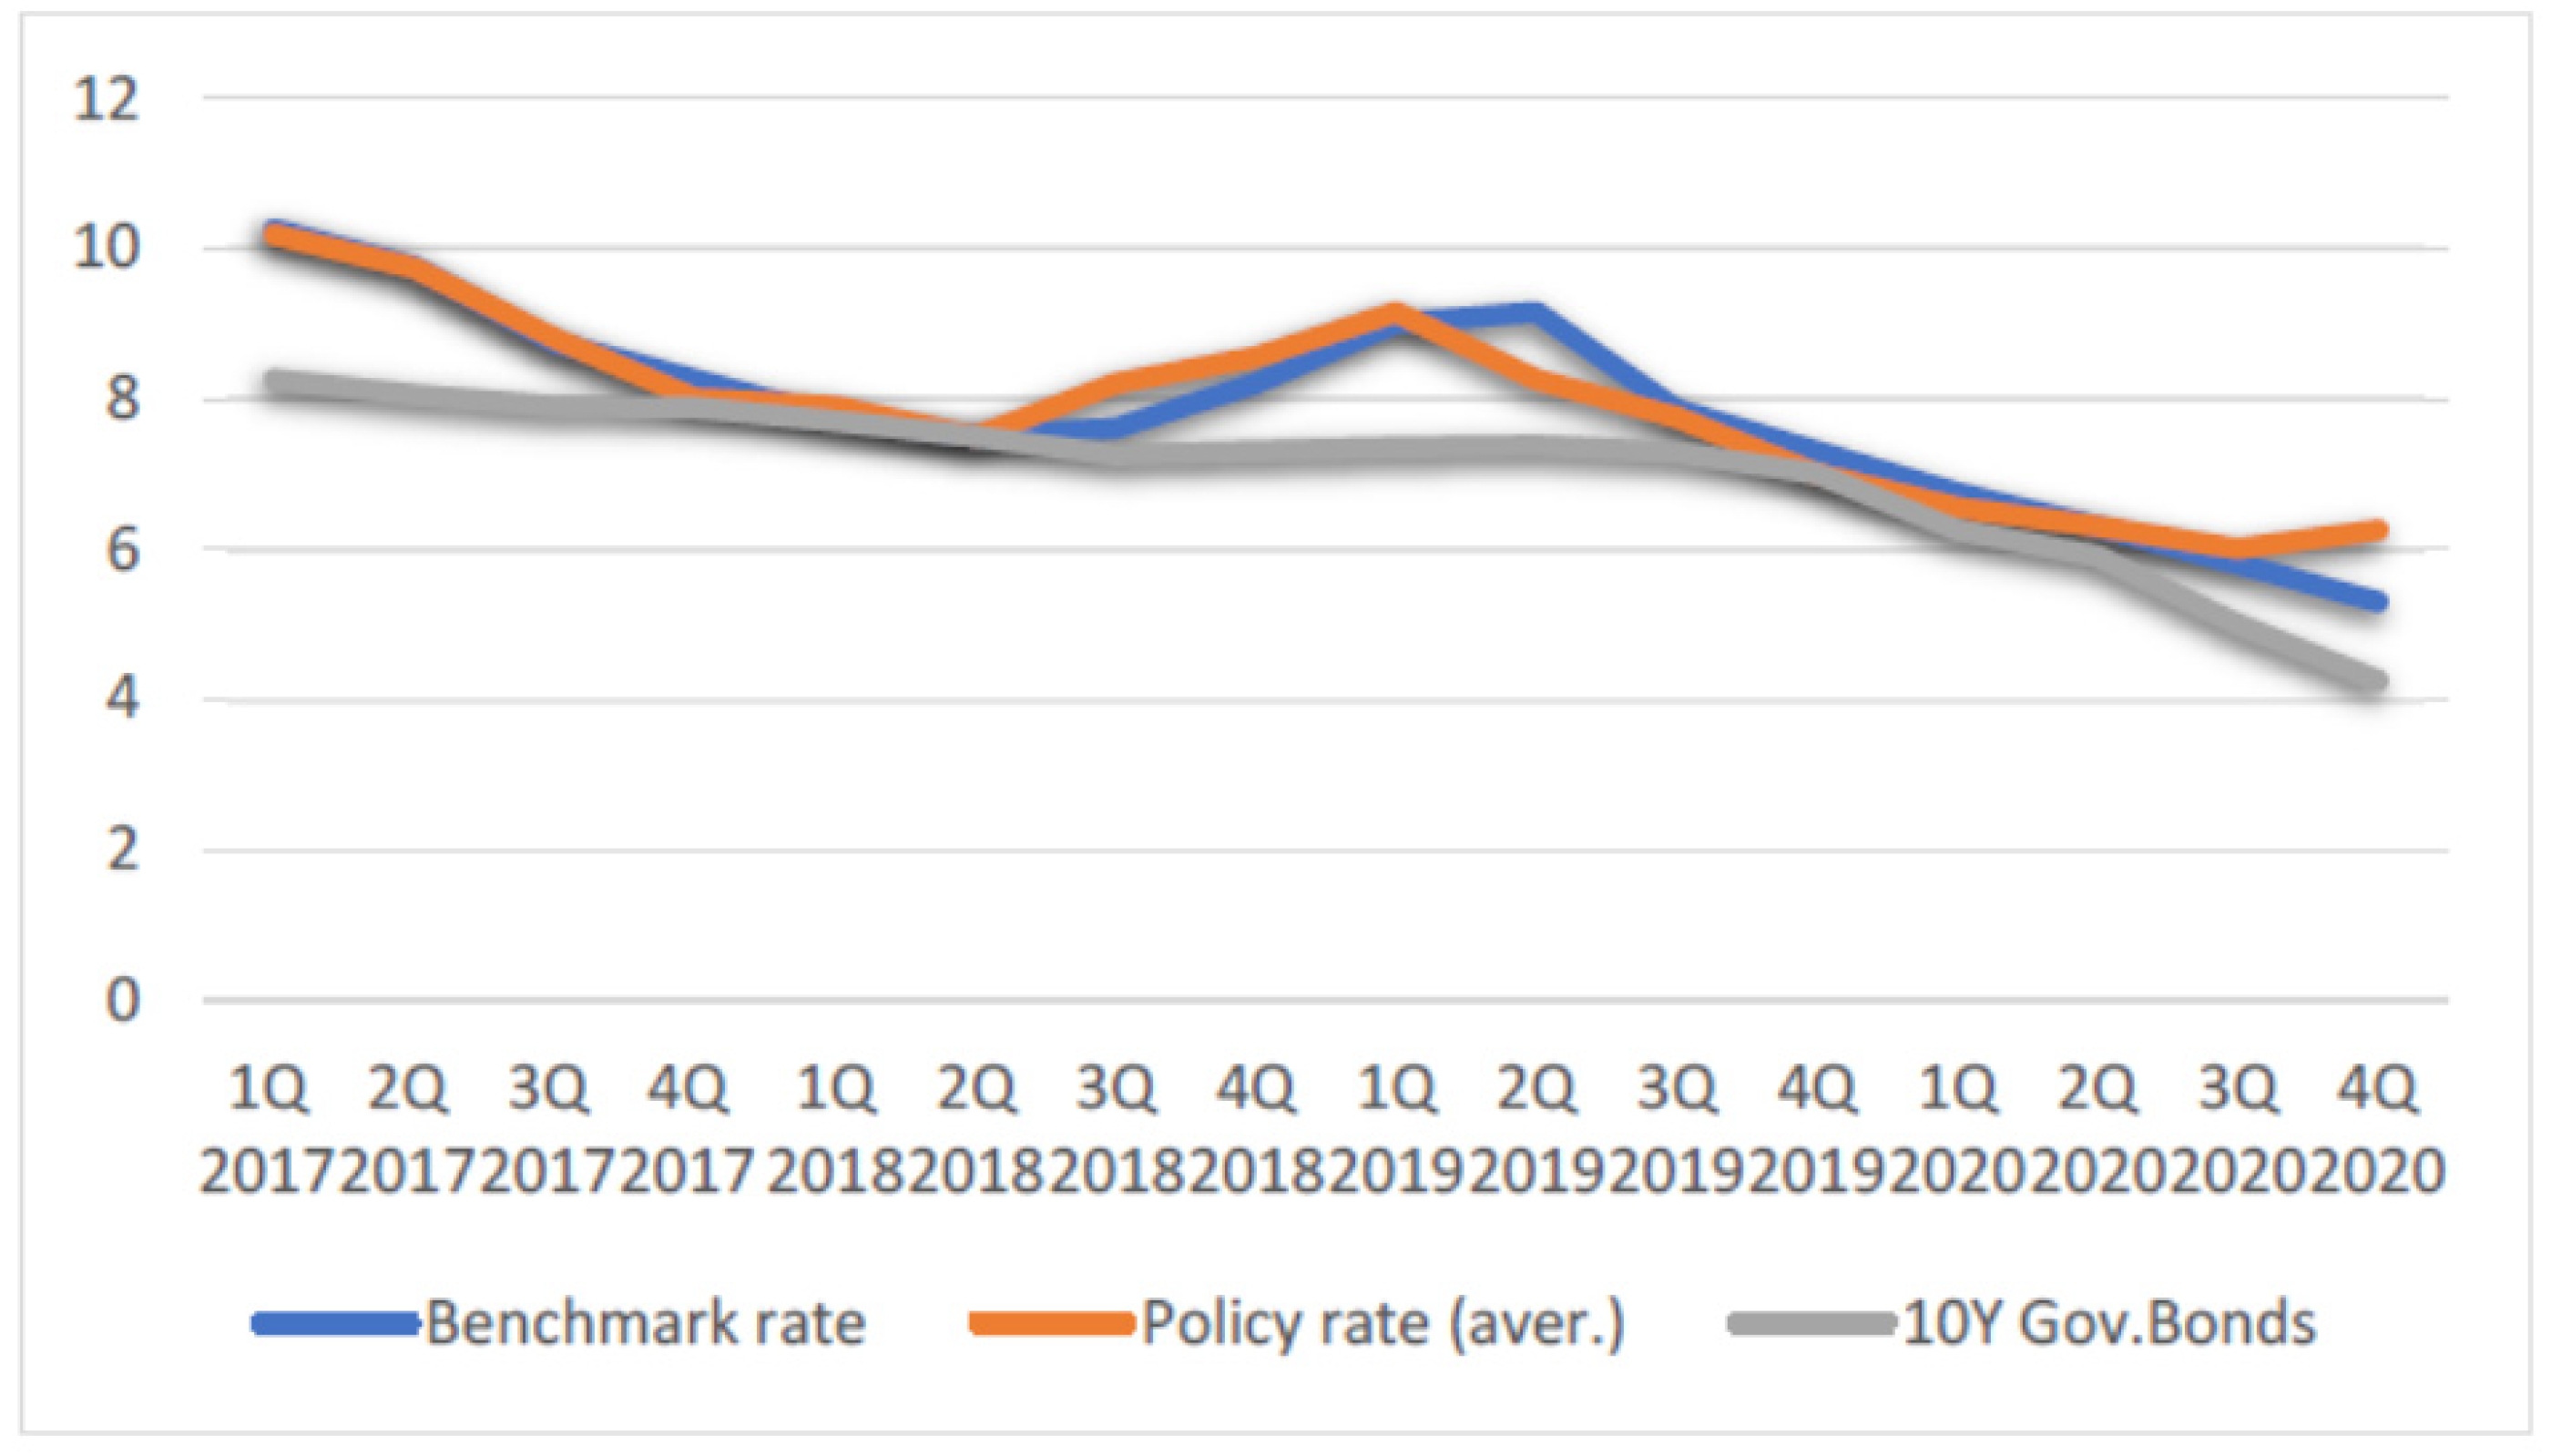
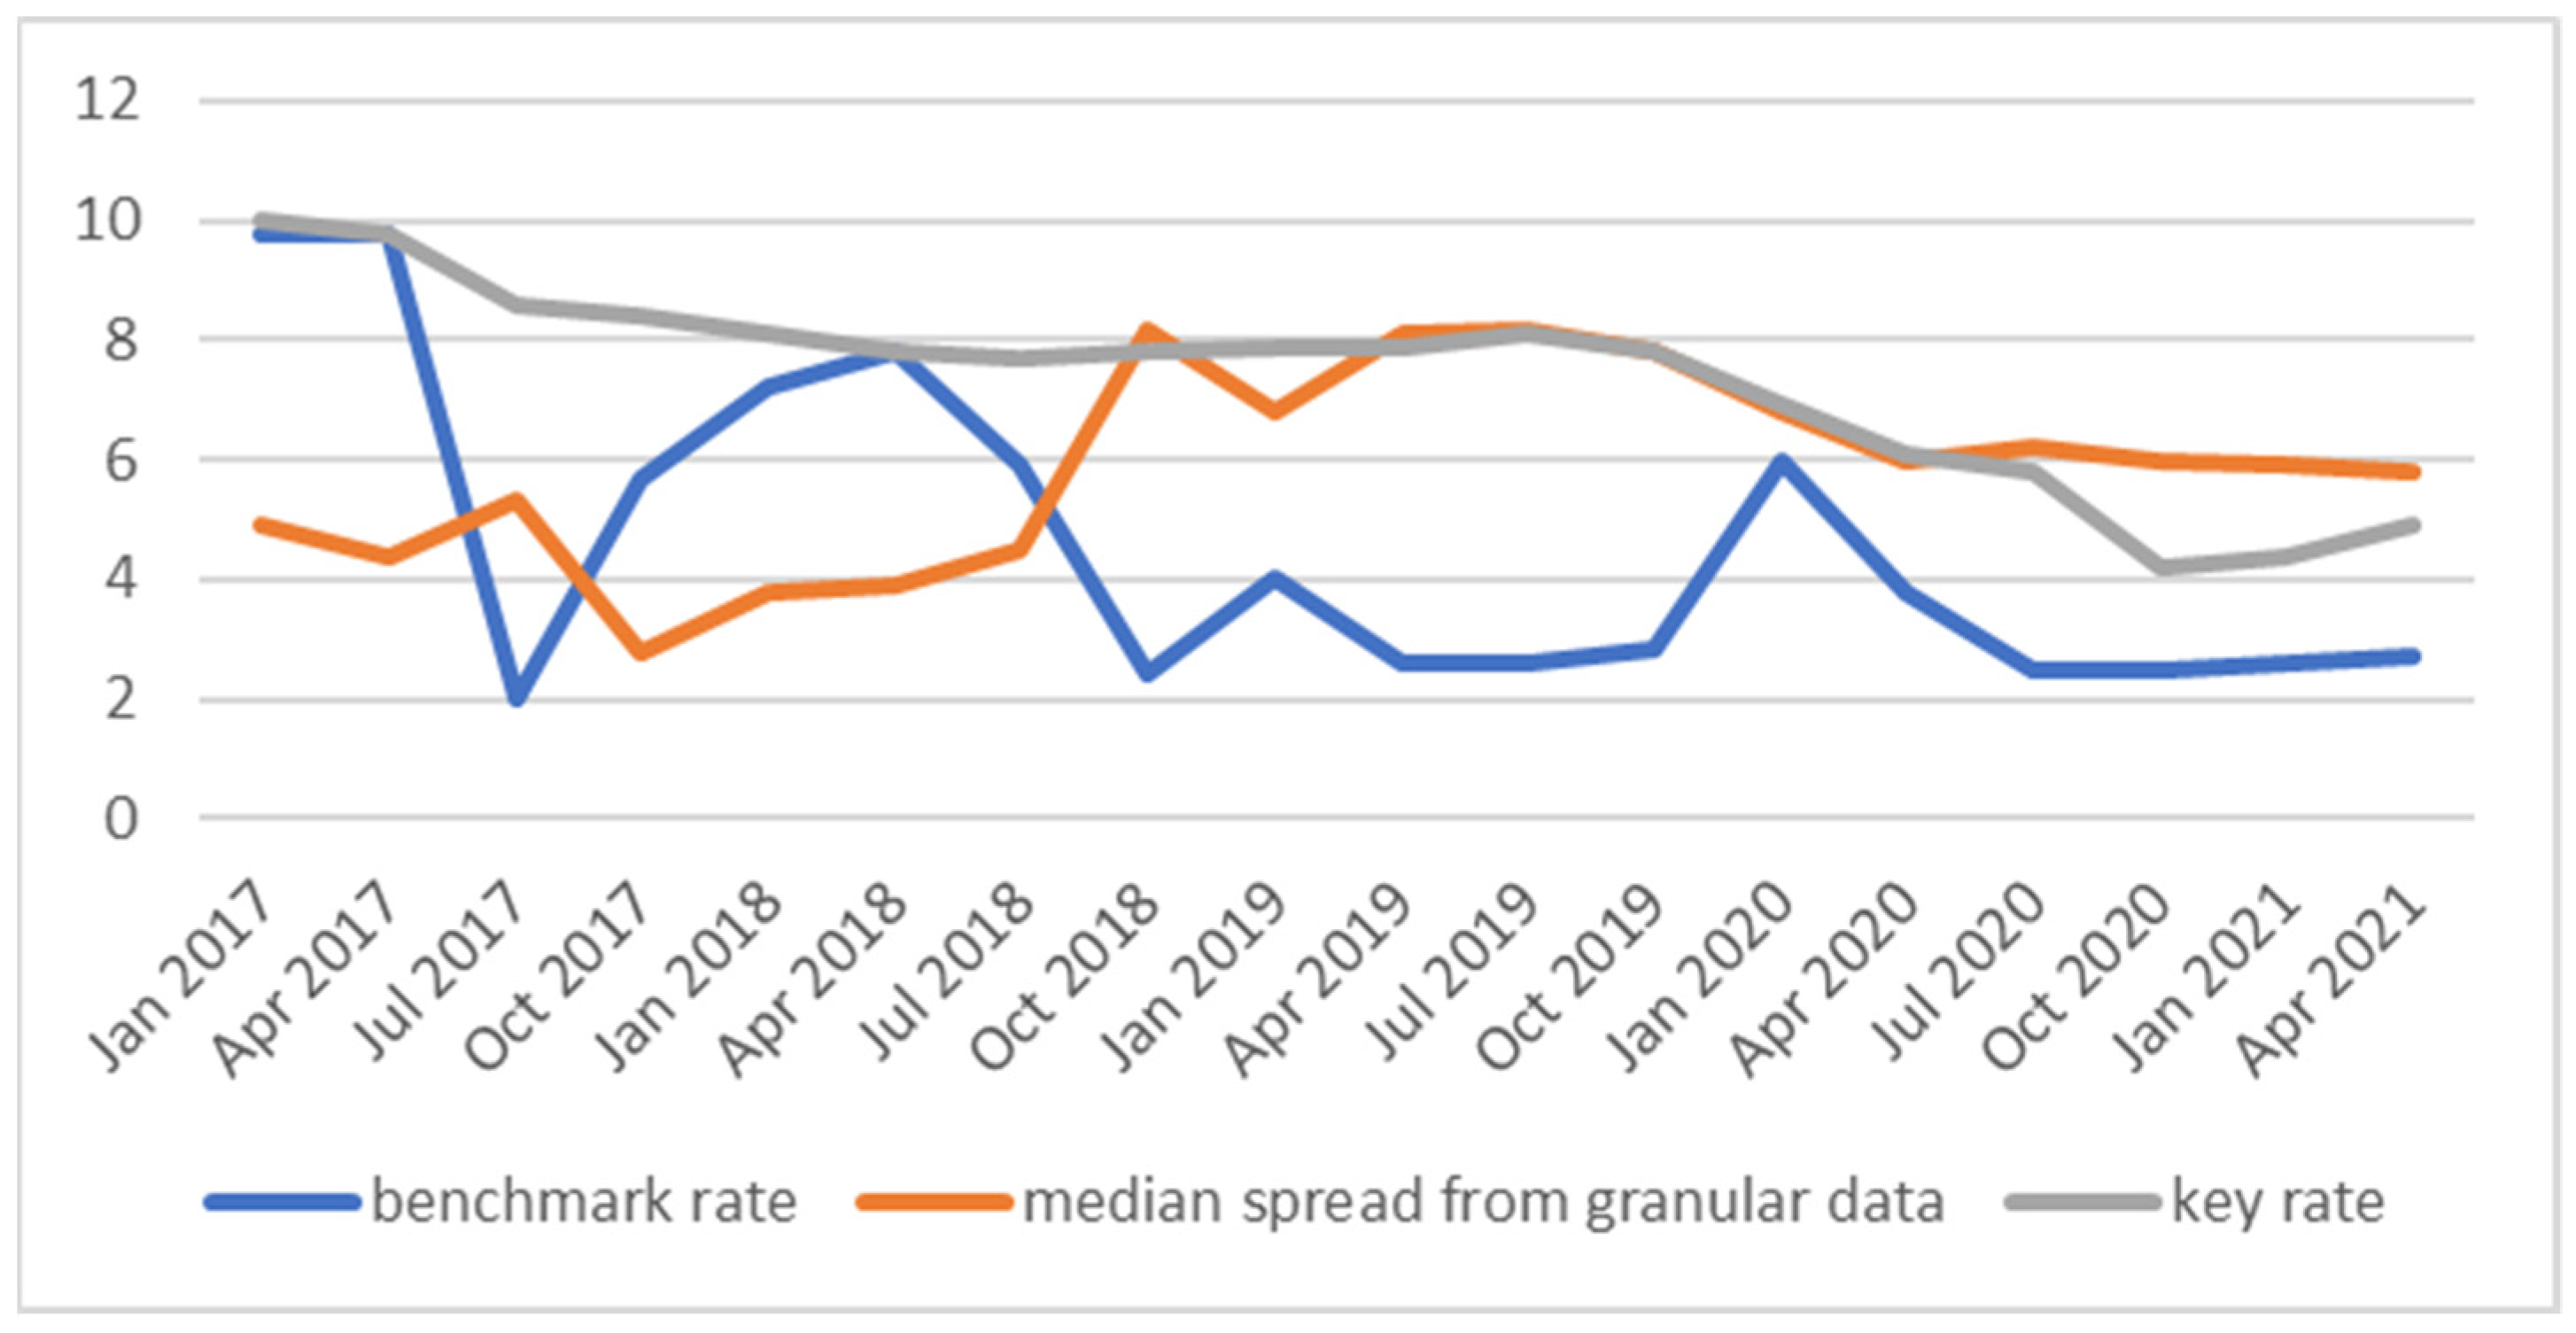
We disentangle the spread relative to the benchmark into bank-related and loan-related components. As the benchmark rate (
Figure 4), we use the average of the interest rates charged by the benchmark lender on the loans issued to the benchmark borrower in a particular quarter from 2017Q1 to 2020Q4. As the benchmark lender, we select one of the top 30 banks. As the benchmark borrower, we choose a company that had persistently borrowed from the benchmark lender every quarter for 16 quarters (time span) and that had multiple relationships with other banks during the same quarter.
For the identification purpose, we considered only those borrowers who had taken loans from multiple banks (more than one bank–credit relationship in
Table 1 represented by the shaded area) in a given time period (a quarter, in our main case, a month—in the robustness assessment). In particular, we considered the following observations: “Firm X borrowed from Bank Y with loan term Z in quarter Q where Firm X also borrowed from some other bank(s) with some loan terms in the quarter”. There are 1.2 million such observations—borrowers with multiple bank–credit relationships. For these banks, we run the regression (1).
Consequently, we assess the distribution of specific components in the credit spread of newly issued loans with a quarterly frequency and aggregate results for the groups of banks and at the industry level.
3. Results
To identify the bank-specific and the borrower-specific components, we run the regression specified in Equation (1) for spreads on loans issued by lenders to borrowers with multiple bank–credit relationships in a given quarter from 2017Q1 to 2020Q4. This condition does not imply that the lender should issue such loans every quarter. This makes our panel unbalanced, however, this is a sufficient condition for pointwise estimates of and in Equation (1).
However, in order to correctly apply the concept of heterogeneity to the bank-specific or borrower-specific component, we must control for lender (borrower) composition in each particular quarter. Thus, for aggregating, presenting, and interpreting the results, hereinafter we perform this for the and estimates for those banks (borrowers) who had issued (received) loans from multiple bank–credit relationships in all 16 quarters. In total, 202 of 493 banks issued loans to 391 borrowers in all 16 quarters.
We assess the robustness of our results to an alternative length of the period used to define companies having multiple bank relationships during the period: a month versus a quarter, which was used in our main results. Below, we select loans (including credit lines, but excluding overdrafts) with a maturity of more than 30 days to ensure that the detected multiple bank relationships are not a consequence of a loan issued by one bank and repaid in the same month and another loan issued by another bank after the loan of the first bank had been repaid.
We expand the sample for it to include January–May; thus, the whole monthly sample covers 2017M1–2021M5 (
Figure 5). The structure of the sample is given in
Table 2.
Contrary to quarterly identification, only 63 banks and 14 companies had multiple bank relationships during the whole monthly sample. Descriptive statistics for the sample of firms with multiple bank relationships on a monthly basis are given in
Table 3.
4. Discussion
First, we decompose the corporate loan interest rate spread along the lines of a pseudo-experiment conducted by Khwaja, A.I. and Mian, A. (AER, 2008) [
26], GambaCorta, L. and Mistrulli, P.E. (JMCB, 2014) [
21], and Horny, G. et al. (2018) [
23] on Russian credit registry data to identify bank-specific components of the spread. This is the first study of the banks’ interest rate setting in Russia on such detailed data. Existing studies for Russia cover issues of the banks’ heterogeneity in interest rate setting, however, cannot address the issue of loan pricing heterogeneity with such granularity to identify the bank-specific component of the spread (Laeven, L. (2001) [
31], Fungáčová, Z., and Poghosyan, T. (2011)) [
19]. Thus, we contribute to the existing empirical literature with the identification of Russian data. Granular data help us to identify the market price of particular loan terms (maturity, fixed or floating interest rate, affiliation, and collateral) in Russia. The data also help us to identify borrower-specific components in the credit spread.
The pseudo-experiment consists of selecting a subsample of borrowers having multiple bank relationships at the same time. Such a subsample of borrowers helps isolate the effects of borrower-related factors (=“demand-side”) on the interest rate setting. After controlling for loan terms there appears a possibility to identify bank-specific components of the spread. To form such a sample of firms with multiple bank relationships, we use detailed loan-firm-bank-level data on bank loans from the Russian credit registry. The database covers all loans issued by all Russian banks to all Russian corporates in 2017–2021. We define the spread as the difference between the rate on a newly issued loan and the base rate of a loan issued by the benchmark bank to the benchmark borrower. To identify components of the spread, we regress the spread against a set of quarterly time-varying dummy variables for individual lender- and borrower-related components and control for the loan characteristics. A bank-specific component of the spread for a given loan to a given borrower is how the lender prices a loan spread with given terms (maturity, type of interest rate, collateral, affiliation of the bank and the borrower) to the borrower in a given period relative to how the benchmark bank prices the same loan to the same borrower.
Second, to the best of our knowledge, our study is the first to measure the heterogeneity of bank-specific components on granular data—analyzing the distribution of bank-specific components and changes in the distribution in time. Existing papers address the issue of measuring heterogeneity (as an indicator of banking sector fragmentation) using macro-level (Affinito and Farabullini (IJCB’2009)) [
4], or bank-level data (Gambacorta (EER’2008)) [
20]. The closest paper is by Martín-Oliver et al. (JMCB’2007) [
14], who considered a similar exercise but studied heterogeneity along the line of banks and credit market products, not along “banks-borrowers”. Gambacorta and Mistrulli (JMCB’2014) [
21] considered the same identification scheme but did not calculate measures of heterogeneity of bank-specific components of the spread and analyze how this heterogeneity changes in time. In similar papers, the identification methodology is used to study the sensitivity of loan interest rates, (Ioannidou et al. (RF’2015)) [
29] or measures the credit risk (Jiménez et al. (Ecca’2014)) [
30] to monetary policy shocks or, as in Banerjee et al. (2021), to study the effects of relationship banking on credit provision during the global financial crisis.
We measured fragmentation in the Russian banking sector (corporate credit segment) along the lines of Horny G. et al. (2018) [
23]—applied to the European bond market. We shifted from the country-based application of Horny, G. et al. (2018) [
23] to bank-level analysis, where “the law of one price” is also expected to hold, according to Affinito, M. and Farabullini, F. (2009) [
4] and Martín-Oliver A. et al. (2007) [
14]. “The law of one price”—applied to corporate bank loans—assumes that loans issued with the same risk profile and other loan terms should have the same price, not systematically dependent on the asset holder (the bank issuing the loan). When it holds, it means that credit risks are spread homogeneously across the banking sector, which, in turn, implies better resilience of the banking sector in a time of crisis. Thus, it is natural to expect that banks should price loans to the same firm with the same loan terms during the same period of time equally (not statistically different). The deviation from uniform pricing is used by Horny G. et al. (2018) [
23] as an indicator of bond market fragmentation. We measure such defined fragmentation using the identified bank-specific components of the spread, i.e., the component of the spread that is not driven by borrower fundamentals. In the absence of fragmentation, all banks should have the same bank-specific components as the benchmark lender, i.e., the coefficients of the bank dummies should be zero. Moreover, with the presence of fragmentation, some banks will have bank-specific components different from zero. Heterogeneity of this component signals the presence of wedges which are internalized by banks differently. On the other hand, “the law of one price” holds if the continuum of asset holders is not fragmented. We will compare this measured heterogeneity of loan pricing for well-defined groups of banks (state-owned vs. private, domestic vs. foreign, large vs. small). In this respect, our analysis contributes to the literature that studies banking sector fragmentation (see Lucotte, Y. (2015) [
32]), but applies granular data to the literature that studies banking sector heterogeneity in Russia with other measures. Heterogeneity of the spread and loan rates means that monetary policy conditions are also heterogeneous. Large heterogeneity, especially if it is attributed to a bank-specific component of the spread (banks setting different rates to the same borrowers with the same loan terms), may imply that the banking sector is fragmented [
20,
22].
Third, using the results of our decomposition and measurement, we analyzed changes in Russian banks’ pricing behavior and corporate credit market fragmentation during the COVID-19 pandemic. To this end, we compared the identified components of the credit spread before (2019) and during the COVID-19 pandemic (2020). Our findings contribute to those in the literature on changes in bank loan pricing behavior during the COVID-19 pandemic in Russia (Akhmedov, F. et al. (2021)) [
11], and in other countries (see Beck, T. and Keil, J. (2021)) [
8].
5. Conclusions
Based on a large loan-by-loan database of Russian corporate loans (credit registry), we identify bank-specific, borrower-specific (heterogeneity of borrowers), and loan-terms-specific factors of corporate loan interest rate spreads for sustainable management goals. We find that the heterogeneity of banks and borrowers is quite large. Some banks tend to charge a spread up to 5 pp larger/smaller than the benchmark bank when issuing loans to the same borrowers (controlling for the loan characteristics). Our results motivate further research to create a better understanding of the causes of such high bank heterogeneity.
We calculate several fragmentation measures for the Russian corporate lending market and for some bank groups. These measures are defined as deviations from the “one price”, governed by the bank-specific components of the spread. We find that, in general, the corporate loan market is quite fragmented (the standard deviation of the bank-specific spread is around 3 pp—the size of the median spread during the entire period) and fragmentation had been declining until the COVID-19 pandemic. The measures of banking sector fragmentation point to an increased fragmentation of the lending market in Russia during the first half of 2020, the early stage of the pandemic, and the impact of the COVID-19 pandemic on fiscal policy.
Regarding fragmentation between some specific groups of banks, we find that the 30 largest banks are quite a homogeneous group, which also priced loans to the same borrowers with the same terms more homogeneously compared to banks from other groups. Given the role this group plays in corporate lending in Russia (taking into account the volume of loans), we may conclude that the issue of fragmentation should not be an issue for monetary policy or financial stability. However, there is still fragmentation on the loan market: the group of the largest banks prices loans differently compared to all other banks. Moreover, other well-defined groups of banks (especially the group of small private banks) are also fragmented, and the fragmentation increased during the COVID-19 pandemic. Attention from the regulator may be needed to reduce the fragmentation across these dimensions; however, for that, we need to have a better understanding of the causes of the fragmentation between the largest and all other banks and inside these well-defined groups.
We find some evidence that relationship lending can be an important factor in setting interest rates for a sustainable social system.
Decomposition of the spread provides some insights into changes in market prices of some loan terms during the COVID-19 pandemic. We find that banks have started pricing a larger spread for long-term loans and a lower spread for floating-rate loans since 2020. Moreover, at the start of the pandemic, banks began providing discounts to affiliated borrowers but kept pricing loans with collateral attached as before the COVID-19 pandemic. All these changes point to a tightening of loan conditions during the COVID-19 pandemic. In their study, Beck T. and Keil, J. (2021) [
8] reached a similar conclusion regarding the behavior of US banks during the COVID-19 pandemic.
Our findings also confirm that the COVID-19 pandemic resulted in a notable increase in heterogeneity in loans to utilities. We also find that borrowers in hotels, restaurants, tourism, and transport (the most affected industries) were charged with a lower spread (approximately 1.5 pp for the low bound of the confidence interval). Meanwhile, in construction, there was an increase in the median level of borrower-related components (banks started charging a larger spread to companies from these industries). Both findings may be a result of subsidized loans being issued to some firms in these sectors to support them during the COVID-19 pandemic. According to Akhmedov, F. et al. (2021) [
11], who sought to identify subsidized loans through a lower spread to the key rate, i.e., with rates below 2%, the number and volume of such loans increased during the COVID-19 pandemic. To address the issue of outliers, we excluded the first decile of loans (those cheaper than 2.8%), thus automatically excluding loans cheaper than 2%—the largest part of subsidized loans. However, some non-market-priced loans might still be present in our data. Moreover, after Akhmedov, F. et al. (2021) [
11] excluded such loans from the data sample, the weighted-average interest rate spread did not change much compared to its pre-pandemic level, which is what our data show too (
Figure 1). However, contributing to their results, we find that heterogeneity (fragmentation) increased during the period.
Our results can be used by policymakers across several dimensions:
First, the distribution of the bank-specific component () can be used to select those banks from the tails of the distribution that regulators should focus more attention on—at least to understand the reasons for their strong deviation from other banks in corporate loan pricing.
Second, corporate credit market fragmentation measures can be used in periodical reviews of the market developments to detect changes in the efficiency of the corporate credit market in a timely manner.
Third, using panel data on fragmentation measures calculated on granular data for corporate loan markets in many jurisdictions can help to test early warning properties of the heterogeneity for financial stability purposes or to test their role in the dynamics of corporate lending during crises.
