Article

A Study on the Efficiency Analysis of Global Terminal Operators Based on the Operation Characteristics

1
Graduate School of Global Logistics, Korea Maritime and Ocean University, Busan 49112, Korea
2
KMI KMOU Cooperative Program, Korea Maritime and Ocean University, Busan 49112, Korea
3
Department of Logistics, Korea Maritime and Ocean University, Busan 49112, Korea
*
Author to whom correspondence should be addressed.
Sustainability 2022, 14(1), 536; https://doi.org/10.3390/su14010536
Submission received: 29 October 2021 / Revised: 2 December 2021 / Accepted: 6 December 2021 / Published: 4 January 2022

Abstract

:
Shipping and port industries are undergoing rapid environmental changes because of the reorganization of carrier alliances, enlargement of ships, and an increase in global uncertainty. Thus, the sustainable operation of container terminals requires a new assessment of port efficiency and measures to enhance efficient operation. Hence, we classified 21 global terminal operators (GTOs) into stevedore, carrier, and hybrid GTOs based on their operation characteristics and derived a sustainable container terminal operation method using data envelopment analysis efficiency and Malmquist productivity index analysis. The results showed that stevedore GTOs exhibited improved efficiency when the terminal infrastructure was expanded. However, the returns to scale and technical change factors in the productivity change trend decreased. Meanwhile, the objective of carrier GTOs is cost reduction, unlike stevedore and hybrid GTOs, which focus on generating profits. Consequently, carrier GTOs were the most inefficient with little intention to improve efficiency. A systematic efficiency improvement strategy through the acquisition of a terminal share was effective for hybrid GTOs. However, similar to stevedore GTOs, investment in technical change was insufficient for hybrid GTOs. The efficiency analysis we conducted for each operation characteristic is expected to provide useful basic data for establishing efficiency improvement strategies for every GTO.

1. Introduction

Globalization of the world economy has seen a significant increase in container cargo with the increasing international trade for the rationalization of transportation and efficient improvement in logistics. To meet the rapidly increasing demand, logistics companies have switched from bulk carriers to container ships, either rented or manufactured. The acquisition of ships for freight transportation has led to the rapid growth of the container ship market, and with the increasing supply of ships compared to container cargo, competition among the cargo companies has intensified [1]. Therefore, the size of ships has been enlarged to reduce operating costs such as oil, labor, maintenance, repair, and operation (MRO) costs, and the pursued economies of scale that increase unit efficiency through the simultaneous transportation of large quantities of freight. Furthermore, they developed supply chain management (SCM) systems to manage the entire process of delivering goods, from manufacturers to consumers [2]. Moreover, to lower the risk on SCM, they conducted mergers and acquisitions or formed shipping alliances to increase activities, such as securing freight volumes through joint transportation between alliances, for improving transportation efficiency. Operators adopted the hub and spoke strategy in an effort to improve user convenience and achieve transportation stability by securing the dedicated terminals along the main routes in cities or countries while reducing ports of call. However, this gave rise to competition among ports wanting to operate as the hub. Therefore, to gain a competitive advantage, ports expanded their infrastructures such as the terminal area, quay length, water depth, and cranes, and generated profit by professionally operating the entire port, or only a few terminals. Furthermore, as companies wanting to secure route stability by securing terminals began to appear, global container terminal operators (GTOs) with excellent networks, vast handling capacity, and capacity to secure freight volume appeared [3,4,5].
Owing to the enlargement of ships to save carrier shipping costs, GTOs are constantly growing to efficiently handle the increasing freight volume and container demand, which was revealed in a review by the global GTO market. In 2014, the global container throughput of 23 GTOs was 77.5%, and that of the top 21 GTOs in 2018 was 80.0%. Therefore, we can say that global freights are practically moved through terminals operated by GTOs. Moreover, the container throughput is expected to grow further as GTOs expand investments to emerging markets in Southeast Asia, Africa, and Latin America [6].
While the emergence of GTOs has positively affected the unloading speed of terminals, the stability of terminal development, and improvement in efficiency, they also have adverse effects such as an increase in inefficiency due to excessive investment in port facilities, and the oligopolization of global networks [7]. Furthermore, shipping and port industries are undergoing rapid changes concerning the environment due to the reorganization of alliances, enlargement of ships, and increasing global uncertainty. As GTOs are operated on a multi-national scale, the realization of the economies of scale through global expansion is of utmost importance, which is diametrically opposite to local operators. Moreover, the large scale of initial capital injection and the long payback period require a cautious approach for investment evaluation [8]. Consequently, GTOs are demanding new evaluation methods to maintain port efficiency for the sustainable operation of container terminals, and measures to enhance competitiveness for efficient operation. Sustainable terminal operation is to increase the economic efficiency of the terminal by optimizing the use of resources, cost, and time based on efficient operation [9,10,11]. Sustainable development and operations have become a central point of the strategic and operative management in port operations, playing a pivotal role in achieving an improvement in container terminal efficient/cost-efficient operation, throughput, and profitability [10]. Sustainability practices are classified into five potential types of motives leading a port entity [11]. Further, operational issues are one of the main potential types to gain competitive advantage from the sustainability practices in port operations.
Furthermore, in 2019, the top 21 GTOs were classified by Drewry based on operation characteristics, while considering the definition and operating method of the GTO. Moreover, they have different characteristics depending on the main activity, financial aims, efficiency aims, and purpose of the terminals network. From the perspective of terminal operators and shipping companies, selecting efficient and highly productive operational characteristics is a key factor to consider for future-oriented container terminal operation.
Therefore, the aim of this study was to perform data envelopment analysis (DEA) and Malmquist index analysis on 21 GTOs to determine the characteristic that exhibited the highest efficiency and productivity. The study also aimed to identify the limitations of each terminal operational characteristic and to derive a method of enhancing competitiveness for sustainable container terminal operation. The methodology and related variables were selected by reviewing the existing efficiency analyses and previous studies on the efficiency of container terminals. The throughput, share, and capacity were determined for the analysis from Drewry data, from 2015 to 2018. The berth length and terminal area were determined from the websites and annual reports of the GTOs from 16 March to 1 May 2020. Based on the calculated indices, DEA was performed to identify the relative efficiency, and the productivity change trend was examined by analyzing the Malmquist productivity index.
The analysis results showed that stevedore GTOs showed improved efficiency by securing their terminal infrastructure. However, some terminals exhibited decreased efficiency owing to excessive investments. Carrier GTOs showed a relatively low efficiency considering their objective is to save transportation costs, unlike other terminals that create profits. Lastly, hybrid GTOs improved efficiency by securing a share of ports.

2. Literature Review

2.1. Status of GTOs

During the 1990s, the economic growth of emerging industrial countries in Asia was driven by the growth of global companies who attempted to change the SCM system based on integrated logistics services. The changes brought about by the SCM system across the shipping industry led to the enlargement of container ships. Consequently, many countries developed large container terminals by integrating small- and medium-sized container ships, resulting in growing competitiveness [12,13].
Sea freight volumes were also predicted to show a steady growth trend. In 2019, the Organization for Economic Co-operation and Development forecasted sea freight volumes three times the volumes predicted in 2015 with an expected, continual average annual increase of 3.6% until 2050. Furthermore, it was predicted that the freight volume in the North Pacific and the Indian Ocean would increase by approximately four times compared with the volumes of 2015, and 25% of the total sea freight volume is expected to occur in this region. Moreover, the demand for European sea freight volume is expected to decrease because of the development of factories in the Chinese mainland to save production costs [14]. The United Nations Conference on Trade and Development (UNCTAD) report showed that in 2019, the traffic volume of container ports increased by approximately 2% compared with that of 2018. Therefore, the container market is expected to expand further [15].
These cases indicate the enlargement of ships, which increases the investment and operation costs for terminals, has resulted in the emergence and growth of GTOs to reduce costs and cope with the increasing international trade around ports and other uncertain factors, such as oil price rise and exchange rate fluctuations [16]. Consequently, the demand for continuous investments and improved management efficiency has increased for the efficient functioning of ports. As of 2014, 23 GTOs were operational, and the container capacity of the GTO accounted for 57.2% of the global container capacity [17]. Furthermore, in 2016, the throughput of the top 10 GTOs handled approximately 40% of the global freight volume. Therefore, GTOs play a major role in the global port market. The container capacity of GTOs is expected to increase in the future because of the expanding investments for emerging markets in Africa, Latin America, and developed countries in Europe and North America [5,14,15].
However, there are limits to all investments, and in order to make an investment for the continuous growth of GTOs, a performance that gives confidence in the investment is required. The outcome of the terminal is ultimately to process cargo faster and cheaper than competitors, and GTOs are preparing short-term and mid-to-long-term efficiency improvement methods to secure competitiveness [9].

2.2. Classification of GTO by Characteristics

According to the Drewry GTO Annual Report 2019, terminals worldwide can be classified into three types: GTOs, private terminals, and state-run terminals. According to the capacity shares of operators from 2018 to 2023, GTO showed the highest share of the total capacity at 60–62%, followed by the private terminal operators at 17–18%, and the state-run terminal operators at 18–19% [6].
GTOs can be further classified into stevedore, carrier, and hybrid GTOs based on the operation characteristics. The stevedore type, such as the Hutchison Ports, PSA International, DP World, Terminal Investment Limited, APM Terminals, and China Merchants ports, use the same system among different terminal networks to improve efficiency and generate profits. Carrier GTOs such as Evergreen, MOL, K Line, and Hyundai improve efficiency by integrating terminals with wide-ranging service networks to reduce sea transportation costs. Hybrid GTO types such as China Cosco Shipping, CMA CGM, and NYK improve efficiency by using the same system for the terminal networks to generate container profits through sea transportation [6]. In this study, DEA and a Malmquist index analysis were conducted on 21 GTOs to investigate the characteristic showing the highest efficiency and productivity. Table 1 lists the characteristics of GTOs based on the operation characteristics.

2.3. Container Terminal Efficiency Related Works

Kim et al. [17] examined the business strategies of major GTOs around the world, classified the domestic container terminal operators based on the operation characteristics (stevedores, carriers, and domestic stevedores), and analyzed the efficiency and productivity of the terminals. DEA and a Malmquist index analysis were conducted using berth length, CY area, G/C, and the T/C index as input variables and throughput as the output variable. The results revealed that the stevedore GTOs had higher efficiency and productivity compared to other operator types, indicating that the domestic terminals should be integrated, and excessive competition should be reduced by actively introducing advanced operation methods in other countries.
Tongzon [18] emphasized the increasing need for ports for international competition owing to the globalization of the industry and attempted to derive reliable factors that influenced the performance and efficiency of ports through multiple regression analysis. He selected 23 container ports based on the port size, geographic location, and data availability, considering the characteristics of ports differ by freight type. The most important achievement in container ports is the container cargo throughput, which is influenced by the port location, number of operations, port cost, port service, and terminal efficiency. Furthermore, factors affecting the terminal efficiency, container mix, work practices, crane efficiency, and economies of scale were also analyzed. The results showed that crane productivity positively correlated with the port performance and efficiency improvement, whereas the unloading delay and crane utilization rate had a negative correlation.
Antonio et al. [19] investigated 11 major ports in Mexico using DEA and the Malmquist index to determine whether the reformation of the Mexican port system in 1993 led to an increase in efficiency. The number of workers and berth length were used as input variables and throughput as an output variable. The analysis results showed, on average, the port productivity increased by 4.1% per year from 1996 to 1999, thereby indicating successful reformation of the port system.
Cullinane and Wang [20] conducted DEA to examine the relative efficiency of 69 major container terminals in Europe in the midst of intensifying competition among container terminals. Furthermore, they analyzed the effects of the asset size on efficiency using the terminal length, terminal area, equipment, and container throughput as input variables, and container throughput as an output variable. The analysis results showed that while most terminals had an increasing return to scale (IRS) model, some had a decreasing return to scale (DRS) model, indicating that the characteristics and situation of each terminal should be considered when creating policies or making decisions on container terminals.
Mennis et al. [21] used Markov analysis and the homogeneous continuous time model to estimate the risks and economic effects of work delays due to gantry crane failure from the positions of terminal operators and shippers. The analysis data included the berth frequency, completion rate, and failure rate due to the failure of gantry cranes in a port container terminal in the Mediterranean basin. The results showed that equipment failures should be minimized through systematic terminal management systems, otherwise the productivity would be aggravated, and the transportation cost of the final consumers would increase due to substitute terminals in the same region. However, other factors such as types of equipment and expansion strategies were insufficiently considered for improving terminal efficiency.
Ahmed et al. [22] measured the efficiency changes of 22 container terminals located in East Africa and the Middle East from 2000 to 2005 by conducting DEA and Malmquist analysis using the berth length, quay crane, handling equipment, and terminal area as input variables, and ship calls and throughput as output variables. The results showed that while the efficiency of some terminals increased through system management and technical improvement, there were two types of inefficient terminals. The first type is medium seaports, which correspond to IRS and can improve efficiency by increasing the scale, whereas the second type is large container terminals, which can improve efficiency by increasing production size.
Cheon et al. [23] evaluated 98 major global ports to determine the effects of port system reformation on efficiency improvement from 1991 to 2004. The DEA and Malmquist index analysis were performed using berth length, terminal area, the capacity of the container, quay side, and mobile cranes as input variables and throughput as the output variable. The analysis results showed that share restructuring through the reformation of port systems improved the total factor productivity and optimal container operation system, particularly in large ports.
Qianwen [24] measured the efficiency of 32 container ports in the North Mediterranean Sea using a stochastic frontier approach (SFA) analysis using a panel dataset of 32 container ports and a cross-sectional dataset of 165 container terminals around the world for nine years. Results showed that the container ports and terminals in the North Mediterranean Sea were technically inefficient, and the freight volume significantly affected the efficiency of container ports. However, this study has a limitation considering the infrastructure, equipment, and labor of the terminals were not considered.
Wilmsmeier et al. [25] measured the changes in efficiency and productivity of 20 terminals in Latin America and the Caribbean due to the economic crisis, from 2005 to 2011. DEA and a Malmquist index analysis were conducted using the terminal area, ship-to-shore crane, capacity equivalent, and the number of workers as input variables, and throughput as output variables. The results showed that changes in the economic environment around the terminals aggravated the productivity and efficiency of container terminals.
Bichou [26] examined the correlation of the changes in the operation environment and port terminal efficiency by conducting DEA for 60 container terminals in the world between 2004 and 2010, using the terminal area, maximum draft, length overall, quay crane index, yard-stacking index, trucks and vehicles, and gates as input variables and throughput as the output variable. The results showed that the size of the container terminal, transshipment, cargo mix, handling type in the yard, policies, and operation procedure positively affected the efficiency of container terminals.
Yuen et al. [27] analyzed 21 major container terminals in and around China to examine the variations in efficiency due to foreign or local ownership. Upon analyzing the compatibility between the factors and container terminal efficiency through regression analysis, DEA was performed using the setting berth, total length, port land area, and quay crane as output variables, and throughput as the output variable. The results showed that the share structure of the terminal, size of the background complex, and competitiveness of connected ports were positively correlated with the improvement in the efficiency of container ports in China.
Chang and Tovar [28] conducted SFA and Malmquist index analysis for 14 port terminals in Chile and Peru from 2004 to 2010 to increase economic potential by developing port infrastructure in Latin America. Based on previous research, the containerized cargo, general and rolling freight, and bulk cargo were set as output variables, and the number of workers, net stock of fixed assets, number of berths, and machinery were the input variables. The analysis results showed that the performance of labor variables increased for the terminals in Peru, although investments in infrastructure and equipment were insufficient, and greater technical investment and government-led process innovation would be required to address this issue. In Chile, labor variables had to be managed. However, this study was limited considering it did not cover various variables for terminal efficiency analysis.
Samuel [29] evaluated the factors that influenced the efficiency of container terminals in the Mombasa Entry port in Kenya by conducting a Likert-scale survey with 30 port workers. The results showed that the quay crane equipment, reducing berth times, container cargo dwell time, vessels and truck turnaround time, both physical and soft infrastructure, customer clearance procedure, and lack of integrated IT system influenced the overall efficiency of the port. The dwell time of containers in the Mombasa Entry port was 4–6 days, which was longer than the international standard dwell time of 3 days. Furthermore, the lack of integrated IT systems resulted in delays in customs clearance, which affected the container efficiency.
Lin et al. [30] measured the efficiency and resource consumption of 16 container ports in China among the top 20 ports using the IDEA model based on the cargo throughput in 2017 for the sustainable development of container ports to reduce environmental pollution caused by the rapidly growing port and terminal industries. The berth length, equipment assets, number of employees, and expenses were used as input variables and the throughput and profit as output variables. C O 2 and N O X were used as undesirable variables. Results showed the air pollution from the ports in the Bohai Sea region had to be managed and suggested additional investments for port infrastructure in the Ningbo, Dalian, Lianyungang, and Fuzhou regions. Furthermore, a Chinese container system of the Yangtze River should be introduced for the development of the Shanghai, Ningbo, and Nanjing ports, and cost reduction was necessary for the Fujian port as a core region of the future. However, this study had limitations considering the identification power of the CCR model’s efficiency analysis was low and the emission data were inaccurate. Table 2 summarizes the studies that used DEA.
The studies mentioned above utilized various efficiency measurement methods such as DEA [17,19,20,22,23,25,26,27,30], SFA [24], questionnaire survey [29], and Markov analysis [21] to measure the efficiency of container terminals. In this study, we used DEA and Malmquist productivity analysis to present implications for sustainable operation methods by comparing the relative efficiency of GTOs and their annual productivity trend based on operational characteristics. This conclusion was chosen based on the deduction that it is preferable to measure efficiency using DEA in the case of terminals with clear inputs and outputs [31].
This study is different from previous studies in the following ways. First, unlike previous studies, 21 GTOs were selected for analysis. Second, terminal efficiency and productivity were analyzed according to operational characteristics. Third, this study identifies the limitations of each terminal operational characteristic, and we derive a method to enhance the competitiveness for future-oriented container terminal operation.

3. Materials and Methods

3.1. Methodology

The DEA used in previous studies is widely used for efficiency analysis, and particularly, for measuring relative efficiency. In this study, we derive the relative efficiency for each operation characteristic using DEA and examine the sustainability of container terminals by operation characteristics based on the DEA results. The DEA-CCR model is a linear fractional programming method that maximizes the ratio of the output-weighted sum to the input-weighted sum of the decision-making units (DMUs) provided this ratio of the target DMUs does not exceed 1, and the weights of each input and output are greater than zero. The output-oriented CCR model is expressed as a linear programming equation with a double transformation, given as [32]:
M a x h 0 = θ
S . T . j = 1 n λ j y r j + r = 1 s θ y r 0 + s r + = 0 ,         r = 1 , 2 , , s
j = 1 n λ j x i j + s i = x i 0 ,         i = 1 , 2 , , m
s r + , s i , λ j 0 ,     i , r , j
However, the CCR model is limited because it assumes that the return to scale is constant and cannot distinguish the scale and pure technical efficiencies. The estimation by the CCR model can appear inefficient if the production technology is a variable return to scale, while it actually is an efficient DMU. Therefore, to improve this, Banker et al. [33] proposed the BCC model that uses the assumption of variable returns to scale by relaxing the limitation on the constant returns to scale and adding the convexity requirement. The output-oriented BCC model is expressed as a linear programming equation with a double transformation, given as [33]:
M a x h 0 = θ + ϵ [ i = 1 m s i + r = 1 s s r + ]
S . T . j = 1 n λ j y r j + r = 1 s θ y r 0 + s r + = 0 ,     r = 1 , 2 , , s
j = 1 n λ j x i j + s i = x i 0 ,   i = 1 , 2 , , m
j = 1 n λ j = 1
s i , s r + , λ j 0 ,     i , r , j
The efficiency of scale refers to the increase in efficiency with the harvest of the variable scale. For determining the efficiency of scale, technical efficiency (TE) and pure technical efficiency must be considered. Technical efficiency refers to the ability of a company or public service provider to produce the maximum output from a given input. Because the CCR model assumes that the output variable according to scale is constant during efficiency measurement, it can measure technical efficiency. The BCC model refers to it as pure technical efficiency. Using this, it is possible to suggest the direction for efficiency improvement by identifying whether the cause of the DMU inefficiency is technical or scale. The efficiency of scale can be given as [33]:
SE = C C R B C C
The Malmquist productivity index analysis measures the changes in productivity and describes the overall factor productivity for efficiency and technical changes separately. Additionally, it introduces the concept of a distance function to the principle that efficiency can be compared only for specific time points of the DEA-CCR model. The technical levels at a specific time point t and future time point t +1 can be given as [34]:
M t = D e t ( x t + 1 , y t + 1 ) D e t + 1 ( x t , y t )
M t + 1 = D e t + 1 ( x t + 1 , y t + 1 ) D e t + 1 ( x t , y t )

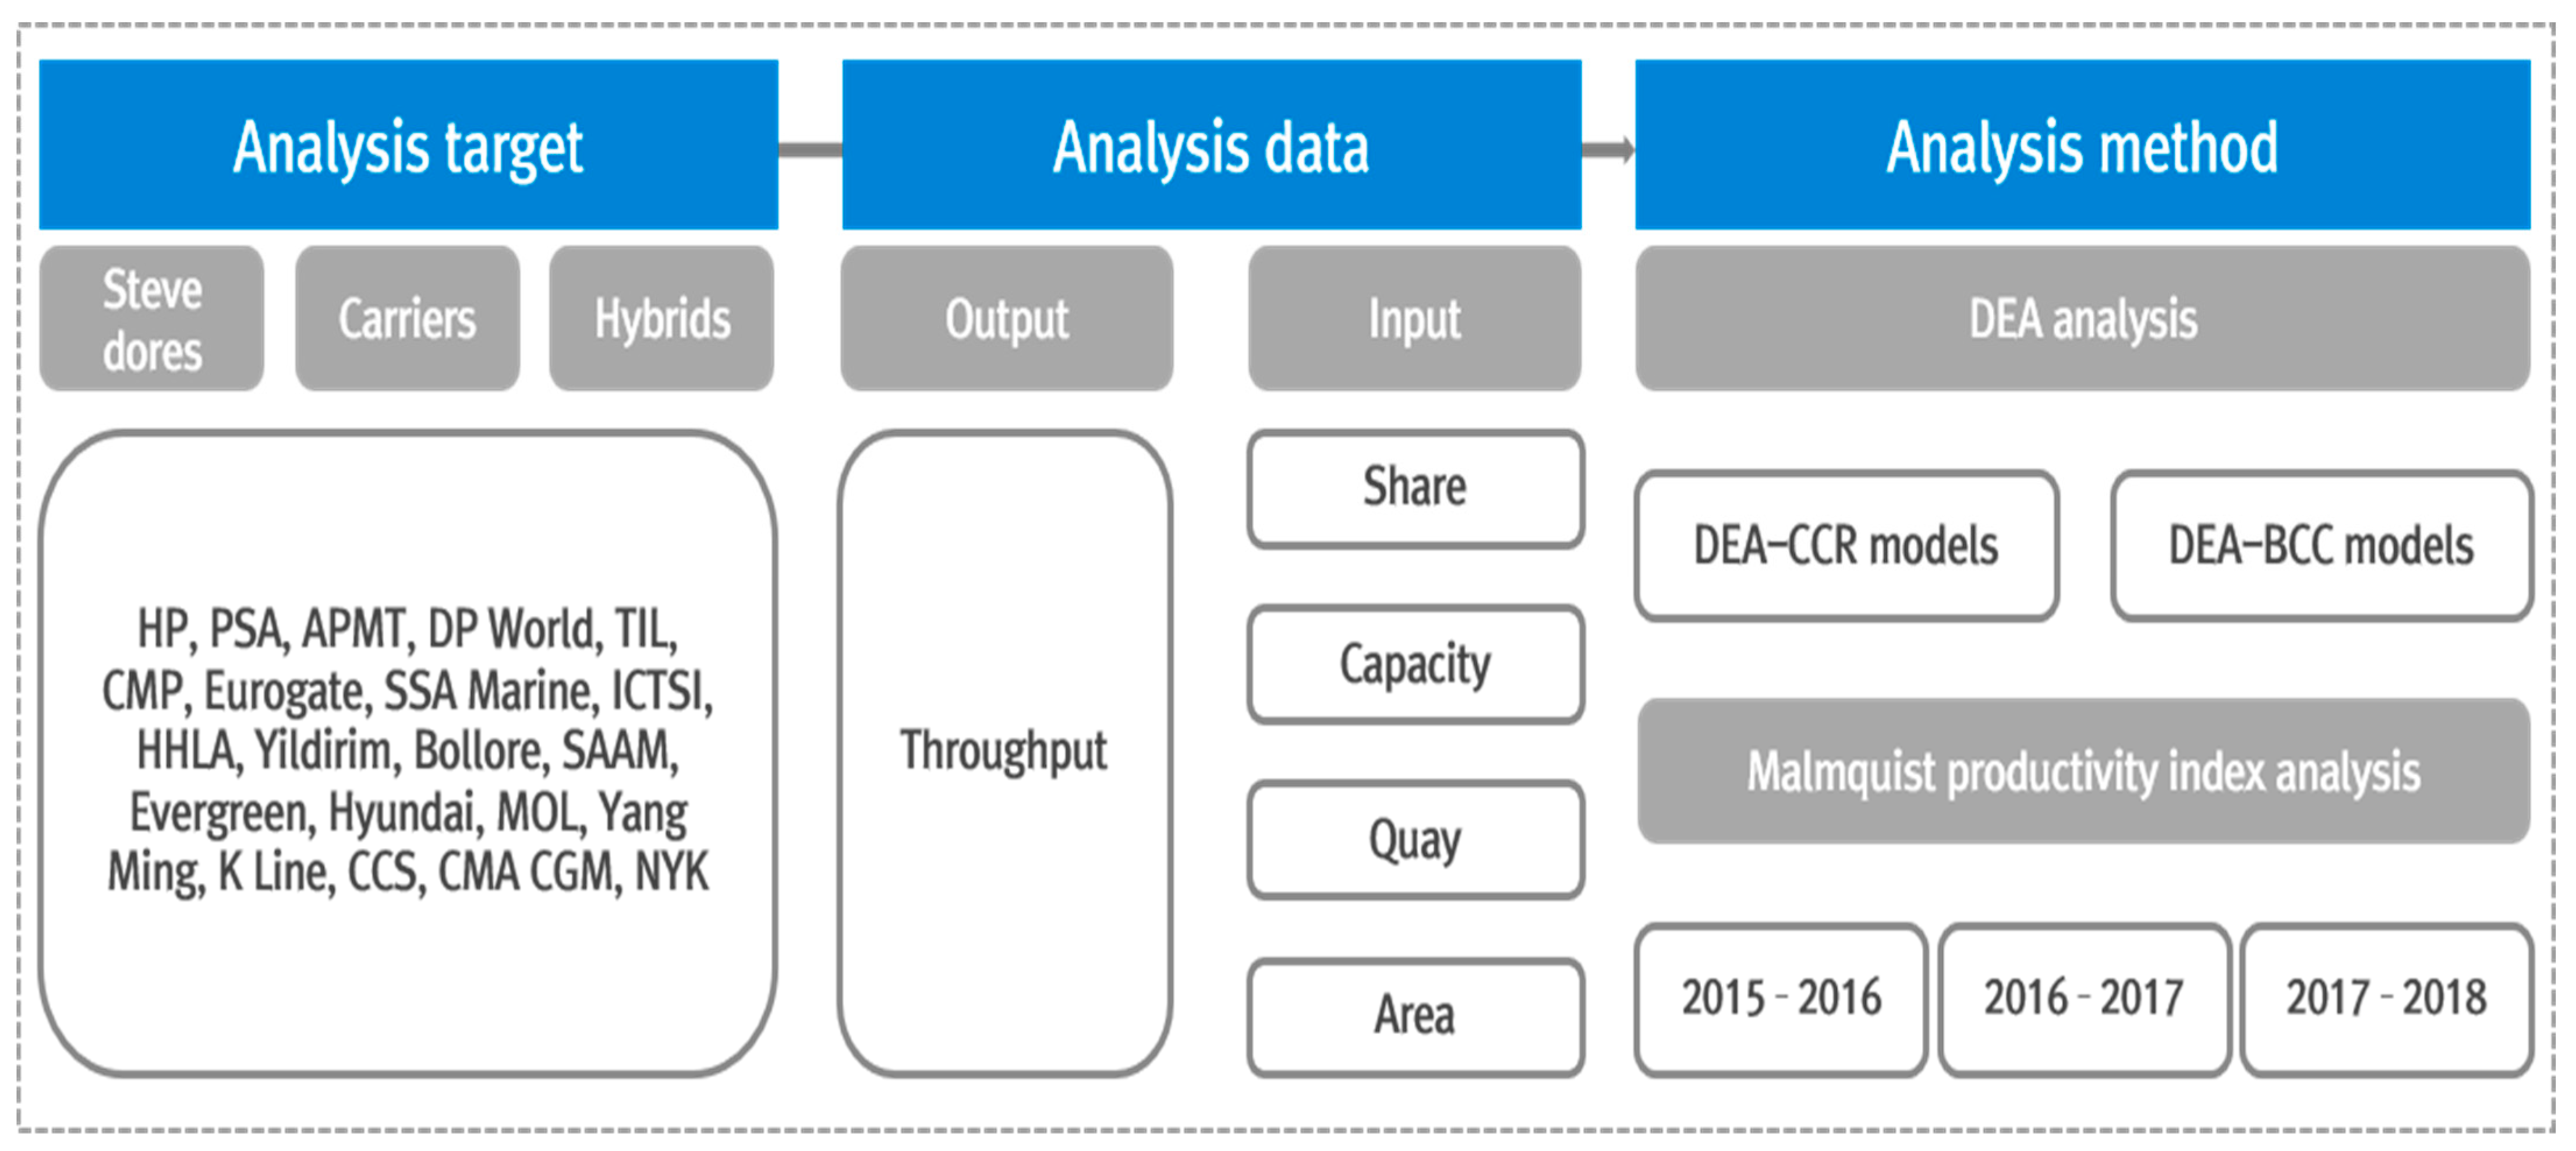
3.2. Analysis Target

The analysis of this study was conducted using the top 21 GTOs in throughput from the Drewry GTO Annual Report 2019. The GTOs were classified into stevedore, carrier, and hybrid types based on their operation characteristics. Because it is difficult to distinguish the roles of terminals, the operators were divided as per the characteristics of GTOs provided by Drewry in 2016–2019, as shown in Table 3. Although APMT GTOs were indicated as hybrids in Drewry considering they established a subsidiary in 2017, they were classified as stevedore GTOs in this study as they were considered functionally close to stevedores.

3.3. Analysis Data

The input and output variables are characterized by influencing the overall DEA because the adequacy of the variables directly influences the analysis result and accuracy for determining the value of the implications. Therefore, to secure the adequacy of variables, we selected variables based on the following principles:
First, we selected an appropriate number of variables considering the DMU. According to Banker et al. [33], analysis using DEA is reliable only if the sum of the inputs and outputs is at least three times the DMU [32]. Second, we selected variables that can be improved. Because the objective of DEA is to maximize the output by selecting and analyzing variables for the DMU and identifying relatively inefficient factors, the selected variables must be improved. Lastly, we selected variables based on objectivity, considering the variables must be directly related to the DMU, and subjective judgment should be avoided. Therefore, based on the above three principles and previous studies, we selected the share, berth length, terminal area, and capacity as input variables, and throughput as the output variable.
For the analysis data, the DMU, throughput, share, and capacity were determined using the Global Container Terminal Operators Annual Review and Forecast (2016–2019) by Drewry [6]. In addition, the berth length and terminal area were determined from the websites of each port, terminal, and operator, and by conducting interviews with the operators and terminal officials, from March 16 to May 1, 2020. Any unobtained variable data were excluded from the abilities of all operators to ensure reliability and accuracy. Because China Cosco Shipping existed in 2015, before the merging of China Shipping and the Cosco Group, the sum of inputs and outputs of China Shipping and the Cosco Group are shown in the table. The results of the basic statistics of the DMUs are shown in Table 4, and the DMU Basic datasets from 2015–2018 are shown in Table A1 and Table A2 (Appendix A).

3.4. Analysis Method

In this study, the efficiency of each operation characteristic was measured using the DEA-CCR and DEA-BCC models based on the DEAP 2.1 program. Further, the annual productivity index was measured by conducting the Malmquist productivity index analysis based on the data for 2015–2018, and the sustainability of each operation characteristic was examined based on the results. While the input and output were directly proportional in the CCR model because the constant returns to scale were assumed, they were not directly proportional in the BCC model because the variable returns to scale were assumed. However, neither model faced problems in econometric estimations. DEA models can be classified as input- and output-oriented. The output-oriented model, which is often used for ports or terminals where the input variables are half-fixed, was also used in this study. Figure 1 shows the flowchart of this research.

4. Results

4.1. GTO Basic Data by Operating Characteristics

GTOs are classified into stevedore, carrier, and hybrid types based on the operation characteristics. Because it is difficult to distinguish the activities of terminals, they were classified based on the operational characteristics of the GTOs by Drewry. Although APMT was established as a subsidiary and classified as a hybrid GTO, it was classified as a stevedore GTO in this study considering it is functionally close to stevedore GTO.
Table 5 summarizes the index for each operation characteristic of GTOs from 2015–2018. The increase rate was analyzed, and results showed that every operator exhibited a growing trend of freight volume and infrastructure. In particular, stevedore and carrier GTOs showed a growing trend in every index every year. Compared to 2017, hybrid GTOs showed a decrease in quay length and terminal area by 3143 m2 and 2802 m2, respectively, and an increase in share and throughput by 6.5 M TEU and 1.2%, respectively.

4.2. Operator Efficiency Based on Characteristics

Table 6 and Table 7 show the operator efficiency from 2015–2018 based on these characteristics. During 2015–2016, the efficiency of stevedore GTOs decreased from 0.924 to 0.844 and 0.942 to 0.877 in CCR and BCC, respectively, owing to insufficient port infrastructure with respect to the increased throughput. However, from 2016, the foundation for efficient operation of throughput and infrastructure was established by significantly increasing the terminal infrastructure. In particular, the representative stevedore GTOs, such as HP, ICTSI, PSA, and CMP, improved efficiency through agreements with ports and other terminal operators or acquiring terminals.
During 2015–2018, the efficiency of carrier GTOs increased from 0.763 to 0.843 in CCR. However, carrier GTOs exhibited low efficiency with an average CCR efficiency of 0.806 and a relatively high efficiency with an average BCC efficiency of 0.944 from 2015–2018. However, it was found that all carrier GTOs have an IRS status and require additional investment in the terminal infrastructure.
Among the three operating characteristics, hybrid GTOs exhibited the highest average CCR and BCC efficiencies of 0.913 and 0.930, respectively, from 2015–2018 as a result of the improved efficiency in CCS, which was launched when the Cosco Group and China Shipping Terminal Development merged in 2016. Furthermore, the efficiency improved as CMA CGM continuously acquired the shares of other ports and terminals. In particular, while the total berth length and terminal area of the hybrid GTOs in 2018 decreased compared to that in 2017, the share increased.

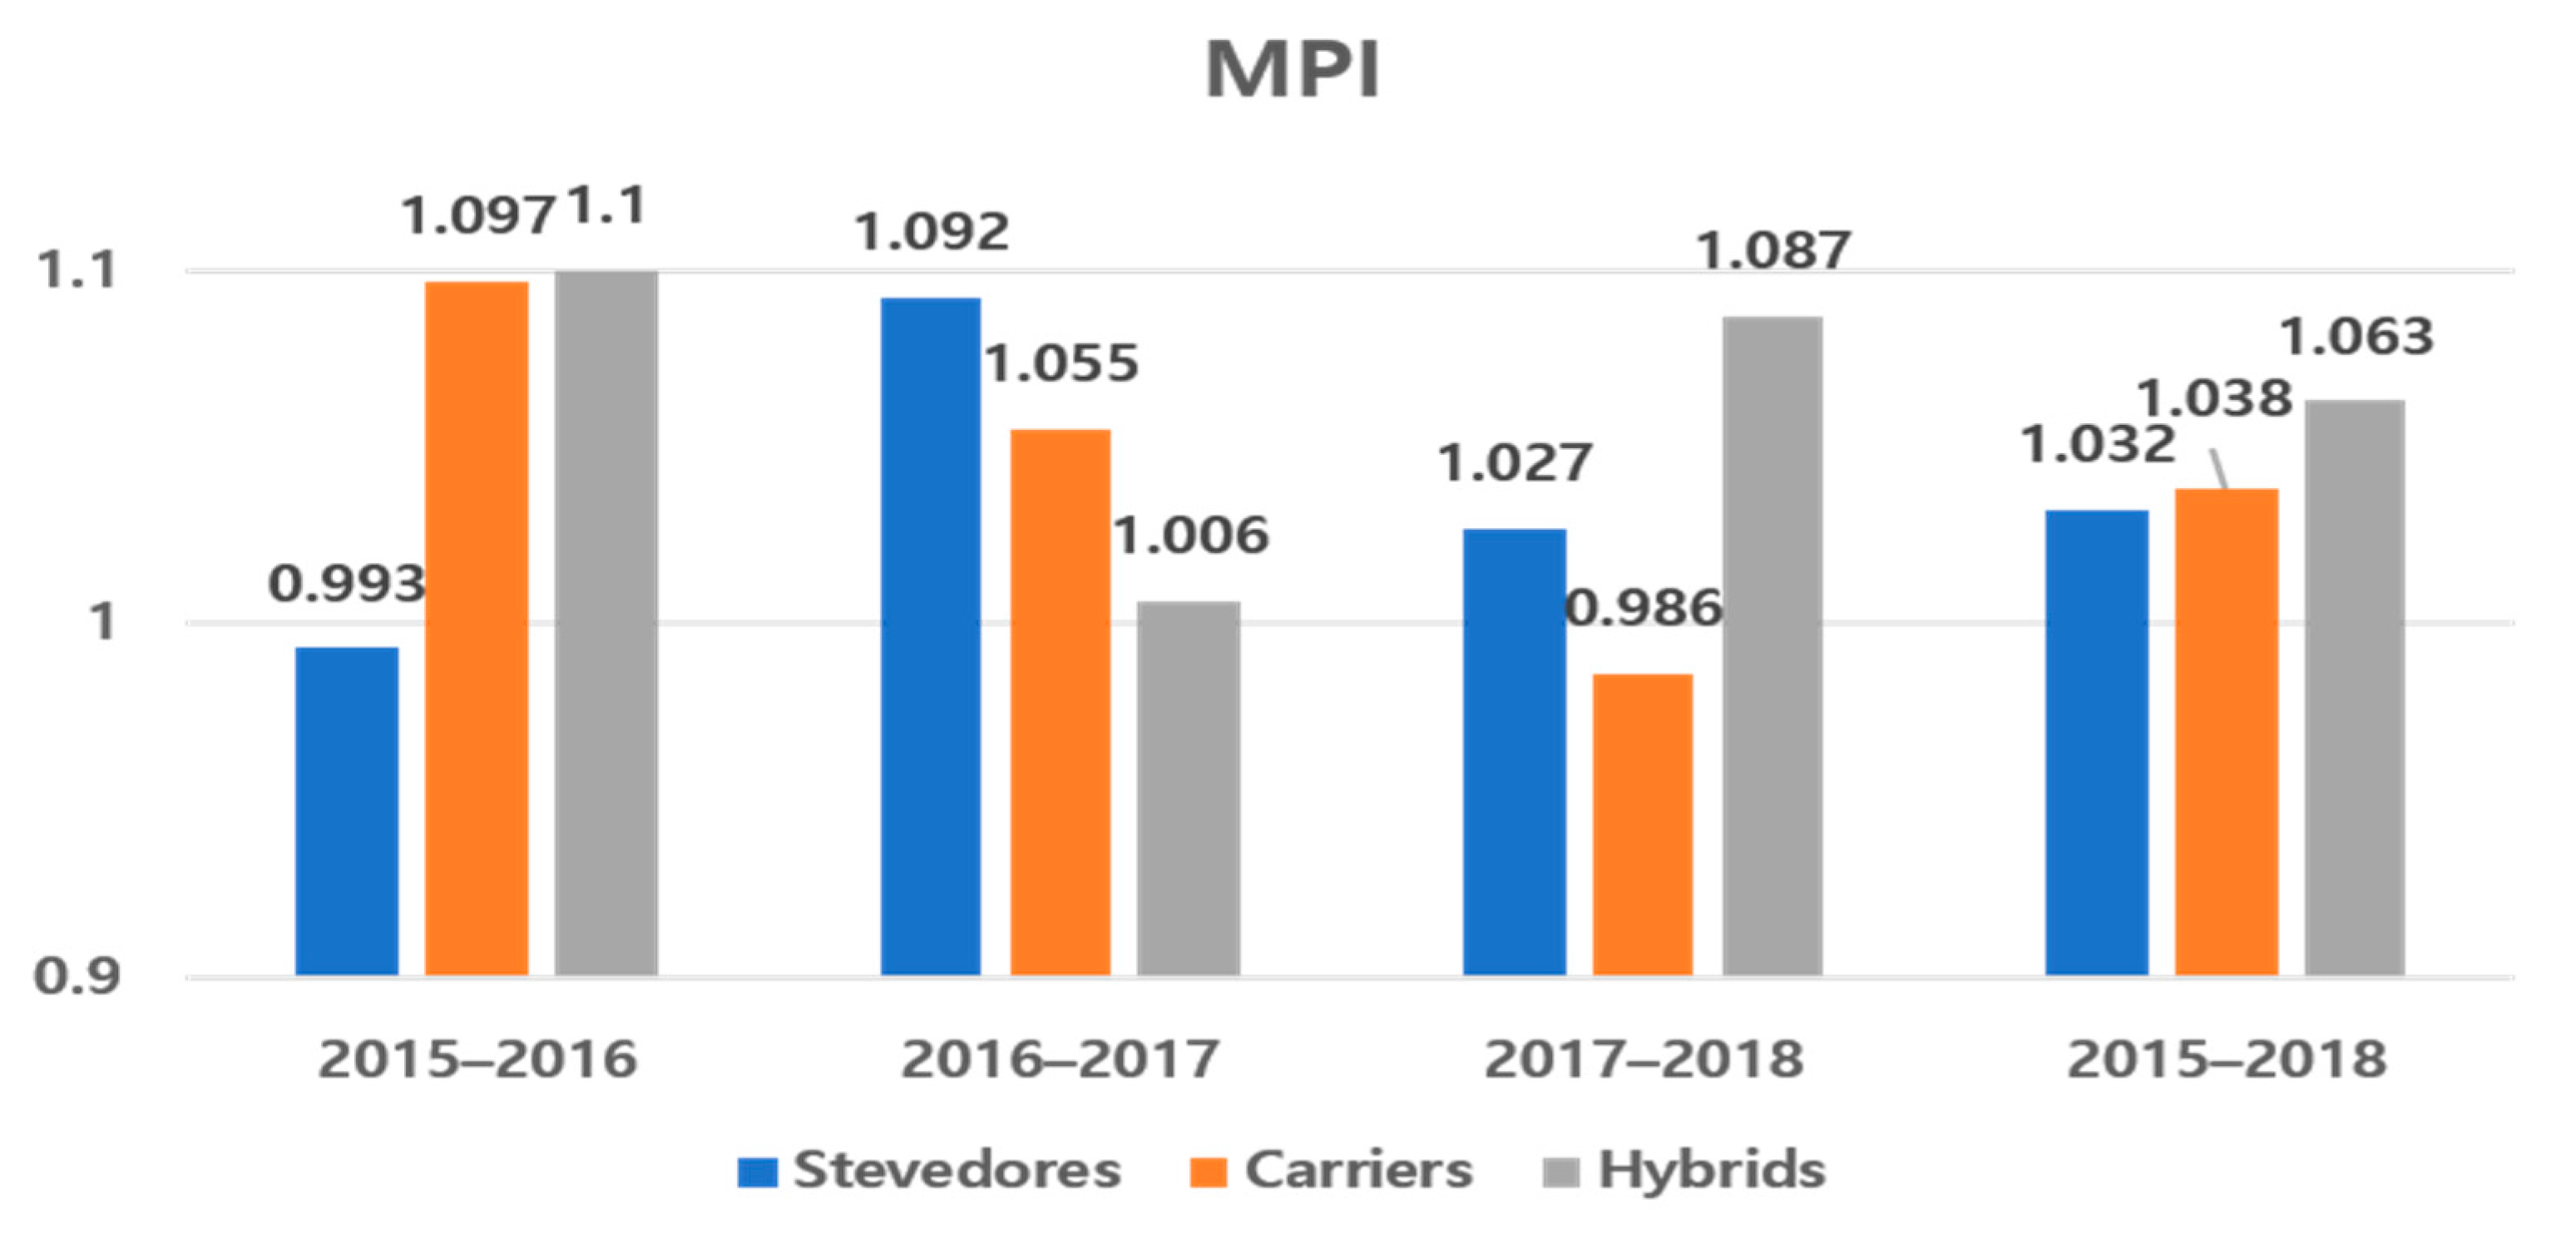
4.3. Malmquist Productivity Index Analysis

The Malmquist productivity index analysis demonstrates the total efficiency change (TEC) and technical change (TC) separately while assuming constant returns to scale (CRS). Total efficiency of less than 1 indicates improved productivity, and greater than 1 indicates decreased productivity. When the Malmquist productivity index analysis is performed in DEAP 2.1, the index and decomposition index are collectively decomposed into five indices. Effch (TECI) indicates a change in technical efficiency, techch (TCI) indicates a change in technology, pech (PECI) indicates a change in pure technology, sech (SECI) indicates a change in the efficiency of scale, and tfpch (MPI) indicates the change in total factor productivity, that is, the Malmquist index. In other words, tfpch less than 1 indicates improved productivity, tfpch=1 indicates conserved productivity, and tfpch greater than 1 indicates decreased productivity.
Table 8 lists the change in MPI of operators by characteristics in 2015–2018. The result of the Malmquist productivity index and decomposition index analyses for each operation characteristic shows that in 2016, the productivity of stevedore GTOs decreased by 0.7%, and that of the carrier and hybrid GTOs improved by 9.7% and 10%, respectively, compared to 2015. Most stevedore GTOs showed a decrease in productivity because they declined in every index except for technical change. In particular, DP World decreased in technical efficiency and pure technical changes by approximately 9%, resulting in an 8.2% decrease in productivity. In 2016, DP World tried increasing productivity by acquiring or increasing port terminal shares in Busan and Santos.
The result of the Malmquist productivity index and decomposition index analyses for each operation characteristic shows that in 2017, all three GTO types exhibited improved productivity, compared to 2016. In particular, the productivity of stevedore GTOs increased by 9.2%, and that of ICTSI increased by 51.4%. This may have been due to the acquisition of terminal shares and the development of infrastructure in the Manila, Lae, and Motukea ports.
The result of the Malmquist productivity index and decomposition index analyses for each operation characteristic shows that in 2018, the productivity of carrier GTOs decreased by 1.4% and that of the stevedore and hybrid GTOs improved by 2.7% and 8.7%, respectively, compared to 2017. The carrier GTOs showed decreased productivity due to a decreased technical change index. In particular, the productivity of the K Line decreased by 11.3%, because while the pure technical change index was preserved, all the other indices were declined.
The average of the Malmquist productivity index and decomposition index analyses for each operation characteristic indicates all three types of GTOs showed improved productivity from 2015–2018. Hybrid GTOs, in particular, preserved or improved the productivity decomposition index.

4.4. Analysis Results

The results of this study can be summarized as follows: When the efficiency of the GTOs was analyzed separately based on the operation characteristics, the efficiency of carrier GTOs was lower than that of the stevedore and hybrid GTOs in CCR (left side of Figure 2). However, the efficiency of carrier GTOs was higher than that of stevedore GTOs in BCC (right side of Figure 2). From 2017–2018, the efficiency of carrier GTOs increased from 0.822 to 0.843 in CCR and from 0.941 to 0.947 in BCC. Particularly, the relatively low growth rate of efficiency appeared more conspicuous in carrier GTOs efficiency than in other GTO types owing to the lack of terminal infrastructure, considering the objective of stevedore and hybrid GTOs is to create profits through terminal operation and that of carrier GTOs is to save costs by constructing a regional infrastructure network. In other words, these GTOs are inefficient considering their will to improve terminal efficiency is low. Stevedore GTOs showed a decrease in efficiency owing to an insufficient terminal infrastructure as compared to the freight volume, which has been steadily increasing since 2015. However, the efficiency was improved from 2017–2018 by significantly increasing the terminal infrastructure. Among the three GTO types, hybrid GTOs exhibited the highest average efficiency, which may be due to the efficiency improvement strategy through the acquisition of shares, instead of efficiency improvement and infrastructure expansion by merging existing GTOs.
Furthermore, the average Malmquist productivity index analysis of the GTOs from 2015–2018 showed that all three GTO types exhibited higher growth trends (Figure 3). Hybrid GTOs, in particular, showed a higher growth trend over the last year, indicating they have made considerable investments in building a system for efficient terminal operation, and that their strategy to improve efficiency by acquiring the shares of ports with complete infrastructure instead of expanding infrastructure was effective. The average productivity index of carrier GTOs increased by 3.8% from 2015–2018 but decreased by 1.4% in 2018, which may have been due to the lack of attention towards terminal technology and will to improve efficiency in carrier GTOs, compared to other GTO types. The productivity index in stevedore GTOs decreased by 0.7% in 2016 as compared to 2015 but later improved through full investment in terminal technology.

5. Conclusions

Owing to the increase in the uncertainty of shipping and port markets in recent years, trends such as the expansion of M&A, alliances among carriers, and full automation of terminals have changed rapidly to improve competitiveness in the shipping industry. GTOs are responding to the new environment by expanding port infrastructure by improving the terminal operation efficiency and increasing the unloading capacity. As a result, the container market share is rapidly increasing. The EBITDA of container terminals is considered an attractive item for attracting investors because it particularly shows sufficient profitability with a margin of up to 45% and is expected to grow rapidly through investments. However, owing to the business possibilities and importance of increasing efficiency, global companies are pursuing indiscriminate expansion and new businesses to develop and operate container terminals, which further promotes the inefficiency of container terminals. Therefore, to address the inefficiency of container terminals, it is desirable to present customized improvement measures by conducting an efficiency analysis of the current GTOs over the indiscriminate expansion of existing infrastructures.
Sustainable development and operations have become a central point of the strategic and operative management in port operations. In addition, operational issues are one of the main types of potential through which to gain competitive advantage from the sustainability practices in port operations. Therefore, in this study, DEA and a Malmquist index analysis were conducted on 21 GTOs to determine the characteristic that showed the highest efficiency and productivity. The aim of the study was to identify the limitations of each terminal’s operation characteristics and to derive a method of enhancing competitiveness for sustainable container terminal operation. Before the Malmquist productivity analysis, the DEA methodology was selected for efficiency analysis, and the input (share, quay, area, capacity) and output (throughput) variables were derived based on similar existing research. The GTO status and operational characteristics were then defined. For the analysis, the relative efficiency and productivity changes of the GTOs were analyzed to derive implications for the sustainable development of terminals according to their operation characteristics.
The analysis results indicated several implications that are distinct from findings on local terminal operators (for example, see Tongzon [8]). First, stevedore GTOs strived to secure terminal infrastructure to efficiently handle the steadily increasing freight volume, which solved the problem of a decrease in efficiency due to the lack of existing terminal infrastructures to an extent. However, due to excessive investments, GTOs such as HP, APMT, TIL, and SSA Marine with decreasing efficiency appear more frequently than other GTO types. The TCI decreased by 6.7% in 2018 compared to 2017, indicating their operational characteristics lacked improvement in efficiency, mostly through technical changes. Therefore, they require a terminal efficiency improvement strategy by combining fourth industrial revolution technologies, such as big data, AI, and a digital twin, over the expansion of infrastructure. Carrier GTOs exhibited a low will to acquire efficiency and improvement considering their main objective is to reduce costs, unlike other types of GTOs that focus on generating profits. However, ships are being enlarged worldwide due to the pursuit of economies of scale. Therefore, they are likely to be eliminated, unless preemptive measures are taken. It is necessary to establish an efficiency improvement strategy to secure terminal infrastructures while considering the enlargement of ships in priority in their major routes, by analyzing regions that carriers are likely to enter in the future and securing and expanding terminal infrastructures in those regions. Hybrid GTOs improved efficiency by establishing a systematic strategy through the acquisition of port shares. However, their TCI decreased by 0.9% in 2018 compared to 2017, indicating that effort was required to develop ports applying technical changes.
Although this study presents meaningful conclusions and implications based on the characteristics of GTOs, there are still a few limitations. Firstly, due to the difficulty in data collection, terminal information of GTOs was not obtained, which may have caused discrepancies from the actual data. However, we improved the reliability and accuracy of the results as much as possible by removing any terminal capacities that were not obtained in this study. In the future, a more reliable dataset should be constructed using all the terminal information from every GTO. This can provide variations of factors affecting efficiency by locations, countries, and volumes, to name a few. Furthermore, the regional implications according to the operation characteristics should be identified by investigating the status of investments in regional terminal infrastructures and prospects for regional freight volumes according to the operation characteristics of GTOs.

Author Contributions

Conceptualization, J.J. and Y.K.; software, M.S.; formal analysis, M.S.; investigation, J.J. and J.N.; resources, J.J.; data curation, J.N.; writing—original draft preparation, J.J.; writing—review and editing, Y.K. and Y.S.; supervision, Y.K. and Y.S.; funding acquisition, Y.S. All authors have read and agreed to the published version of the manuscript.

Funding

This research was supported by the 4th Educational Training Program for Shipping, Port, and Logistics from the Ministry of Oceans and Fisheries.

Institutional Review Board Statement

Not applicable.

Informed Consent Statement

Not applicable.

Data Availability Statement

The data presented in this study are available in this article and its Appendix A.

Conflicts of Interest

The authors declare no conflict of interest.

Appendix A

Table A1. 2015–2016 DMUs Basic Dataset.
Operator20152016
T’put
M teu
Share
%
Quay
m
Area
m2
Capa
M teu
T’put
M teu
Share
%
Quay
m
Area
m2
Capa
M teu
CCS93.713.054,71531,435104.396.612.259,78033,036106.8
HP67.111.859,09928,36290.565.711.359,79929,69788.1
PSA56.69.366,98135,98977.659.49.665,39134,42984.7
APMT64.810.160,96637,80979.964.710.260,38538,35882.6
DP World40.38.836,50122,34850.740.58.937,42322,80855.5
TIL35.75.338,17820,61350.137.25.439,10420,32554.0
CMP26.24.026,980806234.927.84.129,160847237.0
CMA CGM9.61.612,133541913.617.62.422,378856025.0
Eurogate14.62.019,414931723.614.62.019,414931723.8
SSA Marine10.61.514,488576518.410.61.514,488576517.8
NYK6.41.18886291610.69.11.411,073444913.7
Evergreen5.70.6717240449.85.41.37172404410.2
ICTSI7.81.016,037889013.58.71.216,387898514.0
Hyundai3.40.7243122614.83.60.4243122614.2
HHLA6.70.6725036959.96.81.0725036959.1
MOL4.60.6812440637.05.90.8812440638.6
Yildirim3.40.644877455.03.70.847878755.3
Bollore3.70.6915224166.23.70.6975224867.7
Yang Ming1.50.615007482.81.70.615007482.8
K Line1.50.4296211262.11.50.5296211262.1
SAAM2.70.4789416424.02.70.4789416424.2
Table A2. 2017–2018 DMUs Basic dataset.
Operator20172018
T’put
M teu
Share
%
Quay
m
Area
m2
Capa
M teu
T’put
M teu
Share
%
Quay
m
Area
m2
Capa
M teu
CCS91.712.256,80932,810101.095.413.553,05129,828110.2
HP68.911.060,57529,74493.879.410.564,66531,281107.3
PSA67.09.963,14132,45792.480.110.264,24633,651112.1
APMT67,210,261,68638,83684.673.910.062,51539,59988.6
DP World47.69.239,93324,02859.846.78.941,07123,62858.9
TIL44.75.950,73923,01559.548.56.153,28224,84064.5
CMP31.44.230,824930838.532.64.430,824930938.5
CMA CGM20.83.323,002880227.422.93.323,617898227.9
Eurogate14.41.920,214965724.314.11.720,214965722.6
SSA Marine11.12.015,044609518.812.21.616,069669519.3
NYK10.51.511,523476915.011.31.411,523476913.3
Evergreen6.31.47172404410.26.51.37172404410.8
ICTSI13.81.017,099869915.49.71.217,589890017.1
Hyundai5.20.8535541566.86.21.0474537887.6
HHLA7.31.0725036959.57.41.08346407510.3
MOL7.10.9812440639.67.30.98874451310.0
Yildirim3.80.847878755.74.10.847878755.7
Bollore4.10.6975224867.84.70.710,10226668.3
Yang Ming1.70.615007482.81.70.615007482.8
K Line1.80.5296211262.11.90.4296211262.5
SAAM3.20.4869417625.03.40.4719114895.4

References

  1. Arvis, J.F.; Ojala, L.; Wiederer, C.; Shepherd, B.; Raj, A.; Dairabayeva, K.; Kiiski, T. Connecting to Compete 2018: Trade Logistics in the Global Economy; World Bank: Washington, DC, USA, 2018. [Google Scholar]
  2. González-Cancelas, N.; Molina Serrano, B.; Soler-Flores, F.; Camarero-Orive, A. Using the SWOT methodology to know the scope of the digitalization of the Spanish ports. Logistics 2020, 4, 20. [Google Scholar] [CrossRef]
  3. Wang, C.; Nguyen, N.; Fu, H.; Hsu, H.; Dang, T. Efficiency assessment of seaport terminal operators using DEA Malmquist and epsilon-based measure models. Axioms 2021, 10, 48. [Google Scholar] [CrossRef]
  4. Cullinane, K.; Khanna, M. Economies of scale in large container ships: Optimal size and geographical implications. J. Transp. Geogr. 2000, 8, 181–195. [Google Scholar] [CrossRef]
  5. Pham, T.; Yeo, G. Evaluation of transshipment Container Terminals’ Service Quality in Vietnam: From the Shipping Companies’ Perspective. Sustainability 2019, 11, 1503. [Google Scholar] [CrossRef] [Green Version]
  6. Global Container Terminal Operators Annual Review and Forecast 2016–2019. Available online: https://www.drewry.co.uk/maritime-research-products/maritime-research-products (accessed on 28 July 2021).
  7. Grubisic, N.; Krljan, T.; Maglić, L.; Vilke, S. The microsimulation model for assessing the impact of inbound traffic flows for container terminals located near city centers. Sustainability 2020, 12, 9478. [Google Scholar] [CrossRef]
  8. Sim, K.S.; Kim, Y.H.; Kim, B.K. A Study on the Establishment of Global Terminal Operator(GTO) in Korea. Available online: https://www.kmi.re.kr/web/board/view.do?rbsIdx=287&idx=37082 (accessed on 26 April 2021).
  9. Kim, S. Sustainable Port Competitiveness in International Port Operations. J. Korea Port Econ. Assoc. 2015, 31, 61–74. [Google Scholar]
  10. Kang, D.; Kim, S. Conceptual Model Development of Sustainability Pratices: The Case of Port Operations for Collaboration and Governance. Sustainability 2017, 9, 2333. [Google Scholar] [CrossRef] [Green Version]
  11. Kim, S.; Chiang, B.G. Sustainability Practices to achieve Sustainability in International Port Operations. Korea Pt. Econ. Assoc. 2014, 30, 15–37. [Google Scholar]
  12. Yeo, H.J. Participation of private investors in container terminal operation: Influence of global terminal operators. Asian J. Shipp. Logist. 2015, 31, 363–383. [Google Scholar] [CrossRef] [Green Version]
  13. Low, J.M.W.; Lam, S.W.; Tang, L.C. Assessment of hub status among Asian ports from a network perspective. Transp. Res. A 2009, 43, 593–606. [Google Scholar] [CrossRef]
  14. ITF Transport Outlook 2019. Available online: https://www.oecd-ilibrary.org/transport/itf-transport-outlook-2019_transp_outlook-en-2019-en (accessed on 25 April 2021).
  15. Review of Maritime Transport 2020. Available online: https://unctad.org/webflyer/review-maritime-transport-2020 (accessed on 25 April 2021).
  16. Notteboom, T.; Rodrigue, J.P. Global Networks in the Container Terminal Operating Industry Part 2: The Future Direction of Terminal Networks. Available online: https://www.porttechnology.org/technical-papers/global_networks_in_the_container_terminal_operating_industry/ (accessed on 26 April 2021).
  17. Kim, Y.S.; Zheng, X.B.; Shin, Y.R. Efficiency and productivity changes of domestic container terminal operators by GTO characteristics. Asian J. Shipp. Logist. 2017, 33, 555–575. [Google Scholar]
  18. Tongzon, J.L. Determinants of port performance and efficiency. Transp. Res. A 1995, 29, 245–252. [Google Scholar] [CrossRef]
  19. Antonio, E.; Beatriz, T.F.; Lourdes, T. Sources of Efficiency Gains in Port Reform: A DEA Decomposition of a Malmquist TFP Index for Mexico. Util. Policy 2004, 12, 221–230. [Google Scholar]
  20. Cullinane, K.P.B.; Wang, T. The efficiency of European container ports: A cross-sectional data envelopment analysis. Int. J. Logist. Res. Appl. 2006, 9, 19–31. [Google Scholar] [CrossRef]
  21. Mennis, E.; Platis, A.; Lagoudis, I.; Nikitakos, N. Improving port container terminal efficiency with the use of markov theory. Marit. Econ. Logist. 2008, 10, 243–257. [Google Scholar] [CrossRef]
  22. Ahmed, S.A.-E.; Ahamad, T.K.; Adli, M. DEA Malmquist index measurement in Middle East and East African containers terminals. Int. J. Shipp. Transp. Logist. 2009, 1, 249–259. [Google Scholar]
  23. Cheon, S.H.; David, E.D.; Song, D.W. Evaluating impacts of institutional reforms on port efficiency changes: Ownership, corporate structure, and total factor productivity changes of world container ports. Transp. Res. Part E Logist. Transp. Rev. 2010, 46, 546–561. [Google Scholar] [CrossRef]
  24. Qianwen, L. Efficiency Analysis of Container Ports and Terminals. Ph.D. Thesis, University College London, London, UK, 2010. [Google Scholar]
  25. Wilmsmeier, G.; Tovar, B.; Sanchez, R.J. The evolution of container terminal productivity and efficiency under changing economic environments. Res. Transp. Bus. Manag. 2013, 8, 50–66. [Google Scholar] [CrossRef]
  26. Bichou, K. An empirical study of the impacts of operating and market conditions on container-port efficiency and benchmarking. Res. Transp. Econ. 2013, 42, 28–37. [Google Scholar] [CrossRef]
  27. Yuen, A.C.; Zhang, A.; Cheung, W. Foreign participation and competition: A way to improve the container port efficiency in China? Transp. Res. A 2013, 49, 220–231. [Google Scholar] [CrossRef]
  28. Chang, V.; Tovar, B. Efficiency and productivity changes for Peruvian and Chilean ports terminals: A parametric distance functions approach. Transp. Policy 2014, 31, 83–94. [Google Scholar] [CrossRef]
  29. Samuel, M.N. Factors influencing container terminals efficiency: A case study of Mombasa entry port. Eur. J. Logist. Purch. Supply Chain. Manag. 2014, 2, 39–78. [Google Scholar]
  30. Lin, Y.; Yan, L.; Wang, Y. Performance evaluation and investment analysis for container port sustainable development in China: An inverse DEA approach. Sustainability 2019, 11, 4617. [Google Scholar] [CrossRef] [Green Version]
  31. Park, R.K. A Brief Efficiency Measurement Way for the Korean Container Terminals Using Stochastic Frontier Analysis. J. Korea Port Econ. Assoc. 2010, 26, 63–87. [Google Scholar]
  32. Charnes, A.; Cooper, W.W.; Rhodes, E. Measuring the efficiency of decision making units. Eur. J. Oper. Res. 1978, 2, 429–444. [Google Scholar] [CrossRef]
  33. Banker, R.D.; Charnes, A.; Cooper, W.W. Some models for estimating technical and scale inefficiencies in data envelopment analysis. Manag. Sci. 1984, 30, 1078–1092. [Google Scholar] [CrossRef] [Green Version]
  34. Rolf, F.; Shawna, G.; Mary, N.; Zhongyang, Z. Productivity growth, technical progress, and efficiency change in industrialized countries. Am. Econ. Rev. 1994, 84, 66–83. [Google Scholar]
Figure 1. Research steps.
Sustainability 14 00536 g001
Figure 2. DEA of the GTOs from 2015 to 2018 based on the characteristics.
Sustainability 14 00536 g002
Figure 3. Malmquist productivity index analysis of the GTOs from 2015 to 2018 based on the characteristics.
Sustainability 14 00536 g003
Table 1. GTOs categorized based on operational characteristics.
StevedoresCarriersHybrids
Main activityTerminal operationLiner shippingLiner shipping
(Separate terminal operation)
Financial aimGenerate profitReduce costGenerate profit
Efficiency aimImproved terminal efficiency by implementing common practicesImproved shipping network efficiency over terminalsImproved terminal efficiency by implementing common practices
Network aimSpread of investment riskSupport for shipping activities and strategy Support for shipping activities and additional business opportunities
Table 2. Summary of previous studies that used DEA.
AuthorMethodTargetOutput VariableInput Variable
Kim et al.
[17]
DEA,
Malmquist index
23 container operators worldwideThroughputBerth length,
CY area,
G/C and T/C index
Antonio et al.
[19]
DEA, Malmquist index11 Mexican main portsThroughput Number of workers,
berth length
Cullinane and Wang
[20]
DEA69 container terminals in EuropeThroughputTerminal length,
terminal area,
equipment
Ahmed et al.
[22]
DEA, Malmquist index22 container terminals in
the Middle
East and East Africa
Ship calls,
throughput
Berth length,
quay crane,
handling equipment,
terminal area
Cheon et al.
[23]
DEA, Malmquist index98 ports worldwideThroughputBerth length,
terminal area,
container quayside capacity,
mobile cranes
Wilmsmeier et al.
[25]
DEA,
Malmquist
index
20 container terminals in Latin America, the Caribbean, and SpainThroughputTerminal area,
ship-to-shore crane capacity equivalent,
number of workers
Bichou
[26]
DEA60 container terminals worldwideThroughputTerminal area,
max draft,
overall length,
quay crane index,
yard-stacking index,
trucks & vehicles,
gates
Yuen et al.
[27]
Regression analysis,
DEA
21 major container terminals in and around ChinaThroughputNumber of berths,
total length,
port land area,
quay crane, and
yard gantries
Lin et al.
[30]
IDEA16 main ports in ChinaThroughputBerth length,
equipment asset,
Number of employees
Table 3. Classification of GTOs based on operating characteristics.
OperatorAbbreviation
StevedoresHutchison PortsHP
PSA InternationalPSA
APM TerminalsAPMT
DP WorldDP World
Terminal Investment LimitedTIL
China Merchants PortsCMP
EurogateEurogate
SSA MarineSSA Marine
ICTSIICTSI
HHLAHHLA
YildirimYildirim
BolloreBollore
SAAMSAAM
CarriersEvergreenEvergreen
HyundaiHyundai
MOLMOL
Yang MingYang Ming
K LineK Line
HybridsChina Cosco ShippingCCS
CMA CGMCMA CGM
NYKNYK
Note 1: Considering the length of the table, the GTO names have been abbreviated.
Table 4. Basic statistics of the DMUs from 2015–2018 analysis target.
OutputInput
T’put (M teu)Share (%)Quay (m)Area (m2)Capa (M teu)
2015Sum466.672.1465,350237,665619.5
Avg22.2193.433322,15911,31729.5
Max93.711.866,98137,809104.3
Min1.50.415007452.1
Mid7.81.412,133541913.5
St Dev5.88960.8491471027247.1107
2016Sum487.576.6486,654245,141657.2
Avg23.21433.647623,17411,67331.2952
Max96.612.265,39138,358106.8
Min1.50.415007482.1
Mid9.11.414,488576514
St Dev5.9360.8986473527307.2785
2017Sum529.679.3506,185251,175690
Avg25.2193.776224,10411,96132.8571
Max91.712.263,14138,836101
Min1.70.415007482.1
Mid11.11.515,044609515.4
St Dev6.04280.8964478027147.4389
2018Sum57079.9514,345254,463743.7
Avg27.14293.804824,49212,11735.4143
Max95.413.564,66539,599112.1
Min1.70.41,5007482.5
Mid11.31.416,069669517.1
St Dev30.6164.209322,34512,54538.4083
Table 5. Summary and growth rate of GTOs based on operation characteristics from 2015–2018.
CharacteristicYearT’put
(M teu)
Share
(%)
Quay
(m)
Area
(m2)
Capa
(M teu)
Stevedores2015340.256.5367,427185,653464.3
2016346.157.0371,234186,854502.5
2017384.457.8389,738190,657515.2
2018416.957.5400,901196,665558.8
CAGR (%)71326
Carriers201516.73.722,18912,24226.5
201618.13.622,18912,24227.9
201722.14.225,11314,13731.5
201823.64.225,25314,21933.7
CAGR (%)124458
Hybrids2015109.715.775,73439,770128.7
2016123.316.093,23146,045145.5
2017123.017.091,33446,381143.3
2018129.518.288,19143,579152.3
CAGR (%)65536
Notes: The decrease and increase in 2018 compared to 2017 are highlighted in bold and bold italics, respectively.
Table 6. 2015–2016 Operator efficiency based on characteristics.
CharacteristicOperator20152016
CCRBCCSERTSCCRBCCSERTS
StevedoresHP0.8250.8260.999IRS0.8240.8251CRS
PSA0.8430.8441CRS0.7770.7800.996DRS
APMT0.9030.9040.999IRS0.8660.8670.999IRS
DP WORLD0.8850.8890.996IRS0.8070.8080.998IRS
TIL0.9300.9310.999CRS0.8290.8650.959DRS
CMP0.98010.980DRS111CRS
Eurogate111CRS0.8450.9010.939DRS
SSA Marine0.9730.9830.989IRS0.8480.8640.981DRS
ICTSI0.9710.9870.985IRS0.8060.8780.917DRS
HHLA0.92410.924IRS0.8360.8470.987IRS
Yildirim111CRS111CRS
Bollore0.8490.8870.957IRS0.7300.7700.948IRS
SAAM0.93010.930IRS0.80110.801IRS
AVG0.9240.9420.981 0.8440.8770.965
CarriersEvergreen0.6470.6750.959IRS0.5850.5980.979IRS
Hyundai0.81710.817IRS111CRS
MOL0.9060.9660.938IRS0.8390.8740.960DRS
Yang Ming0.65110.651IRS0.75910.759IRS
K Line0.79510.795IRS0.79010.790IRS
AVG0.7630.9280.832 0.7950.8940.898
HybridsCCS111CRS111CRS
CMA CGM0.8310.8460.981IRS0.8910.9090.980DRS
NYK0.8060.8540.944IRS0.8030.8310.967IRS
AVG0.8790.9000.975 0.8980.9130.982
Table 7. 2017–2018 Operator efficiency based on characteristics.
CharacteristicOperator20172018
CCRBCCSERTSCCRBCCSERTS
StevedoresHP0.8250.8310.993DRS0.9830.9910.993DRS
PSA0.8380.8880.943DRS111CRS
APMT0.8750.8751CRS0.97410.974DRS
DP WORLD0.8770.8770.999IRS0.9160.9180.998IRS
TIL0.8690.9490.916DRS0.98110.981DRS
CMP111CRS111CRS
Eurogate0.7810.7820.998DRS111CRS
SSA Marine0.8270.8570.965IRS0.9330.9380.995DRS
ICTSI111CRS0.9640.9710.992DRS
HHLA0.86510.865IRS0.9160.9660.948IRS
Yildirim111CRS111CRS
Bollore0.7580.8350.907IRS0.8070.8120.994DRS
SAAM0.86710.867IRS111CRS
AVG0.8760.9180.954 0.9580.9660.992
CarriersEvergreen0.6800.7080.960IRS0.6970.7370.945IRS
Hyundai0.84310.843IRS0.94210.942IRS
MOL0.8610.9970.863IRS0.99310.993IRS
Yang Ming0.78110.781IRS0.70310.703IRS
K Line0.94410.944IRS0.87810.878IRS
AVG0.8220.9410.878 0.8430.9470.892
HybridsCCS111CRS111CRS
CMACGM0.8400.8630.973IRS0.9520.9550.997IRS
NYK0.8590.9270.926IRS111CRS
AVG0.8940.9160.975 0.9820.9890.993
Note: The average efficiency by operation characteristic is highlighted in bold.
Table 8. Average MPI and decomposition index of operators from 2015–2018 based on the characteristic.
CharacteristicYearEffch (TECI)Techch (TCI)Pech (PECI)Sech (SECI)Tfpch (MPI)
Stevedores2015–20160.9141.0920.9310.9820.993
2016–20171.0401.0481.0460.9961.092
2017–20181.1020.9331.0651.0371.027
2015–20181.0131.0191.0101.0031.032
Carriers2015–20161.0421.0540.9581.0851.097
2016–20171.0511.0021.0650.9891.055
2017–20181.0250.9671.0091.0160.986
2015–20181.0331.0051.0081.0251.038
Hybrids2015–20161.0231.0751.0161.0081.100
2016–20171.0041.0021.0220.9841.006
2017–20181.0990.9911.0611.0351.087
2015–20181.0401.0211.0321.0081.063
Publisher’s Note: MDPI stays neutral with regard to jurisdictional claims in published maps and institutional affiliations.

