Article

Research Trends on Climate Change and Circular Economy from a Knowledge Mapping Perspective

by
Felipe Romero-Perdomo
1,2,
Juan David Carvajalino-Umaña
1,
Jaime Leonardo Moreno-Gallego
3,4,
Natalia Ardila
5 and
Miguel Ángel González-Curbelo
1,*
1
Departamento de Ciencias Básicas, Facultad de Ingeniería, Universidad EAN, Bogotá 110221, Colombia
2
Corporación Colombiana de Investigación Agropecuaria (AGROSAVIA)-Tibaitatá, Mosquera 250047, Colombia
3
Max Planck Tandem Group in Computational Biology, Department of Biological Sciences, Universidad de los Andes, Bogotá 111711, Colombia
4
Department of Microbiome Science, Max Planck Institute for Developmental Biology, 72076 Tübingen, Germany
5
Pacto Global Red Colombia, Organización de las Naciones Unidas, Bogotá 110221, Colombia
*
Author to whom correspondence should be addressed.
Sustainability 2022, 14(1), 521; https://doi.org/10.3390/su14010521
Submission received: 10 November 2021 / Revised: 15 December 2021 / Accepted: 17 December 2021 / Published: 4 January 2022

Abstract

:
The circular economy (CE) has been proposed as a potentially significant catalyst to enhance the current response to the global climate crisis. The objective of this study was to investigate the scientific literature of the research between climate change and CE adopting a knowledge mapping approach. Based on a total of 789 peer-reviewed publications extracted from Scopus, we found that research on climate change and CE is continually growing and interdisciplinary in nature. Europe notably leads scientific production. Keyword evolution shows that CE has been influenced by more lines of research than climate change. We also found that waste management is the CE approach most associated with climate change, mitigation is the climate action most impacted by CE, and food is the most reported greenhouse gas (GHG)-emitting material. However, there are knowledge gaps in the integration of the social dimension, the promotion of climate change adaptation, and the association of sustainable development goal (SDG) 13. Finally, we identified four potentially valuable directions for future studies: (i) CE practices, (ii) bioeconomy, (iii) climate and energy, and (iv) sustainability and natural resources, in which carbon recovery technologies, green materials, regional supply chains, circular agriculture models, and nature-based solutions are promising themes.

1. Introduction

Climate change is now emerging as the most severe challenge facing our planet during the 21st century and requires efforts from science, decision makers in the public sector, and society [1]. The Intergovernmental Panel on Climate Change has reported that anthropogenic processes are the main cause of climate change [2]. The growth in global greenhouse gas (GHG) emissions in 2019 continued at a rate of 1.1%, reaching 57.4 GtCO2 equivalents per unit [3]. This amount was 59% higher than in 1990 and 44% higher than in 2000, where the three regions with the largest GHG emissions were China (27%), the United States (13%), and the European Union (8%). The human activity that generates the most concern is the industrial one with its CO2 emissions [4]. Industry is a vital human activity of any economy that has traditionally had an extractive character based on the ‘take-make-waste’ system [5]. The growing economies of countries are increasingly demanding industrial commodities and materials such as aluminum, cement, steel, and plastics to underpin transportation systems, infrastructure, factories, and buildings [6]. It has been recorded, for example, that steel production grew by 40%, cement by 300%, and global demand for plastics by 50% in the last 10 years, indicating that approximately 100 billion tons of materials entered the global economy [7]. The rise in the use and production of materials and goods has main implications for CO2 emissions and dampens the ambitious goal of the Paris Agreement to limit temperature increase to well below 2 °C (aim of 1.5 °C) and transition to a low-carbon economy [8].
The substantial GHG emissions from the production of materials have caused an intense debate on how to improve the impact of current climate strategies [9]. In Europe, policy discussions and proposed roadmaps have focused on the supply side, for example, increasing energy efficiency and promoting the use of raw materials and non-fossil fuels [10]. However, these strategies only offer a partial solution. Innovative programs focused on the demand side are needed to achieve better use and reuse of materials, and thus reduce our need for new production [6].
The circular economy (CE) represents a promising alternative to may deliver GHG emissions reductions by changing the traditional production and consumption model for a more sustainable one [11]. CE seeks to change the predominant linear and extractive economic model because it is based on the reuse of biological and technological resources for as long as possible in closed-loop systems [12]. Geissdoerfer et al. [13] define CE as “a regenerative system that minimizes resource input and waste, emissions, and energy leakage by slowing, closing, and narrowing material and energy loops”. To make CE possible, a lot of effort is required to embrace dematerialization, rethink ownership concept, and move from resource efficiency to resource sufficiency [14]. According to the Ellen Macarthur Foundation [15], applying CE strategies in the management of cement, aluminum, steel, plastics, and food could eliminate almost half of the remaining emissions from the production of goods: 9.3 billion tons of CO2-eq in 2050, equivalent to reducing current emissions from all transportation to zero; nevertheless, the world is only 8.6% circular [16]. The slow growth in CE adoption does not allow GHG emissions and the carbon footprint to decrease significantly to mitigate the effects of climate change [17]. Based on the growing need for CE, policymakers and scientists have become more interested in formulating and executing research strategy agendas in various countries such as the Netherlands, Germany, China, Chile, and Colombia [18,19].
Recently, the number of publications that integrate climate change and CE has expanded rapidly [20]. How to mitigate climate change from a circularity perspective has become a trending topic [21]. Various aspects have been addressed, such as the conversion of waste-to-energy, city-level policies, application of eco-innovations, quantitative methodological frameworks, and definition of circular indicators in economic sectors such as agriculture and construction [22,23,24,25,26,27]. Although these findings show an interaction between climate change and CE, there is a gap in studies that reveal the dynamics of global research between them to explicitly explore their interconnection, observe trends, and identify challenges. The computational literature review and content analysis using recognized methodologies such as bibliometrics, scientometrics, and scientific landscapes respond to this need [28]. Bibliometrics is the study of the relationship and use of numbers and patterns in bibliographic data, e.g., growth of literature and database usage [29]. Scientometrics is a discipline that quantifies scientific research personnel and achievements to reveal the process of scientific development using mathematical and statistical algorithms [30]. Scientific landscapes are graphical representations that reflect the structure, evolution, and main actors of a given scientific field. Additionally, innovation in information and knowledge management for research has generated complementary analysis based on text mining [31].
The present research addressed the knowledge gap using a mixed-method approach. We consolidated insights from bibliometrics, scientometrics, scientific landscapes, and text mining to provide a map of the scientific background on the research between climate change and CE over the last decade. Accordingly, we identified major trends in research lines, knowledge gaps, and potentially valuable directions for future studies.

2. Materials and Methods

2.1. Literature Search Strategy

The most important factor to perform a bibliometric analysis is the search equation. Therefore, its definition requires a rigorous process of selection of keywords. A search equation also includes the use of Boolean operators such as OR and to facilitate and enable the correct selection of the documents of interest, the truncation symbol (*) to find words in both singular and plural and the proximity operator (“ “) to search for an exact sentence. In this study, the search equation was defined according to the strategy called “interactive query formulation” [32,33]. Thereby, consecutive searches were carried out that were integrating keywords according to their frequency of occurrence and thus defining the set of the most relevant keywords (Figure S1). The equation consisted of two parentheses, composed of keywords for climate change and CE, respectively. The search equation (1) defined was the following:
(“climat* chang*” OR “climat* warming*” OR “climat* polic*” OR “climat* negotiat*” OR “climat* mitigat*” OR “climat* adapta*” OR “climat* resilience” OR “climat* vulnerability” OR “global warming*” OR “Greenhouse effect*” OR “Greenhouse gas*” OR “sustainable development goal 13” OR “sdg 13” OR “climat* action”) AND (“circular *econom*”)
Scopus was selected as the database because it collects the largest number of documents (789) on this topic compared to Web of Science (614). The search was performed on a single day (7 July 2021) to avoid bias caused by daily database updates, it was limited by the year of publication (between 2010 and 2020) and language (English), and the search scope was “topic”, which included the title, abstract, and keywords. Once the final set of peer-reviewed journal publications was obtained, the data with all available information was exported as comma-separated values (csv) files and were then imported into Microsoft Excel 2016 and subsequently loaded into VOSviewer and Biblioshiny software used for further analysis.

2.2. Bibliometric Analysis

To show the measurement of indicators of the status quo between climate change and CE, the following bibliometric parameters provided mainly by the Scopus database were used: (i) total number of type of documents, (ii) number of publications per year, (ii) number of citations per year, (iii) annual number of publications by subject area, (iv) annual number of publications per country, (v) total number of single country publications, (vi) total number of multiple country publications, (vii) total number of publications per institution, (viii) total number of publications per author, (ix) total number of citations per author, (x) the Hirsch index (h-index) per author, (xi) total number of publications per funding sponsors, (xii) total number of publications per journal, (xiii) impact factor per journal according to its official website, and (xiv) best quartile per journal according to 2021 Journal Citation Reports. Prism 8 software (Graphpad, USA) was used to graph the obtained results.

2.3. Scientometric Analysis

Network-based analyses were carried out to identify the dynamic patterns of scientific development using the software package VOSviewer 1.6.14 (Leiden University, The Netherlands). Based on the co-authorship interconnections, the parameter of top-producing countries of publications was used. Since the early 1980s, co-authorship has been operating as a proxy for research cooperation [34]. The list of countries was filtered both by a minimum of 27 publications and by a minimum of 950 citations. VOSviewer generated the network visualization map of country co-authorship with countries clustered.
Moreover, the most reported keywords based on co-occurrence were analyzed. Two words are defined as co-occurring if they appear in the same document. For the selection of keywords, all the words were extracted from the title and abstract of the publications using the complete count method, and they were filtered for a minimum of 8 occurrences. Unrelated words (i.e., organization names, generic terms, regional words) and merged repetitive words (i.e., singular and plural forms and abbreviation and full name) were eliminated. Subsequently, a list of keywords was obtained, and VOSviewer generated the co-occurrence map with keywords clustered. The cluster names were manually labeled based on the observed keywords [35].

2.4. Landscape Scientific Method

To construct maps that reflect the structure, evolution, and main actors of scientific field, Bibliometrix v3.0.1, an open-source tool for executing a comprehensive science mapping analysis based on R language, was used [36]. Biblioshiny is the web-based interphase of Bibliometrix and comprises different analysis levels with indicators, statistical measures, and visual representations [37]. For this work, the thematic evolution analysis was applied in a Sankey diagram [38]. A total of 400 author’s keywords with a minimum cluster frequency (per thousands of documents) of 10 were defined. The weight inclusion index was per word co-occurrence with a minimum of 0.2, label size of 0.3, and number of labels per cluster of 1. The established time slices were per the publication trend. In the Sankey diagram, each node indicates a group of topics with the highest-frequency term and the related subperiod labeled. The size of the node is proportional to the number of keywords associated with the topic. The direction of the evolution of the thematic groups is shown in the flow between nodes, and the width of the border between two related topics is proportional to the inclusion rate [39].
Additionally, a thematic map was performed to show the importance and level of development of research lines. The thematic map distribution analysis works with clustering algorithms to classify research themes in four different typologies located in different quadrants: upper-right quadrant (central and developed), lower-right quadrant (central and undeveloped), lower-left quadrant (peripheral and developed), and upper-left quadrant (peripheral and undeveloped) [38]. The thematic map was defined with 450 author’s keywords with a minimum cluster frequency per thousand documents of 5, label size of 0.2, and number of labels per cluster of 1. The quadrant names were manually labeled according to the themes and their observed keywords.

2.5. Text Mining Analysis

The keywords used for the text mining analysis were: two climate actions (mitigation and adaptation), five CE strategies (waste, product, resource, supply chain, and customers and community; [40]), five highly GHG-emitting materials (cement, aluminum, food, plastics, steel), a climate initiative (SDG 13), and the main driver of climate change (GHG). These 14 keywords were searched among the set of publications using in-house Python scripts (https://github.com/LeonardoMorenoG/textMiningCE.git, accessed on 10 October 2021; Table S1). Briefly, each paper in PDF format was parsed to text using the package pdfminer (https://github.com/euske/pdfminer.git, accessed on 10 October 2021). Any punctuation signs were removed, and all uppercase letters were converted to lowercase. Then, the text was tokenized in each of its words, and the keywords and their related terms were counted. Each keyword count was normalized by the number of its related terms found in the text. Finally, the normalized counts were used to calculate the co-occurrence coefficient (cxy) as follows:
cxy = e2xy/nxny
As specified in Equation (2), exy = the number of publications that possess both keywords, nx = the total number of publications with the xth keyword, and ny = the total number of publications with the yth keyword [38]. These coefficients were showed in a co-occurrence matrix and range from 0 to 1 indicating how often keyword x and y appear together in publications.

3. Results

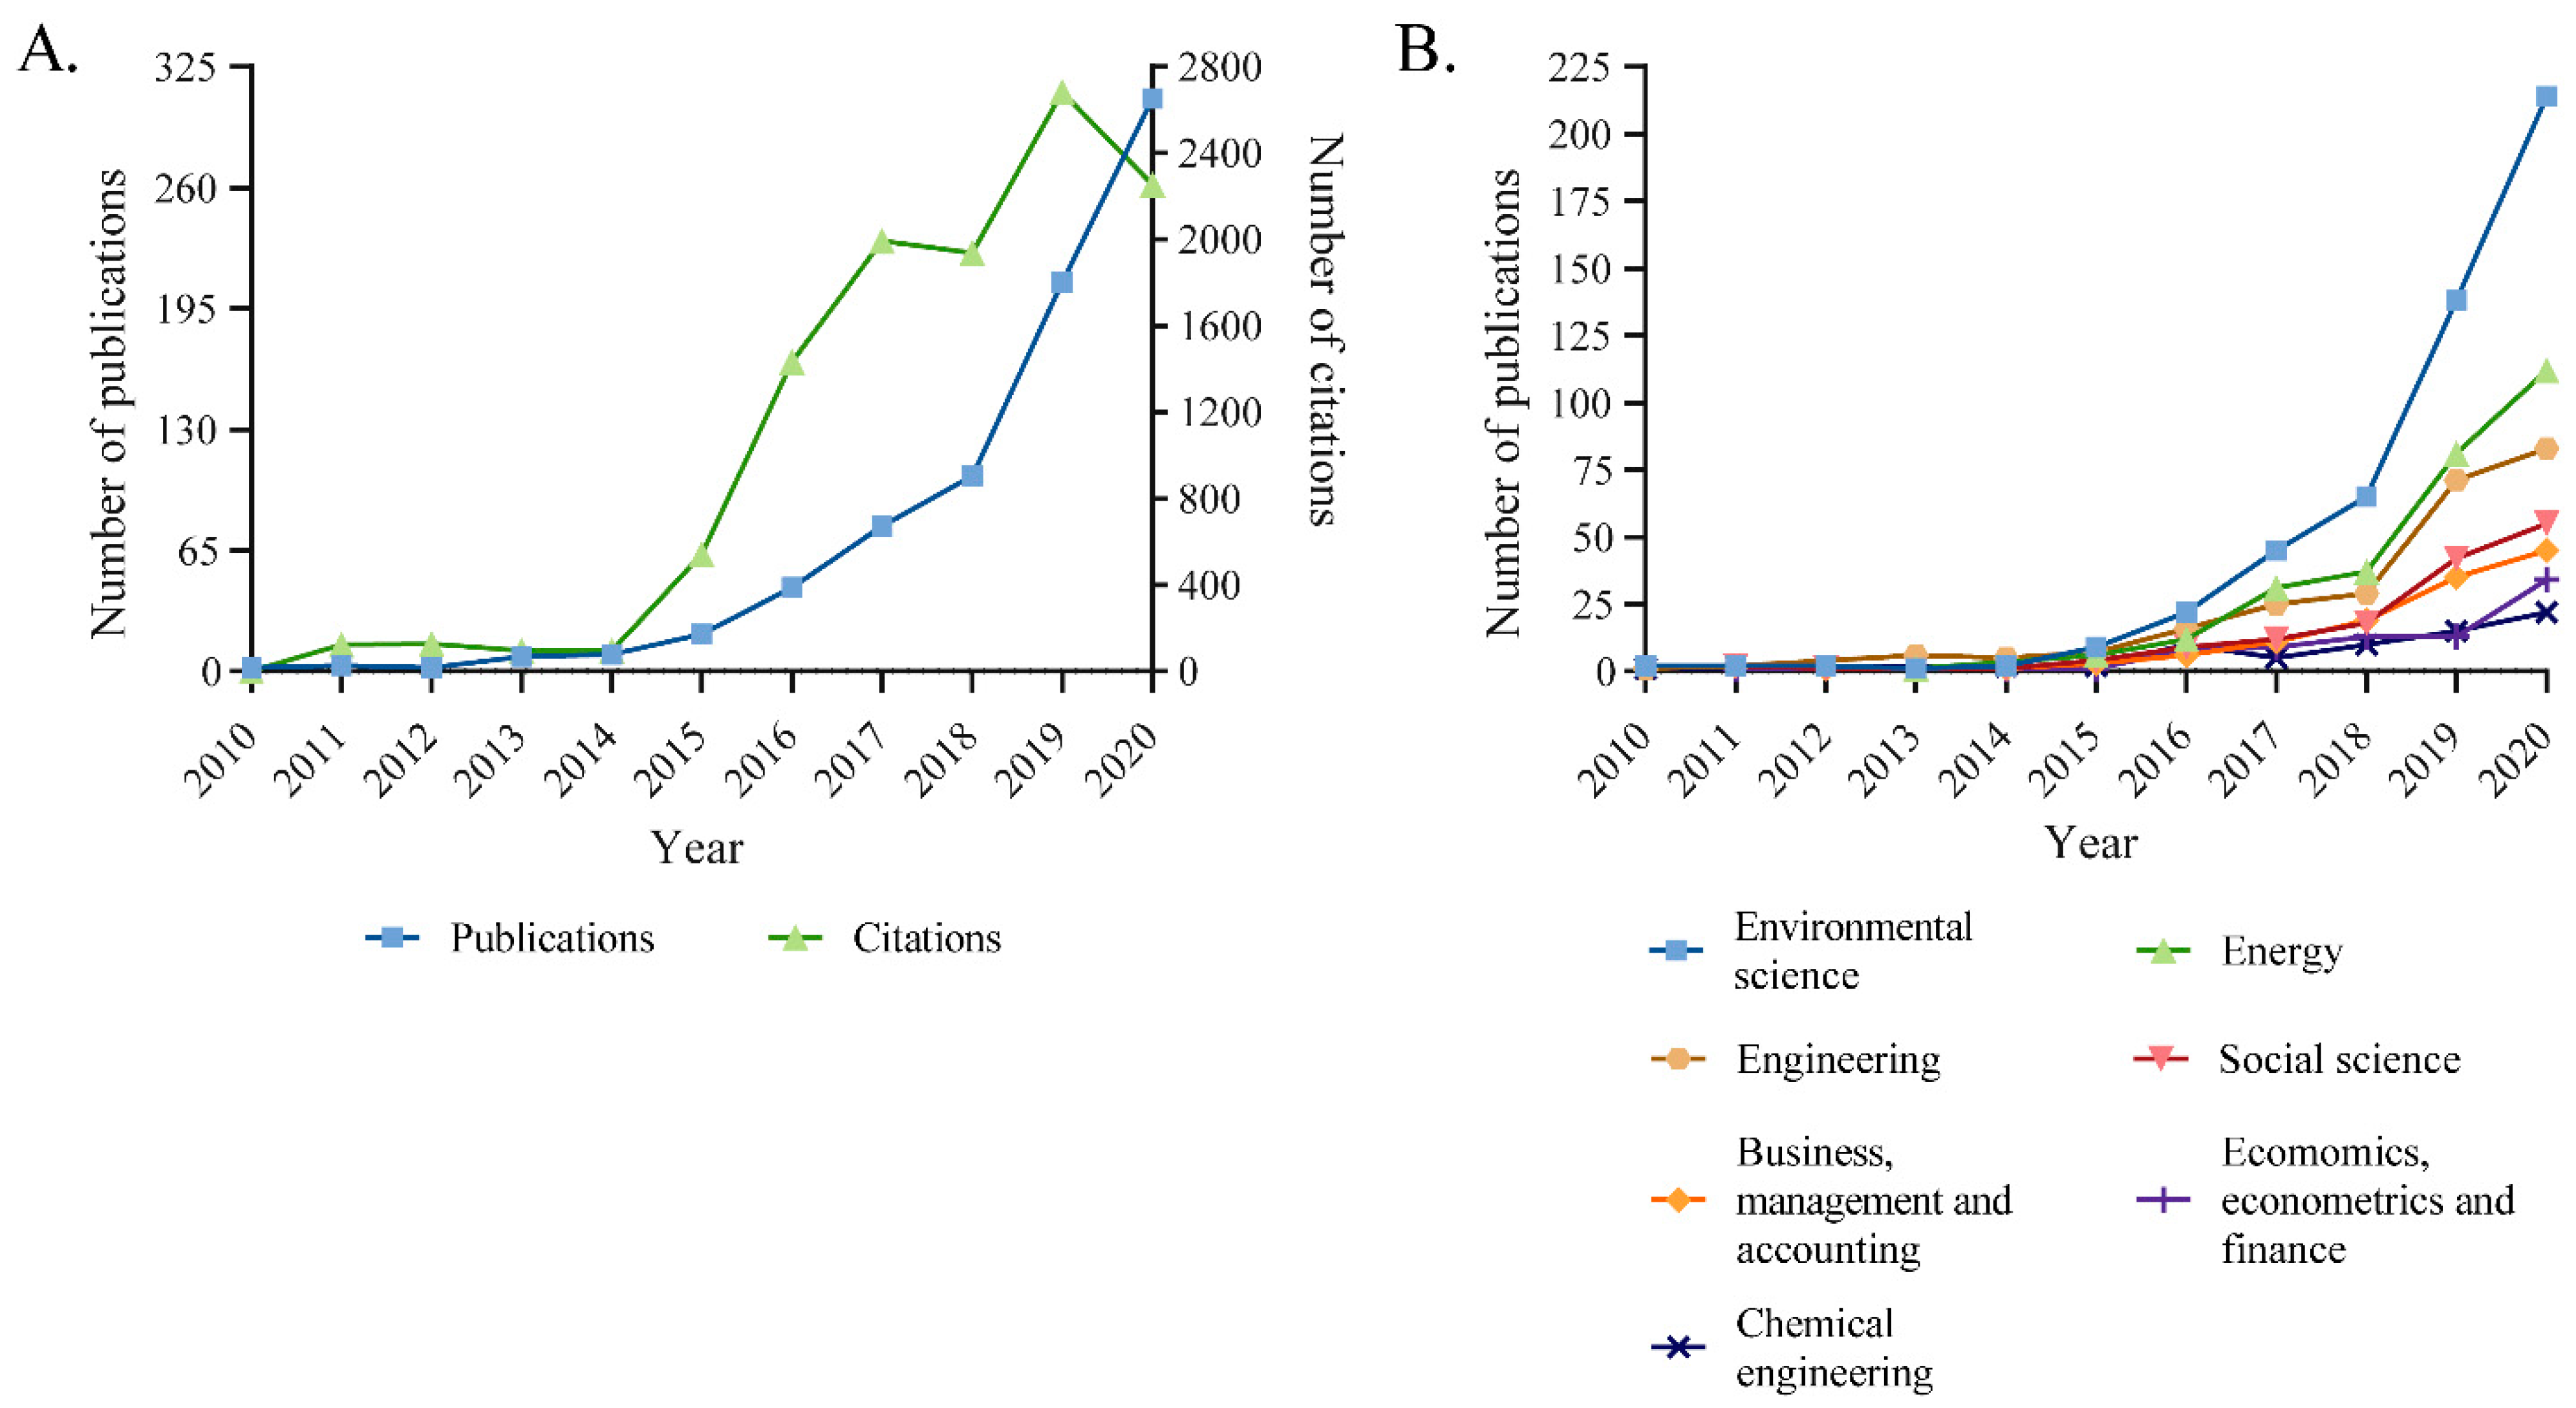
3.1. Trends in the Number of Publications and Subject Areas

To explore research trends on climate change and CE, we first analyzed through bibliometrics all the publications reported in the last decade. A database of 789 documents mainly composed of articles (60.96%), conference papers (15.08%), and reviews (11.91%) was retrieved (Table S2). Overall, the growth in the total number of publications was observed over time (Figure 1A). We noted that the number of publications remained very low in the early years, followed by a gradual increase period, and finally presented an active growth in recent years. Based on the notable differences in the number of publications, the time span of the last decade can be divided into three stages: (i) From 2010 to 2014, nine publications were reported, representing 2.91% of the total number of publications. (ii) From 2015 to 2018, 98 publications were reported with an average of 24 publications per year, which represented 31.71%. (iii) From 2019 to 2020, 202 publications were reported, showing an increase of more than double compared to the previous period and representing 65.37%. Citations showed a similar trend. In 2014, 2018, and 2020, we found 95, 1872, and 2230 citations, respectively. This trend is generally increasing, with a growth rate of 26%. The years with the highest increase in these two parameters were 2019 and 2020. For 2019, 106 publications and 2236 citations were found; meanwhile, for 2020, the numbers of publications and citations were 96 and 2230, respectively.
The top seven subject areas associated with climate change and CE were (i) environmental science (214 documents; accounting for 27.9% of the total); (ii) energy (112; 15.5%); (iii) engineering (83; 13.6%); (iv) social science (55; 8.1%); (v) business, management, and accounting (45; 6.9%); (vi) economics, econometrics, and finance (34; 4.5%); and (vii) chemical engineering (22; 3.7%) (Figure 1B). All subject areas showed a progressive increase in the number of documents; notably, environmental science has been the most studied.

3.2. Most Relevant Countries, Institutions, Authors, and Funding Sponsors

We also analyze the scientific production of countries, affiliations, authors, and funding sponsors. The total number of countries with publications on climate change and CE was 90. None of the countries registered publications every year. The trend in the annual production of the number of publications was variable among the top 10 countries (Figure S2). Italy showed the largest publication production rate with 11 publications per year. The three countries that lead the total production of publications were Italy with 120, the United Kingdom with 95, and Spain with 81 (Table S3). Italy showed the largest number of single country publications (74), while the United Kingdom had the largest number of multiple country publications (48). Interestingly, the country co-authorship network showed that all countries have cooperated with all, except for India and Brazil (Figure 2). In this network analysis, each node represents a country, the node size is equal to the total number of publications, and the thickness of the edges represents the number of simultaneous occurrences of two countries. Based on this, the United Kingdom leads the cooperation, followed by Italy and the United States. Moreover, two clusters were determined based on the cooperation country co-authorship network. The green cluster includes four European countries (the United Kingdom, the Netherlands, Sweden, Denmark), India, and China, while the red cluster includes the other four European countries (Italy, Spain, Germany, France), the United States, and Brazil.
The top 10 affiliations have reported a total of 102 publications, accounting for 12.62%. All the top 10 affiliations are European with the Netherlands being the country with the most affiliations. The University of Manchester and Danmarks Tekniske Universitet share first place, followed by the Delft University of Technology. The difference in the number of documents between the top 10 affiliations was minor, with a range from 9 to 13 documents (Table S4). To find the most relevant authors, bibliometric indicators such as number of publications, total number of received citations, and h-index were used (Table S5). We observed that the authors with the largest production were Adisa Azapagic (53 h-index) and Angel Irabien (50 h-index). The total number of citations per total published papers presented a greater difference between the authors than the institutions, where Willi Haas (14-hour index) led with 243, followed by Kotamraju Amulya (11-hour index) with 231 publications. Willi Haas and Kotamraju Amulya also showed the highest values in the relationship between citations and publications (TC/TP) with 60.75 and 57.75 citations/publication, respectively, as a parameter that reflects the influence of the literature. However, none of all the authors mentioned presented the largest h-index. The h-index shows an estimate of the importance and the broad impact of a scientist’s cumulative research contributions [41]. Srinivasula Venkata Mohan had the largest h-index value (69): in other terms, 69 publications with at least 69 citations. Finally, most of the top 10 funding sponsors are European. The European Commission ranked first with 98 publications, representing 12.12%. In addition, the European Commission showed a difference of 43% (42 publications) compared to Horizon 2020 by the European Union and 69% (68 publications) compared to the European Regional Development Fund, which ranked second and third (Table S6).

3.3. Most Influential Journals and Publications

The following bibliometric parameters were determined to be the most productive journals and the most influential publications. The top 10 journals accounted for 34.7% (281 documents) of all publications (Table S7). However, journal publications are relatively scattered. The Journal of Cleaner Production appeared as the journal with the most publications, publishing 9.9% of the documents. It was followed by Sustainability with 5.56%, and Resources Conservation and Recycling with 4.08%. These three journals account for approximately one-fifth of the publication output. The remaining journals, from the fourth to the tenth place, comprise between 1.23% and 3.09% of the total publications. Furthermore, 70% of journals contain more than one subject area. Among the top 10 journals, 6 have an IF (2021) index > 7. The largest IF (2021) is Renewable & Sustainable Energy Reviews with a value of 14.98, followed by Resources Conservation and Recycling (10.2), and the Journal of Cleaner Production (9.29). Additionally, 70% of the journals have Q1 as the best quartile.
Since 2010, scholars have published many influential publications on climate change and CE. Here, the publication influence was analyzed by the number of citations. The 10 most influential publications comprised 1888 citations (Table S8). The publications were reported between the years 2011 to 2019 in nine journals, and no author appears in more than one publication. The journals with the most publications in this top 10 are the Journal of Cleaner Production and Proceedings of the National Academy of Sciences of the United States of America with two publications each. The type of publications reported comprised 5 articles, 4 reviews, and 1 note. The most influential publication was performed by Walter Stahel in the Nature journal, which accounted for 27.7% of the citations. The second publication was a review article of the Journal of Cleaner Production, and the third one was a research article of Proceedings of the National Academy of Sciences of the United States of America. The latter publication has less than 50% of the citations compared to the most influential publication.

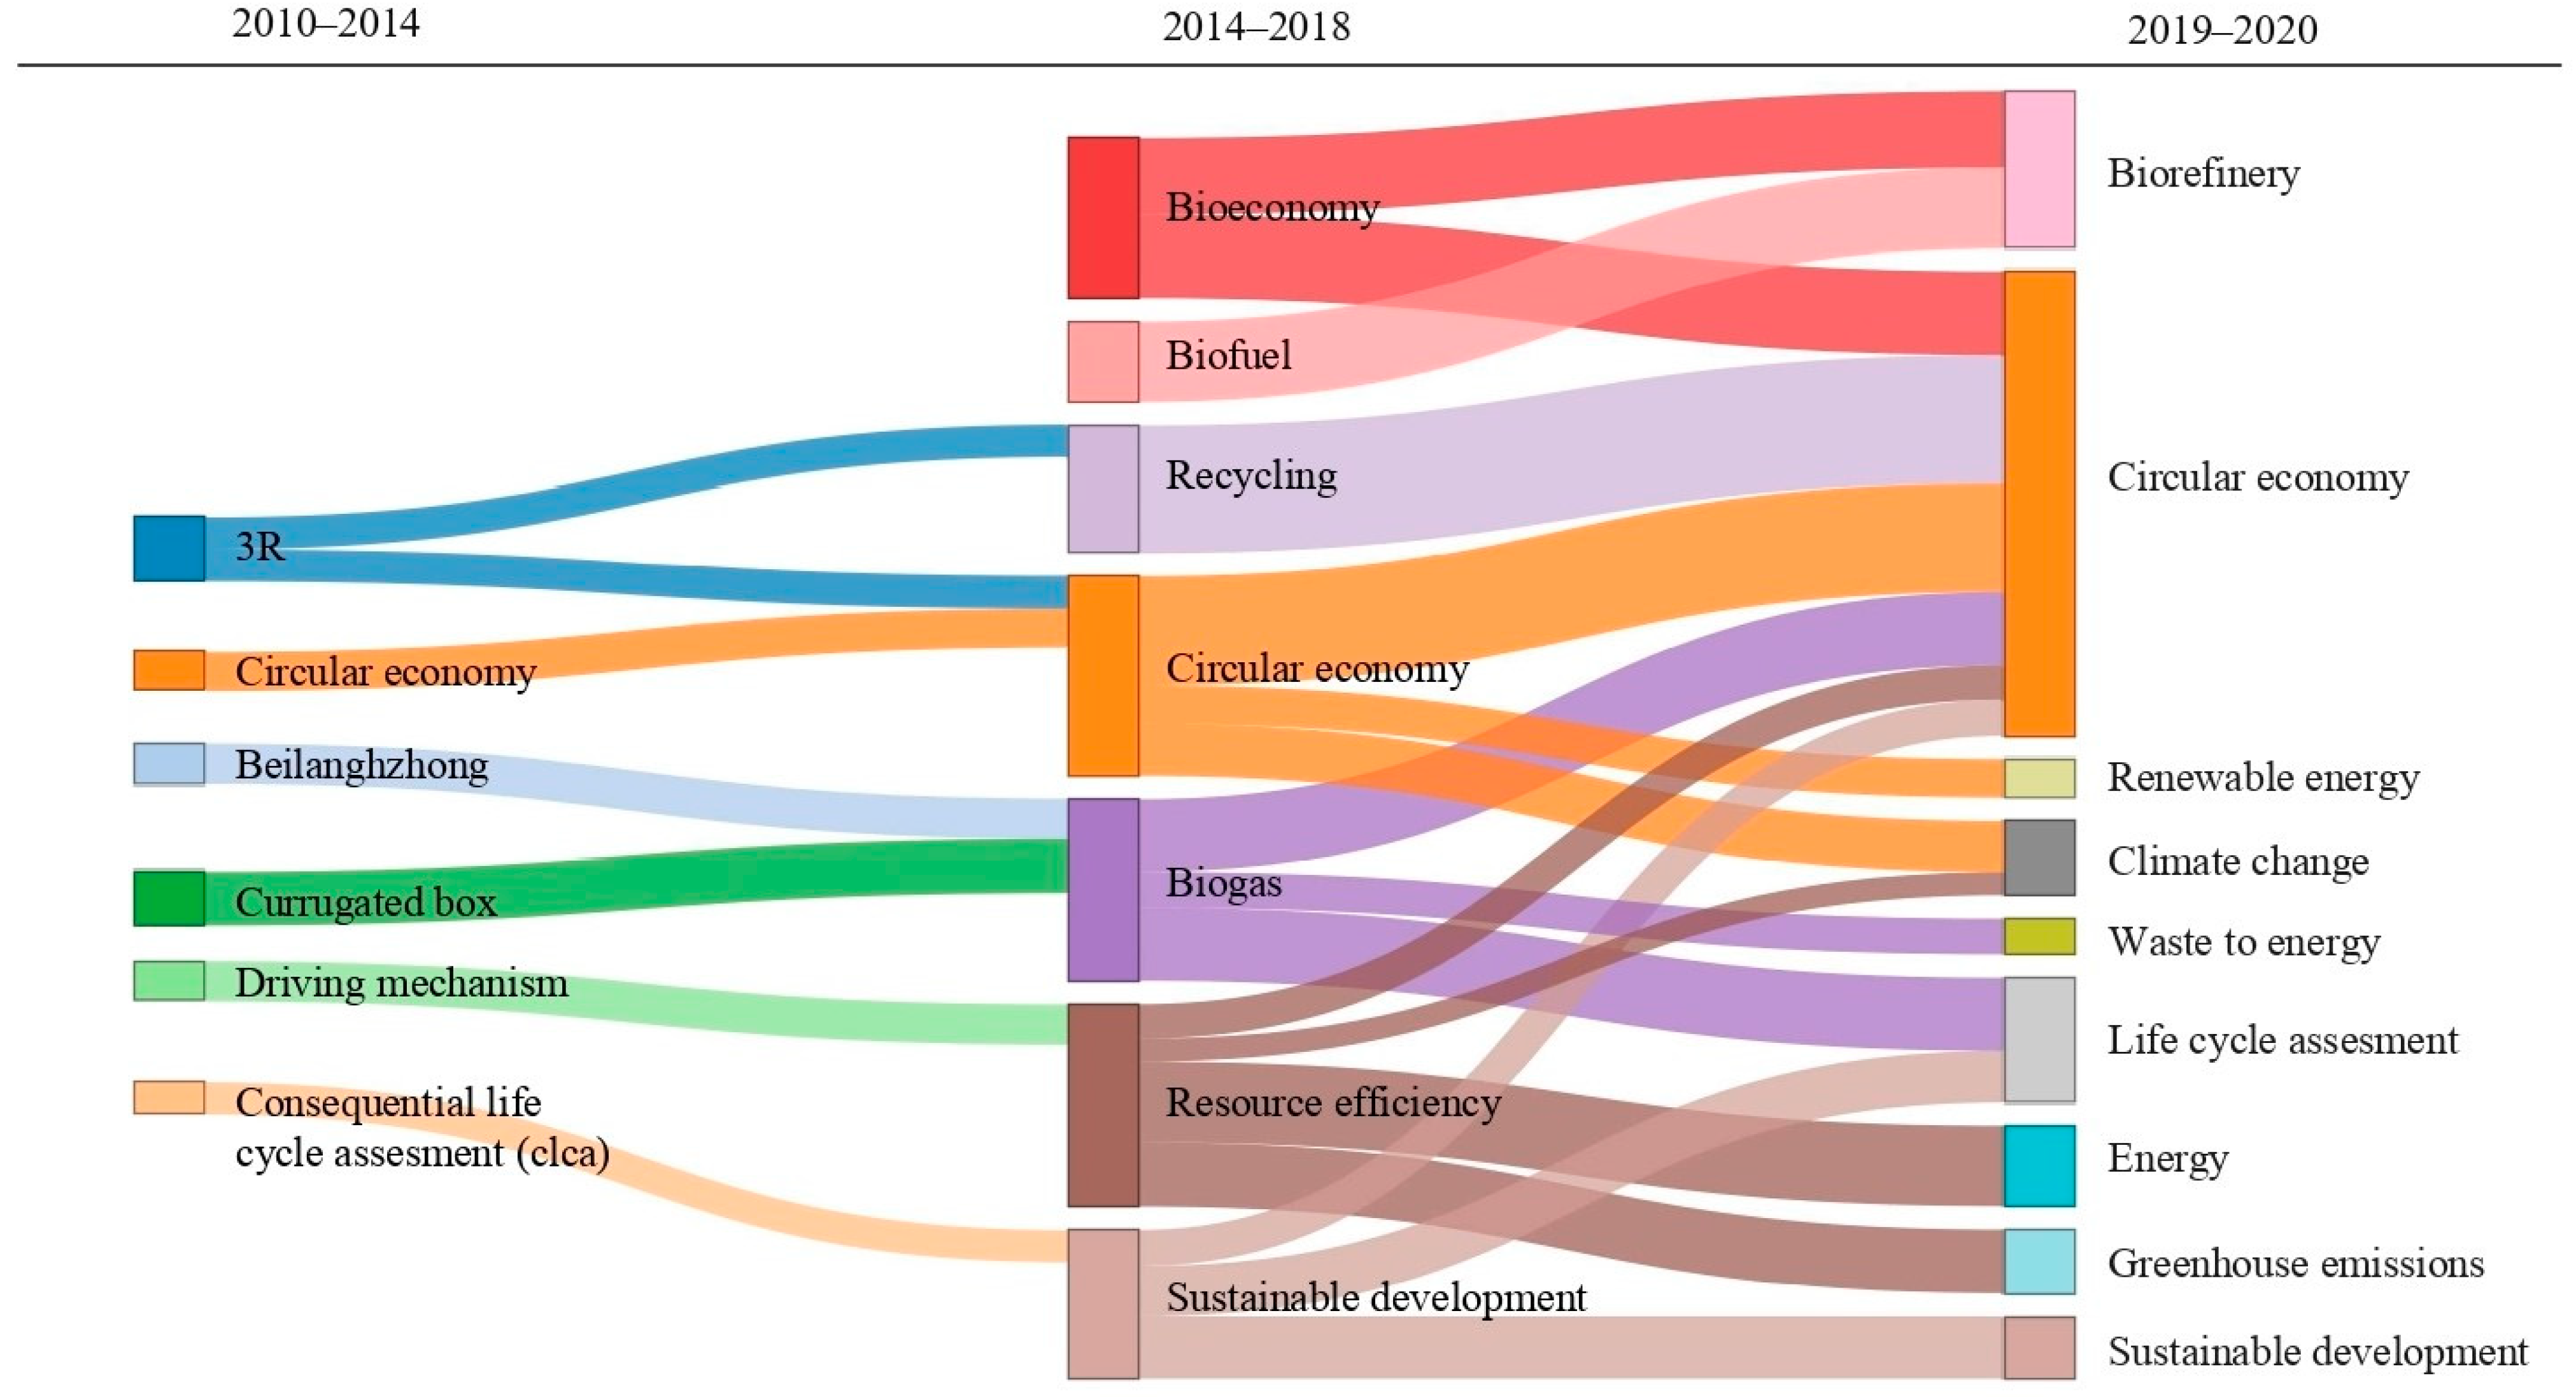
3.4. Evolutionary Keyword Path

Keywords chosen by authors are a tool in scientometrics because they highlight the core focus of publications and denote research themes. Adopting the stages defined in the publication trend (2010–2014; 2015–2018; 2019–2020), a Sankey diagram was constructed to investigate how keywords of CE and climate change publications evolve and interact in a longitudinal framework (Figure 3). We found that the number of keywords and their connection increased over time. From 2010 to 2014, six nodes were noted as the starting point of the thematic evolution. The keyword “3r” (reduce, recycle, and reuse) led the weighted inclusion index and was the only one that influenced two keywords from the following stage: “recycling” and “circular economy”. For its part, “circular economy” was the only keyword that remained in the second stage. We observed seven nodes between 2015 to 2018. “Resource efficiency” was the most influential keyword for the third stage. It influenced four keywords: “renewable energy”, “waste-to-energy”, “energy”, and “greenhouse gas emission”. As we expected, “circular economy” remained in the next stage; it influenced “climate change” and “renewable energies”. “Sustainable development” also remained in the third stage. Finally, in the period from 2019 to 2020, nine nodes were counted. It was only until this last stage that “climate change” appeared explicitly as a keyword. On the contrary, “circular economy” has been present since the early stages and shows a higher frequency through the years that consolidated it as the most significant keyword in the last stage; even more, the links from “bioeconomy”, “recycling”, “biogas”, “resource efficiency”, and “sustainable development” to “circular economy” show that the CE progressively demands a variety of themes.

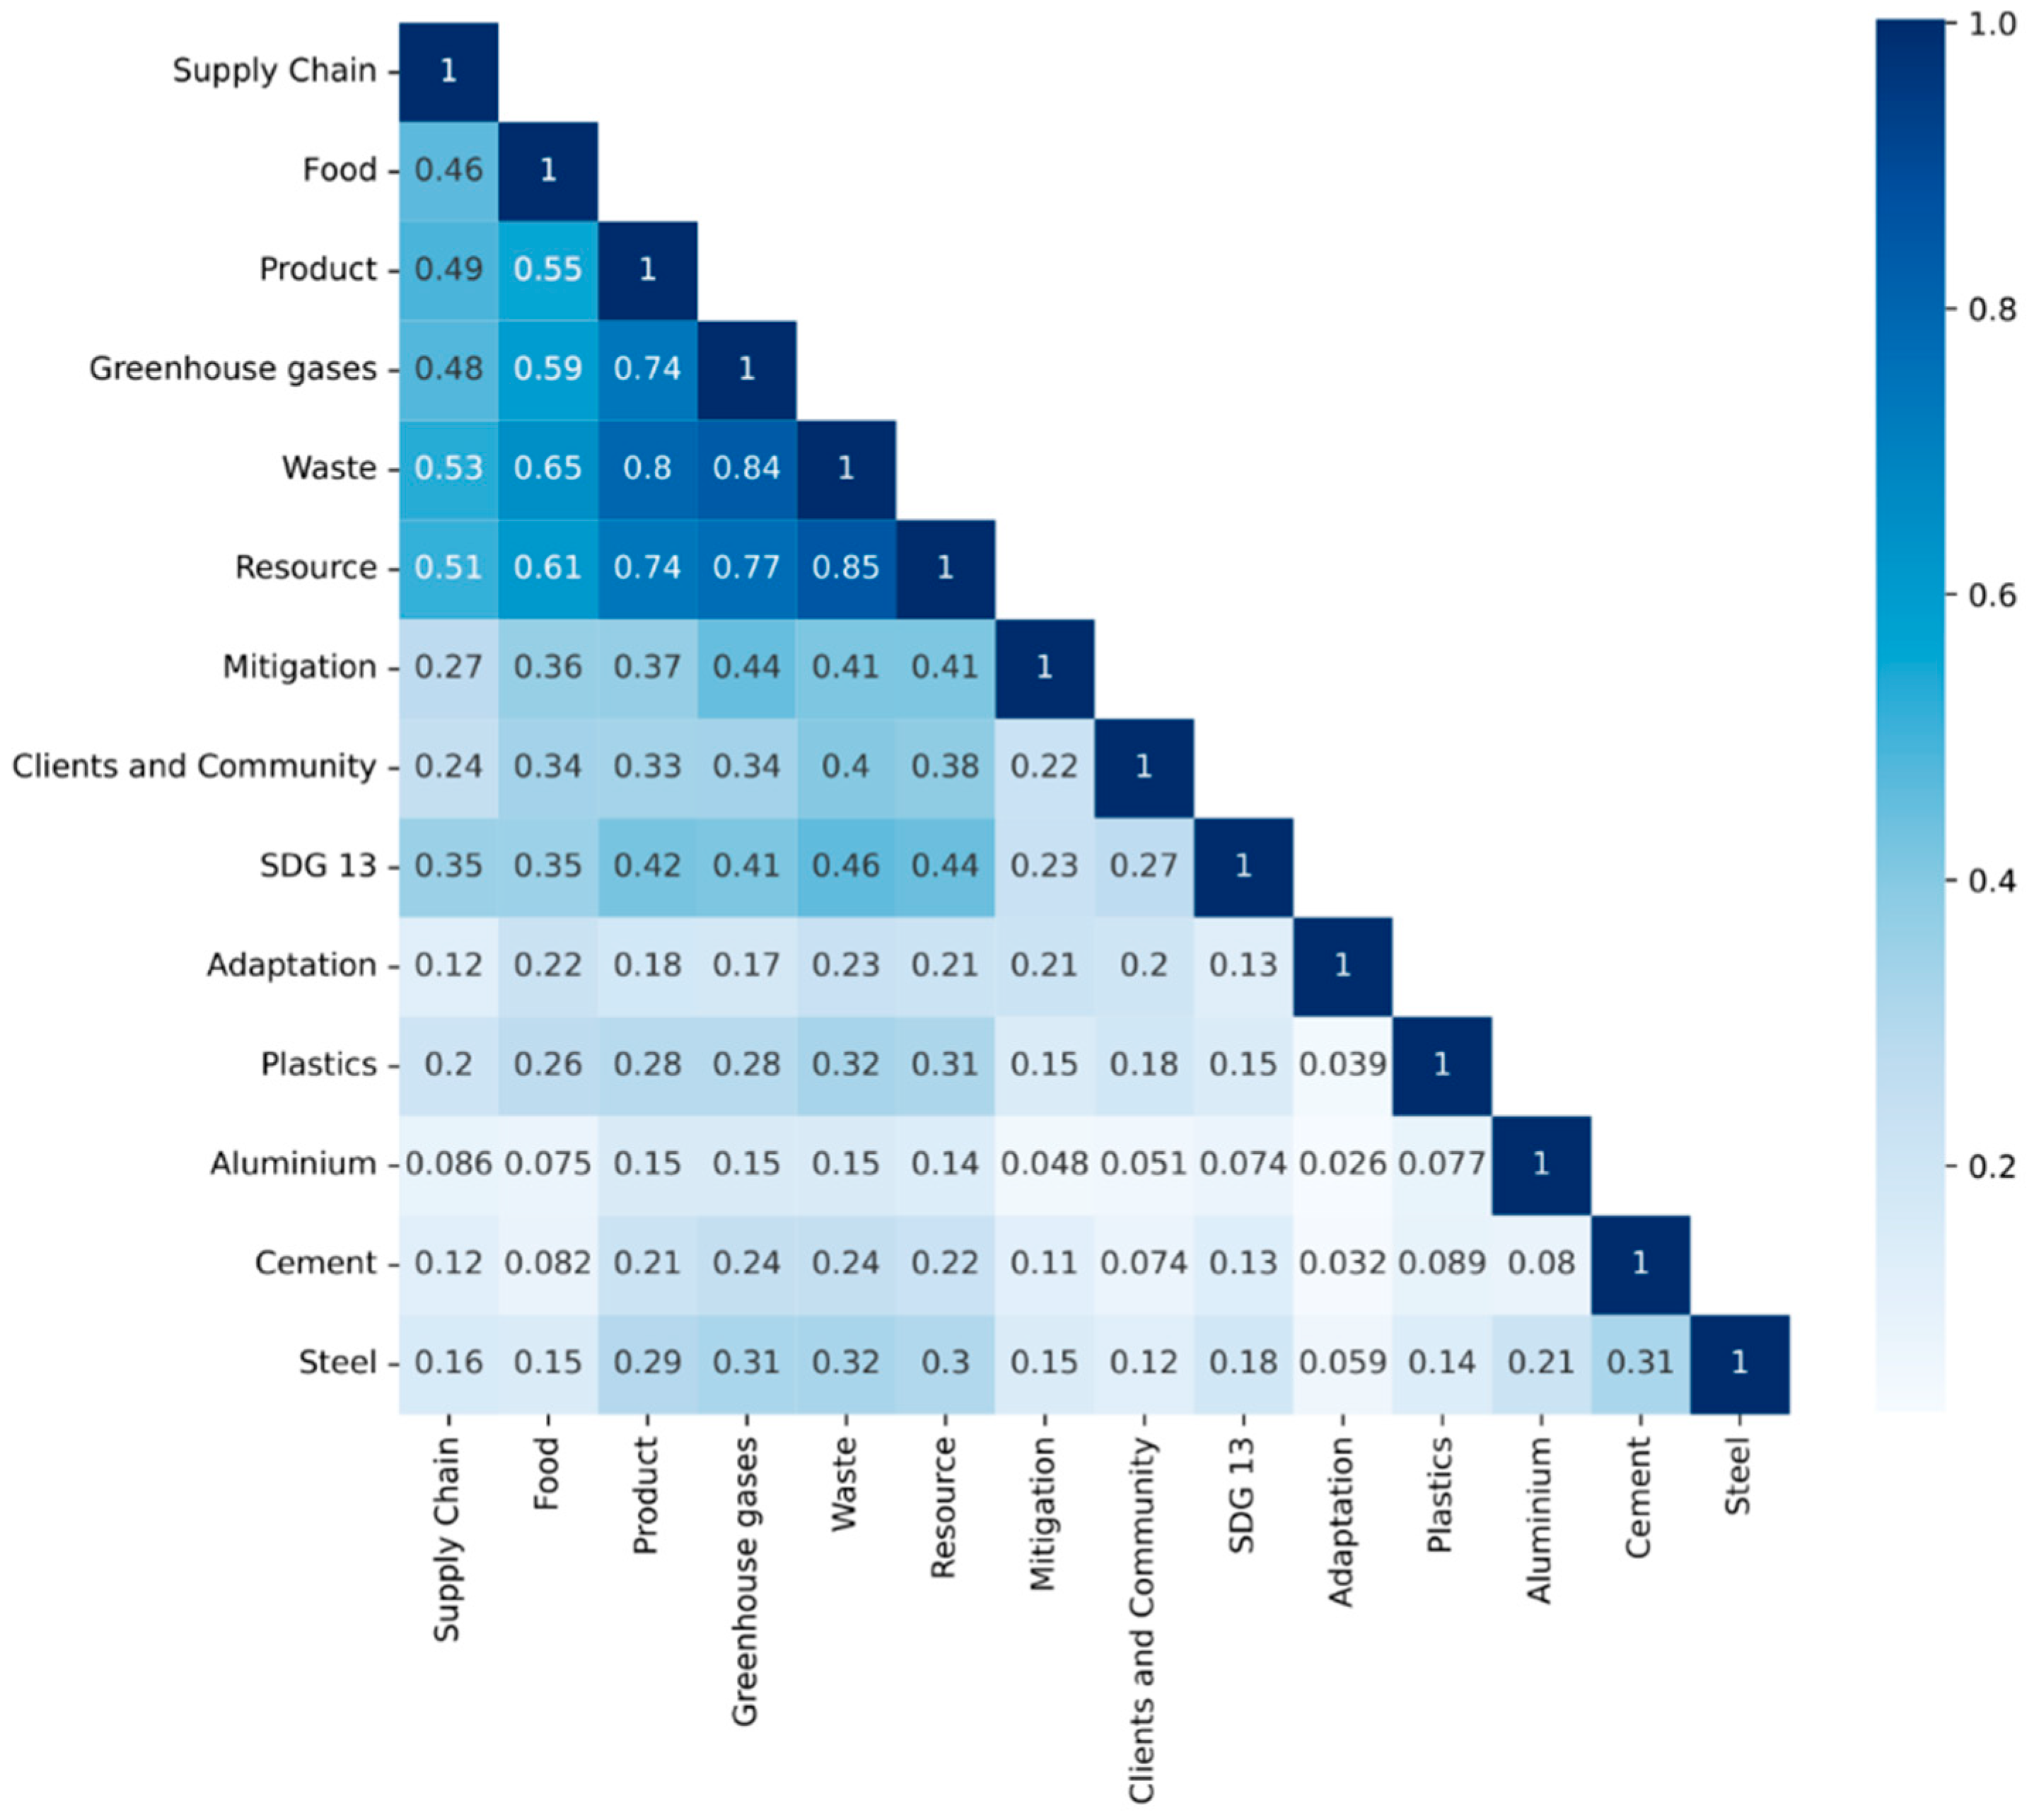
3.5. Association among Climate Actions, CE Strategies, Highly GHG-Emitting Materials, and SDG 13

Next, we seek to further understand how CE and climate change are interconnected based on existing evidence in the scientific literature. To this purpose, we measured the co-occurrence among climate actions, CE strategies, highly GHG-emitting materials, and SDG 13 (Figure 4). We found that the three largest co-occurrences were observed between “resource” and “waste”, “GHG” and “waste”, and “product” and “waste”, which ranged from 0.8 to 0.85. This finding suggests that much of the resource management, GHG emission, and product design literature is dedicated to waste management. Another four co-occurrences were evidenced in a range of 0.61–0.77 between “GHG” and “resource”, “product” and “resource”, “food” and “waste”, and “food” and “resource”. The lowest co-occurrences were observed between adaptation and the four highly GHG-emitting materials (“steel”, “cement”, “aluminum”, and “plastics”), “mitigation” and “aluminum”, and “clients and community” and “aluminum”. In average, the CE activity with the largest co-occurrence was “waste”, followed by “resource”, “product”, “supply chain”, and “clients and community”. The climate action with the largest co-occurrence was “mitigation” while the highly GHG-emitting material was “food”. Surprisingly, “SDG 13” presented a low average co-occurrence of 0.27.

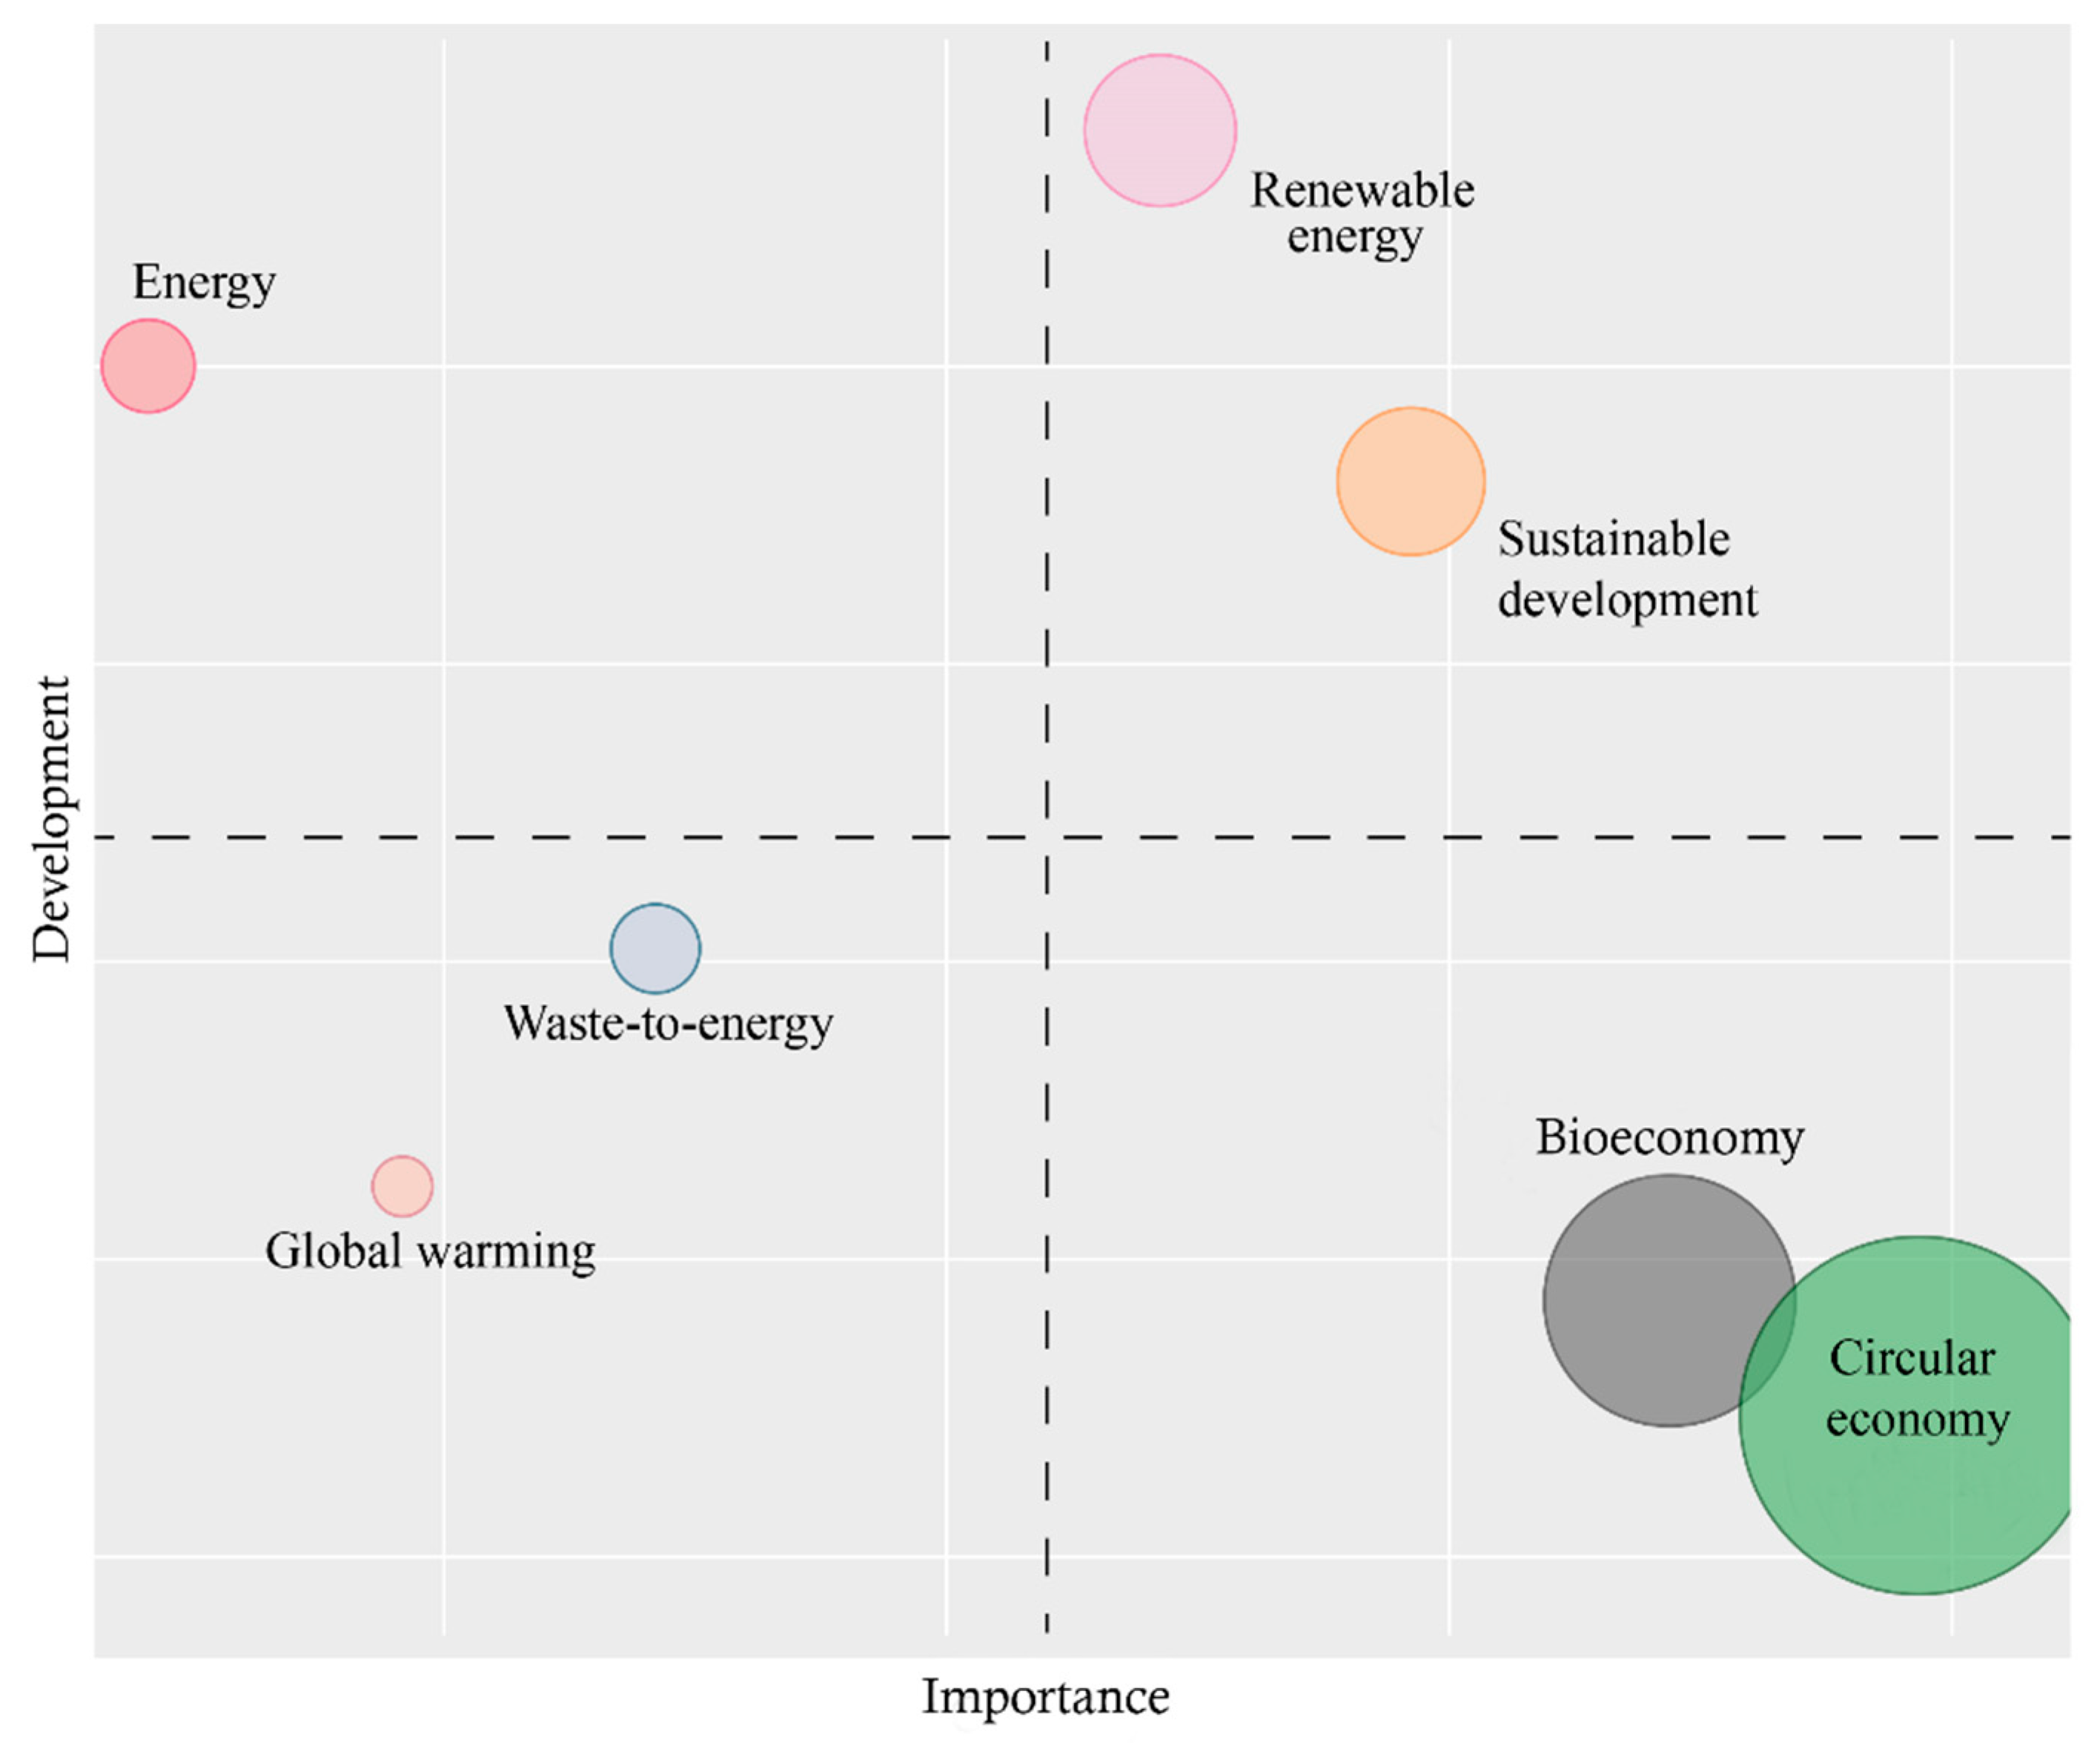
3.6. The Research Lines Hotspots

To identify research lines associated with climate change and CE, a co-occurrence network of the most reported keywords was calculated. The results showed a total of 2282 keywords, however, only 24 keywords had at least 8 occurrences (Figure 5). Notably, “circular economy” emerged as the most used keyword with 384 occurrences and a total link strength of 422. It was followed by “sustainability” (83 and 127), “life cycle assessment” (75 and 117), “climate change” (67 and 104), and “recycling” (38 and 58). The 24 keywords were grouped into 4 clusters, and we associated each one to a research line. Cluster #1, in green, is the most significant cluster with seven keywords. The main interest of this cluster is CE strategies, as can be deduced from the terms “carbon footprint”, “circular economy”, “industrial ecology”, “industrial symbiosis”, “life cycle assessment”, “urban metabolism”, and “recycling”. The cluster #2, colored red, was composed of the terms “agriculture”, “anaerobic digestion”, “bioeconomy”, “bioenergy”, “biogas”, “biomass”, “biorefinery”, “food waste”, and “microalgae” that indicated to be sectors and process in bioeconomy. The blue cluster, #3, consisted of the terms “climate change”, “energy efficiency”, “renewable energy”, “waste management”, and “waste-to-energy”, which showed an association to climate, energy, and waste-to-energy. The last cluster, #4 and colored yellow, had the fewest keywords with “natural resources”, “sustainability”, and “sustainable development goals”, and their relationship was based on sustainability and natural resources.
To represent the grade of development and importance of the current research and expose trending research lines, we consolidated the existing research in a thematic map (Figure 6). In general, we observed that the clusters located in central quadrants showed a greater number of keywords than the clusters of peripheral quadrants. The main interest of the peripheral and developed themes quadrant was the relationship between waste-to-energy conversion and global warming. Keywords such as “phosphorus”, “environmental benefits”, “zero waste”, and “waste hierarchy” were grouped within waste-to-energy and “adaptation”, “mitigation”, “low carbon economy”, and “sustainable business model” within global warming. The main interest of the central and developed themes quadrant, also called motor-themes, was the use of renewable energy to promote sustainable development. The keywords associated with sustainable development were “sustainable development goals”, “land use”, “policy”, “technology”, “natural resources”, and “industry”. In the peripheral and undeveloped themes quadrant, we found energy as a theme, which was composed of a keyword that was “water”. Lastly, central and undeveloped themes quadrant showed bioeconomy sectors and processes along with CE strategies. The most prominent keywords of these two themes were “circular economy”, “life cycle assessment”, “recycling”, “resource efficiency”, “bioeconomy”, “anaerobic digestion”, “biogas”, “biorefinery”, “biomass”, and “microalgae”.

4. Discussion

4.1. Key Findings and Their Implications

The CE has the potential to decrease GHG emissions from our linear ‘take-make-waste’ economy to achieve global climate goals [26]. In this study, we present the findings of a knowledge mapping of the reported research between climate change and the CE over the last decade.
Research between climate change and CE is receiving increasing attention with an interdisciplinary character. Since 2015, publications have increased continuously. This growth has possibly been intensified by the launch of international initiatives, such as the Paris Climate Agreement and the 2030 Agenda for Sustainable Development. Although the term CE does not even appear in the 2030 Agenda [42], here, we showed how the term CE has been used in research since 2010, also, how its frequency and importance has increased over the years. Even more, the possibility of using CE as a tool to develop some SDGs has been raised [43,44]. Consequently, several countries have formulated and executed agendas for research strategies focused on climate change and CE. For example, Finland and the Netherlands in 2016, Italy in 2017, France in 2018, Colombia in 2019, and Sweden in 2020, among others [45].
Europe notably led and dominated scientific production in terms of the most relevant countries, institutions, authors, and funding sponsors. After Europe, the geographic centralization is in Asia and North America. More research projects are required in other regions such as Africa and South America, as well as projects between continents that can promote sustainable intercultural awareness [46].
The impact factors and quartiles of the journals that predominated in the top 10 confirm the large interest in this research field. The research questions addressed in the top 10 publications revealed that the disconnection between major industry initiatives and scientific research is a common and pronounced problem. Moreover, three approaches were identified: modelling of materials and energy flows, proposals of strategies and systems, and comparison of practices and policies. Walter Stahel, CE pioneer, is the author of the most influential publication [11]. Stahel founded the need for and importance of changing consumption and production patterns to decouple human well-being from environmental degradation through a system thinking strategy. Thus, a new relationship is built with goods and materials as assets that must be preserved to guarantee the security of resources and generate local jobs.
Our research showed the evolution of the major keywords from 2010 to 2020. The number of keywords and their links increased over time. The divergence and convergence of streams as well as the transformations of the keywords show the dynamic history of this research field. Some keywords have stably evolved and developed, while others have been included in new terms that gain importance and appear in recent times. The main starting point of the interconnection between the CE and climate change is the keyword “3r”, which stands for reduce, recycle, and reuse. The largest divergence was presented by “resource efficiency” in 2015–2018, while the largest convergence was by CE in 2019 to 2020. This demonstrates that “resource efficiency” has influenced the development of other themes, while “circular economy” covers a variety of themes and increasingly demands more lines of research. Another theme that contributed to the intellectual structure and evolution was “bioeconomy”, showing that the power of bioscience and biotechnology is addressing climate challenges through circularity. Likewise, sustainable energy issues have become more relevant in the last two years, wherein waste-to-energy technologies are highlighted.
One of the most explicit ways to understand the interconnection between climate change and CE is to demonstrate how the application of CE on highly GHG-emitting materials improves climate actions and initiatives. Publications aligned to this purpose allow knowing the co-occurrence between keywords as a measure of association strength. This study revealed that the most reported approach to CE practices is associated with waste management. “Waste” was the keyword with the largest mean co-occurrence and the CE activity with the strongest associations to all other keywords. By contrast, “clients and community” was the CE activity with the least prominence, representing a challenge to be addressed. Research efforts to reconceptualize and promote existing CE frameworks and applications towards social dimensions are beginning to be reported [47]. For example, Schröder et al. [44] showed how the inclusion of circularity indicators in the Human Development Index can improve its current deficiency in long-term environmental sustainability criteria. At this point, however, it is uncertain how clients and the community contribute to the success of CE initiatives in companies or territories.
Regarding the two climate actions, mitigation was more notorious than adaptation in the literature. Adaptation was one of the keywords with the lowest co-occurrence, which suggests a lack of focus from researchers on CE-based adaptation to climate change. Dayeen et al. [48] found similar findings. They showed that there is a low co-occurrence between climate change adaptation, industrial ecology, urban metabolism, and life cycle assessment. The highly GHG-emitting material that showed the largest co-occurrence was food. Food was remarkably related to the five CE strategies. According to Poore and Nemecek [49], the cattle herd is the largest producer of GHG (60 kg CO2-eq), showing a vast difference with the second that is lamb and mutton (24 kg CO2-eq). Although the potential of CE strategies in materials such as steel, cement, aluminum, and plastics to reduce tons of CO2 has been reported [6], these possibly represent a relatively recent theme given their low co-occurrence to CE strategies in publications. Finally, the low co-occurrence shown by SDG 13 allowed us to infer that this goal of the 2030 Agenda has been less considered within the works on climate change and CE. SDG 13 is one of the climate initiatives that are promoted globally in the public, private, and non-governmental sectors. SDG 13 considers adaptation and mitigation actions, as well as approaches to strengthen resilience and integrate climate change measures into national policies and planning [50].

4.2. Research Lines, Knowledge Gaps, and Prospects

Based on the keyword clusters identified in the co-occurrence and thematic maps, we identified four lines of research that can be considered as possible innovation gaps and directions for future studies about climate change and CE. These are: (i) CE practices, (ii) bioeconomy, (iii) climate and energy, and (iv) sustainability and natural resources. Here, we describe the most recent advances reported for each research line.
The current leading edge of research between climate change and CE are investigations related to CE strategies and bioeconomy. CE have shown high potential in reducing GHG emissions in the industry and transportation sector, followed by mid-range decreases in the waste and construction sector [21]. Studies in “industrial ecology”, “industry 4.0”, “recycling”, and “life cycle assessment” have described technology-driven reduction of some materials such as cement, steel, and asphalt [51,52,53]. Nevertheless, the reuse of lithium-ion batteries and the technology-driven substitution with green materials require broad implementation [46,52]. This opens opportunities to pursue research in new technologies that reduce reliance on cobalt without increasing the demand for nickel in batteries as well as design circular raw materials. Case studies on “urban metabolism” and “industrial symbiosis” with a positive impact on climate change are scarcer. The synergy of these themes offers a new holistic approach to support a new circular urban system aligned with the development of smart circular supply chains beyond the local context [54] that can be enhanced by manufacturing with the implementation of digital technologies [55,56,57,58].
Bioeconomy is a new perspective for fighting climate change where carbon valorization technologies have attracted attention [59]. A breakthrough in research is associating keywords such as “biorefinery”, “bioenergy”, and “microalgae” is research on third-generation (3G) biorefineries. According to Liu et al. [60], there are knowledge gaps in the optimization of closed-loop processes, the development of carbon utilization techniques, and energy harvesting techniques. Another important theme is circular agriculture models. This theme relates “agriculture”, “biogas”, “anaerobic digestion”, and “biomass” as keywords. The insights and innovations of circular agriculture have focused on preserving and enhancing natural resources, closing nutrient loops for the efficient use of resources, and the multipurpose use of recovering value of waste [61].
The line of research on climate and energy presented different levels of importance and development. The themes related to climate and energy were “renewable energy”, “waste-to-energy”, and “energy”. The most reported premise is that the CE allows greater renewable energy uptake and transitioning. One of the leading options currently having unprecedented momentum is hydrogen energy. The prospects to combat climate change are aligned with the development of efficient systems based on the combination of dark fermentation and photofermentation to improve hydrogen yields and production rates [62]. Waste-to-energy can be considered a cross-cutting theme to the other lines of research. Its major challenge lies in the development of hybrid technologies that integrates renewable energy generation technology with other energy generation systems and that also include computer simulations for process optimization [63].
The last line of research is sustainability and natural resources. A relatively new term that associates “natural resources” with “sustainability” is nature-based solutions. Nature-based solutions involve working with nature to address societal challenges. It has been proposed as a tool that connects with the CE for climate change adaptation [64]. Nature-based solutions can further establish ecosystems in the coastal wetlands, forests, and urban environments that support the three pillars of sustainable development: environmental, economic, and social [65]. In this sense, nature-based solutions could strengthen the limited contribution of the CE to climate change adaptation today. Additionally, nature-based solutions might contribute to the accomplishment of numerous SDGs by promoting the implementation of ecosystem services packages that create long-term sustainable co-benefits [66]. As a future direction, it is necessary to launch global initiatives and promote the integration of climate plans into national policies.
Finally, we want to acknowledge two limitations of the study. First, the present research was conducted only on publications written in English. Therefore, as it occurs in other bibliometric analyses, there is an underrepresentation of publications from non-English-speaking countries. Secondly, while the literature has recognized that the CE is vital to accomplish climate goals, a few researchers claim that circular solutions do not always result by default in GHG emission reductions, thus, a case-by-case thorough appraisal is fundamental [23,67]. According to Cantzler et al. [21], only 10% of all publications have critically illustrated how the CE can alleviate climate change through recording emissions diminishments at large-scale. They recommend that analysis ought to move from attributional examination to consequent examination because implementation is still lacking and thus avoids misleading government decision makers.

5. Conclusions

This study contributes to shuttering the gap in the literature on synergistic climate change and CE interventions in two ways. First, the study presents an overview of this research field by describing the most relevant countries, institutions, authors, financial sponsors, journals, and publications that allows them to be shown as references. In this way, this study provides the basis for the implementation of new research projects and collaborations. Additionally, it helps interested people to quickly understand the evolution of this research field and the role of information science. Second, the study presents developments and knowledge gaps that represent research opportunities and challenges to redirect future research.
The interconnection between climate change and CE is a continuously growing field of research with an interdisciplinary character mainly influenced by environmental sciences. Europe is the undisputed leader in scientific production. The most relevant country, author, and financial sponsor were Italy, Adisa Azapagic, and the European Commission, respectively. The University of Manchester and Danmarks Tekniske Universitet were the most prominent institutions. The most productive journal in this field is The Journal of Cleaner Production. The most cited publication is entitled “The circular economy” by Walter Stahel.
The structure and evolution of the keywords showed that research between climate change and CE demands more and more lines of research. “Resource efficiency” has been the most influential theme in the development of others, and bioeconomy and energy issues are becoming increasingly relevant. The five most used keywords are “circular economy”, “sustainability”, “life cycle assessment”, “climate change”, and “recycling”. Waste management is the circular economy approach most associated with climate change; mitigation is the climate action most impacted by CE; and food is the most reported greenhouse gas (GHG)-emitting material. We also identified three knowledge gaps in the literature: social dimension integration, promotion of climate change adaptation, and association of SDG 13 goals. This study also suggests that innovation in CE practices, climate and energy, sustainability and natural resources, and bioeconomy are lines of research for future works. Carbon recovery technologies, green materials, regional supply chains, hybrid energy technologies, nature-based solutions, among other topics, represent potentially valuable directions for future studies. Ultimately, the demonstrated developments in large-scale GHG emission reductions may further clarify whether the CE offers a broad scope to help combat climate change.

Supplementary Materials

The following are available online at https://www.mdpi.com/article/10.3390/su14010521/s1, Figure S1: Strategy used to define the search equation. Keywords with Boolean operators in bold correspond to keywords that were embedded in consecutive searches based on their frequency of occurrence, Figure S2: Global descriptive statistics of the annual trend by the countries with the largest number of publications (2010–2020), Table S1: Search equation for each manually selected keyword to obtain the co-occurrence matrix. The five CE activities are reported by de Selliers & Spataru (2019), Table S2: Type of documents of the dataset collection obtained from Scopus on climate change and CE (2010–2020), Table S3: Top 10 publishing countries on climate change and CE (2010–2020), Table S4: Top 10 most productive institutions on climate change and CE (2010–2020), Table S5: Top 10 most productive authors on climate change and CE (2010–2020), Table S6: Top 10 funding sponsors of the projects on climate change and CE (2010–2020), Table S7: Top 10 source journals of the study on climate change and CE (2010–2020), Table S8: Top 10 most cited publications on climate change and EC (2010–2020).

Author Contributions

All authors have made a direct and intellectual contribution to the manuscript. Conceptualization, F.R.-P., J.D.C.-U., N.A. and M.Á.G.-C.; validation, F.R.-P., J.D.C.-U., J.L.M.-G., N.A. and M.Á.G.-C.; data analysis, F.R.-P., J.D.C.-U. and J.L.M.-G.; writing—original draft preparation, F.R.-P. and J.D.C.-U.; writing—review and editing, F.R.-P., J.D.C.-U., J.L.M.-G. and M.Á.G.-C.; supervision, M.Á.G.-C.; project administration, N.A. All authors have read and agreed to the published version of the manuscript.

Funding

This research was funded by Universidad EAN.

Institutional Review Board Statement

Not applicable.

Informed Consent Statement

Not applicable.

Data Availability Statement

The data presented in this study are available on request from the corresponding author.

Acknowledgments

The authors would like to thank the Research and Transfer Management team of the Universidad EAN for their invaluable support.

Conflicts of Interest

The authors declare no conflict of interest.

References

  1. O’Neill, B.C.; Carter, T.R.; Ebi, K.; Harrison, P.A.; Kemp-Benedict, E.; Kok, K.; Kriegler, E.; Preston, B.L.; Riahi, K.; Sillmann, J.; et al. Achievements and needs for the climate change scenario framework. Nat. Clim. Chang. 2020, 10, 1074–1084. [Google Scholar] [CrossRef]
  2. Ogunbode, C.A.; Doran, R.; Böhm, G. Exposure to the IPCC special report on 1.5 C global warming is linked to perceived threat and increased concern about climate change. Clim. Chang. 2020, 158, 361–375. [Google Scholar] [CrossRef]
  3. Olivier, J.; Peters, J. Trends in Global CO2 and Total Greenhouse Gas Emissions: 2020 Report; PBL Netherlands Environmental Assessment Agency: The Hague, The Netherlands, 2020. [Google Scholar]
  4. Caldas, L.R.; Saraiva, A.B.; Lucena, A.F.; Da Gloria, M.H.Y.; Santos, A.S.; Toledo Filho, R.D. Building materials in a circular economy: The case of wood waste as CO2-sink in bio concrete. Resour. Conserv. Recycl. 2021, 166, 105346. [Google Scholar] [CrossRef]
  5. Khan, I.S.; Ahmad, M.O.; Majava, J. Industry 4.0 and sustainable development: A systematic mapping of triple bottom line, Circular Economy and Sustainable Business Models perspectives. J. Clean. Prod. 2021, 297, 126655. [Google Scholar] [CrossRef]
  6. Material Economics. Available online: https://materialeconomics.com/publications/the-circular-economy-a-powerful-force-for-climate-mitigation-1 (accessed on 30 July 2021).
  7. Circle Economy. The Circularity Gap Report. Available online: https://www.circle-economy.com/resources/circularity-gap-report-2020#:~:text=The%20Circularity%20Gap%20Report%202020,was%20first%20launched%20in%202018 (accessed on 30 July 2021).
  8. Wan, B.; Tian, L.; Fu, M.; Zhang, G. Green development growth momentum under carbon neutrality scenario. J. Clean. Prod. 2021, 316, 128327. [Google Scholar] [CrossRef]
  9. United Nations Development Programme. A 1.5 °C World Requires a Circular and Low Carbon Economy. Available online: https://www.ndcs.undp.org/content/ndc-support-programme/en/home/impact-and-learning/library/a-1-5-c-world-requires-a-circular-and-low-carbon-economy.html (accessed on 30 July 2021).
  10. Deloitte. Circular Economy Potential for Climate Change Mitigation. Available online: https://www2.deloitte.com/content/dam/Deloitte/fi/Documents/risk/Deloitte%20-%20Circular%20economy%20and%20Global%20Warming.pdf (accessed on 30 July 2021).
  11. Stahel, W.R. The circular economy. Nature 2016, 531, 435–438. [Google Scholar] [CrossRef] [PubMed] [Green Version]
  12. Korhonen, J.; Nuur, C.; Feldmann, A.; Birkie, S.E. Circular economy as an essentially contested concept. J. Clean. Prod. 2018, 175, 544–552. [Google Scholar] [CrossRef]
  13. Geissdoerfer, M.; Savaget, P.; Bocken, N.M.; Hultink, E.J. The Circular Economy–A new sustainability paradigm? J. Clean. Prod. 2017, 143, 757–768. [Google Scholar] [CrossRef] [Green Version]
  14. Grafström, J.; Aasma, S. Breaking circular economy barriers. J. Clean. Prod. 2021, 292, 126002. [Google Scholar] [CrossRef]
  15. Ellen MacArthur Foundation. Completing the Picture: How the Circular Economy Tackles Climate Change. Available online: www.ellenmacarthurfoundation.org/publications (accessed on 21 July 2021).
  16. Hobson, K.; Holmes, H.; Welch, D.; Wheeler, K.; Wieser, H. Consumption Work in the circular economy: A research agenda. J. Clean. Prod. 2021, 321, 128969. [Google Scholar] [CrossRef]
  17. Yadav, G.; Mangla, S.K.; Bhattacharya, A.; Luthra, S. Exploring indicators of circular economy adoption framework through a hybrid decision support approach. J. Clean. Prod. 2020, 277, 124186. [Google Scholar] [CrossRef]
  18. Betancourt-Morales, C.M.; Zartha-Sossa, J.W. Circular economy in Latin America: A systematic literature review. Bus. Strateg. Environ. 2020, 29, 2479–2497. [Google Scholar] [CrossRef]
  19. McDowall, W.; Geng, Y.; Huang, B.; Barteková, E.; Bleischwitz, R.; Türkeli, S.; Kempo, R.; Doménech, T. Circular economy policies in China and Europe. J. Ind. Ecol. 2017, 21, 651–661. [Google Scholar] [CrossRef] [Green Version]
  20. Ranjbari, M.; Saidani, M.; Esfandabadi, Z.S.; Peng, W.; Lam, S.S.; Aghbashlo, M.; Quatraro, F.; Tabatabaei, M. Two decades of research on waste management in the circular economy: Insights from bibliometric, text mining, and content analyses. J. Clean. Prod. 2021, 314, 128009. [Google Scholar] [CrossRef]
  21. Cantzler, J.; Creutzig, F.; Ayargarnchanakul, E.; Javaid, A.; Wong, L.; Haas, W. Saving resources and the climate? A systematic review of the circular economy and its mitigation potential. Environ. Res. Lett. 2020, 15, 123001. [Google Scholar] [CrossRef]
  22. Díaz-López, C.; Carpio, M.; Martín-Morales, M.; Zamorano, M. Defining strategies to adopt Level(s) for bringing buildings into the circular economy. A case study of Spain. J. Clean. Prod. 2021, 287, 125048. [Google Scholar] [CrossRef]
  23. Gallego-Schmid, A.; Chen, H.M.; Sharmina, M.; Mendoza, J.M.F. Links between circular economy and climate change mitigation in the built environment. J. Clean. Prod. 2020, 260, 121115. [Google Scholar] [CrossRef]
  24. Christis, M.; Athanassiadis, A.; Vercalsteren, A. Implementation at a city level of circular economy strategies and climate change mitigation–the case of Brussels. J. Clean. Prod. 2019, 218, 511–520. [Google Scholar] [CrossRef]
  25. Circular Economy Action Plan—European Commission. Available online: https://ec.europa.eu/environment/strategy/circular-economy-action-plan_es (accessed on 7 December 2021).
  26. Serrano, T.; Aparcana, S.; Bakhtiari, F.; Laurent, A. Contribution of circular economy strategies to climate change mitigation: Generic assessment methodology with focus on developing countries. J. Ind. Ecol. 2021, 25, 1382–1397. [Google Scholar] [CrossRef]
  27. Velasco-Muñoz, J.F.; Mendoza, J.M.F.; Aznar-Sánchez, J.A.; Gallego-Schmid, A. Circular economy implementation in the agricultural sector: Definition, strategies and indicators. Resour. Conserv. Recycl. 2021, 170, 105618. [Google Scholar] [CrossRef]
  28. Abramo, G.; D’Angelo, C.A.; Reale, E. Peer review versus bibliometrics: Which method better predicts the scholarly impact of publications? Scientometrics 2019, 121, 537–554. [Google Scholar] [CrossRef] [Green Version]
  29. Szomszor, M.; Adams, J.; Fry, R.; Gebert, C.; Pendlebury, D.A.; Potter, R.W.; Rogers, G. Interpreting bibliometric data. Front. Res. Metr. Anal. 2021, 5, 628703. [Google Scholar] [CrossRef] [PubMed]
  30. Miyashita, S.; Sengoku, S. Scientometrics for management of science: Collaboration and knowledge structures and complexities in an interdisciplinary research project. Scientometrics 2021, 126, 7419–7444. [Google Scholar] [CrossRef]
  31. Huang, Y.; Glänzel, W.; Zhang, L. Tracing the development of mapping knowledge domains. Scientometrics 2021, 126, 6201–6224. [Google Scholar] [CrossRef]
  32. Morales, M.E.; Batlles-de la Fuente, A.; Cortés-García, F.J.; Belmonte-Ureña, L.J. Theoretical research on circular economy and sustainability trade-offs and synergies. Sustainability 2021, 13, 11636. [Google Scholar] [CrossRef]
  33. Wacholder, N. Interactive Query Formulation. Annu. Rev. Inform. Sci. Technol. 2011, 45, 157–196. [Google Scholar] [CrossRef]
  34. Subramanyam, K. Bibliometric studies of research collaboration: A review. J. Inf. Sci. 1983, 6, 33–38. [Google Scholar] [CrossRef]
  35. Park, J.Y.; Nagy, Z. Comprehensive analysis of the relationship between thermal comfort and building control research-A data-driven literature review. Renew. Sustain. Energy Rev. 2018, 82, 2664–2679. [Google Scholar] [CrossRef]
  36. Aria, M.; Cuccurullo, C. Bibliometrix: An R-tool for comprehensive science mapping analysis. J. Informetr. 2017, 11, 959–975. [Google Scholar] [CrossRef]
  37. Flórez-Martínez, D.H.; Contreras-Pedraza, C.A.; Rodríguez, J. A systematic analysis of non-centrifugal sugar cane processing: Research and new trends. Trends Food Sci. Technol. 2020, 107, 415–428. [Google Scholar] [CrossRef]
  38. Cobo, M.J.; López-Herrera, A.G.; Herrera-Viedma, E.; Herrera, F. An approach for detecting, quantifying, and visualizing the evolution of a research field: A practical application to the fuzzy sets theory field. J. Informetr. 2011, 5, 146–166. [Google Scholar] [CrossRef]
  39. Lupton, R.C.; Allwood, J.M. Hybrid Sankey diagrams: Visual analysis of multidimensional data for understanding resource use. Resour. Conserv. Recycl. 2017, 124, 141–151. [Google Scholar] [CrossRef]
  40. De Selliers, D.; Spataru, C. Corporate Strategies for a Circular Economy: A Comparative Study of Energy Companies. In Proceedings of the 2nd International Conference on Applied Research in Management, Economics and Accounting (IARMEA 2019), Brussels, Belgium, 5–7 June 2019; Diamond Scientific Publication: Vilnius, Lithuania, 2019; pp. 28–47. [Google Scholar]
  41. Hu, G.; Wang, L.; Ni, R.; Liu, W. Which h-index? An exploration within the Web of Science. Scientometrics 2020, 123, 1225–1233. [Google Scholar] [CrossRef]
  42. Rodriguez-Anton, J.M.; Rubio-Andrada, L.; Celemín-Pedroche, M.S.; Alonso-Almeida, M.D.M. Analysis of the relations between circular economy and sustainable development goals. Int. J. Sustain. Dev. 2019, 26, 708–720. [Google Scholar] [CrossRef]
  43. Schroeder, P.; Anggraeni, K.; Weber, U. The relevance of circular economy practices to the sustainable development goals. J. Ind. Ecol. 2019, 23, 77–95. [Google Scholar] [CrossRef] [Green Version]
  44. Schröder, P.; Lemille, A.; Desmond, P. Making the circular economy work for human development. Resour. Conserv. Recycl. 2020, 156, 104686. [Google Scholar] [CrossRef]
  45. Organisation for Economic Co-Operation and Development. OECD Survey on Circular Economy in Cities and Regions, OECD. Available online: https://www.oecd-ilibrary.org/sites/1ba1a5e9-en/index.html?itemId=/content/component/1ba1a5e9-en#component-d1e10628 (accessed on 25 September 2021).
  46. Norouzi, M.; Chàfer, M.; Cabeza, L.F.; Jiménez, L.; Boer, D. Circular economy in the building and construction sector: A scientific evolution analysis. J. Build. Eng. 2021, 44, 102704. [Google Scholar] [CrossRef]
  47. Mies, A.; Gold, S. Mapping the social dimension of the circular economy. J. Clean. Prod. 2021, 321, 128960. [Google Scholar] [CrossRef]
  48. Dayeen, F.R.; Sharma, A.S.; Derrible, S. A text mining analysis of the climate change literature in industrial ecology. J. Ind. Ecol. 2020, 24, 276–284. [Google Scholar] [CrossRef]
  49. Poore, J.; Nemecek, T. Reducing food’s environmental impacts through producers and consumers. Science 2018, 360, 987–992. [Google Scholar] [CrossRef] [PubMed] [Green Version]
  50. Hwang, H.; An, S.; Lee, E.; Han, S.; Lee, C.H. Cross-Societal Analysis of Climate Change Awareness and Its Relation to SDG 13: A Knowledge Synthesis from Text Mining. Sustainability 2021, 13, 5596. [Google Scholar] [CrossRef]
  51. Alamerew, Y.A.; Brissaud, D. Modelling reverse supply chain through system dynamics for realizing the transition towards the circular economy: A case study on electric vehicle batteries. J. Clean. Prod. 2020, 254, 120025. [Google Scholar] [CrossRef]
  52. Baars, J.; Domenech, T.; Bleischwitz, R.; Melin, H.E.; Heidrich, O. Circular economy strategies for electric vehicle batteries reduce reliance on raw materials. Nat. Sustain. 2021, 4, 71–79. [Google Scholar] [CrossRef]
  53. Wrålsen, B.; Prieto-Sandoval, V.; Mejia-Villa, A.; O’Born, R.; Hellström, M.; Faessler, B. Circular business models for lithium-ion batteries-Stakeholders, barriers, and drivers. J. Clean. Prod. 2021, 317, 128393. [Google Scholar] [CrossRef]
  54. Feiferytė-Skirienė, A.; Stasiškienė, Ž. Seeking Circularity: Circular Urban Metabolism in the Context of Industrial Symbiosis. Sustainability 2021, 13, 9094. [Google Scholar] [CrossRef]
  55. Agrawal, R.; Wankhede, V.A.; Kumar, A.; Luthra, S.; Huisingh, D. Progress and trends in integrating Industry 4.0 within Circular Economy: A comprehensive literature review and future research propositions. Bus. Strat. Environ. 2021, in press. [Google Scholar] [CrossRef]
  56. Agrawal, R.; Wankhede, V.A.; Kumar, A.; Luthra, S. Analysing the roadblocks of circular economy adoption in the automobile sector: Reducing waste and environmental perspectives. Bus. Strat. Environ. 2021, 30, 1051–1066. [Google Scholar] [CrossRef]
  57. Agrawal, R.; Wankhede, V.A.; Kumar, A.; Upadhyay, A.; Garza-Reyes, J.A. Nexus of circular economy and sustainable business performance in the era of digitalization. Int. J. Product. Perform. 2021, in press. [Google Scholar] [CrossRef]
  58. Agrawal, R.; Wankhede, V.A.; Kumar, A.; Luthra, S. A systematic and network-based analysis of data-driven quality management in supply chains and proposed future research directions. TQM J. 2021, in press. [Google Scholar] [CrossRef]
  59. Oguntuase, O.J.; Adu, O.B. Bioeconomy as Climate Action: How ready are African Countries? In African Handbook of Climate Change Adaptation; Leal Filho, W., Oguge, N., Ayal, D., Adeleke, L., da Silva, I., Eds.; Springer: Cham, Switzerland, 2020; pp. 2519–2533. [Google Scholar]
  60. Liu, Z.; Wang, K.; Chen, Y.; Tan, T.; Nielsen, J. Third-generation biorefineries as the means to produce fuels and chemicals from CO2. Nat. Catal. 2020, 3, 274–288. [Google Scholar] [CrossRef]
  61. Barros, M.V.; Salvador, R.; de Francisco, A.C.; Piekarski, C.M. Mapping of research lines on circular economy practices in agriculture: From waste to energy. Renew. Sustain. Energy Rev. 2020, 131, 109958. [Google Scholar] [CrossRef]
  62. Sharma, S.; Basu, S.; Shetti, N.P.; Aminabhavi, T.M. Waste-to-energy nexus for circular economy and environmental protection: Recent trends in hydrogen energy. Sci. Total Environ. 2020, 713, 136633. [Google Scholar] [CrossRef] [PubMed]
  63. Loizidou, M.; Moustakas, K.; Rehan, M.; Nizami, A.S.; Tabatabaei, M. New developments in sustainable waste-to-energy systems. Renew. Sustain. Energy Rev. 2021, 151, 111581. [Google Scholar] [CrossRef]
  64. Stefanakis, A.I.; Calheiros, C.S.; Nikolaou, I. Nature-based solutions as a tool in the new circular economic model for climate change adaptation. Circ. Econ. Sustain. 2021, 1, 303–318. [Google Scholar] [CrossRef]
  65. Castro, C.V.; Rifai, H.S. Development and Assessment of a Web-Based National Spatial Data Infrastructure for Nature-Based Solutions and Their Social, Hydrological, Ecological, and Environmental Co-Benefits. Sustainability 2021, 13, 11018. [Google Scholar] [CrossRef]
  66. Martín, E.G.; Giordano, R.; Pagano, A.; van der Keur, P.; Costa, M.M. Using a system thinking approach to assess the contribution of nature-based solutions to sustainable development goals. Sci. Total Environ. 2020, 738, 139693. [Google Scholar] [CrossRef] [PubMed]
  67. van Ewijk, S.; Stegemann, J.A.; Ekins, P. Limited climate benefits of global recycling of pulp and paper. Nat. Sustain. 2021, 4, 180–187. [Google Scholar] [CrossRef]
Figure 1. Global descriptive statistics of (A) annual trend of publications and citations, and (B) annual trend of subject areas from Scopus on climate change and CE (2010–2020).
Sustainability 14 00521 g001
Figure 2. Co-authorship interaction among the most productive countries in publications on climate change and CE research (2010–2020). The colors (red and green) represent the clusters formed based on the cooperation country co-autorship network.
Sustainability 14 00521 g002
Figure 3. Sankey diagram on the evolutionary path of the keywords associated with the interconnection between climate change and the CE in the last decade.
Sustainability 14 00521 g003
Figure 4. Co-occurrence matrix of keywords associated with climate actions, CE strategies, highly GHG-emitting materials, and SDG 13 in the work on climate change and CE in the last 10 years. The data used to create this figure can be found in Table S1.
Sustainability 14 00521 g004
Figure 5. Map based on co-occurrence on the authors keywords on climate change and CE from 2010 to 2020.
Sustainability 14 00521 g005
Figure 6. Thematic map on the degree of importance and development of the lines of research. The bubbles represent clusters of keywords (themes). Their names are the most relevant keyword based on their co-occurrence. Quadrants classify clusters as follows: upper-right quadrant (central and developed), lower-right quadrant (central and undeveloped), lower-left quadrant (peripheral and developed), and upper-left quadrant (peripheral and undeveloped).
Sustainability 14 00521 g006
Publisher’s Note: MDPI stays neutral with regard to jurisdictional claims in published maps and institutional affiliations.

