
Exploring the Potential of Internet News for Supply Risk Assessment of Metals


1
Department of Technology Management for Innovation, Graduate School of Engineering, The University of Tokyo, Tokyo 113-8656, Japan
2
Department of Systems Innovation, Graduate School of Engineering, The University of Tokyo, Tokyo 113-8656, Japan
*
Author to whom correspondence should be addressed.
Sustainability 2022, 14(1), 409; https://doi.org/10.3390/su14010409
Submission received: 10 December 2021
/
Revised: 28 December 2021
/
Accepted: 29 December 2021
/
Published: 31 December 2021
(This article belongs to the Section Resources and Sustainable Utilization)
Abstract
:The growth in demand for material resources is inevitable to maintain sustainable development. Especially for metallic minerals, this growth in demand increases the supply risk; therefore, its evaluation is essential to keep the resource supply stable. Supply risk assessment has a long history in both academic and practical studies, but there is no existing study using internet news as its main information source. In this study, we obtained related news articles from S&P Global Market Intelligence (SPG) and used them for the supply risk analysis. Using already topic-labeled articles and a gradient boosting framework, non-labeled articles are also labeled and categorized by topic. The articles were assigned to metallic minerals by SPG. We also scored each article using simple sentiment analysis. In short, we found significant potential in internet news articles as information for complementary assessments to existing methods, by providing in-depth information on regulatory or corporate financial activities, which are difficult to cover using the existing numerical indices. While it is useful, it should be noted that the volume of news articles depends on the interests of their readers, and many articles capture changes rather than states. As long as they are used with these caveats in mind, news articles can be very useful as a complementary source of information to existing analytical methods, especially for short-term supply risk assessment.
1. Introduction
The demand for material resources is constantly growing due to the rapidly expanding global population, economic development, and the demand for various products that support it. The concern for a tighter supply and demand for mineral resources has led to the need for criticality assessment research to maintain sustainable development. Starting from the pioneering work by the US NRC [1], we can find many studies from various perspectives. The work of Graedel et al. [2] is the early and comprehensive methodological literature. Some studies have focused on minerals for specific applications, such as renewable energies [3]. The European Commission’s critical raw material list is one of the well-known works that has been periodically revised [4]. Most studies evaluate the supply risks and economic importance, or vulnerability, of the supply disruption to each mineral, and try to assess the criticality. Schrijvers et al. [5] conducted a recent and comprehensive review that focused on methodologies and data. This suggests that the definition of goals and scopes is quite important to choose appropriate indicators and aggregation methodology, while data availability and quality remain huge issues for many studies.
Helbig et al. [6] reviewed existing studies from both the indicator selection and normalization perspectives. They revealed that the 88 studies reviewed employed 618 indicators, all of which can be classified into 10 categories. From their review and our own review of the existing works, we find that there are no existing studies on metallic minerals using news articles or other texts/documents from the internet as the data source for supply risk assessment.
The supply risk is essential information in criticality assessment and is, therefore, still often studied by academicians. However, supply risk assessment is not just important for criticality assessment, but is, of course, important information for related industries, policy makers, and even consumers who eventually need these minerals in the form of final products. Narayan [7] analyzed oil market news to predict stock returns. Shah et al. [8] reviewed studies that utilized text mining techniques for supply chain risk management in the apparel industry. It was found that 370 research articles existed in the industry. The reason why supply risk assessments have not utilized news texts in criticality assessments and related fields is not clear. Differences in the type of risk and time horizon to be considered may be part of the reason, that is, the need to only focus on very detailed and, in terms of the overall news on the internet, very narrow and specific articles. It is necessary to consider both the very long-term perspective, such as resource depletion, and the current accident information at the same time.
Considering the recent progress in natural language processing (NLP) and the increasing amount of information on the internet, it is worth exploring the potential of internet news as the data source for the supply risk assessment of minerals, to overcome the data availability and quality issues suggested by Schrijvers et al. [5]. However, the topic of news articles on the internet varies widely and may include information that may lead to supply risks. However, not all articles contain such information. Therefore, it is necessary to extract the news articles we need to consider and categorize the articles by topic and scores to assign a certain weight to negative content, which may lead to risks. As a starting point, this study aims to obtain mining-related news articles, and then classify the articles obtained from the internet by the type of mineral they cover and their topic, and score each article in accordance with the purpose of this study. The final objective is to discuss the potential of news articles obtained from the internet in the evaluation of supply risk using the results of the evaluation in an actual trial. The pros and cons of the use of internet news are examined, and future directions are discussed. Our primal focus is supply risk assessment for criticality assessment and related studies, which has increased in importance and the number of studies is still growing.
2. Materials and Methods
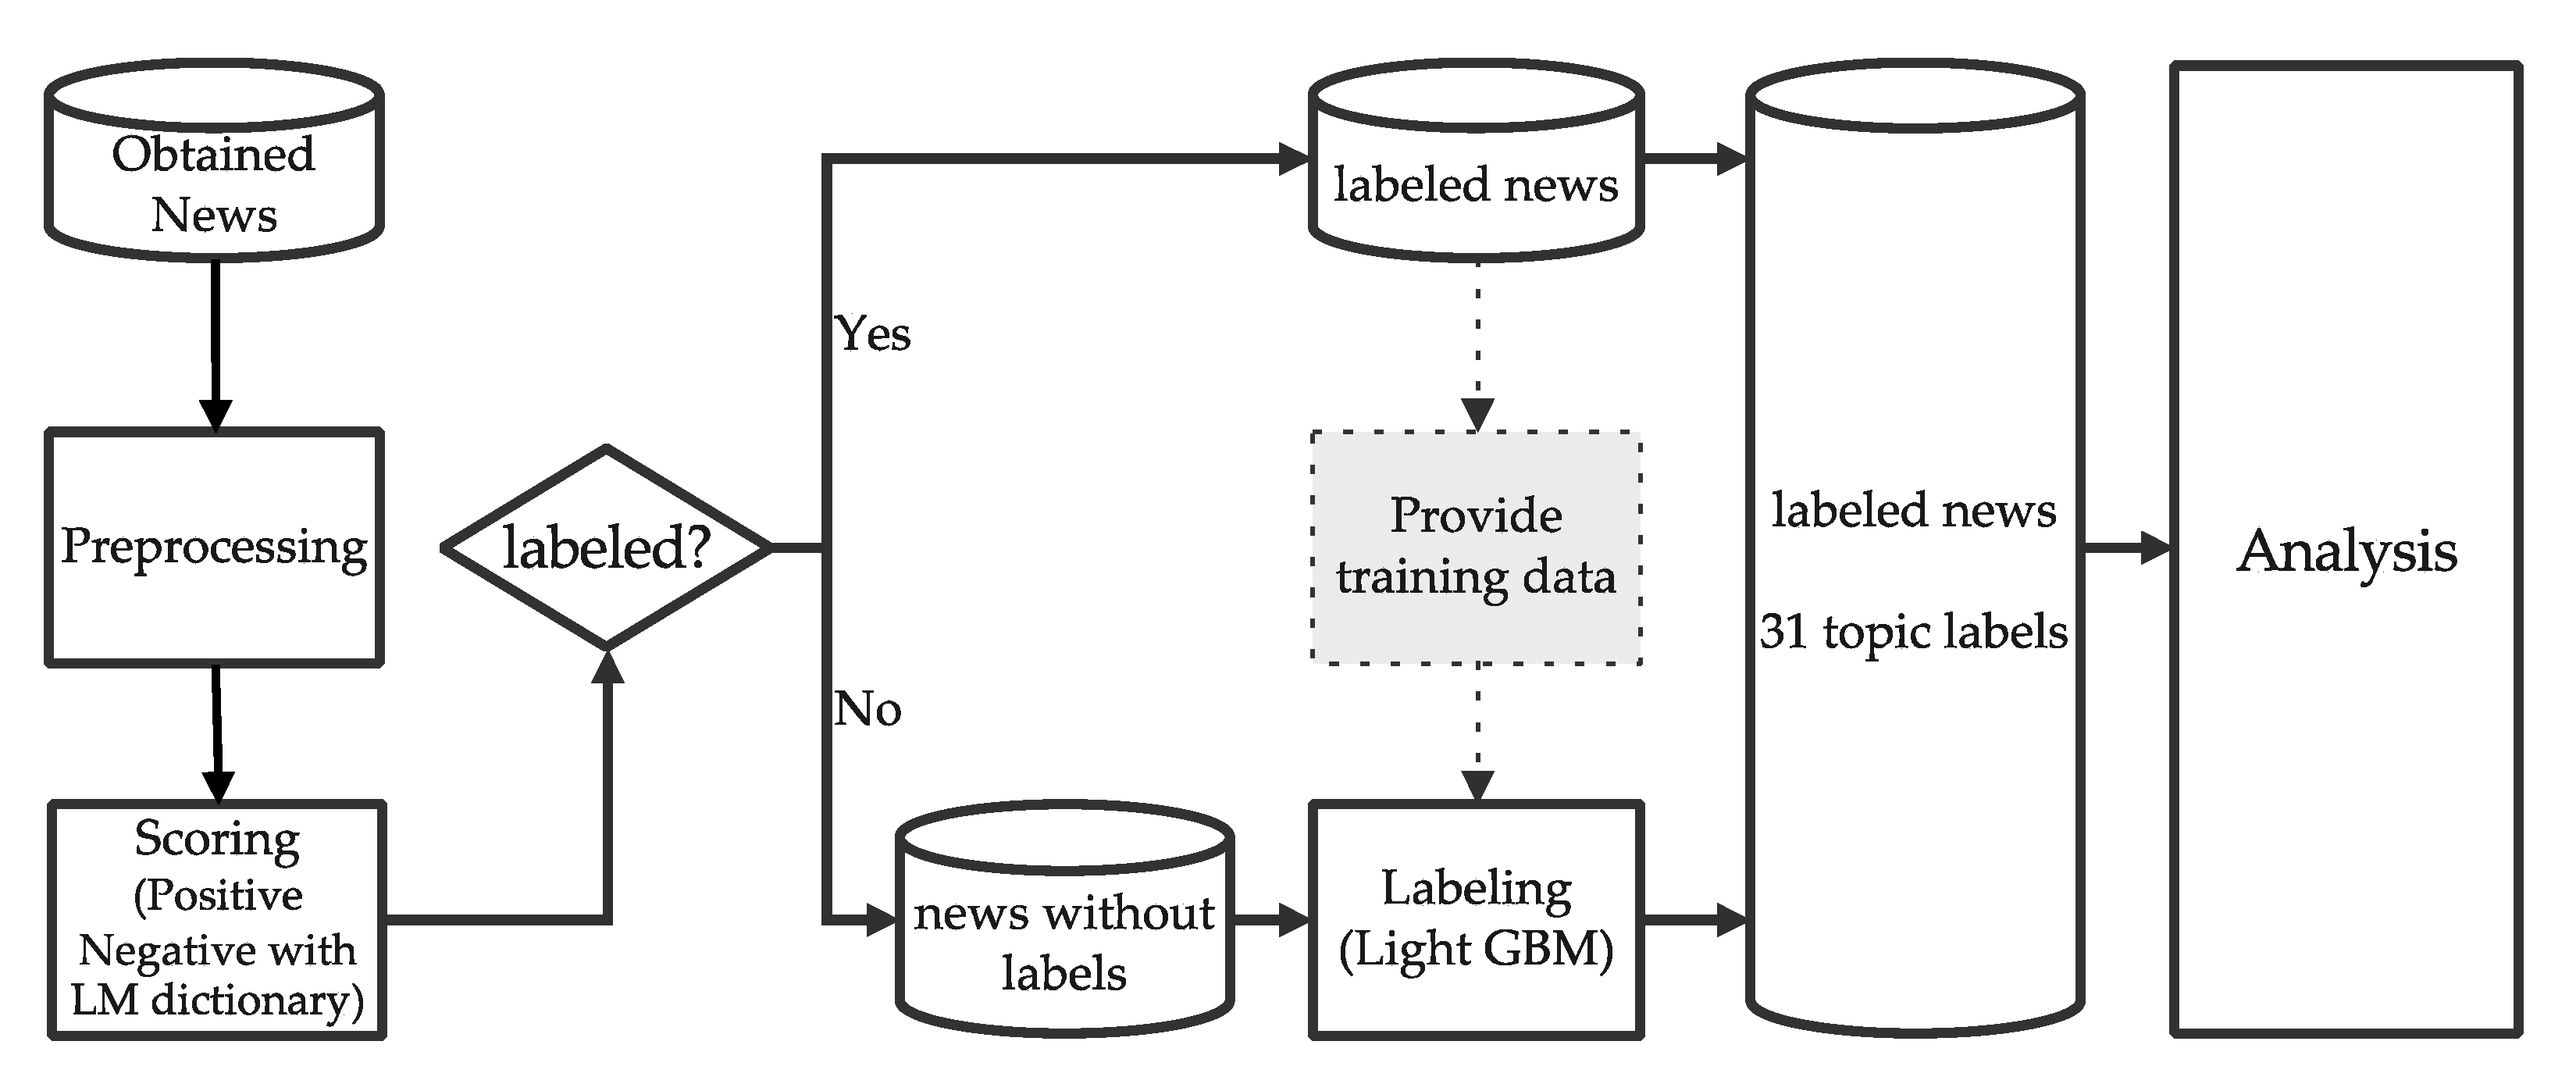
Our analysis can be divided into the following five parts: (1) data acquisition, (2) preprocessing, (3) scoring each news article (positive–negative analysis), (4) labeling the news without labels, and (5) analyzing the results. The overall flow is shown in Figure 1.
2.1. Data Acquisition
We decided to limit our scope to only one media, S&P Global Market Intelligence (when we carried out this study, the name of the service was S&P Global Market Intelligence; it has now been renamed S&P Capital IQ Pro. Hereafter, we refer to this as SPG) [9]. It can categorize the news into the defined industry. For this time, we chose the news related to the metal and mining sector. SPG is a financial information service. Our simple assumption is that negative financial news articles for specific metals reflect potential supply risks. Not all but some of the news was labeled, which is a useful feature for this study. Considering these characteristics, we believe that news from this service is a good starting point for exploring the potential of internet news.
The news obtained is from January 2013 to May 2020, which varies depending on the minerals. The information is organized by minerals; therefore, we can simply download news articles for each mineral. It continuously organizes the news and deletes old data when the limit is exceeded, which is not disclosed. We took as much news as possible when we started our analysis at the end of May 2020. Eleven metals were chosen for analysis based on the number of news items available. The period and the number of news items obtained are listed in Table 1. For gold and copper, there is a significant amount of news available, but we cannot find much for minor elements, such as tungsten. We expected more news for cobalt, but there was not much available. Of course, one news item can appear for multiple minerals; for example, news related to copper–gold mines appears for both copper and gold. After excluding all duplications, we obtained 41,223 unique articles.
For each news article, the following items were obtained: title, date of post, author’s name, and main text. As mentioned, some news was labeled by topics, and in that case, the topic label was also obtained. Originally, 43 topic labels were present. However, considering the importance to our purpose and the number of articles assigned, we chose 31 topics for our analysis. The number of news articles for the 31 labels is listed in Table 2. A news article can have multiple labels. News with labels was used as training data for labeling the news without labels.
2.2. Methods
2.2.1. Preprocessing
All preprocessing and analysis introduced in the following sections were performed using the natural language toolkit (NLTK) in Python. [10] The obtained news articles were written in English. Before the analysis, the following preprocessing steps were performed:
- ∙
- Changing capital letters to lower case letters;
- ∙
- Deleting numbers;
- ∙
- Deleting stopwords;
- ∙
- Deleting unnecessary characters (!”#$%&()*+,-./:;<=>?@[\\]^_‘{|}~);
- ∙
- Extracting nouns, verbs, and adjectives;
- ∙
- Lemmatizing words if needed.
2.2.2. Positive–Negative Analysis
Considering that this study aims to utilize internet news to develop a supply risk indicator, we need to obtain numeric scores from the news, while the methodology should be simple rather than complicated. We employed the simplest form of sentiment analysis. Using the Loughran and McDonald word dictionary (LM dictionary) [11], which defines positive words and negative words, and is widely used in the analysis of financial text, both positive and negative words in the news article were counted. To score the degree of negativeness in measuring the potential risk, we calculated the score for the article using the following formula:
, P, N, , , and denote the raw score of the article “t”, the number of positive/negative words in the article “t”, normalized score of the article “t”, and the mean and standard deviation of the scores of all articles evaluated, respectively. In addition, in Equation (1), when neither positive nor negative words from the LM dictionary appear in article , we set 0 as the article’s because it is not different from the articles with only positive words appearing in this context. Hereafter, the news articles including at least one negative word will be called “negative news” to distinguish them from those without any negative words.
2.2.3. Labeling Topics
It is now possible to calculate a single score for a single metal by aggregating or calculating the mean of the scores for all articles of the metal. However, understanding the risk factors that are of more serious concern is important for developing metal-specific countermeasures. In addition, if there is any article that cannot fit into the topics we prepared as potential risk information, the article may not be included in our analysis.
Therefore, we further classified the news articles on each metal into 31 categories using topic labels, and calculated their scores. In this section, we describe our method of assigning 31 topics to articles that do not have topic labels.
When we use the news source of SPG, there are news articles with topic labels, which seems useful in our analysis. However, there are also many unlabeled articles; for example, we obtained more than 26,000 articles for gold, and approximately 12,000 articles were assigned topic labels. To use the rest, which were unlabeled articles, we used the labeled news articles as training data and assigned topics to the articles. We employed a gradient boosting framework with the Light Gradient Boosting Machine (LightGBM) package in Python [12].
Sometimes one article is assigned multiple topic labels. SPG also assigned one “primary topic.” Using this primary topic, we categorized all the labeled articles into each topic. Randomly sampling 100 articles from each topic, the articles were subdivided into 70 training and 30 test data for model validation. For topics with less than 100 articles available, the available articles were divided into the same ratio of training to test data. The model performance was evaluated using these datasets. The model outputs the probability of fitting an article to all 31 labels. Our purpose of this labeling is not to cluster news articles into the independent categories. A single article may contain information related to multiple risk factors, and the goal is to determine if the article is relevant to our topic labels. Therefore, we validate our model by checking whether the three topic labels with the highest probabilities include the primary topic assigned by SPG. Eventually, the model successfully suggested the top three topics, which included the primary topic of 87% of the total articles. We randomly selected and checked the remaining 13% of the articles and found that no articles were assigned as completely wrong and useless topics. Therefore, the top three topic labels suggested by this model will be used as labels for articles without topic labels.
3. Results
3.1. Scores for Each Article
The raw scores of each article were distributed as shown in Figure 2. A smaller value indicates higher negativity. By definition, the scores ranged from −1 to 0; zero means that there are no negative words in the article, while −1 means that the article contains negative words, but no positive words, and, therefore, has the highest negativity. As shown in the figure, a significant number of articles had a score of zero, and, therefore, they were non-negative articles. Except for these, a huge number of articles received a score of −1, the most negative by this definition. Above the histogram, the box plot is also depicted, and it has the first and third quartiles, −1 and 0, respectively. The median value was −0.4375.
The distribution of normalized scores for each mineral is summarized in Figure 3. As expected from Figure 2, the first and third quartiles of most metals are equal to the minimum and maximum values. However, the first quartile value for lead was greater than the minimum. For palladium, both quartiles were different from the minimum and maximum values. In the case of palladium, the smaller third quartile value means that the number of non-negative news items was quite small. Comparing the median values for all the metals, platinum, iron, and palladium had small and, therefore, more negative scores. Tungsten had the highest value, followed by gold, cobalt, and lead.
The distribution of normalized scores for each topic is summarized in Figure 4. Using the methodology described in Section 2.2.3, the unlabeled articles are labeled. The number of news articles with topic labels is shown in Figure 4. In contrast to the comparison among metals, the comparison among topics shows a large difference in distribution. Many of the topics whose distributions are skewed towards negative values are R_2 (Regulation, Policy & Law_ Civil & Criminal Actions) and R_3 (Regulation, Policy & Law_ Courts), as is the case for I_3 (Mining_Coal transportation); however, the number of articles for I_3 is too small. It seems reasonable that the first two topics had relatively negative scores.
However, the following topic distributions are skewed towards higher values: F_1 (Commodities), C_6 (ESG_Environmental), I_1 (Industry News), I_4 (Mining_Demand), I_6 (Mining_Production), I_7 (Mining_Smelting & Refining), S_1 (Electric Generation), S_2 (Environment), S_4 (Renewables), and S_5 (Upstream). For these topics, we found many news articles that contain positive topics, such as more preferable technological developments and their implementation at the sites, increasing demand, and corporates’ environmental protection activity, which may be positively valued in the context of ESG.
3.2. Shares and Scores of Negative Articles
The score for each article can be used to measure the potential supply risk shown in the article. Moreover, the total number of negative news articles is potential information that can be used to measure the absolute number of negative articles. In addition, the shares of the article with those including at least one negative word are another piece of information that can show how far the negative articles dominate the news for specific metals and/or topics. The shares of the total number of negative news articles for each topic are listed in Table 3. In addition, the mean values of the news articles are organized by topics for each metal in Figure 5, while the articles are limited to those that include at least one negative word.
From Table 3, the number of articles ranged from 49 (I_3: Mining_Coal transportation) to 12,001 (C_2: Capital Markets.) The number of articles not only reflects the amount of different information, but also reflects the market’s interest in the topic; for example, if our interest in ESG-related topics increases, then the number of articles may increase, even though the events related to ESG remain the same. Therefore, we should be careful when considering how to utilize this information. It is just a coincidence that I_3 has the highest share of negative news (91.8%), while S_4 (Renewables) has the lowest share (39.5%). Combining these two, it is possible to capture the general interest in the topic from the market and the extent to which negative information is included in the set of articles.
Furthermore, among the negative news articles, the degree of negativity can be summarized by the mean value of the scores for the negative articles, as shown in Figure 5. The set of articles does not include articles without any negative words; therefore, it is different from the set used in Figure 4. In Figure 5, red indicates that the score is more negative. Once again, R_2, 3 and 5 show negative scores for all the metals, along with I_9 (Mining_Mine Safety) and C_1 (Bankruptcy & Distressed). Some topics show different impacts depending on the metals; for example, C_6 (ESG_Environmental) has a seriously negative score for platinum, but not for many others, especially for tungsten. As mentioned, the share of negative news for this topic is relatively low; therefore, the mean value of the scores for all the articles is not bad, as shown in Figure 4. News on the same topic can have different meanings depending on the subject. This case shows that simply examining the number of news articles based on the topic classification is insufficient.
4. Discussion
The primary objective of this study is to explore the potential of internet news articles for the supply risk assessment of metals, by considering that negative news articles can include potential risks for mineral supply. Following this, we score each article with the help of NLP, categorized by metals and news topics, and the results are shown. Here, we explore the potential use of the risk assessment results.
4.1. Comparison among Metals
In Figure 6, the mean value of the scores of the negative articles and the share of the negative articles are shown on the horizontal and vertical axes, respectively, with the bubble size reflecting the total number of news articles. The horizontal axis depicts the average degree of negativity, the vertical axis shows the dominance of negative articles in all the metal articles, and the bubble size reflects the general interest in the metal. Of course, by combining the vertical axis value and the bubble size, we can also know the amount of negative information. Since a smaller score indicates more negativeness, the horizontal axis is reversed. From the mean value, gold and cobalt are the two metals with the most negative scores. From Figure 5, almost all the topics, other than R_1 (Rates & Tariffs) and F_3 (Ratings & Research), show negative values for gold. In the case of cobalt, there are many topics with higher and, therefore, less negative scores, such as F_1 (Commodities), C_6 to C_8 (ESG-related topics), and S_5 (Upstream).
From the vertical axis, we find that palladium, platinum, and iron have a higher share of negative articles. However, the mean value of the score indicates that palladium is the least negatively scored. Comparing palladium and platinum in Figure 5, which are both platinum group metals, both metals have significantly negative scores for R_2 and R_3 (Regulation, Policy & Law-related topics), similarly to the other metals. However, for the other topics, the patterns are completely different. Even though these two metals have similar applications, such as jewelry or automobile catalysts, there are some differences that may cause this difference, such as the share of resource-producing countries; platinum is completely dominated by South Africa, but Russia produces more platinum than South Africa.
A similar mean value and share to platinum was obtained for iron. In Figure 5, the number of topics with a red color for iron is much smaller than that for platinum. Therefore, even though the mean value is similar, the topics that cause this negative score are limited to iron. The comparisons between cobalt and gold, and also between iron and platinum, suggest the importance of checking which topics are concerns for the metals of interest, which is possible by using our dataset with labeled topics.
4.2. Historical Changes in Single Metal
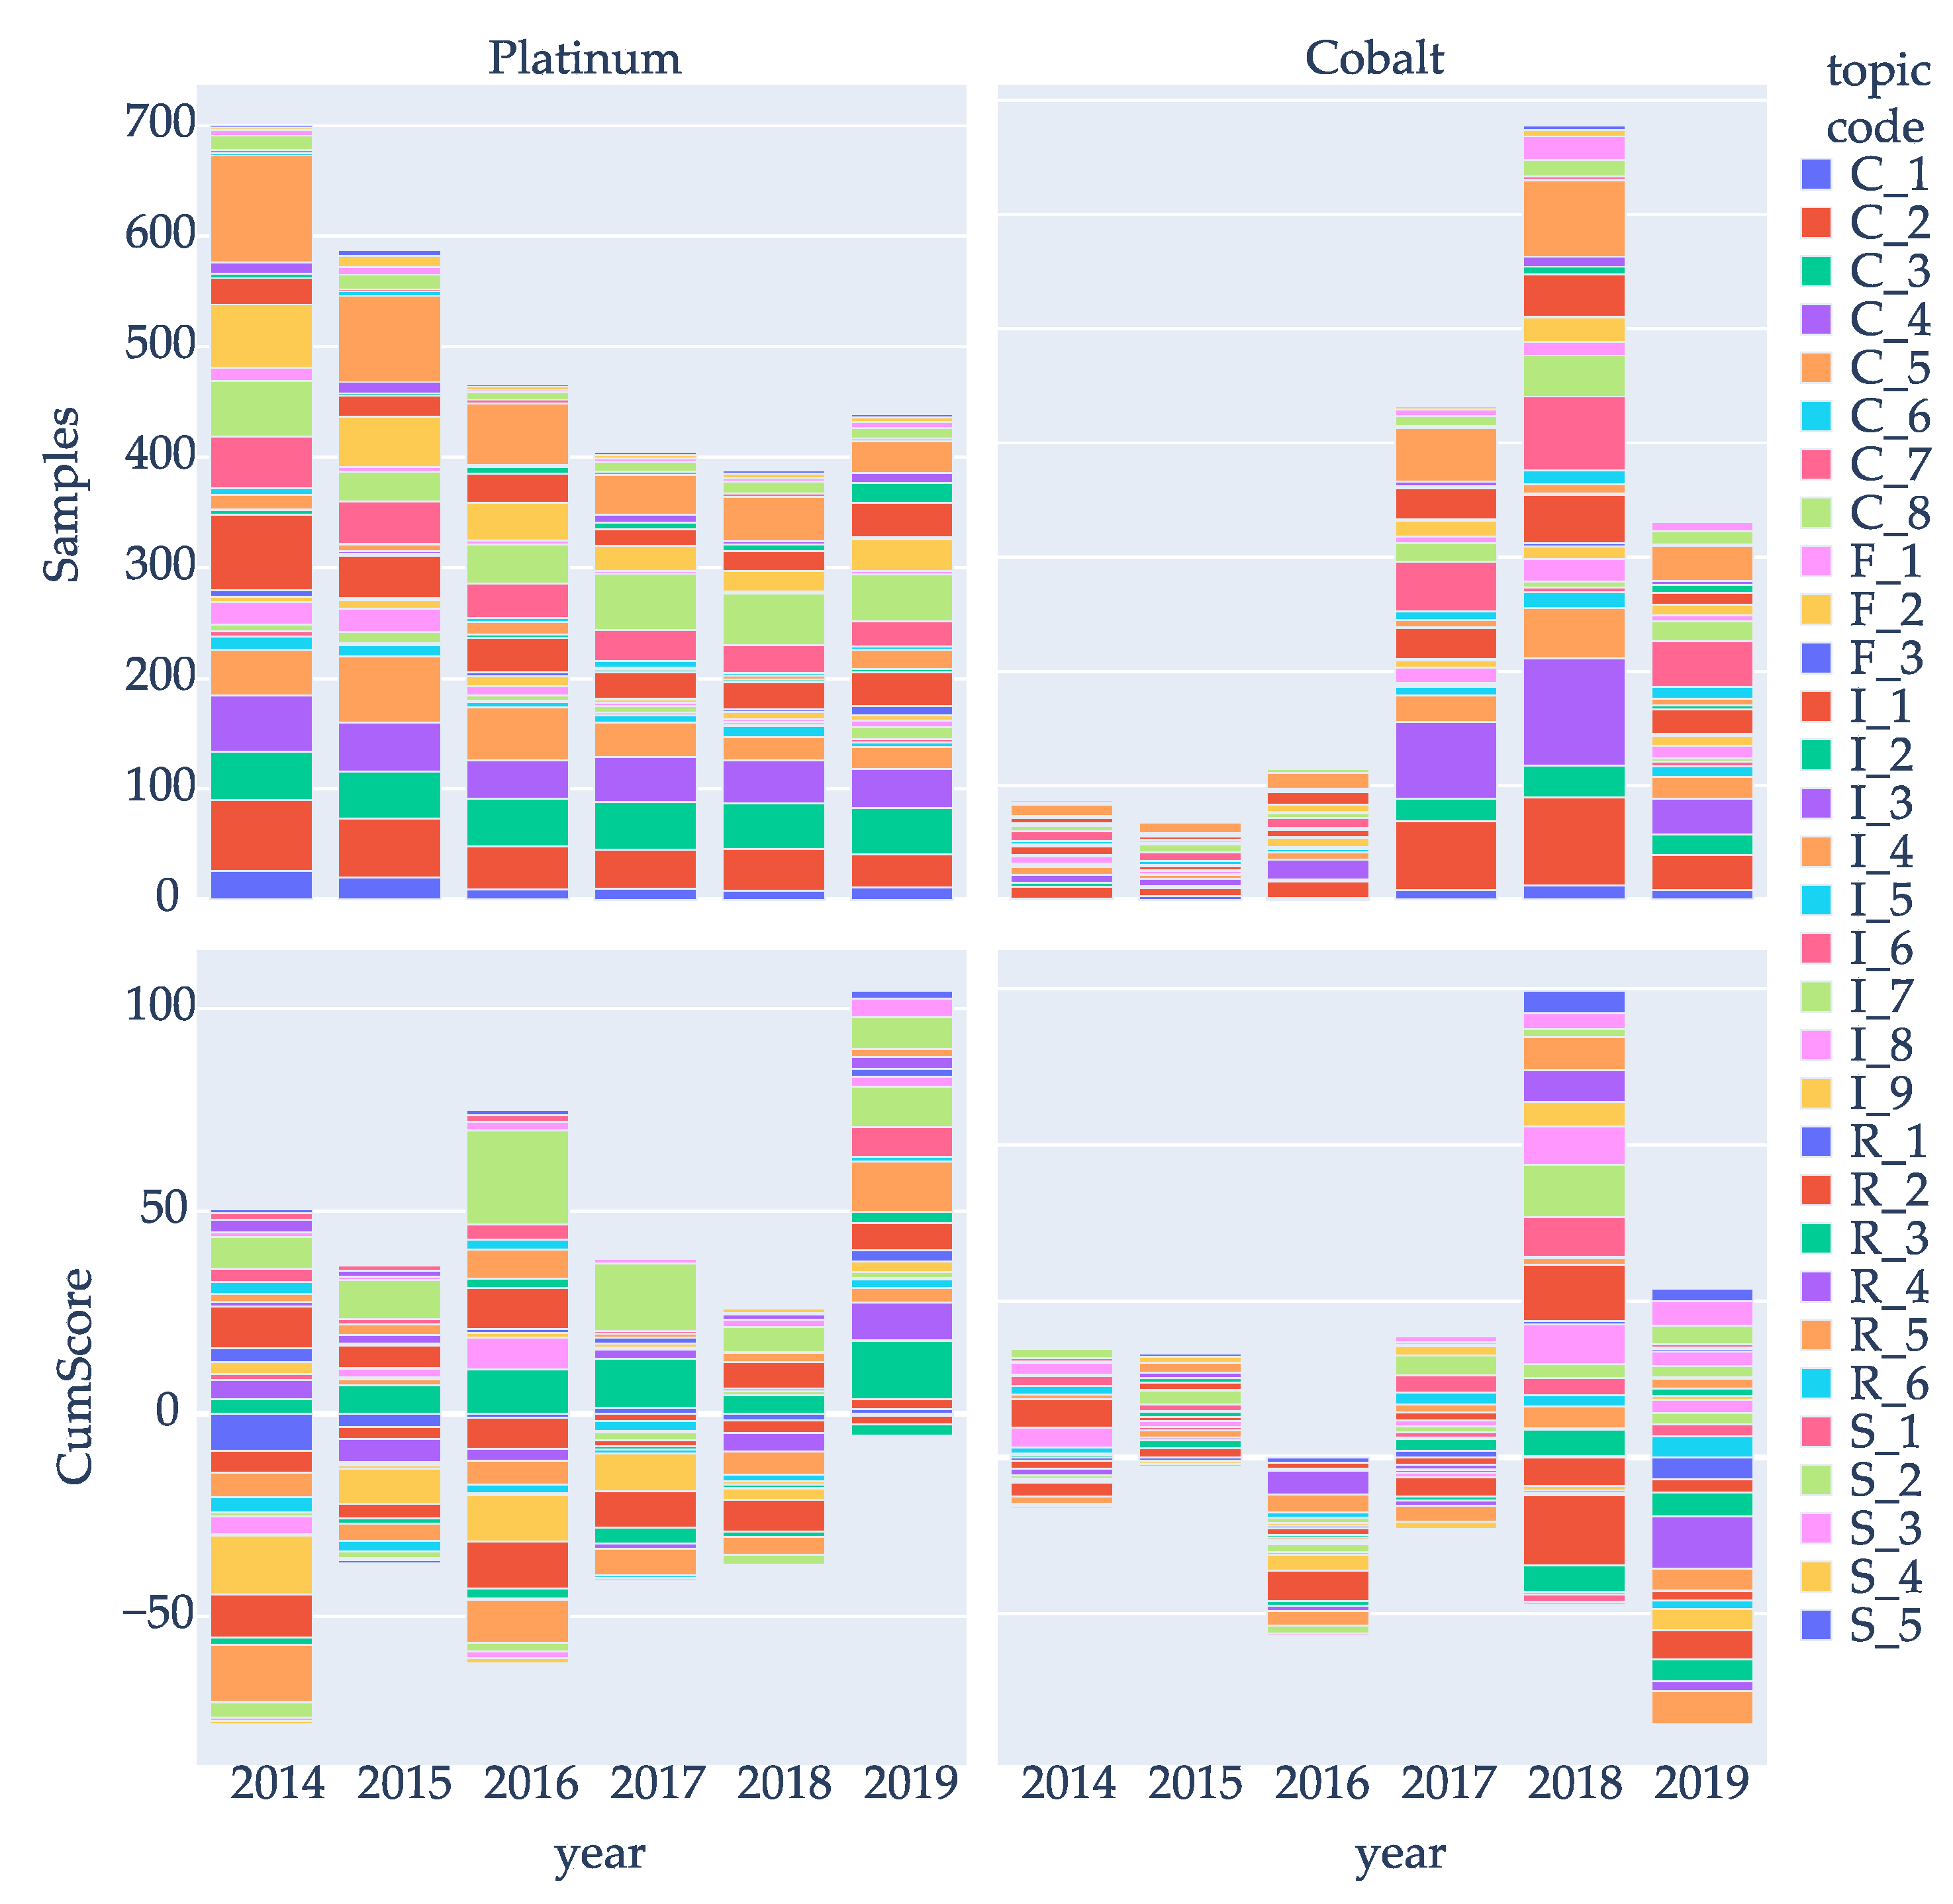
Another use for our dataset is to identify the historical change in the scores for one metal. In Table 4, the mean values of the scores for the negative articles, the total number of articles, and the share of negative articles are summarized from 2014 to 2019. Figure 7 shows a comparison between cobalt and platinum. Cobalt was chosen as an example of the metals, which has become a growing social concern in recent years, with a rapid increase in demand. On the other hand, platinum is an example of a prototypical critical metal in existing works [1,4]. The plot includes both the number of negative articles (top row) and the cumulative score (second row), which is simply the sum of all the negative articles’ scores, organized by topics. No articles of cobalt were obtained for 2013; therefore, it was excluded from Table 4. Our dataset also includes limited parts of the 2020 articles excluded here.
As expected, the number of both total and negative articles for cobalt increased until 2018 and slightly decreased in 2019. The number of articles for the following topics dramatically increased: C_2 (Capital Markets), C_4 (In the Boardroom), I_6 (Mining_Production), and R_5 (Regulation, Policy & Law_ Regulatory Activity). The first three topics relate to individual corporate or industry activities, such as investment, production, and planning. The sharp increase in the number of cobalt news articles in 2018 is a sign of interest in cobalt in many ways, and especially in I_6, where many articles are about increasing production to meet the growing demand for cobalt. This works in a positive direction for scoring. On the other hand, R_5 also increases, but the news is related to regulations, which works to lower the score. From the mean value, the value for 2016 was significantly negative, as shown in Figure 7. Almost all the topics contribute in a negative direction. However, in 2018, many topics became less negative. For cobalt, R_2 (Regulation, Policy & Law_ Civil & Criminal Actions) always works in the negative direction. The four aforementioned topics, for which there was a significant increase in the number of articles, did not significantly impact the score. Evidently, R_2 is important for cobalt. The number of articles continued to increase, while its mean value remained mostly negative.
For platinum, even though the total number of articles changed, the shares between the topics are relatively stable. From the cumulative score, C_2 (Capital Markets), I_9 (Mining_Mine Safety), R_2 (Regulation, Policy & Law_ Civil & Criminal Actions), and R_5 (Regulation, Policy & Law_ Regulatory Activity) always work significantly in the negative direction.
The scores for I_6 (Mining_Production) generally show good correlation with the physical supply data. However, the news often captured the change or the factors that contributed to it, and, thus, often showed the change rather than the absolute size of production.
4.3. Pros and Cons of Using Internet News Articles
From the previous analysis, the important topics varied depending on the metal. Considering that metals are produced in different areas, with different technologies and different supply–demand scenarios, this seems rational. We can observe one of the advantages of utilizing news articles with detailed topic labels in this study.
Regulatory information and governance indicators are hardly quantitively available in many traditional supply risk assessments for minerals. Therefore, many analyses utilize the World Governance Indicator (WGI) [13] or indices provided by mining consulting companies [14]. By using internet news, we can add another relatively neutral information source to our analysis.
Dewulf et al. [15] comprehensively organized the factors to be covered for the supply risk assessment under the TERP framework, as shown in Table 5. Comparing our topic with the factors in Table 5, our topics cover regulatory and social factors (R), and political stability and governance factors (P). For the factors listed in T (technical, physical and geological factors) and E (economic, strategic and market supply risk factors), for example, factors 4 and 5 (concentration) can be quantitatively analyzed by simply calculating the Herfindahl–Hirschman Index (HHI); therefore, they do not need any help from news articles. However, even in category E, 6, 8, 9, and 10 can utilize information from news articles. Regarding category T, a potentially huge contribution comes from I_9 (Mining_Mine Safety) because it includes accident information. It is not explicitly included in this TERP organization, but is obviously an important part of category T, while it may also relate to R as a social factor. For the category P, as already mentioned, most studies employ the WGI or other indices from mining consultants. Considering its stable coverage and definition, this approach should be employed. However, our approach can provide more detailed and up-to-date information. In short, in many categories, we believe that our approach can complement existing approaches in many cases.
Helbig et al. [6] organized the indices used in existing supply risk assessment research. They proposed the following 10 categories: concentration, scarcity, political instability, regulations, by-product dependence, dependence on primary production, demand growth, lack of substitution options, price volatility, import dependence, and others. From their work, most of the existing literature mainly utilizes numerical indicators that can be calculated from official statistics or other publicly available information. Our approach is complementary in the sense that it quantifies areas that are not covered by indicators, such as regulations, policies (R_1 to 6), and mine safety (I_9.) In addition, the fact that the corporates’ financial decisions can be analyzed in detail can be another advantage.
In recent years, there has been a huge increase in the number of accidents related to the mining industry, the reaction of the local population to these accidents, and the changes in regulations to cope with them, and using the conventional indicators is becoming insufficient. The method proposed in this study is based on news articles, which makes it possible to extract breaking news and socially important issues.
The ability of a neutral third party to assess the risk of such matters is of great significance to stakeholders who have had difficulty obtaining such information in the past, such as investors who are considering investing in the mine in question, or remote countries that depend on imports from the country. Consumers of the final products using these minerals will find this information very important to make decisions about ethical consumption, and technology developers will also be able to learn about which events are currently important to society. Considering the increasing importance of the information in category R of TERP, internet news articles have huge potential for the supply risk assessment of minerals.
It is important to note that most news articles capture the change and not the state of the industry; for example, articles for one huge accident reduce the scores. However, once this accident has finished, we may not see many pieces of information regarding it. As a result, we cannot know the current situation of the mine or related situations. In that sense, from our analysis, internet news articles have an advantage in short-run supply risk assessment. In addition, even though the amount of news reflects the importance of the content, the importance is for the audience, but not for society as a whole. In our case, since we obtained the news articles from SPG, the importance is for the investors. Recently, investments have to be made considering broader issues, such as ESG; therefore, we believe that SPG is not a bad starting point as an information source. When we expand the source, we should be careful to understand the number of news articles.
5. Conclusions
This study aimed to explore the potential of using news articles on the internet to measure mineral supply risks. Using SPG as a news source, we obtained news articles on metal from the beginning, avoiding the need to assign news articles to metal types. The biggest advantage was that there was a sufficient number of articles that were labeled with topics by SPG, so we used these as supervised data for machine learning, specifically LightGBM, to assign topic labels to non-labeled news articles.
The potential reason for the difficulty in using news articles to assess the supply risk of mineral resources is that it is difficult to obtain news articles of quite specific and narrow fields from huge internet news pools, and to automate the classification by topic. The classification of articles in this study is a great advantage. In the future, it is worth trying to determine if using a similar processing method is possible for articles other than SPG.
By combining this labeled dataset with the scores given to each article by simple positive–negative analysis, we aggregated the scores by metal, topic, and year. By aggregating the scores for each metal, we can compare the degree of negativity for each metal. By considering which topic contributes to the negativity, we can observe which kind of risk factors are huge concerns for each metal. Among the topics, the availability of a large amount of information on regulations, governance, and accidents is an area in which traditional supply risk assessment in criticality assessment has been weak, and can provide important information to a wide range of stakeholders, from investors and policy makers to consumers.
News articles can provide up-to-date information compared to widely used indices, such as WGI, for governance, and their use represents the advantage of our approach. In addition, using news articles makes it possible to check the historical changes in the metals in detail. In this context, in this study, we decided not to include the impacts from one of the most important ongoing supply chain disasters of COVID-19, because our dataset only covered the beginning of this still ongoing event. In the literature pertaining to supply chain management, this issue has already been analyzed [16,17]. This issue is now having a huge impact on the supply of materials. However, we need to be careful about how to include this issue in the context of supply risk assessment in this field.
There are some concerns as well. Firstly, internet news is provided based on the readers’ interests; for example, gold has the largest number of articles among the studied metals. Considering that our dataset is obtained from a financial information service, this sounds quite natural. However, this does not mean that gold has the highest risk. Another important point is that news articles provide the changes and not the status of the industry. The results from some topic categories may focus on the current news too much for our purpose. This is different from the risk assessment for supply chain management. Conducting a detailed discussion on time horizon is a task that still remains. Considering these pros and cons of using internet news articles, our approach should be used as a complementary method to existing approaches that mainly use publicly available statistics and other indices.
We found huge potential in internet news articles for supply risk assessment. Because our purpose is to explore the potential of this information, the analytical approach is simple. The use of more sophisticated methodologies will be a task for the future.
Author Contributions
Conceptualization, S.M. (Shinsuke Murakami); data curation, S.M. (Shunya Muraoka); formal analysis, S.M. (Shinsuke Murakami) and S.M. (Shunya Muraoka); methodology, S.M. (Shunya Muraoka); supervision, S.M. (Shinsuke Murakami); writing—original draft, S.M. (Shunya Muraoka); writing—review and editing, S.M. (Shinsuke Murakami). All authors have read and agreed to the published version of the manuscript.
Funding
This research was funded by the New Energy and Industrial Technology Development Organization (NEDO), JPNP 17001. The APC was funded by a research grant from The Asahi Glass Foundation.
Conflicts of Interest
The authors declare no conflict of interest.
References
- National Research Council. Minerals, Critical Minerals, and the U.S. Economy; National Academies Press: Washington, DC, USA, 2008; Available online: https://nap.edu/catalog/12034/minerals-critical-minerals-and-the-us-economy (accessed on 28 December 2021).
- Graedel, T.E.; Barr, R.; Chandler, C.; Chase, T.; Choi, J.; Christoffersen, L.; Friedlander, E.; Henly, C.; Jun, C.; Nassar, N.T.; et al. Methodology of Metal Criticality Determination. Environ. Sci. Technol. 2012, 46, 1063–1070. [Google Scholar] [CrossRef]
- Grandell, L.; Lehtilä, A.; Kivinen, M.; Koljonen, T.; Kihlman, S.; Lauri, L.S. Role of critical metals in the future markets of clean energy technologies. Renew. Energy 2016, 95, 53–62. [Google Scholar] [CrossRef]
- European Commission. Study on the Eu’s List of Critical Raw Materials (2020), Critical Raw Materials Factsheets. Brussels. 2020. Available online: https://doi.org/10.2873/11619 (accessed on 28 December 2021).
- Schrijvers, D.; Hool, A.; Blengini, G.A.; Chen, W.-Q.; Dewulf, J.; Eggert, R.; van Ellen, L.; Gauss, R.; Goddin, J.; Habib, K.; et al. A review of methods and data to determine raw material criticality. Resour. Conserv. Recycl. 2020, 155, 104617. [Google Scholar] [CrossRef]
- Helbig, C.; Bruckler, M.; Thorenz, A.; Tuma, A. An Overview of Indicator Choice and Normalization in Raw Material Supply Risk Assessments. Resources 2021, 10, 79. [Google Scholar] [CrossRef]
- Narayan, P.K. Can stale oil price news predict stock returns? Energy Econ. 2019, 83, 430–444. [Google Scholar] [CrossRef]
- Shah, S.; Lütjen, M.; Freitag, M. Text Mining for Supply Chain Risk Management in the Apparel Industry. Appl. Sci. 2021, 11, 2323. [Google Scholar] [CrossRef]
- S&P Global Market Intelligence (Currently Renamed to S&P Capital IQ Pro). Available online: https://www.spglobal.com/en/ (accessed on 28 December 2021).
- Natural Language Toolkit. Available online: https://www.nltk.org (accessed on 28 December 2021).
- Loughran, T.; McDonald, B. When Is a Liability Not a Liability? Textual Analysis, Dictionaries, and 10-Ks. J. Financ. 2011, 66, 35–65. [Google Scholar] [CrossRef]
- LightGBM. Available online: https://lightgbm.readthedocs.io/ (accessed on 28 December 2021).
- World Bank Worldwide Governance Indicators (WGI). Available online: https://info.worldbank.org/governance/wgi/ (accessed on 2 June 2020).
- Fraser Institute. Annual Survey of Mining Companies. 2020. Available online: https://www.fraserinstitute.org/studies/annual-survey-of-mining-companies-2020 (accessed on 28 December 2021).
- Dewulf, J.; Blengini, G.A.; Pennington, D.; Nuss, P.; Nassar, N.T. Criticality on the international scene: Quo vadis? Resour. Policy 2016, 50, 169–176. [Google Scholar] [CrossRef] [Green Version]
- Farooq, M.U.; Hussain, A.; Masood, T.; Habib, M.S. Supply Chain Operations Management in Pandemics: A State-of-the-Art Review Inspired by COVID-19. Sustainability 2021, 13, 2504. [Google Scholar] [CrossRef]
- Hussain, A.; Farooq, M.U.; Habib, M.S.; Masood, T.; Pruncu, C.I. COVID-19 Challenges: Can Industry 4.0 Technologies Help with Business Continuity? Sustainability 2021, 13, 11971. [Google Scholar] [CrossRef]
Figure 1.
Overall flow of data processing and the analysis.

Figure 2.
Distribution of the raw scores for all unique articles (smaller value shows more negativeness).
Figure 2.
Distribution of the raw scores for all unique articles (smaller value shows more negativeness).
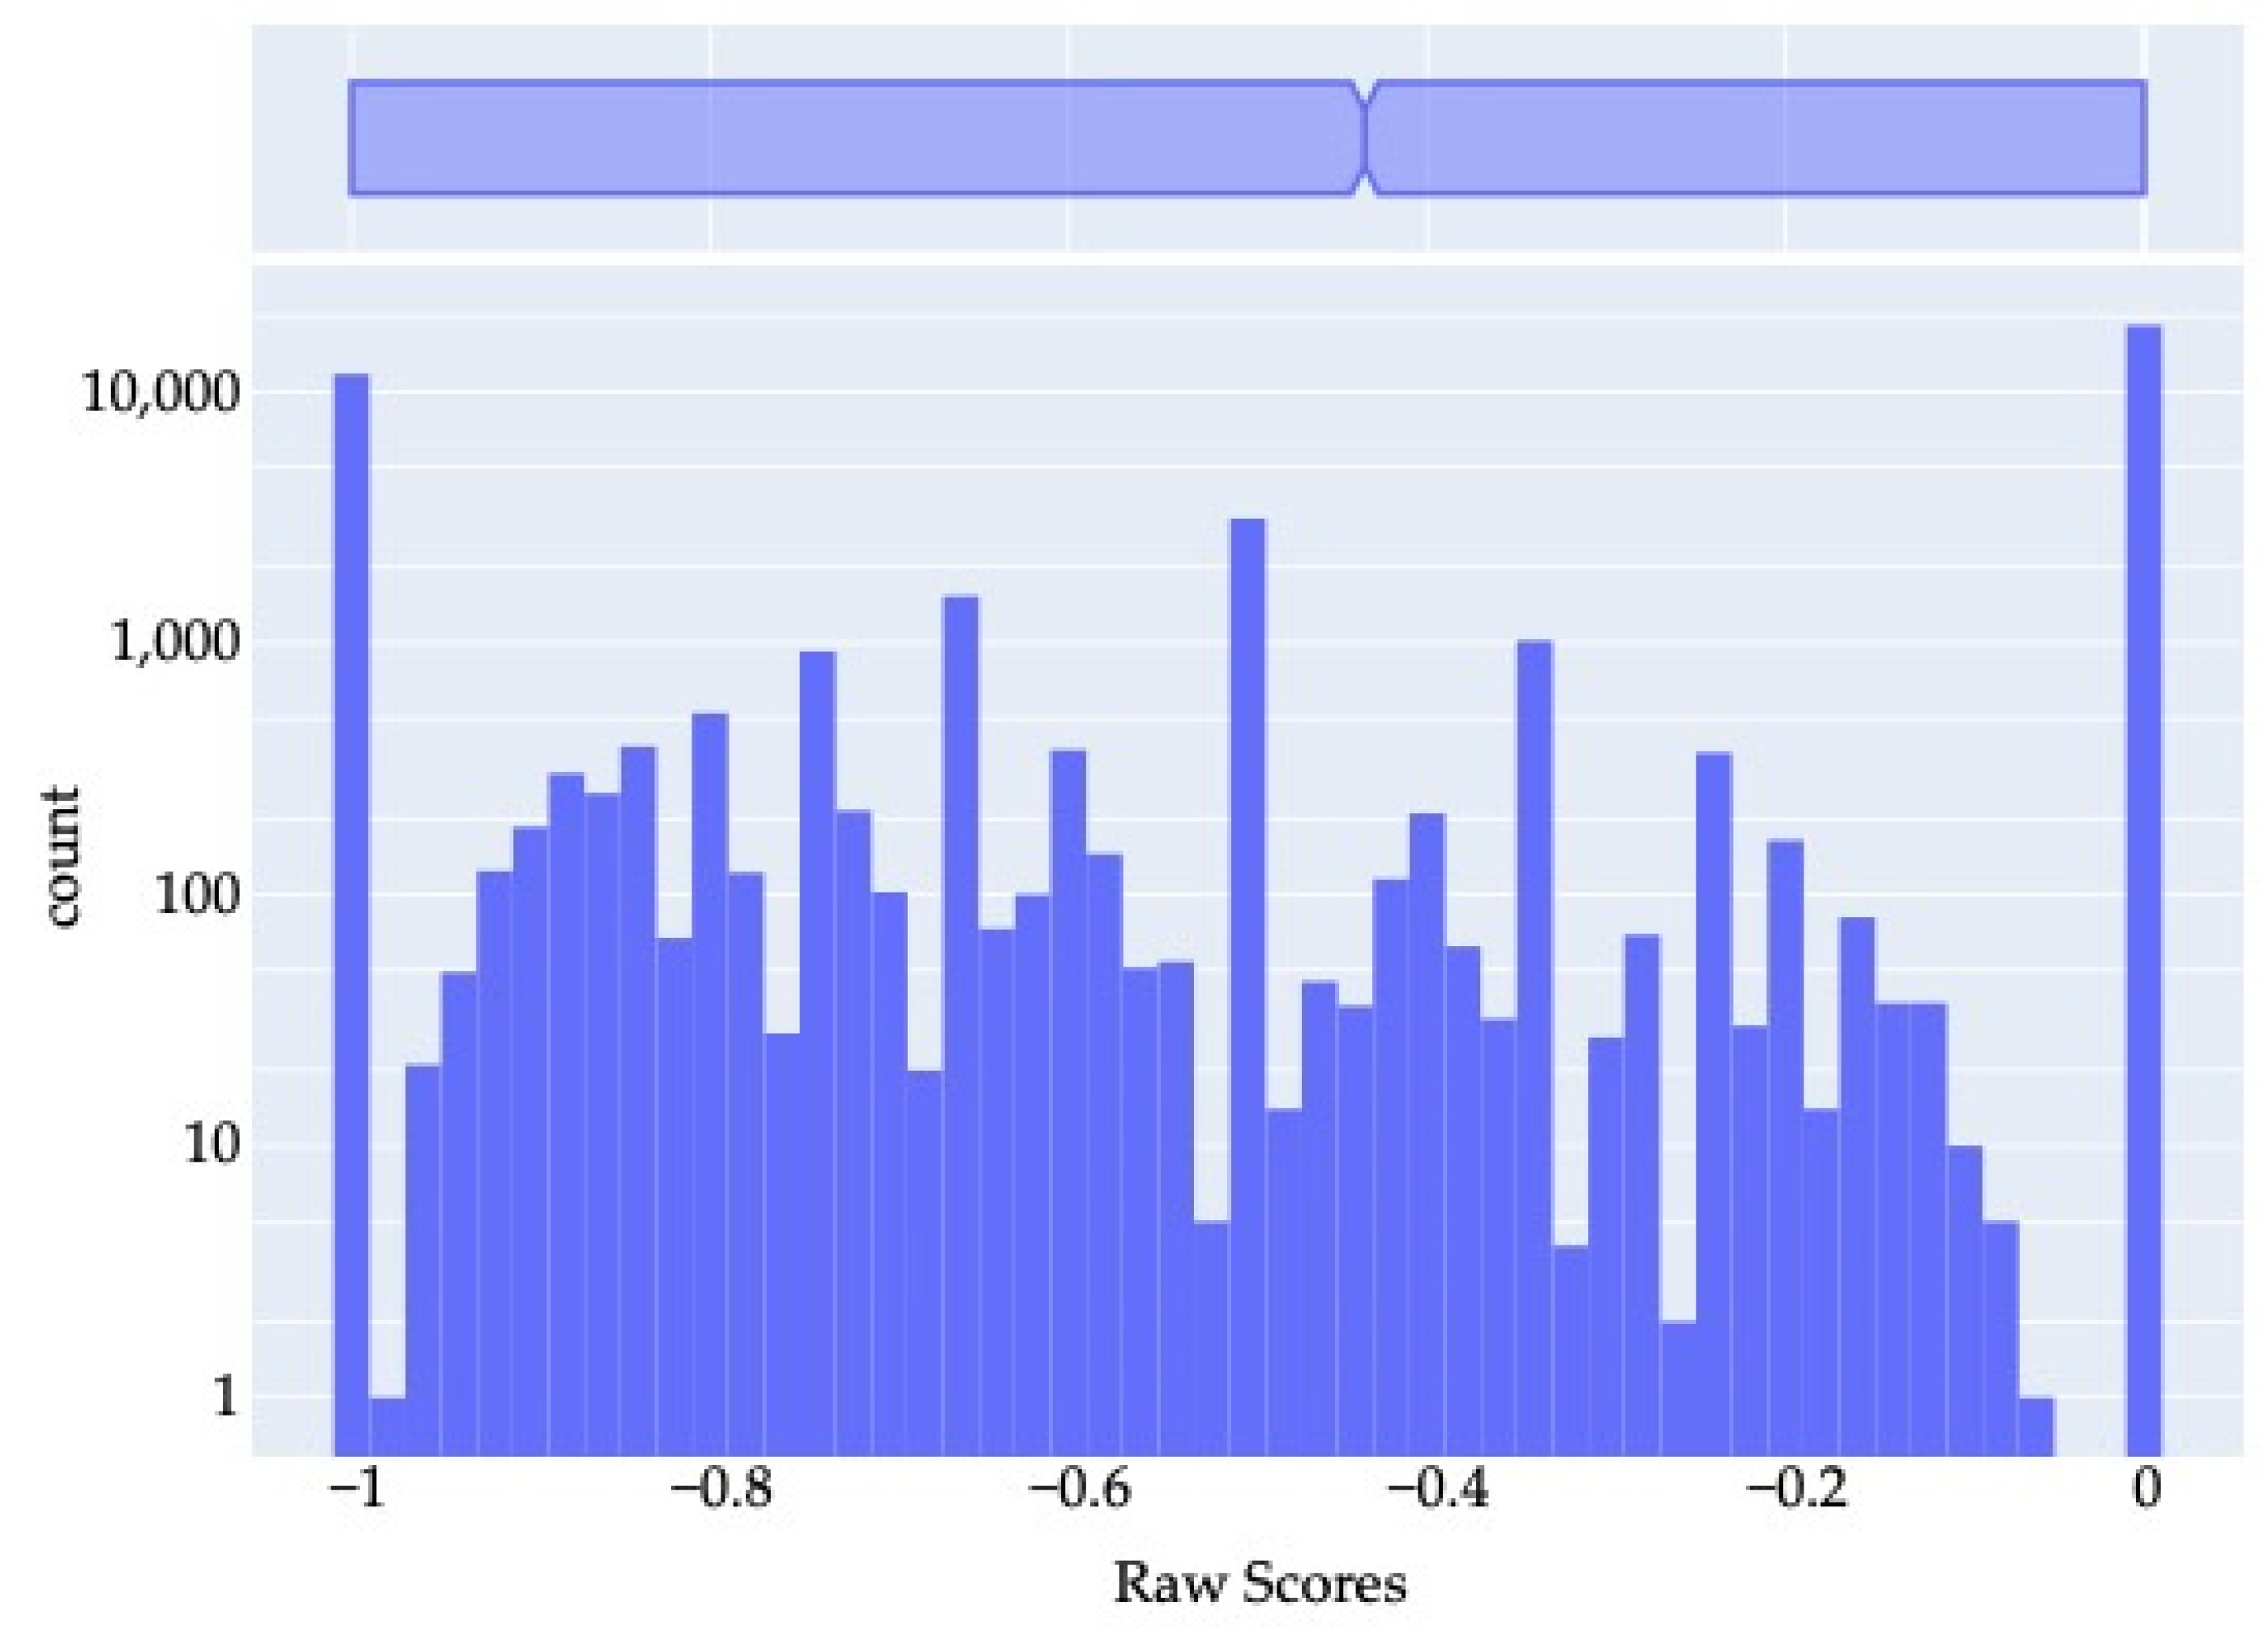
Figure 3.
Distribution of the normalized scores for each mineral (n is the number of unique news articles for each metal. Smaller value shows more negativeness).
Figure 3.
Distribution of the normalized scores for each mineral (n is the number of unique news articles for each metal. Smaller value shows more negativeness).
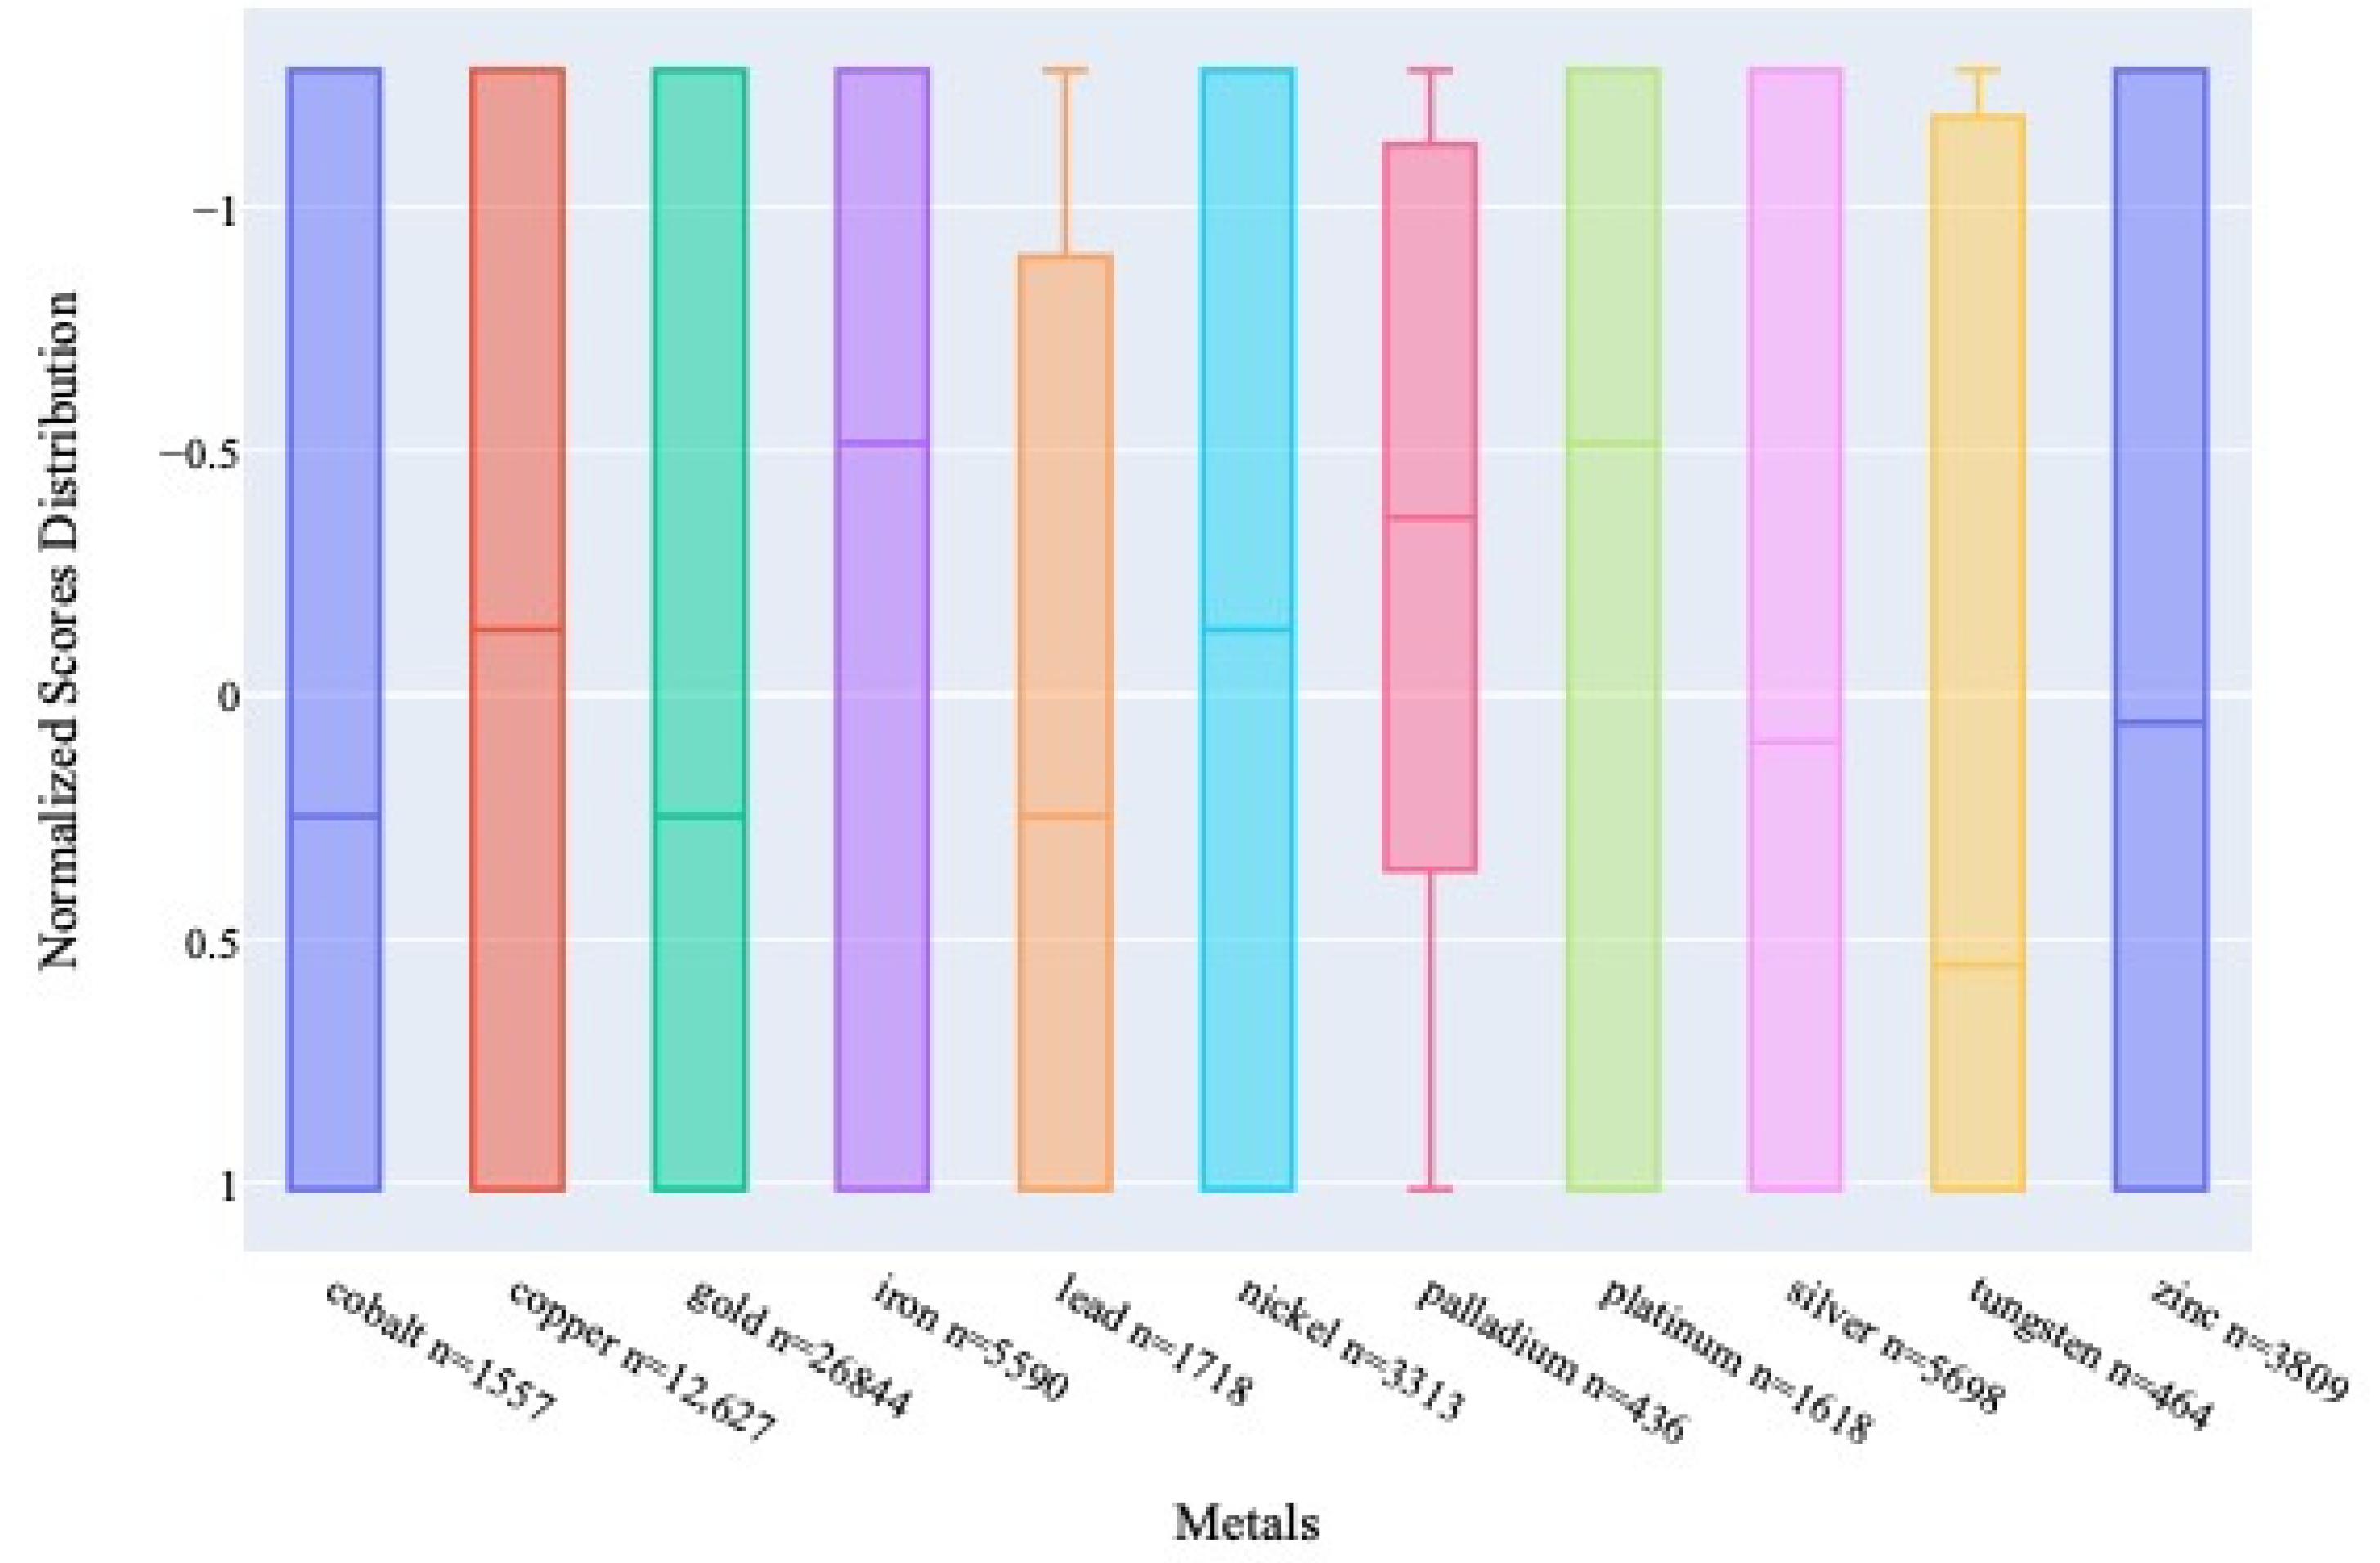
Figure 4.
Distribution of the normalized scores for each topic (n is the number of unique news articles for each topic. Smaller value shows more negativeness).
Figure 4.
Distribution of the normalized scores for each topic (n is the number of unique news articles for each topic. Smaller value shows more negativeness).
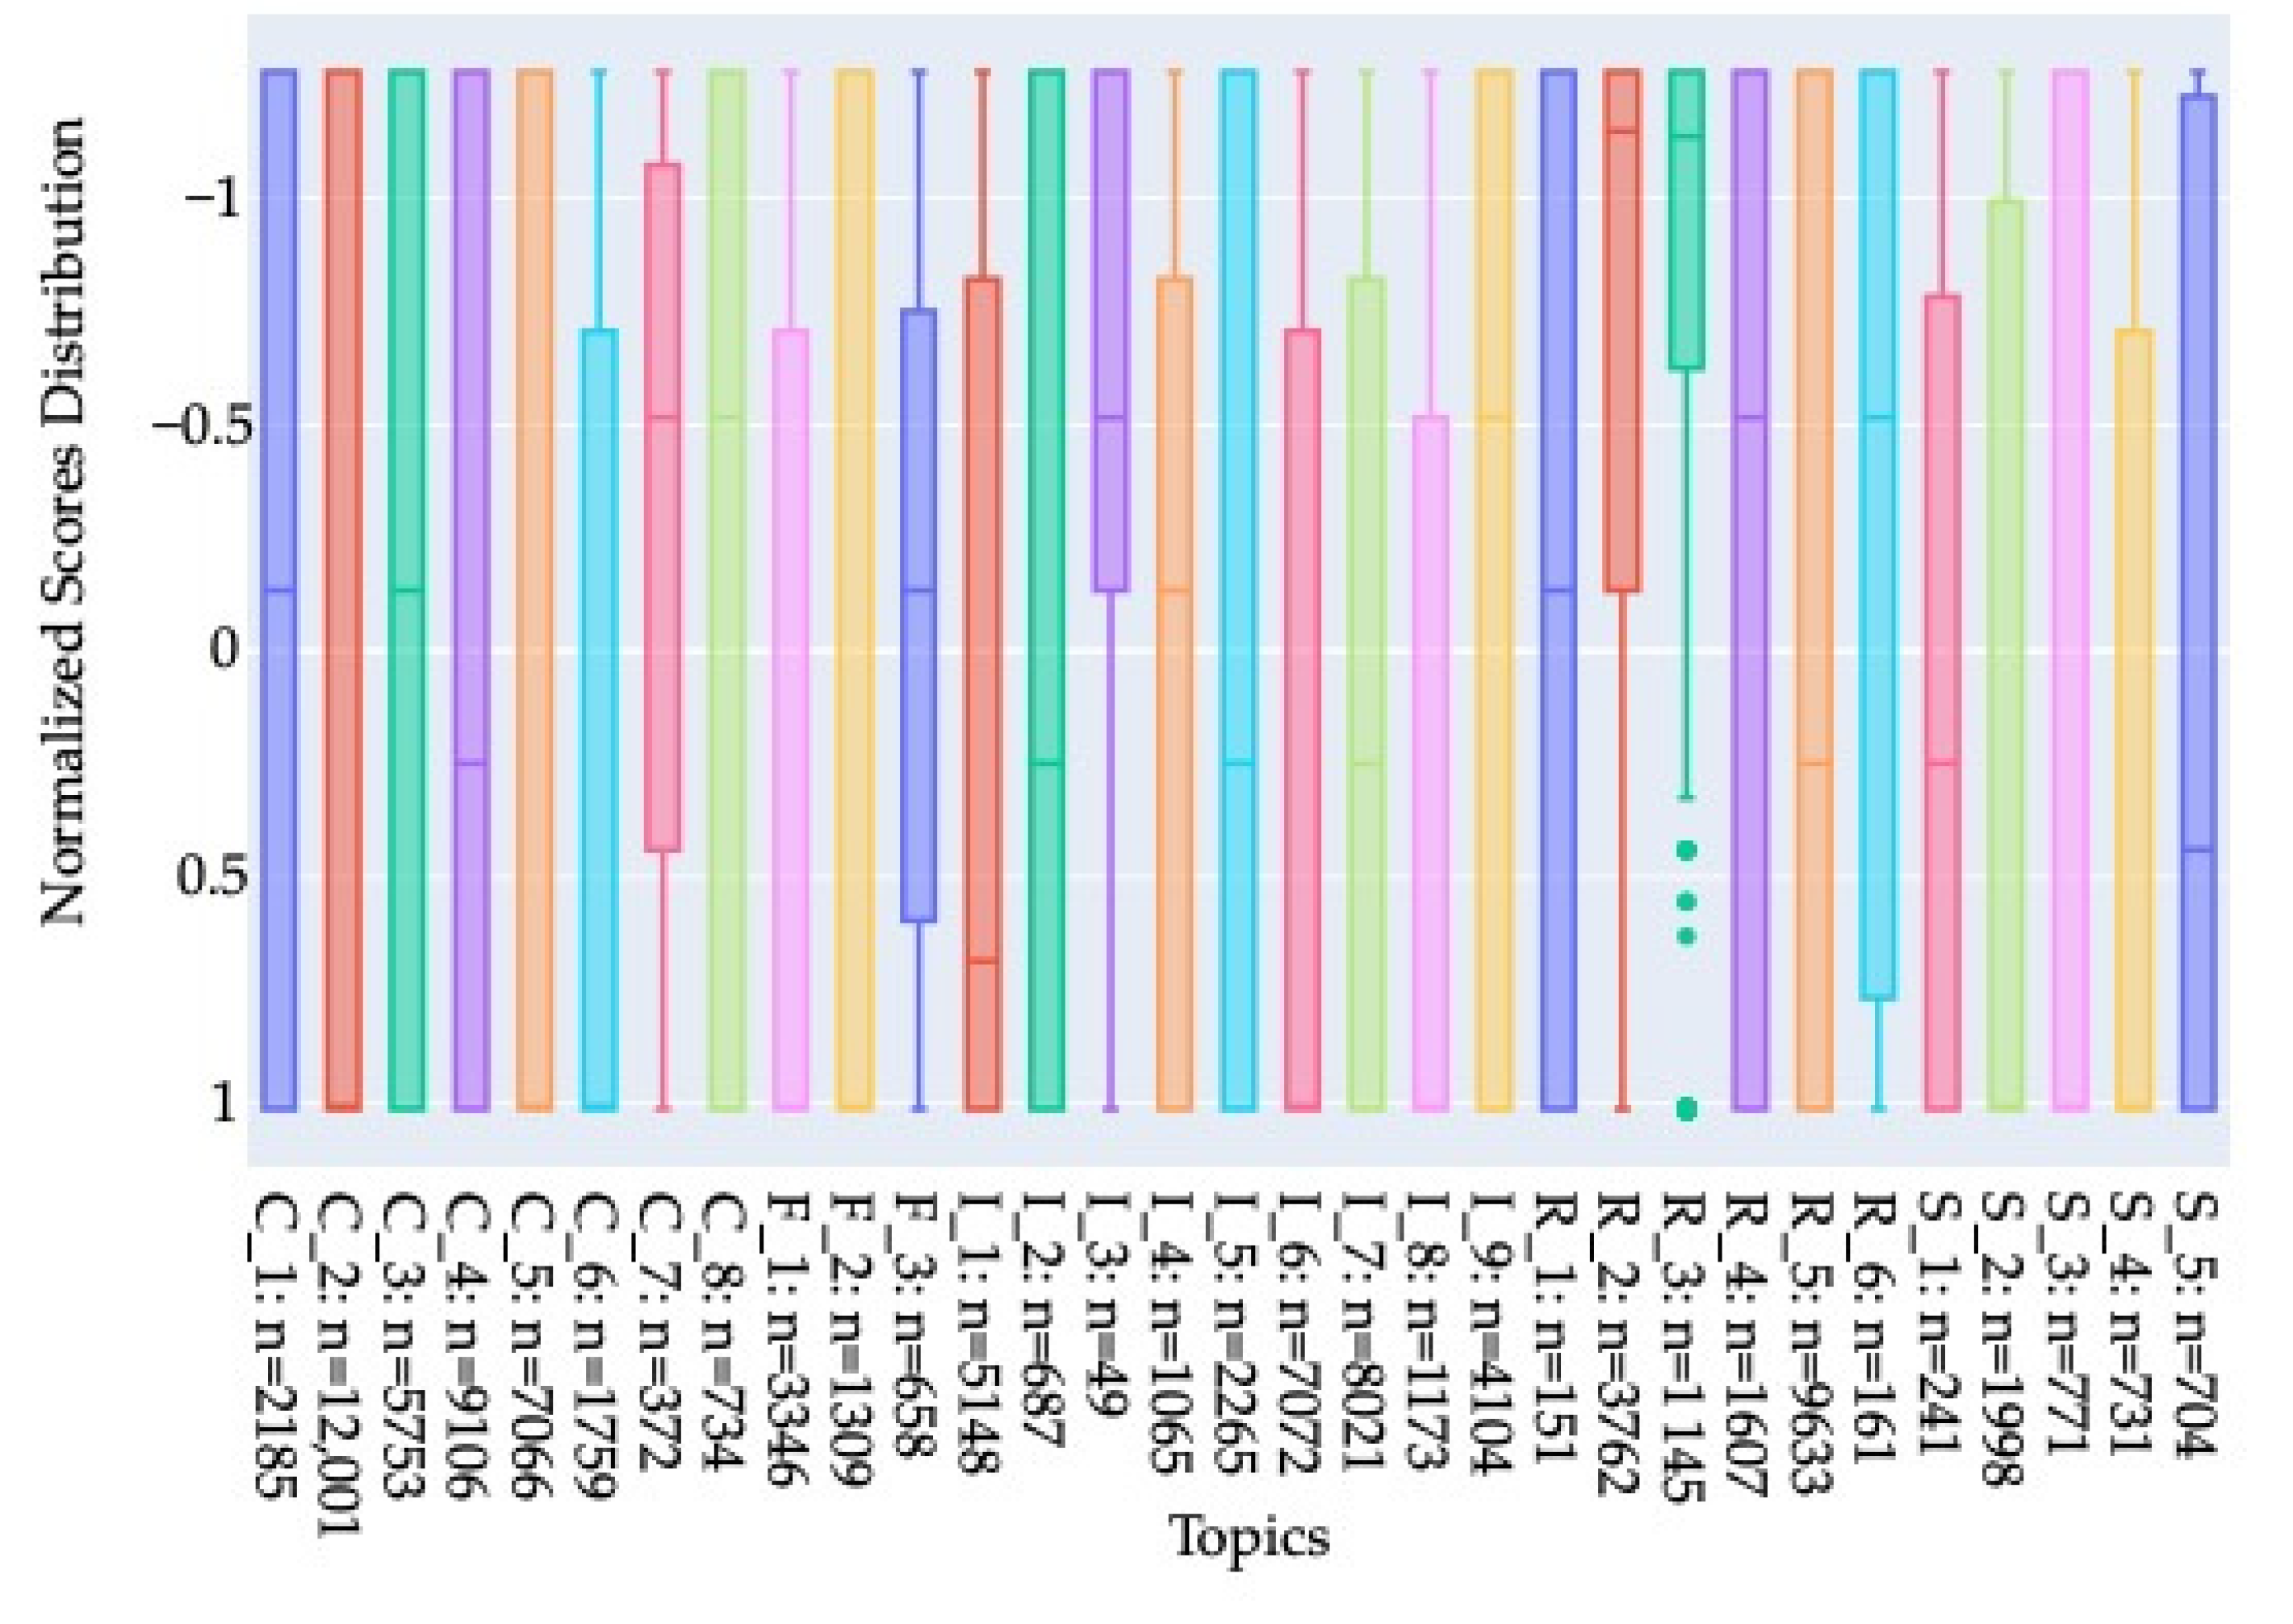
Figure 5.
The mean values of news by topics for each metal (no color means no news articles).
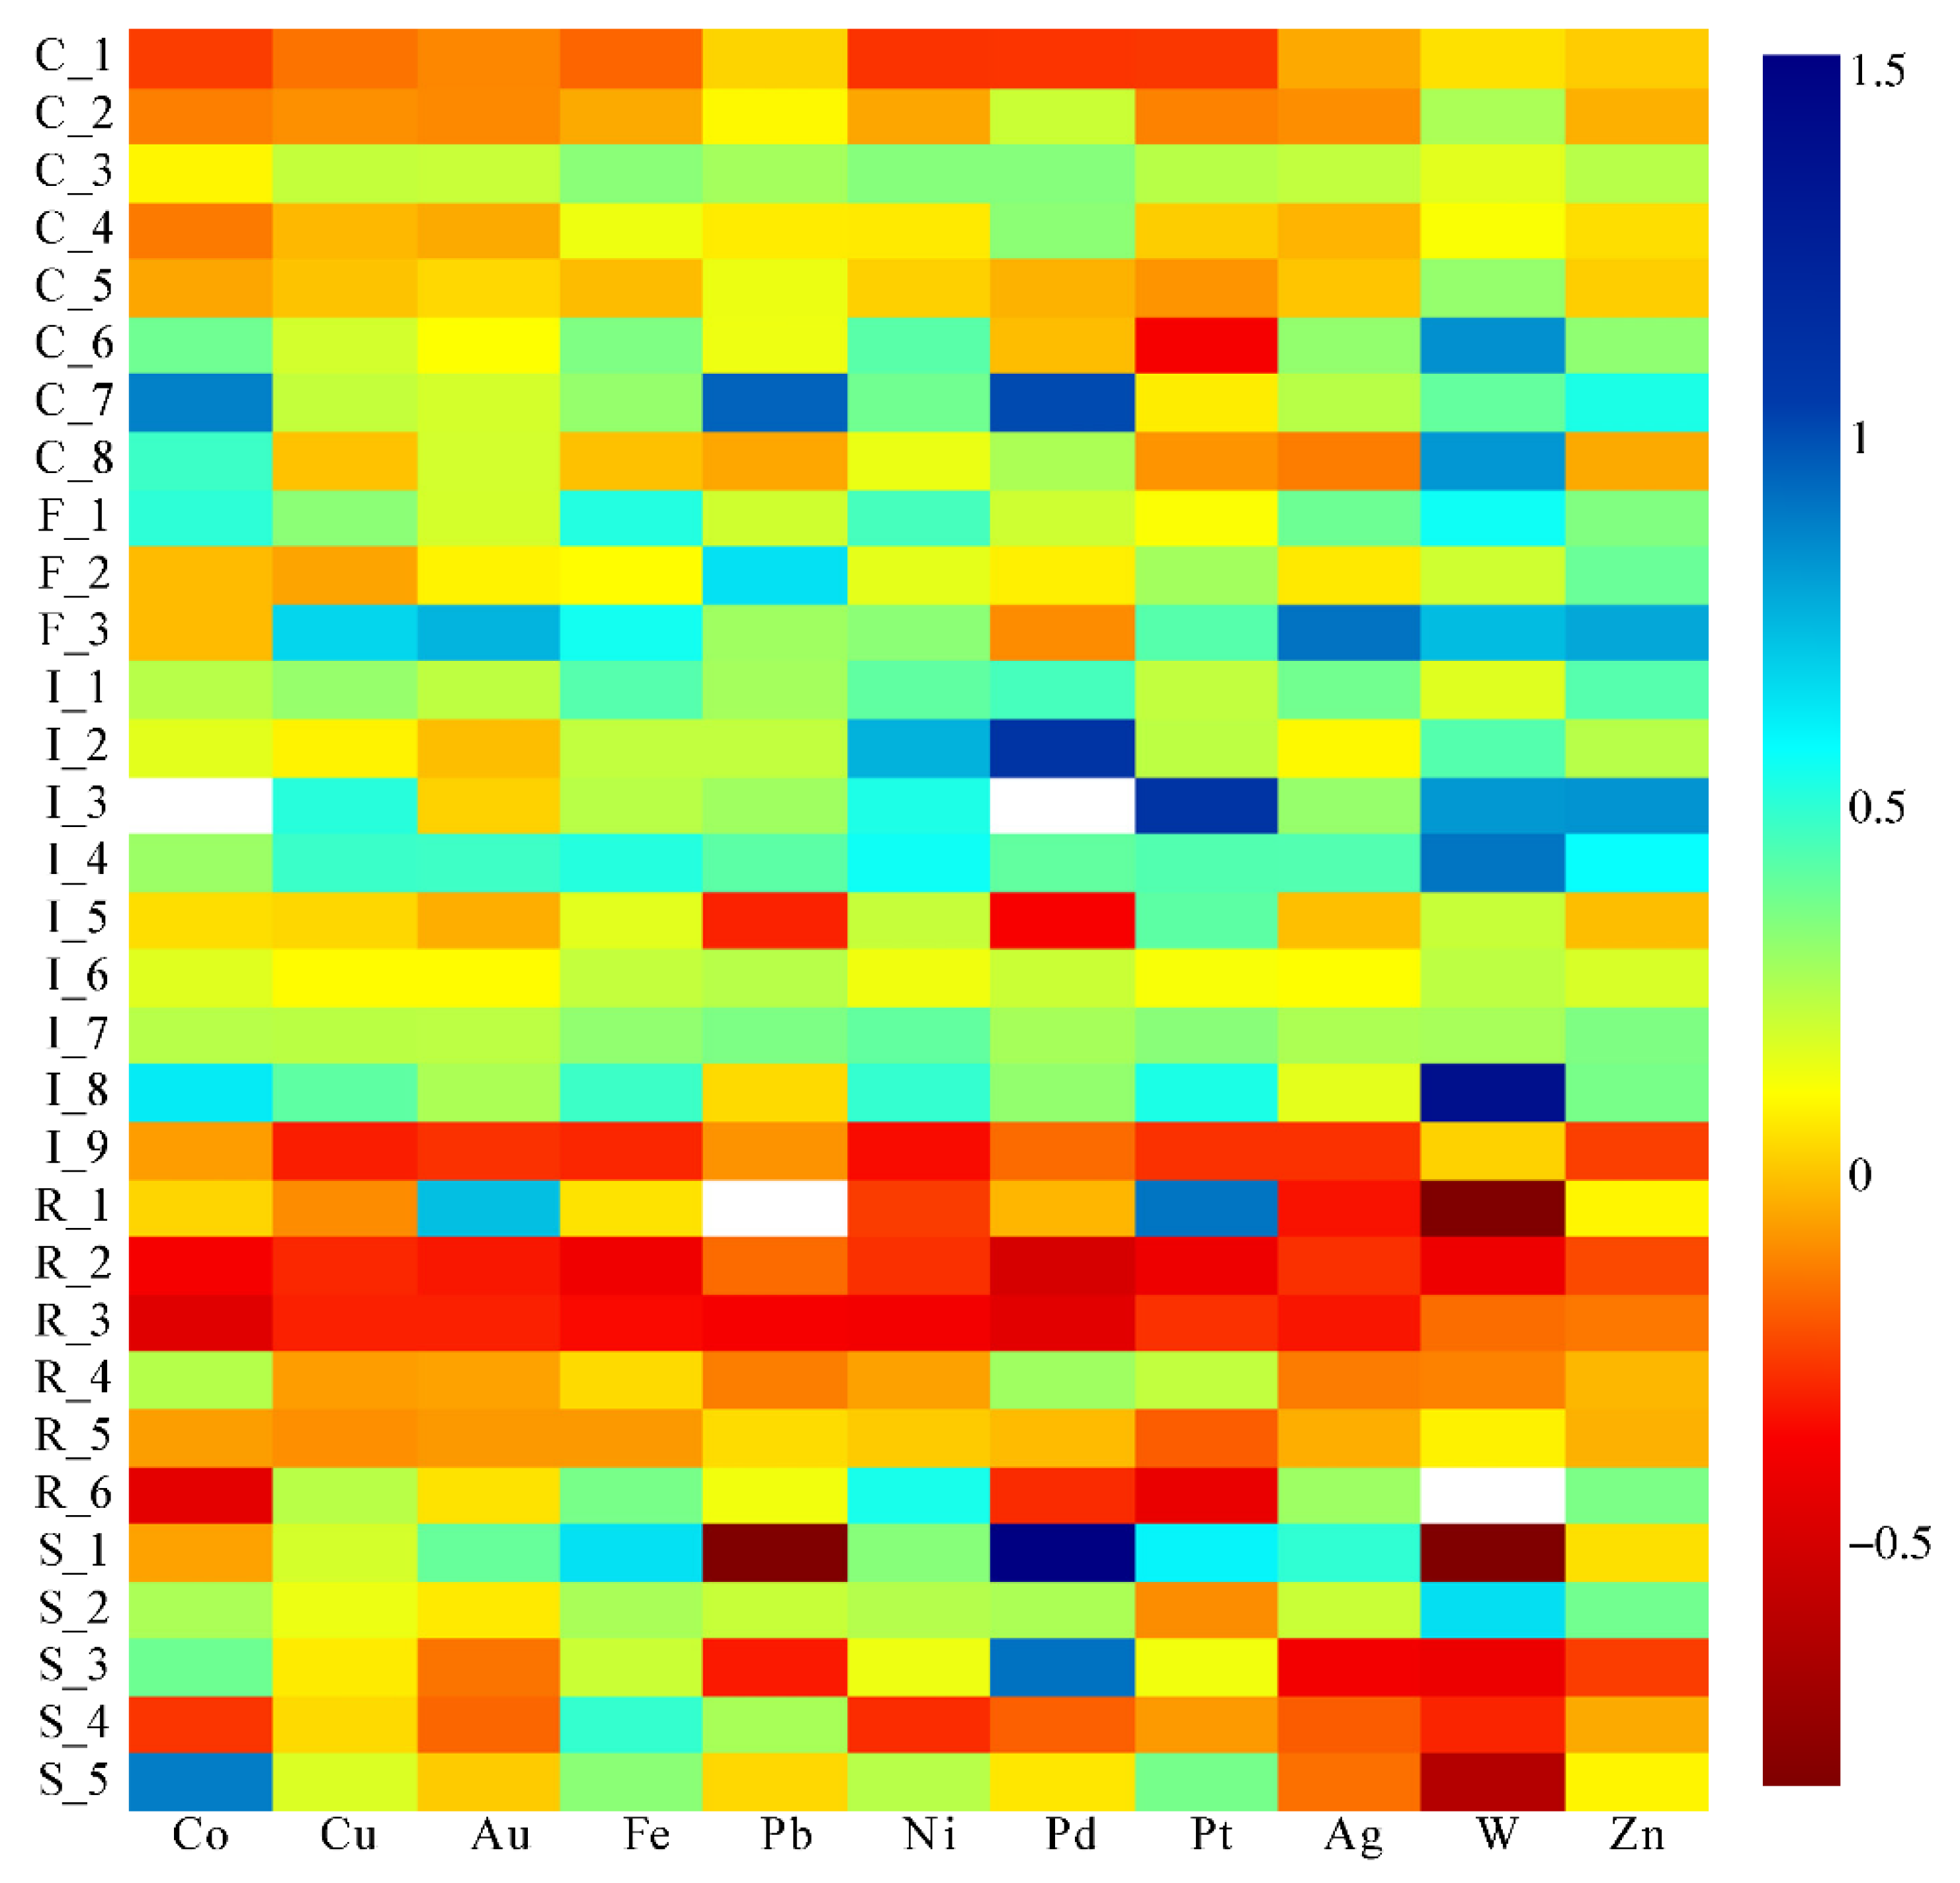
Figure 6.
Comparison of the metals (bubble size reflects the total number of articles for each metal).
Figure 6.
Comparison of the metals (bubble size reflects the total number of articles for each metal).
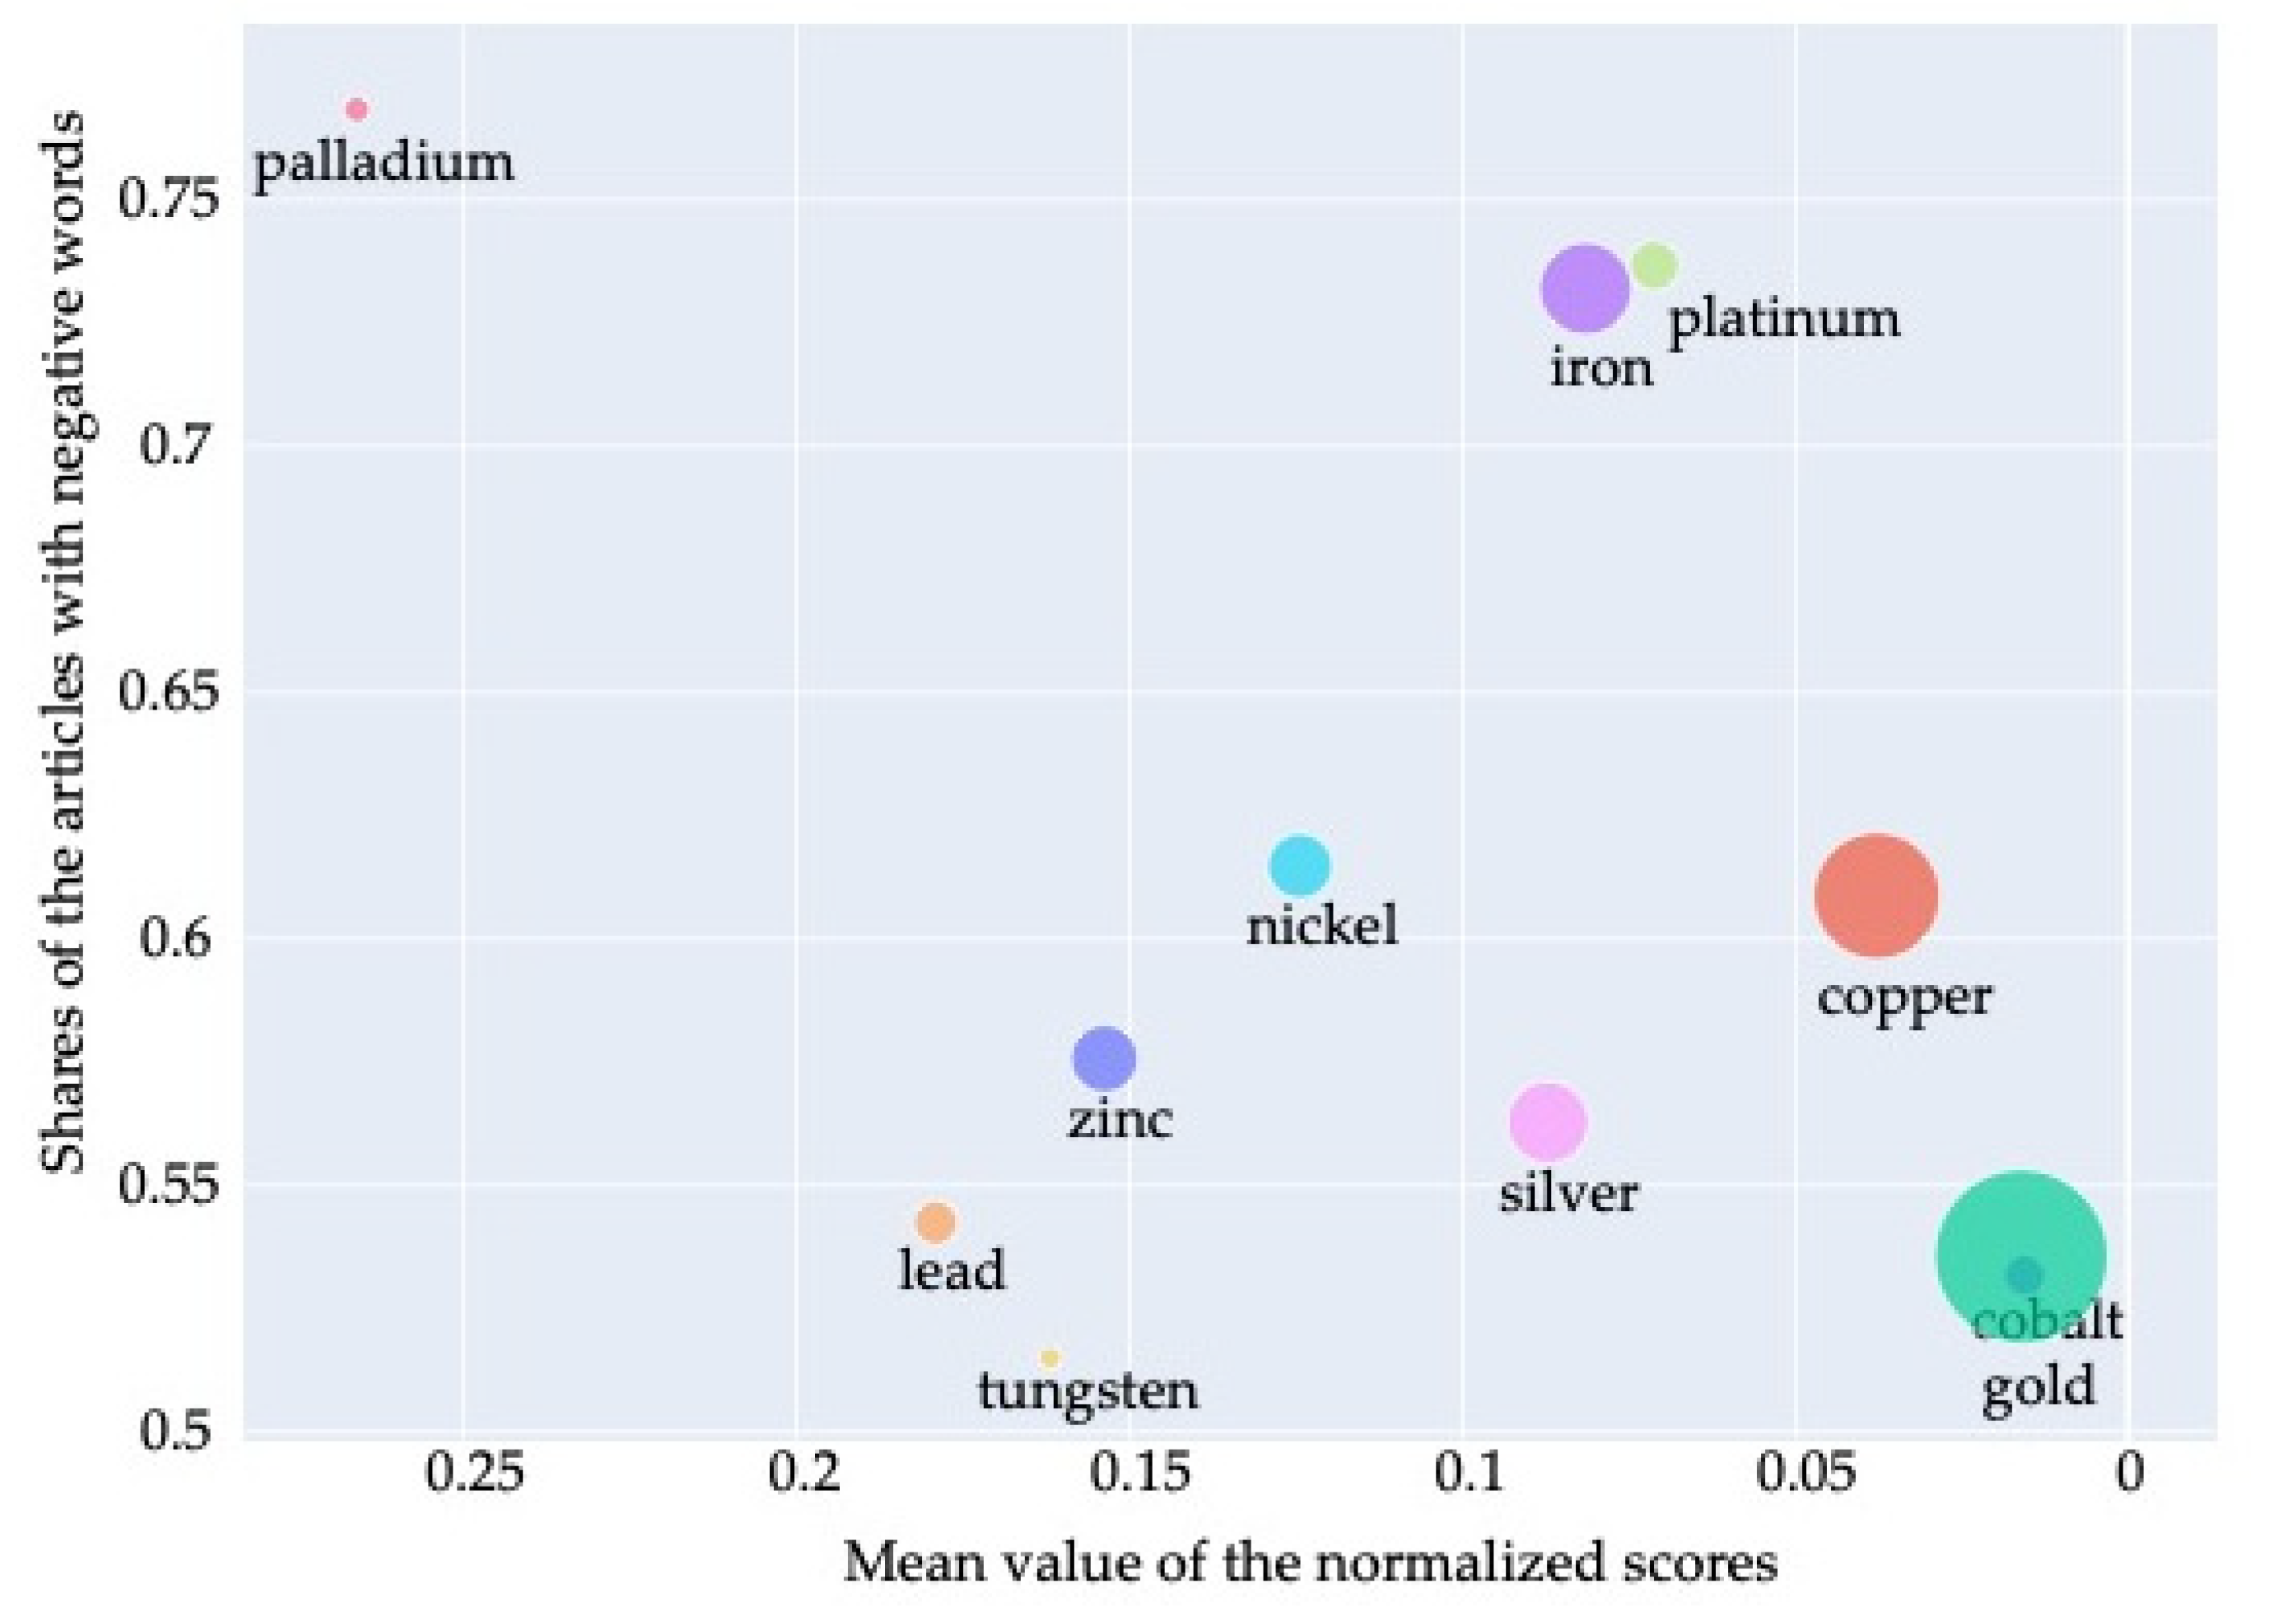
Figure 7.
Historical changes in the number of negative news articles (top row) and cumulative scores (bottom row) for platinum (left) and cobalt (right).
Figure 7.
Historical changes in the number of negative news articles (top row) and cumulative scores (bottom row) for platinum (left) and cobalt (right).


Table 1.
Data period and the number of news articles obtained for each metal.
| Metal | Period 1 | Number of News Articles 2 |
|---|---|---|
| Copper | 17 April 2013~26 May 2020 | 12,928 |
| Cobalt | 15 January 2014~26 May 2020 | 1664 |
| Gold | 31 January 2013~26 May 2020 | 26,334 |
| Nickel | 7 October 2013~26 May 2020 | 3757 |
| Platinum | 7 October 2013~26 May 2020 | 1859 |
| Palladium | 17 January 2014~26 May 2020 | 563 |
| Zinc | 20 August 2013~26 May 2020 | 4044 |
| Iron | 26 June 2013~26 May 2020 | 5647 |
| Lead | 18 December 2013~26 May 2020 | 1747 |
| Tungsten | 3 February 2014~26 May 2020 | 515 |
| Silver | 1 May 2013~26 May 2020 | 5493 |
1 This period starts from the oldest news and ends at the date of newest news. 2 One news article may appear for multiple metals.
Table 2.
Topic labels used and the number of labeled news for each topic.
| Topic Code | Topic Name | Typical Contents | Number of News 1 |
|---|---|---|---|
| Individual Corporates News | |||
| C_1 | Bankruptcy & Distressed | Corporates’ bankruptcy or distress | 679 |
| C_2 | Capital Markets | Corporates’ investment activities and related topics | 12,240 |
| C_3 | Earnings & Guidance | Corporates’ guidance and earnings | 6082 |
| C_4 | In the Boardroom | Corporates’ board decisions | 5658 |
| C_5 | Personnel | Corporates’ personnel | 7042 |
| C_6 | ESG_Environmental | Corporates’ ESG activities on environmental issues | 802 |
| C_7 | ESG_Governance | Corporates’ ESG activities on governance-related issues | 109 |
| C_8 | ESG_Social | Corporates’ ESG activities on social issues | 195 |
| General Financial News | |||
| F_1 | Commodities | Commodity market and supply chain | 1208 |
| F_2 | Private Equity | Private equity-related issues | 884 |
| F_3 | Ratings & Research | Corporates’ ratings and related issues | 1578 |
| Industry News | |||
| I_1 | Industry News | General mining and metallurgical industry issues | 5646 |
| I_2 | Midstream | Transportation, logistics in broader sense | 539 |
| I_3 | Mining_Coal Transportation | Coal transportation | 173 |
| I_4 | Mining_Demand | Minerals’ demand | 583 |
| I_5 | Mining_Exports & Imports | Minerals’ international trade | 583 |
| I_6 | Mining_Production | Mines’ production | 5336 |
| I_7 | Mining_Smelting & Refining | Smelters/refineries-related issues | 502 |
| I_8 | Technology | Technology-related issues | 90 |
| I_9 | Mining_Mine Safety | Mine safety | 671 |
| Regulation, Policy and Law | |||
| R_1 | Rates & Tariffs | Rates/tariff-related issues | 81 |
| R_2 | Regulation, Policy & Law_ Civil & Criminal Actions | Civil and criminal actions | 1730 |
| R_3 | Regulation, Policy & Law_ Courts | Lawsuits | 1103 |
| R_4 | Regulation, Policy & Law_ Legislative Activity | Legislative activity | 506 |
| R_5 | Regulation, Policy & Law_ Regulatory Activity | Regulatory activity | 3092 |
| R_6 | Regulation, Policy & Law_ Trade Policy | Trade policy | 139 |
| Surrounding Issues | |||
| S_1 | Electric Generation | Electric generation-related topics | 557 |
| S_2 | Environment | General environmental issues | 736 |
| S_3 | Power Grid | Power grid-related issues | 141 |
| S_4 | Renewables | All issues related to renewable energies | 185 |
| S_5 | Upstream | Upstream issues, including fossil fuel supply | 124 |
1 Multiple topics may be assigned to one news.
Table 3.
The shares of negative news articles and the number of total news articles for each topic.
| ID 1 | Share of Negative News | Number of News | ID | Share of Negative News | Number of News 1 | ID | Share of Negative News | Number of News 1 |
|---|---|---|---|---|---|---|---|---|
| C_1 | 60.6% | 2185 | I_1 | 50.4% | 5148 | R_1 | 66.9% | 151 |
| C_2 | 47.3% | 12,001 | I_2 | 56.3% | 687 | R_2 | 80.4% | 3762 |
| C_3 | 67.8% | 5753 | I_3 | 91.8% | 49 | R_3 | 91.6% | 1145 |
| C_4 | 52.0% | 9106 | I_4 | 64.6% | 1065 | R_4 | 65.8% | 1607 |
| C_5 | 49.6% | 7066 | I_5 | 53.0% | 2265 | R_5 | 51.8% | 9633 |
| C_6 | 45.4% | 1759 | I_6 | 42.2% | 7072 | R_6 | 75.2% | 161 |
| C_7 | 76.6% | 372 | I_7 | 53.1% | 8021 | S_1 | 53.9% | 241 |
| C_8 | 73.0% | 734 | I_8 | 45.1% | 1173 | S_2 | 48.2% | 1998 |
| F_1 | 48.6% | 3346 | I_9 | 62.6% | 4104 | S_3 | 45.1% | 771 |
| F_2 | 47.9% | 1309 | S_4 | 39.5% | 731 | |||
| F_3 | 77.8% | 658 | S_5 | 51.4% | 704 |
1 See Table 2 for the details of each ID for topics.
Table 4.
Historical changes for cobalt and platinum.
| Metal | 2014 | 2015 | 2016 | 2017 | 2018 | 2019 | |
|---|---|---|---|---|---|---|---|
| Cobalt | Mean | 0.108 | 0.505 | −0.377 | −0.002 | 0.138 | −0.075 |
| Total Unique Articles | 71 | 59 | 91 | 337 | 532 | 266 | |
| Share of Negative News | 57.7% | 50.8% | 59.3% | 39.8% | 46.1% | 60.5% | |
| Platinum | Mean | −0.038 | −0.007 | 0.043 | 0.017 | −0.006 | 0.274 |
| Total Unique Articles | 300 | 249 | 207 | 183 | 181 | 192 | |
| Share of Negative News | 72.0% | 69.9% | 72.0% | 64.5% | 56.4% | 79.7% |
Table 5.
Supply risk factors in Dewulf et al. [15].
Table 5.
Supply risk factors in Dewulf et al. [15].
| T: Technical, physical, and geological factors | R: Regulatory and social factors | ||
|---|---|---|---|
| 1 | Decrease in quality of feedstock | 11 | Land use regulation |
| 2 | Insufficient supply of auxiliaries | 12 | Social acceptance |
| 3 | Lack of elasticity of the production capacity | 13 | Human and environmental disasters |
| E: Economic, strategic, and market supply risk factors | 14 | Regulation on ethical sourcing | |
| 4 | Concentration of supplier countries | 15 | Lack of waste-as-resource policy |
| 5 | Concentration of supplying companies | P: Political stability and governance factors | |
| 6 | Economic land use competition | 16 | Country stability and governance |
| 7 | By-production dynamics | 17 | Corporate stability and governance |
| 8 | Unstable market/prices/demand | ||
| 9 | Resource nationalism strategies of supplying countries | ||
| 10 | Embargo/trade barriers | ||
Publisher’s Note: MDPI stays neutral with regard to jurisdictional claims in published maps and institutional affiliations. |
© 2021 by the authors. Licensee MDPI, Basel, Switzerland. This article is an open access article distributed under the terms and conditions of the Creative Commons Attribution (CC BY) license (https://creativecommons.org/licenses/by/4.0/).
Share and Cite
MDPI and ACS Style
Murakami, S.; Muraoka, S. Exploring the Potential of Internet News for Supply Risk Assessment of Metals. Sustainability 2022, 14, 409. https://doi.org/10.3390/su14010409
AMA Style
Murakami S, Muraoka S. Exploring the Potential of Internet News for Supply Risk Assessment of Metals. Sustainability. 2022; 14(1):409. https://doi.org/10.3390/su14010409
Chicago/Turabian StyleMurakami, Shinsuke, and Shunya Muraoka. 2022. "Exploring the Potential of Internet News for Supply Risk Assessment of Metals" Sustainability 14, no. 1: 409. https://doi.org/10.3390/su14010409
Note that from the first issue of 2016, this journal uses article numbers instead of page numbers. See further details here.