Article

Determination of the Connectedness of Land Use, Land Cover Change to Water Quality Status of a Shallow Lake: A Case of Lake Kyoga Basin, Uganda

1
African Centre of Excellence for Water Management, Addis Ababa University, Addis Ababa P.O. Box 1176, Ethiopia
2
Department of Water Quality Management, Directorate of Water Resources Management, Ministry of Water and Environment, Kampala P.O. Box 20026, Uganda
3
Department of Zoology, Entomology and Fisheries Sciences, College of Natural Sciences, Makerere University, Kampala P.O. Box 7062, Uganda
4
Water and Land Resource Center, Addis Ababa University, Addis Ababa P.O. Box 3880, Ethiopia
*
Author to whom correspondence should be addressed.
Sustainability 2022, 14(1), 372; https://doi.org/10.3390/su14010372
Submission received: 7 November 2021 / Revised: 23 December 2021 / Accepted: 24 December 2021 / Published: 30 December 2021

Abstract

:
Catchments for aquatic ecosystems connect to the water quality of those waterbodies. Land use land cover change activities in the catchments, therefore, play a significant role in determining the water quality of the waterbodies. Research on the relationship between land use and land cover changes and water quality has gained global prominence. Therefore, this study aimed at determining land use, land cover changes in the catchments of L. Kyoga basin, and assessing their connectedness to the lake’s water quality. The GIS software was used to determine eight major land use and land cover changes for 2000, 2010, and 2020. Meanwhile, water quality data was obtained through both secondary and primary sources. Spearman correlation statistical tool in SPSS was used to correlate the land use, land cover changes, and water quality changes over the two-decade study period. The results showed that different land use and land cover activities strongly correlated with particular water quality parameters. For example, agriculture correlated strongly with nutrients like TP, TN, and nitrates and turbidity, TSS, BOD, and temp. The correlation with nitrates was statistically significant at 0.01 confidence limit. The findings of this study agreed with what other authors had found in different parts of the world. The results show that to manage the water quality of L. Kyoga, management of land use, land cover activities in the catchment should be prioritized. Therefore, the results are helpful to decision and policy makers and relevant stakeholders responsible for water management.

1. Introduction

Land use, land cover (LULC) changes are defined as variations to the earth’s surface, triggered mainly through anthropogenic activities like agriculture, deforestation, and urbanization; and natural factors like soil erosion, floods, and landslides; and exacerbated by climate change (CC) [1,2,3,4]. These variations have become significant drivers of change in the terrestrial and aquatic ecosystems since the industrial revolution [5,6]. There is a strong connectivity and interdependence between land and water ecosystems through a network of streams and rivers, runoff, or groundwater. This has made the study of the relationship between land and water to find mitigation measures at all levels a current global priority [2,7,8,9,10,11]. Anthropogenic activities in the watersheds, alongside with atmospheric deposition, are the major contributors of nutrients and sediments into the rivers, lakes, and wetlands [12,13,14,15,16]. Hassan et al. [2] has associated LULC changes to the loss of agricultural land, water, and soil quality degradation, global warming, and deforestation. There are several other studies at the global level that have been carried out to show the impacts of different LULC activities in the catchment on water resources, including streams and rivers [17,18], reservoirs [19], wetlands, and lakes [20,21]. Intensive anthropogenic activities like mining, deforestation, urbanization, and agriculture have had significant impacts on the normal dynamics and functioning of freshwater ecosystems [2,22,23,24,25,26,27]. The consequences of the nutrient and sediment loading into water bodies vary, including eutrophication, siltation, and proliferation of invasive water weeds [28,29]. LULC activities affect water resources in two major ways. Firstly, through point sources like industrial and domestic effluents [2,30]. Secondly, through non-point or diffuse pollution sources like agriculture, through applied agro-chemicals, deforestation, livestock grazing, urbanization, and atmospheric deposition [15,30,31,32,33,34,35,36]. Due to the widespread and persistent nature of diffuse pollution, some studies have described it as a ‘wicked problem’ at a global level [37] and difficult to control.
The significance of research on the impact of LULC changes in the catchments on water resources is based on the importance of good water quality to the environment and human society. Lakes, rivers, and reservoirs provide vital goods, like drinking water, water for irrigation, protein through fisheries, and services like navigation, energy, recreation through tourism, climate moderation, and flood control [19,29]. These goods and services are threatened by pollution of water bodies which result in eutrophication [23,38,39,40]. Although eutrophication of water bodies is a naturally slow process, rapid nutrient enrichment of especially nitrogen and phosphorus [27] accelerates it from the catchment, making it a global problem [41,42]. The studies have shown that LULC activities in the catchment affect water quality and regional climate and alter the hydrological cycle [43]. Land degradation and fragmentation have resulted in the loss of habitats, degradation of water resources, and loss of biodiversity, all associated with LULC anthropogenic activities at global, regional, and catchment levels [44,45]. Therefore, although catchments are very important for the proper functioning of lakes by providing nutrients, excess loading of the nutrients from LULC change activities is detrimental to the aquatic ecosystems.
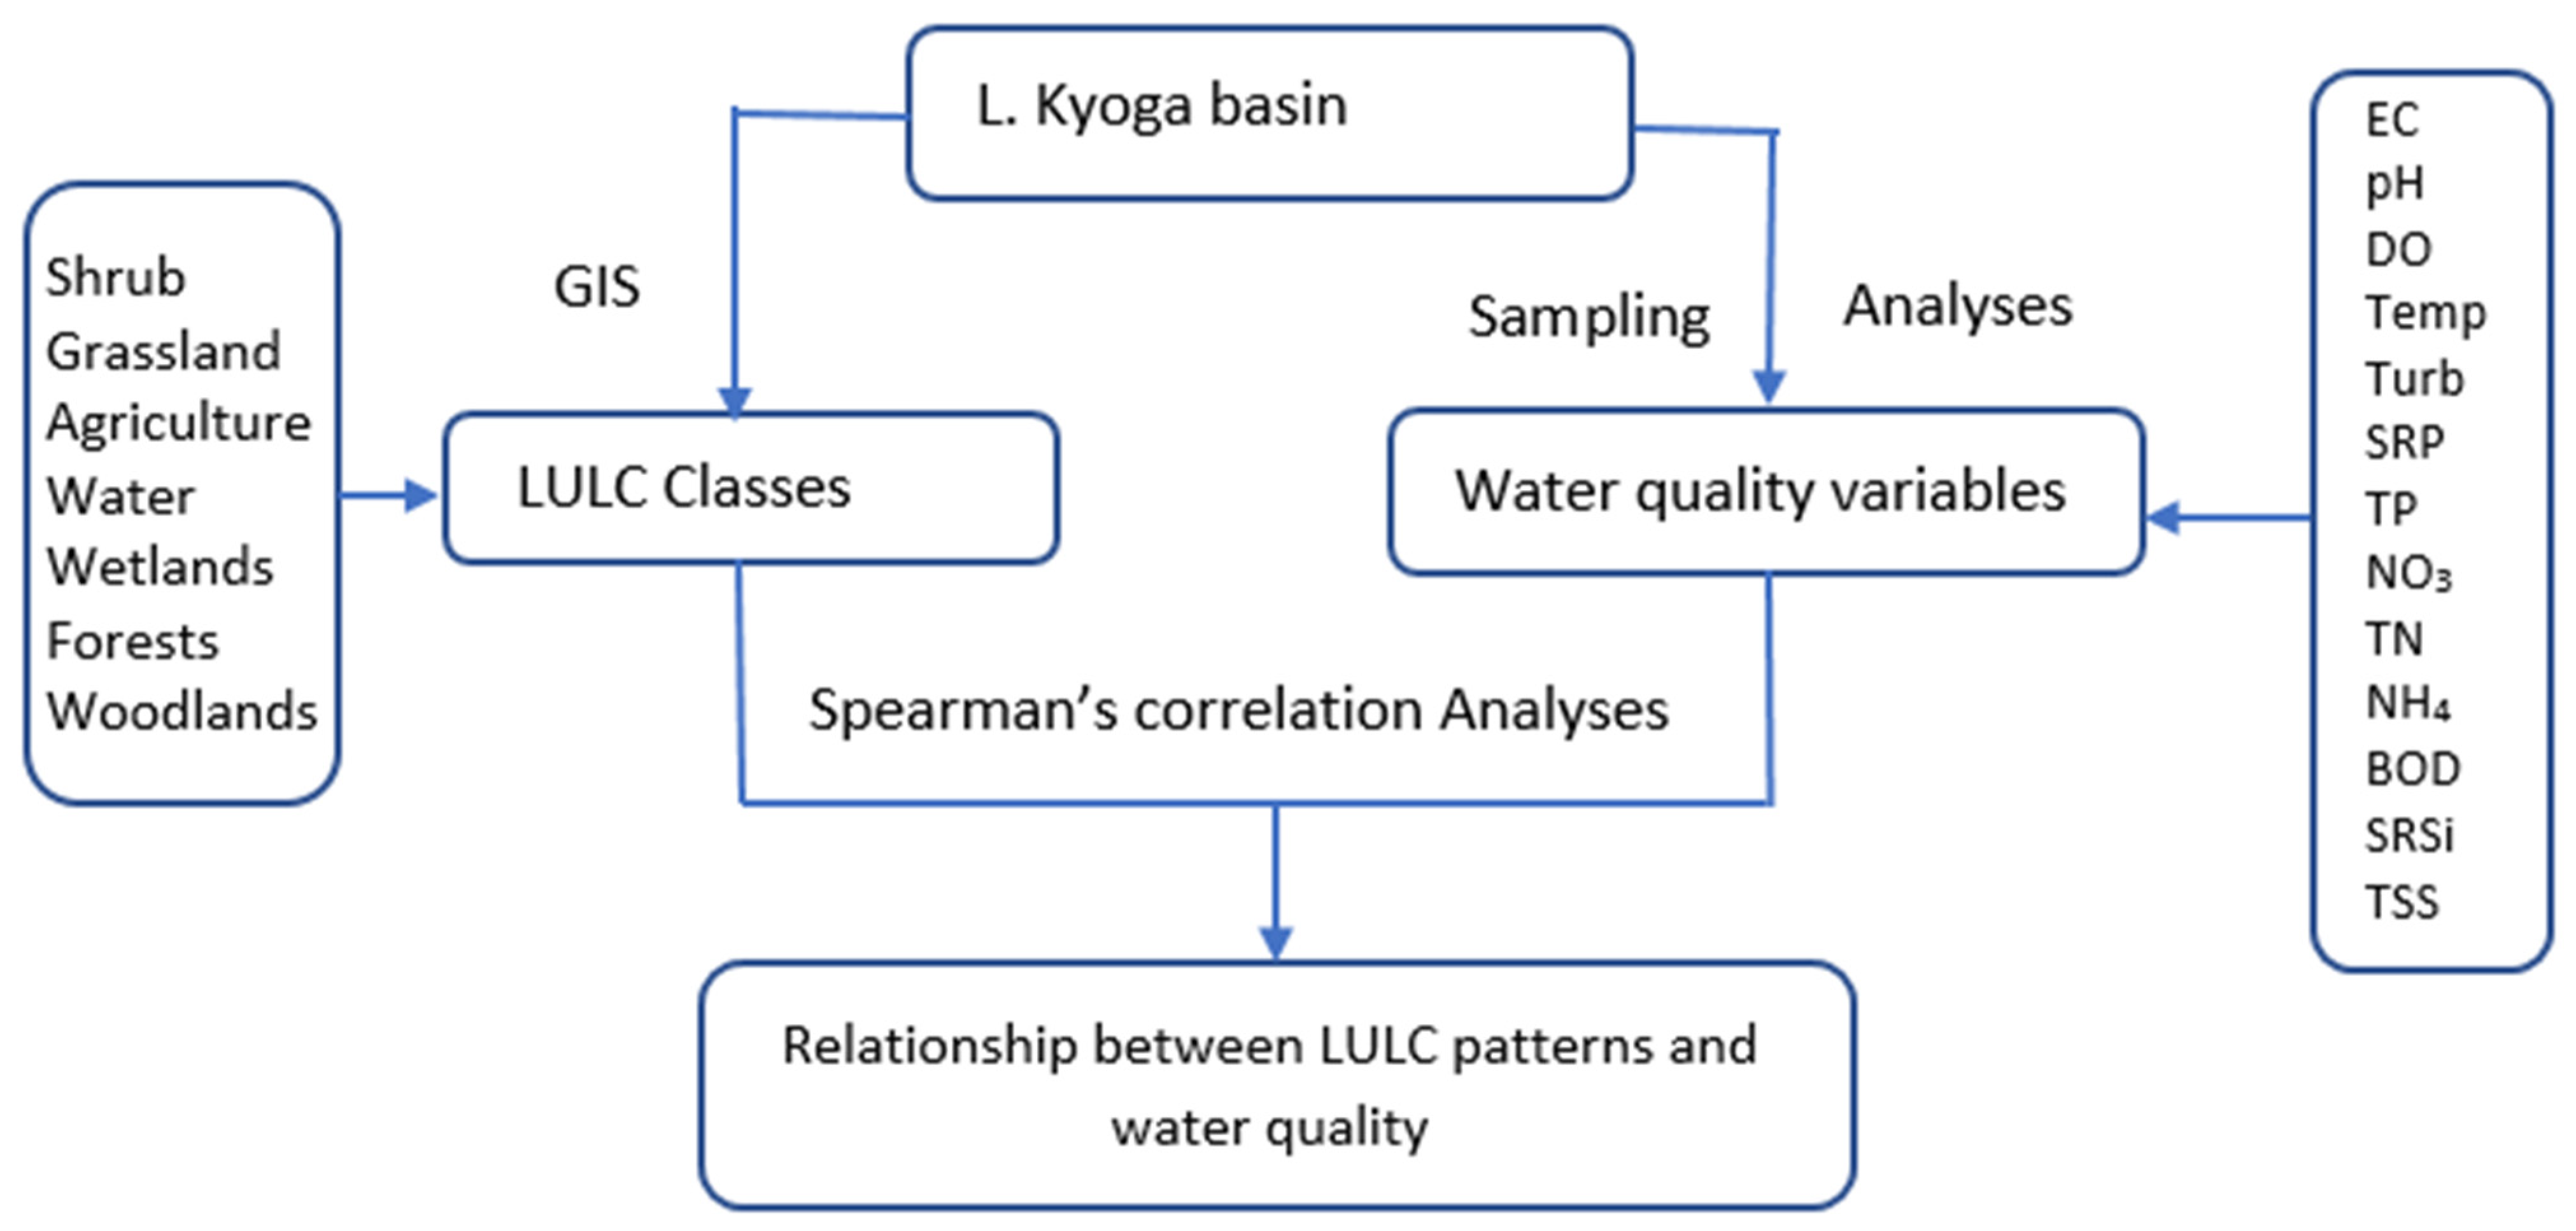
Many approaches have been applied to study the linkage between LULC activities in the catchment with water quality of the receiving water bodies, which started about forty years ago in the 1970s [46,47]. One of the current approaches is using remote sensing alongside GIS, to monitor LULC changes and water quality [17,48,49,50,51]. This approach has been found to be cheap, comprehensive, consistent, and repetitive, useful for studies at large scales [52]. Remote sensing and GIS are therefore critical in the assessment of drivers of LULC changes and their relationship with lake and reservoir and river water quality [13,14,15,16,17,18,19,20,21,22,23,24,25,26,27,28,29,30,31,32,33,34,35,36,37,38,39,40,41,42,43,44,45,46,47,48,49,50,51,52,53,54,55], and for monitoring the causes of eutrophication [18,23,40,42]. Other approaches include using conservative multivariate practices [56], like cluster analysis applied to show impacts on arable land on water quality in Germany and Czech Republic [57]. Principal component analysis (PCA) in combination with cluster analysis has been applied to determine the influence of municipal effluent on the water quality of River Nag in India [58]. The use of the Pearson coefficient has been applied in many countries, including S. Africa [59], China [60], and Zimbabwe [61].
In Africa, for example, many studies have linked LULC changes with water quality deterioration [29,49,60,62,
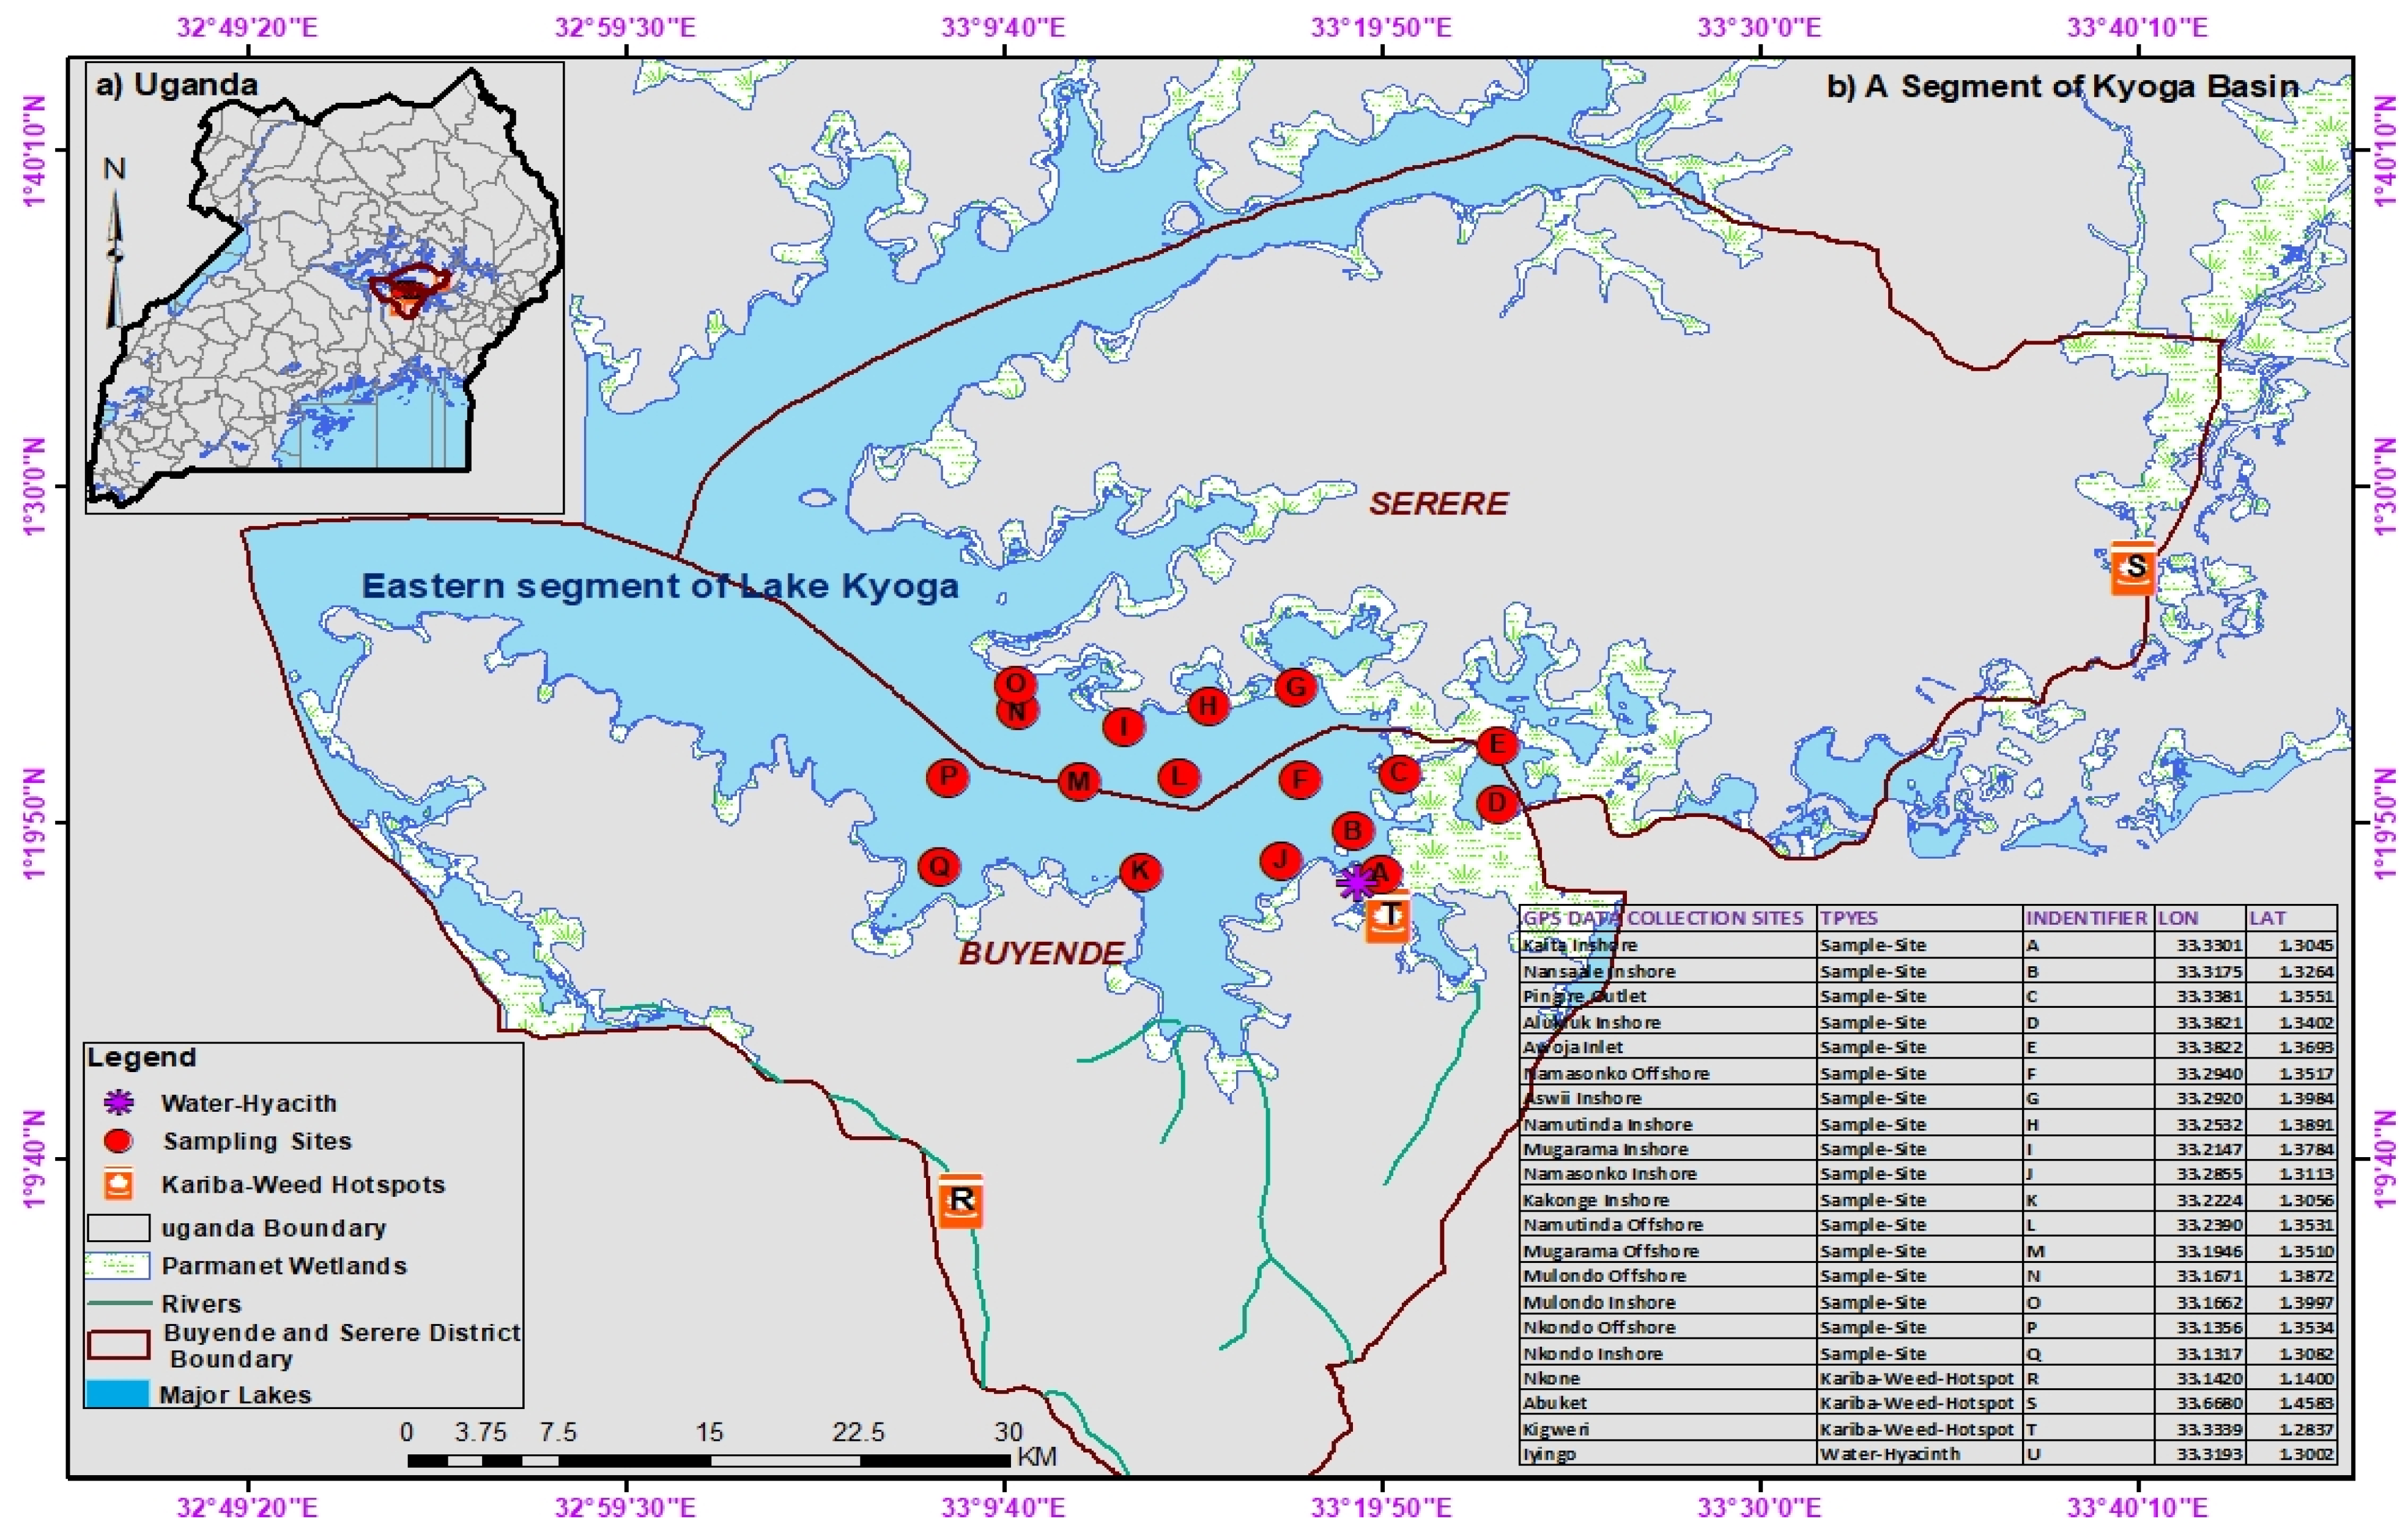
63]. In Uganda, the water quality of Lake Kyoga is most likely to be influenced by LULC activities in the catchment, as suggested by Andama et al. [64]. There may be few industries in the lake’s catchment; hence domestic effluents from urban centers and diffuse pollution from LULC activities and atmospheric deposition could probably be the main sources of nutrient loading into the lake. Further, through increased precipitation, floods, and extreme droughts, climate change exacerbates the influence of LULC on the lake’s water quality by transporting nutrients rapidly to the lake [34,35]. Catchment deforestation and wetlands conversion makes the lake more susceptible to the LULC effects. The high annual population growth rate in Uganda, estimated at 3.3% [65], increased rate of urbanization, industrialization, and the growth of several socio-economic activities are the primary drivers of the anthropogenic impacts on land, environment, and water resources [22,45,66]. These impacts affect shallow lakes more; hence L. Kyoga is facing significant threats which could be responsible for the proliferation of invasive water weeds, such as Salvinia molesta and Eichhornia crassipes [64,67]. Despite all these threats, detailed studies to link LULC activities in the catchments of L. Kyoga and its water quality have not been carried out. The focus of this study, therefore, is to establish the linkage between LULC activities in the catchments with water quality. The findings will be critical for planning and management of not only the water quality of the lake but also LULC activities in the catchments. Policy and decision-makers like Ministries of Water and Environment (MWE), Agriculture, Animal Industry, and Fisheries (MAAIF), Lands, Housing, and Urban Development (LHUD), and other stakeholders should use the results of this study to inform management actions. Further, studies using the Partial Least Squares (PLS) regression model, especially at the riverine level, are being undertaken to determine the linkage between water quality changes and LULC activities in the catchment [68,69]. Such studies are recommended in this study area since they are essential for planning and management purposes by policy makers.

2. Materials and Methods

2.1. Description of the Study Area

The study area is located in eastern Uganda, north of L. Victoria at 0°24.50″ N–2°25.50″ N; 32°5′10″ E–34°46′30″ E coordinates and covers three catchments, which include Awoja, Mpologoma, and Lwere, Figure 1. The total number of administrative units (districts) in L. Kyoga basin is 58, and the study area covers 34 districts. It is managed under the Kyoga Water Management Zone (KWMZ), one of the four (Kyoga, Upper Nile, Victoria, and Albert) hydrological water management zones in Uganda, established in 2011. It has an estimated 9.4 million people [65], which is 22% of the total Ugandan population.
Lake Kyoga is one of the major lakes in Uganda, connected to L. Victoria by the Victoria Nile, part of the River Nile that flows up to Egypt [64]. It lies in the country’s central part, plays a crucial role in fisheries, water supply, and climate change moderation, and has a vast irrigation potential. It is the largest (2000 km2), of the many Kyoga aquatic ecosystems, consisting of a series of satellite lakes, rivers, and a network of dense wetlands [67]. The wetlands, which used to comprise mainly of extensive mats of Cyperus papyrus L. which surrounded most of the shores of L. Kyoga and its numerous rivers and tributaries [70,71] have been heavily degraded. The lake is a shallow reservoir, with the Victoria Nile having a major influence on its hydrology, alongside other catchment rivers and direct precipitation. Studies on the lake’s hydrology show that the Victoria Nile contributes 82% of its water, other catchment rivers contribute 9%, and direct rainfall contributes 9% [67]. Most inlet rivers, like Awoja, Sezibwa, Victoria Nile, Manafwa, and Mpologoma are from the east, with only one main outlet river, the Albert Nile, which exits in the west and discharges to L. Albert after which it continues to Egypt as the White Nile. This pattern is influenced by Mt. Elgon and its ranges located in the east of the lake, which is a source of most rivers. Just like hydrology, the chemistry of the lake is governed by the river systems, with Awoja and Mpologoma rivers influencing the eastern arm, Victoria Nile and Sezibwa influencing the west, and the central area having influence from all catchments. This is evidenced by the variation in conductivity and nutrients along the east to west gradient [67]. The flow pattern of the rivers in the lake’s catchment, their hydrology, and their contribution to the lake’s water guided the choice of the eastern arm as the study area. Few limnological and LULC change studies have been carried on this lake since the 1980s [64,67,70,71,72,73], hence the paucity of data and information on many aspects.
Fishing and agriculture are the main activities in and around Lake Kyoga, where the introduced Nile tilapia (Lates niloticus) and Nile perch (Oreochromis niloticus), and the native silver Cyprinid (Rastrineobola argentea) are the main commercial species [67]. The lake is also a source of drinking water for many riparian communities that dwell around it. It is also used for watering domestic animals, and its ecosystem supports several species of birds and wild animals, including amphibians, hippopotamus, and crocodiles. Part of the lake’s wetlands and satellite lakes, i.e., Bisina and Opeta, are designated Ramsar sites, particularly important for the conservation of birds and ecotourism [74]. Other economic activities in the study area include urbanization, settlements, navigation, and industry [64]. These activities, together with deforestation and wetland degradation, mainly for agricultural purposes, are negatively impacting the water quality of the lake negatively.
The three catchments, Awoja, Lwere, and Mpologoma are located on the east of L. Kyoga, with Awoja being the biggest with an area of 11,000 km2 and 14 sub-catchments [75]. Mpologoma is the second largest, with about 9000 km2, and has 13 sub-catchments [76]. Meanwhile, Lwere is the smallest catchment in the study area, with an area of 1500 km2. These catchments were chosen because they are drained by the two major rivers, Awoja and Mpologoma, which discharge to the eastern arm of L. Kyoga [67], a point of interest since the confluence of these rivers influences the lake’s water quality and hydrology. The climate of the study area is influenced mainly by lakes Kyoga and Victoria, Mt. Elgon, and the inter-tropical convergent zone ITCZ [77,78].

2.2. Data Collection Measures

2.2.1. Water Quality Data

One of the biggest challenges of research in surface water resources in Uganda and most of African countries is the lack of regularly collected and consistent data. This study used two approaches (primary and secondary) to collect water quality data for the two-decade long study period (2000, 2010, and 2020). Secondary data were acquired from the Water Quality Management Department (WQMD), of the Directorate of Water Resources Management (DWRM), Ministry of Water and Environment (MWE). WQMD has an overall mandate of monitoring water and wastewater in the country; it has a well-established National Water Quality Reference Laboratory (NWQRL), which follows the ISO17025 standards, and is currently undergoing accreditation. It also has a well-established monitoring network for all water bodies, including ground, surface, and wastewater, and a national water quality database. More secondary data obtained from the National Fisheries Resources Research Institute (NaFiRRI), which occasionally monitors the water quality of lakes as their principal mandate is on fisheries resources. Other data sources were from published papers, especially Ogutu-Ohwayo et al. [67]. Data for only samples taken from the study area (eastern arm) and that had parameters of interest (e.g., physico-chemical and biological) were considered. Collected data represented all seasons.
Primary data for the year 2020 were obtained from the same sites from which the secondary data were sampled, although some sites were added within the same area. Seventeen sites were used for sampling in the study area, Figure 2. Two sites (Alukluk and Awoja) were located at the inlet points of rivers Mpologoma and Awoja into L. Kyoga. Ten of the sites were inshore, five from either side of the lake, and the last five were offshore. Five field trips were conducted in the study area covering all the four climate seasons experienced in the study area. This sampling was done during the record-breaking floods of the 2020–2021 period. Parameters of interest included those measured in the field, i.e., electrical conductivity (EC), pH, temperature, and dissolved oxygen (DO). Further, water samples were collected and analyzed in the laboratory for total nitrogen (TN), total phosphorus (TP), nitrate, soluble reactive phosphorus (SRP), ammonia, total suspended solids (TSS), biochemical oxygen demand (BOD5), soluble reactive Silica (SRSi), turbidity, and chlorophyll-a (chl-a). These parameters were selected because they represented the lake’s productivity, were indicators of drinking water quality, reflected LULC activities in the catchment, and have been used in other related studies [29,43,79,80].

2.2.2. Field Sampling and Analysis

Standard field sampling protocols like calibration of field equipment, preparation of sample bottles, and preservatives were done before the trip [81]. Hydrolab DS5 multiparameter data sonde (Hach company) was used for field analysis of DO, pH, water temperature, and EC. These samples were recorded in profiles from top to bottom, and values at 0.5 m were selected since the lake is shallow. Sample collection for Chl-a in the field was done by filtering the known volume of water using a filtration unit with glass microfiber papers (GF/B) of 47 mm diameter, pore size 1.0 µm until the green color was observed on the paper [82]. The samples were wrapped in aluminum foil to avoid degradation from sunlight and preserved in cool boxes. Transparency was measured using a Secchi disc.
Using a Van Dorn Sampler (2L) at 0.5 m, sampling for laboratory-based parameters was done. This depth was chosen to represent the water column since the lake is shallow, with an average depth of 3 m [64], although the average depth at the study area was 5.4 m attributable to the floods. Unpreserved water samples were taken in triplicates for BOD5 measurement, using 500 mL glass bottles. Similarly, unpreserved samples for nitrate, SPR, SRSi, TSS, ammonia, and turbidity were placed into 1 liter plastic bottles. For TP and TN, samples were placed in 50 mL plastic bottles, preserved with 10% sulphuric acid. All the samples were preserved in cool boxes with ice packs until delivery to the NWQRL for analyses. In the laboratory they were preserved in refrigerators below 4 °C. All the sample bottles were labeled with site information and sampling date using permanent marker pens. Other details of the samples, including geo-reference coordinates and volumes were recorded in notebooks. Procedures used followed those described in Standard Methods [81] compiled into a field manual.

2.2.3. Laboratory Analysis

All samples were delivered to the NWQRL for lab analyses, and the nutrient parameters were analyzed using a discrete analyzer, Gallery Plus, manufactured by ThermoFisher Scientific, Waltham, MA U.S.A. The parameters included SRSi, NO3, NH4, SRP, TP, and TN, with results reported in mg/L. However, TP and TN were analyzed after digestion using persulphate as an oxidizing agent. All the analysis methods were in accordance with Standard Methods [81]. Chlorophyll-a, was analyzed using ethanol cold extraction method, and DR 6000 spectrophotometer manufactured by Hach Company, was used to read absorbances at 665 nm and 750 nm. The results were calculated and reported in µg/L in accordance to Standard Methods [81].
TSS, a surrogate parameter for LULC change degradation activities in the catchment was determined by a gravimetric method using a virgin GF/B filter paper. Results were calculated and reported in mg/L [81]. Turbidity was measured in the laboratory using a turbidimeter, and results reported in Nephelometric Turbidity Units (NTU). The BOD5 was determined using incubation method for five days in an incubator at 20 °C. The results were calculated as BOD5 in mg/L according to Standard Methods [81].

2.3. Land Use Land Cover Data Acquisition, Geometric, and Radiometric Correction

Global optical satellites were the primary sources of remotely sensed data and information for LULC classification and change detection. Landsat 5TM (Thematic Mapper), 7ETH (Enhanced Thematic Mapper Plus), 8Oli (Operational Land Imager) cloud-free satellite images of the path (170, 171, 172), and rows (59 and 60), of period 2000, 2010, and 2020 were acquired from United States Geological Survey (USGS) (https://earthexplorer.usgs.gov (accessed on 20 November 2020)).
To minimize the impacts of the changing season, images for this study were selected based on season, keeping in view the vegetative characteristics of the area. This enabled the achievement of better results. Thus, images were acquired between May and July (Table 1), which is the period after the first rainy season [83] (https://fews.net/file/113534) (accessed on 15 October 2020). During the search, the same months were maintained to ensure consistencies and avoid differences due to seasonal effects, thus enhancing spectral analysis.

2.4. The Framework of Relationship between LULC Change and Water Quality

A summary of activities carried out, and steps followed during this research study to assess the impact of LULC changes on the water quality of L. Kyoga are indicated in Figure 3.

2.5. Data Processing

2.5.1. Water Quality Data

All water quality data were compiled according to the years of study (2000, 2010, and 2020), and arranged into respective parameters (Table 2). Descriptive statistics, including annual means, maximum, minimum, and standard deviations for the study years, were calculated. For EC, the mean value was considered as the field equipment used for measurement like hyrolab DS5 had a 25 °C temperature correction incorporated, as temperature impacts EC. pH was considered a mean of [H+] as it is not a linearly distributed parameter, converting it to concentrations and back to pH. The mean values were used for correlation with LULC changes.
Pearson correlation coefficient (r) was used to determine a linear relationship between LULC change and water quality parameters [29,59,61,84,85]. The IBM SPSS version 25 software was used to calculate r, at 95% and 99% confidence limit, from the sample size, n = 3. It determined whether the correlation was positive, negative, or non-existent, depending on the relationship of the bivariate data. LULC change was used as an independent variable, while water quality parameters were used as dependent variables, as pointed out by Namugize et al. [59]. Different authors have used different ranges to determine the levels of correlations; however, this study adopted those of Namugize et al. [59], where values ranged from ±0–0.09 represented no relationship, ±0.1–0.35 for weak, ±0.36–0.67 for moderate/medium, and ±0.68–1 for a strong relationship, respectively. The same software calculated the significance of correlations at 0.05 and 0.01 confidence levels (two-tailed).

2.5.2. Land Use, Land Cover Change Data

Image Processing

Satellite image processing was used to extract attributes of the target images in different stages, including image correction, enhancement, cloud removal, subset/masking, and band composition/stacking, using the ENVI software version 5.3. Image pre-processing involved setting background pixel values using ENVIROI tool, masking cloud cover using (QA) band, to avoid severe distortion of image statistics and overall accuracy. The images were mosaicked using seamless techniques and color correction applied based on the histogram matching method.

Image Rectification and Enhancement

To determine temporal changes, geometric compatibility of images of different periods is essential, and image rectification was done using the ENVI SPEAR Orthorectification Wizard. The imageries were geometrically corrected using a 1:50,000 scale topographical map using WGS 1984 spatial coordinate system. Ground control points (GCP’s) on the satellite image and the topographic maps were identified, and the linear geometric correction function was applied. Enhancement of the satellite data, using a linear enhancer to reset brightness and contrast was made to improve image visual contrast. Visual analysis of enhanced images was done using the median filter, which resulted in smooth sharp-edged images. Images were permanently enhanced through Radiometric calibration. Finally, the atmospheric correction was performed to eliminate inherent image properties like water vapor and solar elevation. This was done based on Quick Atmospheric Correction (QUAC) method [86].

Image Classification and Accuracy Assessment

Image classification and interpretation give accurate information on LULC change, which can be useful derived from multiband raster satellite image is helpful in monitoring environmental change and effects of land use change on the environment [87]. Image analysis and interpretation to develop classification products was done using several core principles such as spectral, radiometric, spatial differentiation, and digital band combinations. Pixel-based supervised classification technique based on Random Forest classifiers was adopted in this study because it offered better extraction of LULC features [88]. It operates by constructing a multitude of decision trees at training time, and the class is decided by a forest with most trees. The training sites were validated with ground truth point information collected by a GPS receiver on the ground. Furthermore, the signature separability function tool was run against the training data and class signature to examine quality before classification [88]. These classified images usually have some errors; hence accuracy assessment using reliable statistical technique, error matrix was done to show the level of accuracy and precision during classification [89]. A stratified random sampling technique was adopted to collect 60 sample points from each category in every classified map; hence 480 sampling points were generated in each land use land cover type to check the classification accuracy [90]. Thus, using the error matrix, necessary elements of accuracy assessment like user accuracy (errors of commission), producer accuracy (errors of omission), overall accuracy, and kappa index were obtained.
Kappa coefficient (K) is a robust multivariate technique and is extensively used to assess inter-rater arrangement between categorical variables [91]. It takes into account all elements in the confusion matrix and not only the diagonal elements. Accuracy assessment of all LULC maps generated (2000, 2010, and 2020) was carried out through the development of an error-matrix.
Overall accuracy and Kappa coefficient of the raster layers of the study area were determined using statistical Equations (1) and (2).
overall   accuracy = i = 1 r x i i ,
where xii = diagonal elements in the error matrix; x = total number of samples in the error matrix.
Kappa   coefficient   ( K ˆ ) = n i = 1 r x i i i = 1 r ( x i + x + i ) n 2 i = 1 r ( x i + x + i ) ,
where r = number of rows in the error matrix; xii = number of observations in row i and column i. xi+ and x+i = marginal totals of row i and column i, respectively, and n = total number of observations (samples/pixels).

3. Results

3.1. Water Quality

The water quality of L. Kyoga basin, especially the eastern arm, showed changes from 2000 to 2020. Mean annual TP concentrations increased during the study period from 0.05 mg/L in 2000 to 0.19 mg/L in 2020. The increase for the first decade 2000–2010 (0.05–0.08 mg/L) was slight, compared to the rapid increase for the last decade 2010–2020, i.e., from 0.08–0.19 mg/L (Figure 4). Like SRP, the concentration of TP showed an increasing trend from 2000 to 2020, although the increase was slight throughout the study period. The annual concentrations of nitrates and ammonia followed the same trend, with mean concentrations of 0.074 mg/L and 0.056 mg/L, respectively. The study period variations ranged from 0.017–0.45 mg/L to 0.012–0.78 mg/L, respectively.
Chl-a showed an increasing trend from 2000, with an annual average of 18.5 µg/L to 35.2 µg/L in 2020. There was a rapid increase in chl-a from 2010 to 2020, which coincided with an increase in TP and other nutrients. The nitrogen-based parameters of TN, nitrate, and ammonia all depicted an increasing trend over the study period (Figure 4 and Figure 5). The annual concentration of TN for the year 2000 was 1.0 mg/L; in 2010, it increased to 1.26 mg/L, while in 2020, the mean annual concentration had reached 1.73 mg/L (Figure 5). The TN variation over the two-decade study period ranged from 0.73 to 2.93 mg/L, with the minimum concentration observed in 2000 and the maximum concentration observed in 2020 (Table 2). The concentration of BOD, which is an indication of organic matter in water, showed an increasing trend (Figure 5). In the 2000s, the concentrations were relatively low at 1.7 mg/L, gradually increasing to 2.8 mg/L in 2010 and eventually reaching 3.7 mg/L in 2020 on average. The range over the study period was 0.9–19.3 mg/L. Water temperature over the study period showed slight annual average increase, from 26.8 °C in 2000 to 27.2 °C in 2010 and eventually 27.7 °C in 2020 (Figure 5).
The concentration of SRSi in the water, which is influenced by LULC activities, especially stone quarrying in the catchment and usually delivered into the lake by rivers, also showed increasing trends during the study period (Figure 6). In the 2000s, the levels were low (10.1 mg/L), gradually increasing to 12.0 mg/L in 2010, before almost doubling in the next decade to 21.6 mg/L. On the other hand, the DO level showed a decreasing trend with an increase in LULC activities in the catchment. It ranged from an average concentration of 8.0 mg/L in the 2000s to an average of 6.0 mg/L in 2020 (Figure 6). Other parameters like temperature, TSS, pH, and turbidity showed varying trends in the study period. Both TSS and pH showed increasing trends. pH, however, showed a slight increase from 2010 to 2020 but remaining the same from 2000 to 2010. The annual mean TSS concentrations showed an increasing trend from 2.6 mg/L to 3.8 mg/L to 7.1 mg/L for 2000, 2010, and 2020, respectively. Turbidity depicted an increasing trend, although there was a slight reduction in concentration from 2010 to 2020 (Figure 6). This could be associated with the dilution of water in the lake from record-breaking floods of 2020–2021.

3.2. Land Use, Land Cover Changes

The identified dominant LULC change classes in the study area included agriculture/cultivated land, grasslands, forests, and water bodies. Other LULC classes included woodlands, wetlands, shrublands, and built-up/urban areas, see Table 3.
Agricultural land was dominant throughout the study period; in 2000, it covered 40% of all LU classes, increasing to 45.8% in 2010 and eventually expanding slightly to 45.9% in 2020 (Table 4). The increase in agricultural land was at the expense of other LULC classes, especially grasslands, shrubs, wetlands, and forests, which reduced in the land cover area (see Figure 7). Grasslands were the second dominant LULC class, especially in the 2000s, where they covered 19.7% of the total LCLU classes; they, however, reduced to 10.7% in 2010 and slightly increased to 11.1% in 2020. The grasslands were mainly dominant in the northern (Karamoja) areas of the catchment, where the nomadic type of livelihood is practiced. Furthermore, a big part of this area is covered by the protected Pian Upe Game Reserve, which covers Bulambuli and Nakapiripirit districts (Figure 8). Forests were also dominant in the study area, especially in 2010, covering 17.8%. This was an increase from 11.6% in 2000; their area coverage, however, dropped to 4.8% in 2020 (Table 4). However, the reduction in forests between 2010 and 2020 was replaced by planted woodlands in the study area as a response (Figure 7). Water bodies exhibited decreasing trends over the study period as their area coverage decreased from 8.4% to 7.9% to 7.7% for 2000, 2010, and 2020, respectively, see Table 4.
Woodlands, shrublands, wetlands, and urban/built-up areas also showed changes over the study period. In particular, Woodlands showed varying area coverage over the study period, where in 2000 they covered 7.3% of the area, reducing to just 0.1% in 2010 before increasing to 13.4% in 2020 (Table 4). This showed that the woodlands were mainly destroyed between 2000 and 2010 (Figure 8). Shrublands were almost exclusively found in the northern part of the study area (Karamoja), (Figure 8). They covered 6.2% in 2000 and increased to 10.4% between 2010 and 2020 (Table 4). The same trend was also observed with urban/built-up areas, which increased from 0.4% in 2000 to 0.7% in 2010 and 2020 (Table 4). Lake Kyoga basin boasts of high coverage of wetlands in Uganda [67]; they covered 6.5%, 6.6%, and 5.9% for the years 2000, 2010, and 2020, respectively, see Table 4. Although wetlands made some gains from 2000–2010, overall, they lost their area from 2010 to 2020 (Figure 7 and Figure 8).
Decadal analysis of different LULC changes was carried out, (Figure 9), it showed that whereas agriculture made gains in the area from 2000 to 2010, there was only a slight increase between 2010 and 2020, the same trend observed in shrublands, wetlands, and built-up areas. Woodland and grasslands, however, lost area in the 2000–2010 decade, but made gains in the area in the next decade of 2010–2020, with woodlands making more gains. Forests gained area in the 2000–2010 decade, but made severe losses in the 2010–2020 decade. Water bodies lost in the area overall over the two decades.
In terms of net gains and net losses for different LULC change classes (Figure 10), woodlands showed opposing trends over the two decades. Whereas they had net area loss of around 2000 km2 in the 2000–2010 decade, they made gains during the 2010–2020 decade of more than 3500 km2. The forests made opposite trend, they gained in the net area in 2000–2010 period, but lost area in 2010–2020 period. Wetlands made more net losses in 2010–2020 than the gains in 2000–2010; meanwhile, water bodies showed net losses over the study period. Urban areas also showed only net gains over the study period, with the 2000–2010 period showing more gains than 2010–2020. Agriculture showed the net gain trend in 2000–2010 of around 1500 km2, but the loss in 2010–2020 was too little. Grasslands, however, had a big net loss of area of around 2500 km2 but had a slight net gain in the area in 2010–2020. Like agriculture and forests, Shrubs gained net area in 2000–2010, but showed a slight decrease in the 2010–2020 period.

Accuracy and Kappa Coefficient

The overall accuracy of classification of maps and the Kappa coefficient (K) for the study years were calculated (see Table 5). The results showed that the classification of the LULC change classes was done with better accuracy, hence reliable.

3.3. Impacts of LULC Change on Water Quality of L. Kyoga

Fourteen crucial water quality parameters in drinking water, lake production, irrigation, and an indication of trophic status were linked with eight LULC change classes, Table 6.
With the Pearson correlation coefficient of ±0.68–1.0 representing a strong correlation, the results show strong positive and negative correlations between LULC changes and water quality parameters (see Table 6). The EC, for example, was strongly impacted by wetlands, forests, and waterbodies, with wetlands having a significant positive correlation. A decrease in water bodies strongly correlated with all the parameters, with only DO and EC having positive correlation, while Temp, turb, pH, TSS, Chl-a, BOD, and nitrogen and phosphorus-based nutrients showing negative correlation. Change in cultivated land/agriculture and shrubland influenced all nutrients (TP, TN, nitrates, SRP, NH4), physical parameters (turbidity, Temperature, TSS, and EC), and biological parameters (BOD, DO, Chl-a). With the exception of DO and EC, which had a solid and moderate negative correlation, respectively, all other parameters had a positive correlation, with nitrate showing significant correlation at a 0.01 confidence limit. In particular, Nitrate showed a significant correlation with shrublands, grasslands, agriculture, and urban/built-up areas. Built-up areas had a significant correlation with nitrate at a 0.01 confidence level. This showed that these LULC changes were the main contributors of the nitrate into the lake, and nitrate play a significant role in lake production. The increase in the agricultural area, therefore, has major impacts on the physico-chemical and biological properties of Lake Kyoga, which increase with the increase in cultivated land.
Forests, wetlands, grasslands, and waterbodies had similar impacts on a range of essential parameters in the lake ecosystem. Parameters including pH, temp, TP, SPR, nitrate, TN, NH4, BOD5, SRSi, TSS, and Chl-a had strong negative correlation with these LULC change classes (Table 6). Despite having a strong correlation, pH, and ammonia had a significant correlation with wetlands. A decrease in these LULC classes, as observed in the catchments, has resulted in an increase in the concentration of these parameters in the lake. The EC and DO, however, had a positive correlation with these LULC changes, with pH having a significant correlation with wetlands.

3.4. Trophic Water Quality Status of L. Kyoga

There are no clear agreed international trophic water quality status standards or guidelines for freshwater ecosystems like rivers, lakes, and wetlands. Africa in general and Uganda in particular have few or no such indices, especially for physico-chemical parameters. Florida has, however, developed four (Chl-a, TP, TN, and Transparency or Sechi depth) physical-chemical based indicator values for the determination of the trophic status of lakes. The trophic status includes Oligotrophic, with good clear water quality but not suitable for fish production; Mesotrophic, with a moderate level of productivity; Eutrophic, with a high level of productivity but not suitable for recreation; and Hypereutrophic, bad water quality with the highest level of biological productivity [92]. The findings for this study were nevertheless compared to the limits of the trophic status of Florida to determine the trophic status of L. Kyoga water quality in terms of pollution (Table 7).
L. Kyoga was shown to be in a eutrophic state, slowly progressing to a hypereutrophic state in terms of TP and TN from 2000 to 2020. The mean TP and TN concentrations showed that the lake was eutrophic between 2000 and 2010 and progressively turned into hypereutrophic in 2020. Sechi depth/transparency and chl-a on the other side indicated that the lake was in a eutrophic state; see Table 7.
There are also some water quality indices for lakes that different organizations have developed for different purposes. For example, the World Health Organization (WHO), Bureau of Indian Standards (BIS), International Scientific Indexing (ISI), Environmental Protection Agency (EPA) of the United States, United Nations (UN), and Central Pollution Control Board (CPCB) have developed some indicative values for specific parameters to guide classification of water resources. The findings of this study were compared with these water quality indices to determine a rough status of L. Kyoga water resource (Table 8).
The pH values in the study area were within recommended limits, although the pH was tending to an alkaline level in 2020. According to WHO [98], the turbidity was above the recommended limit for a water body used for drinking purposes. This was observed in all the study periods. Soluble reactive phosphorus was below the recommended limit for surface water between 2000 and 2010; however, in 2020, the concentration went above the limit set by EPA [99]. Like phosphates the biochemical oxygen demand, was within pollution limits set by different authors in different countries in 2000 and 2010; however, it was above the limits by 2020 [93,94]. Chlorophyll a was above the limits set by the UN [103] in all the study periods.

4. Discussion

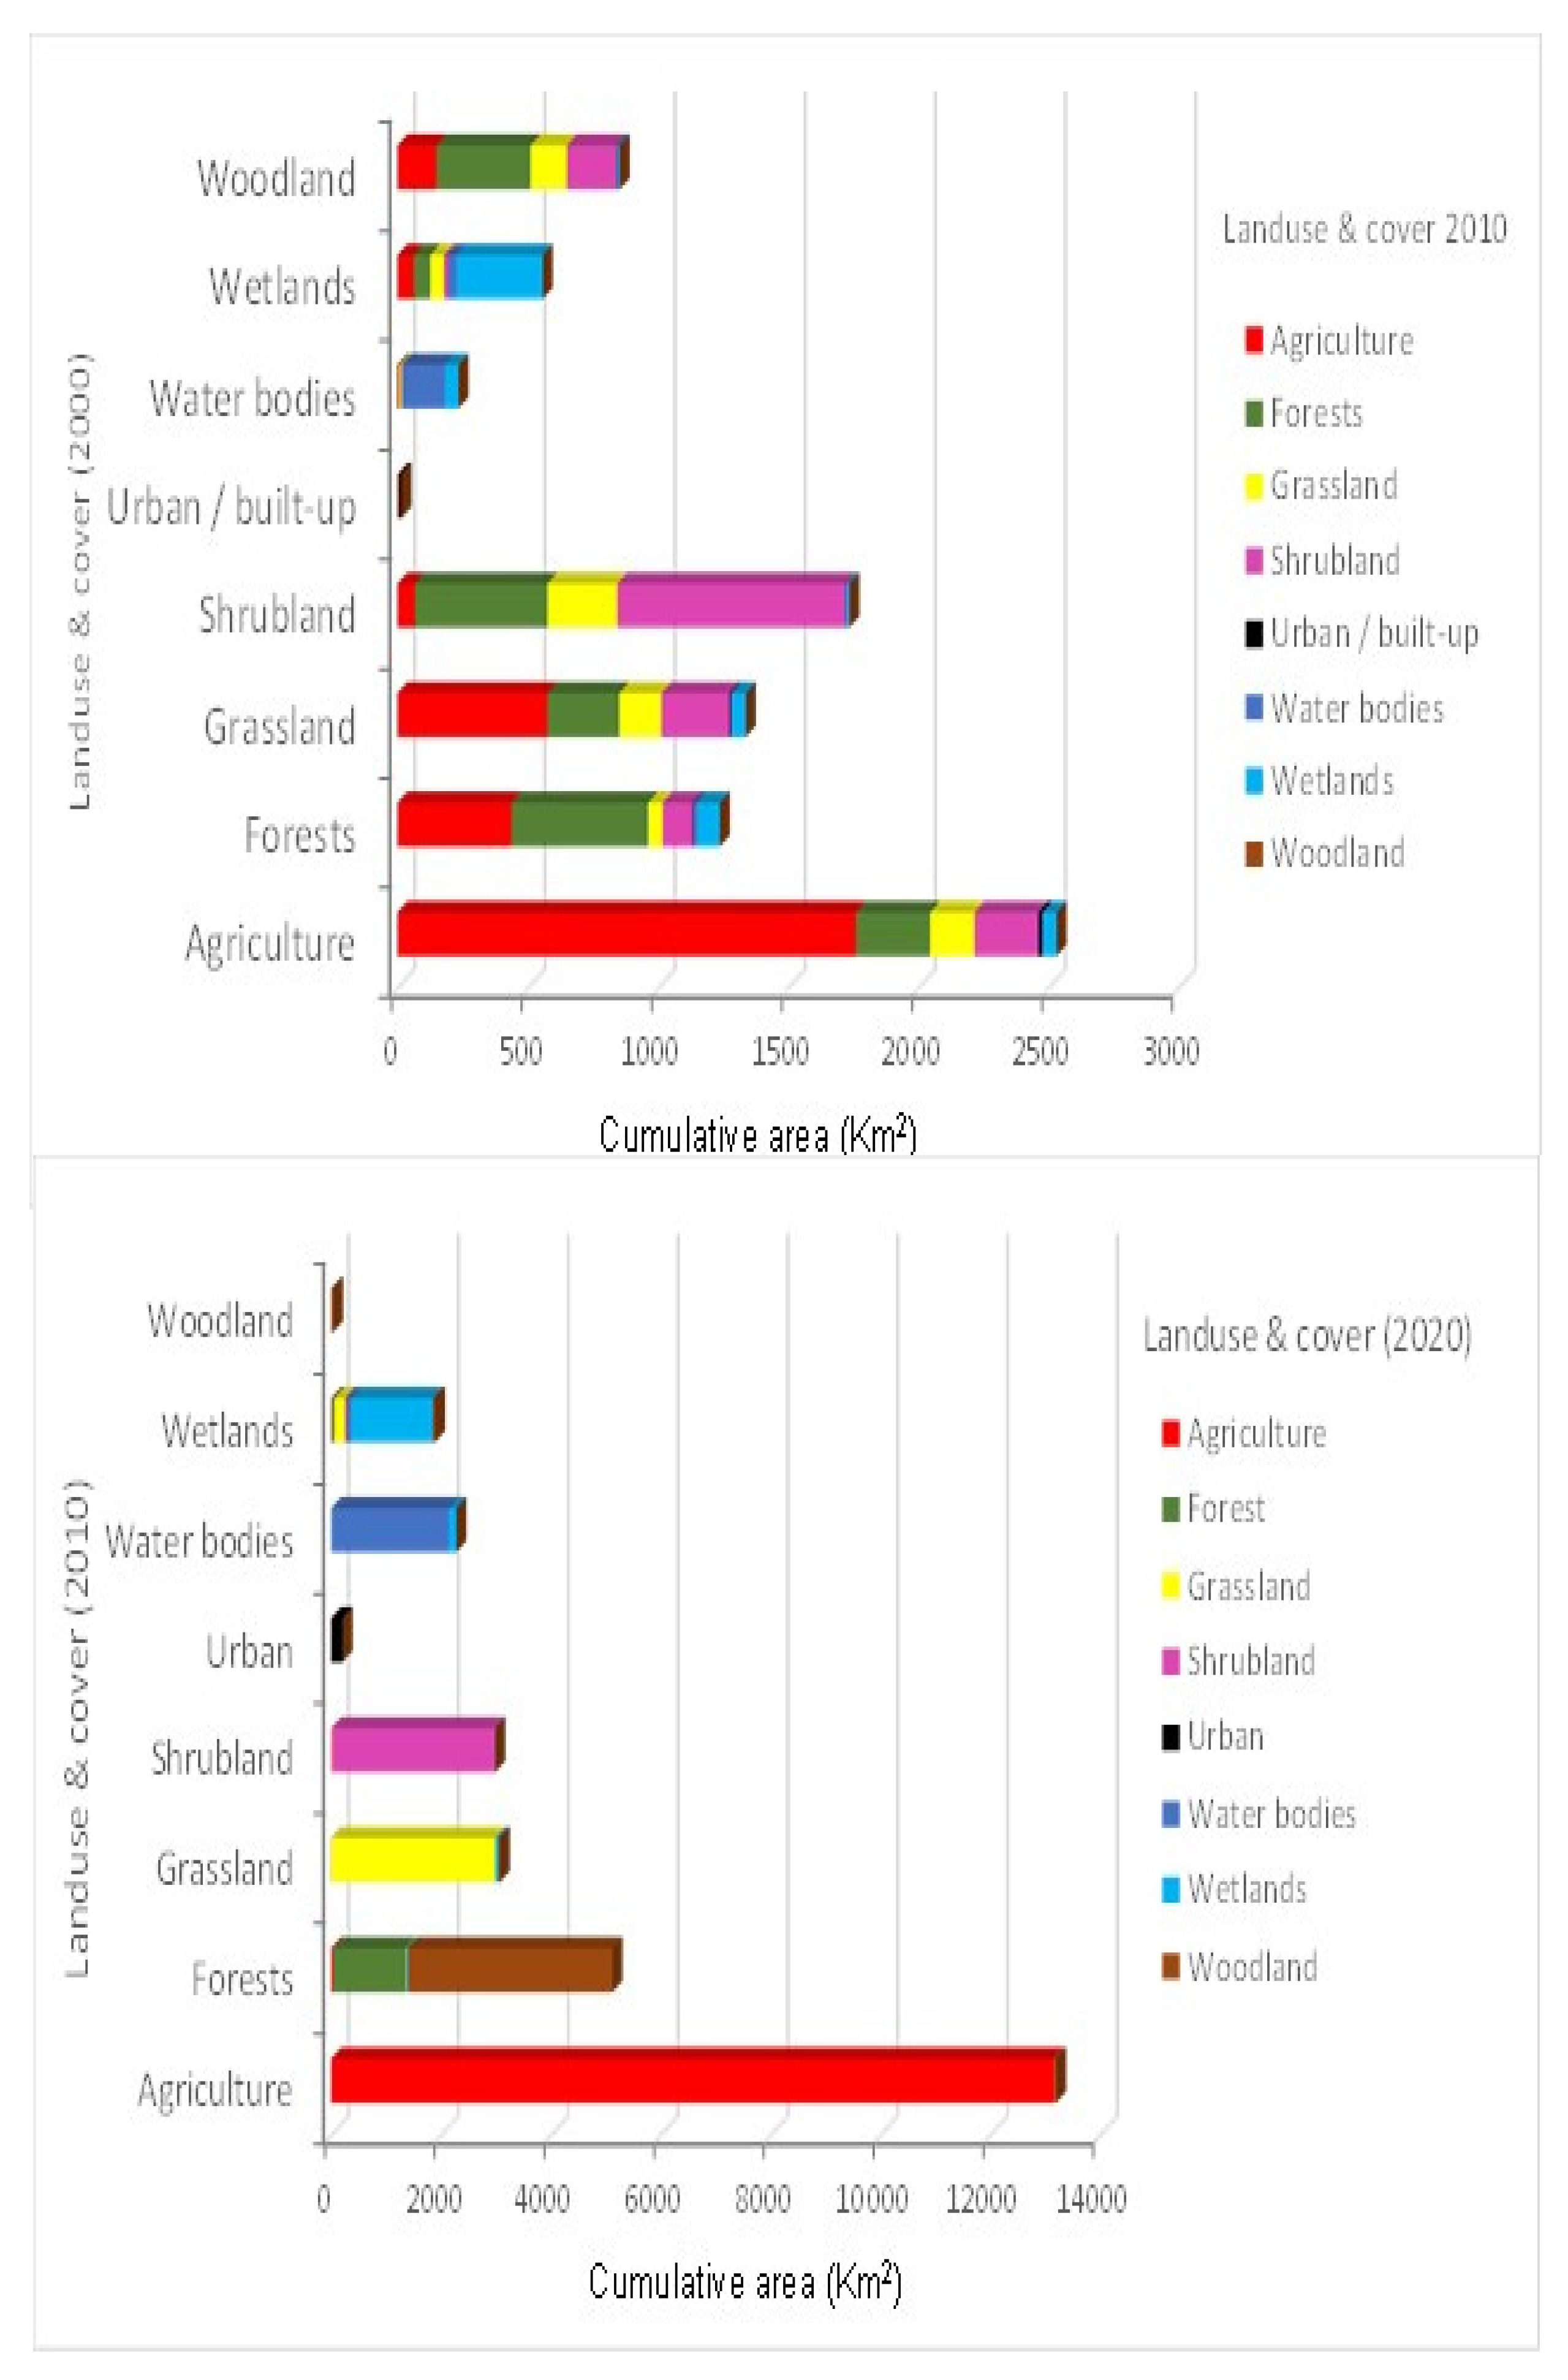
Analysis of LULC changes in the study area showed that non-point sources of pollution were the main driver of water quality changes in the Lake Kyoga basin. Agriculture was the most dominant LU activity in the study area, followed by grasslands, forests and waterbodies. Agriculture was not only dominant in the study area, but also nationally as most people depend on rainfed agriculture as a source of food and income. It had strong correlations with most of the water quality parameters, with significant correlation with nitrate (Table 6). Its impacts on water quality emanate from different directions, including soil erosion, due to unsuitable tillage approaches, like soil excavation, with poor soil conservation measures, as pointed out by Guzha et al. [104]; and Fatumah et al. [105], and cultivation on steep slopes of Mt Elgon. Application of agro-chemicals, like fertilizers, herbicides, and plant growth boosters, which contain phosphorus, nitrogen, and potassium, are also major sources of the nutrients observed. Heavy rains in the area caused by climate change as reported in the related study [106], exacerbates LULC impacts into the lake as floods help to deliver sediments and nutrients into Lake Kyoga. This is done through a network of rivers and streams including rivers, Awoja, Mpologoma, and Manafwa, with effects on water quality as has been shown elsewhere [43,80,107,108,109,110,111,112,113,
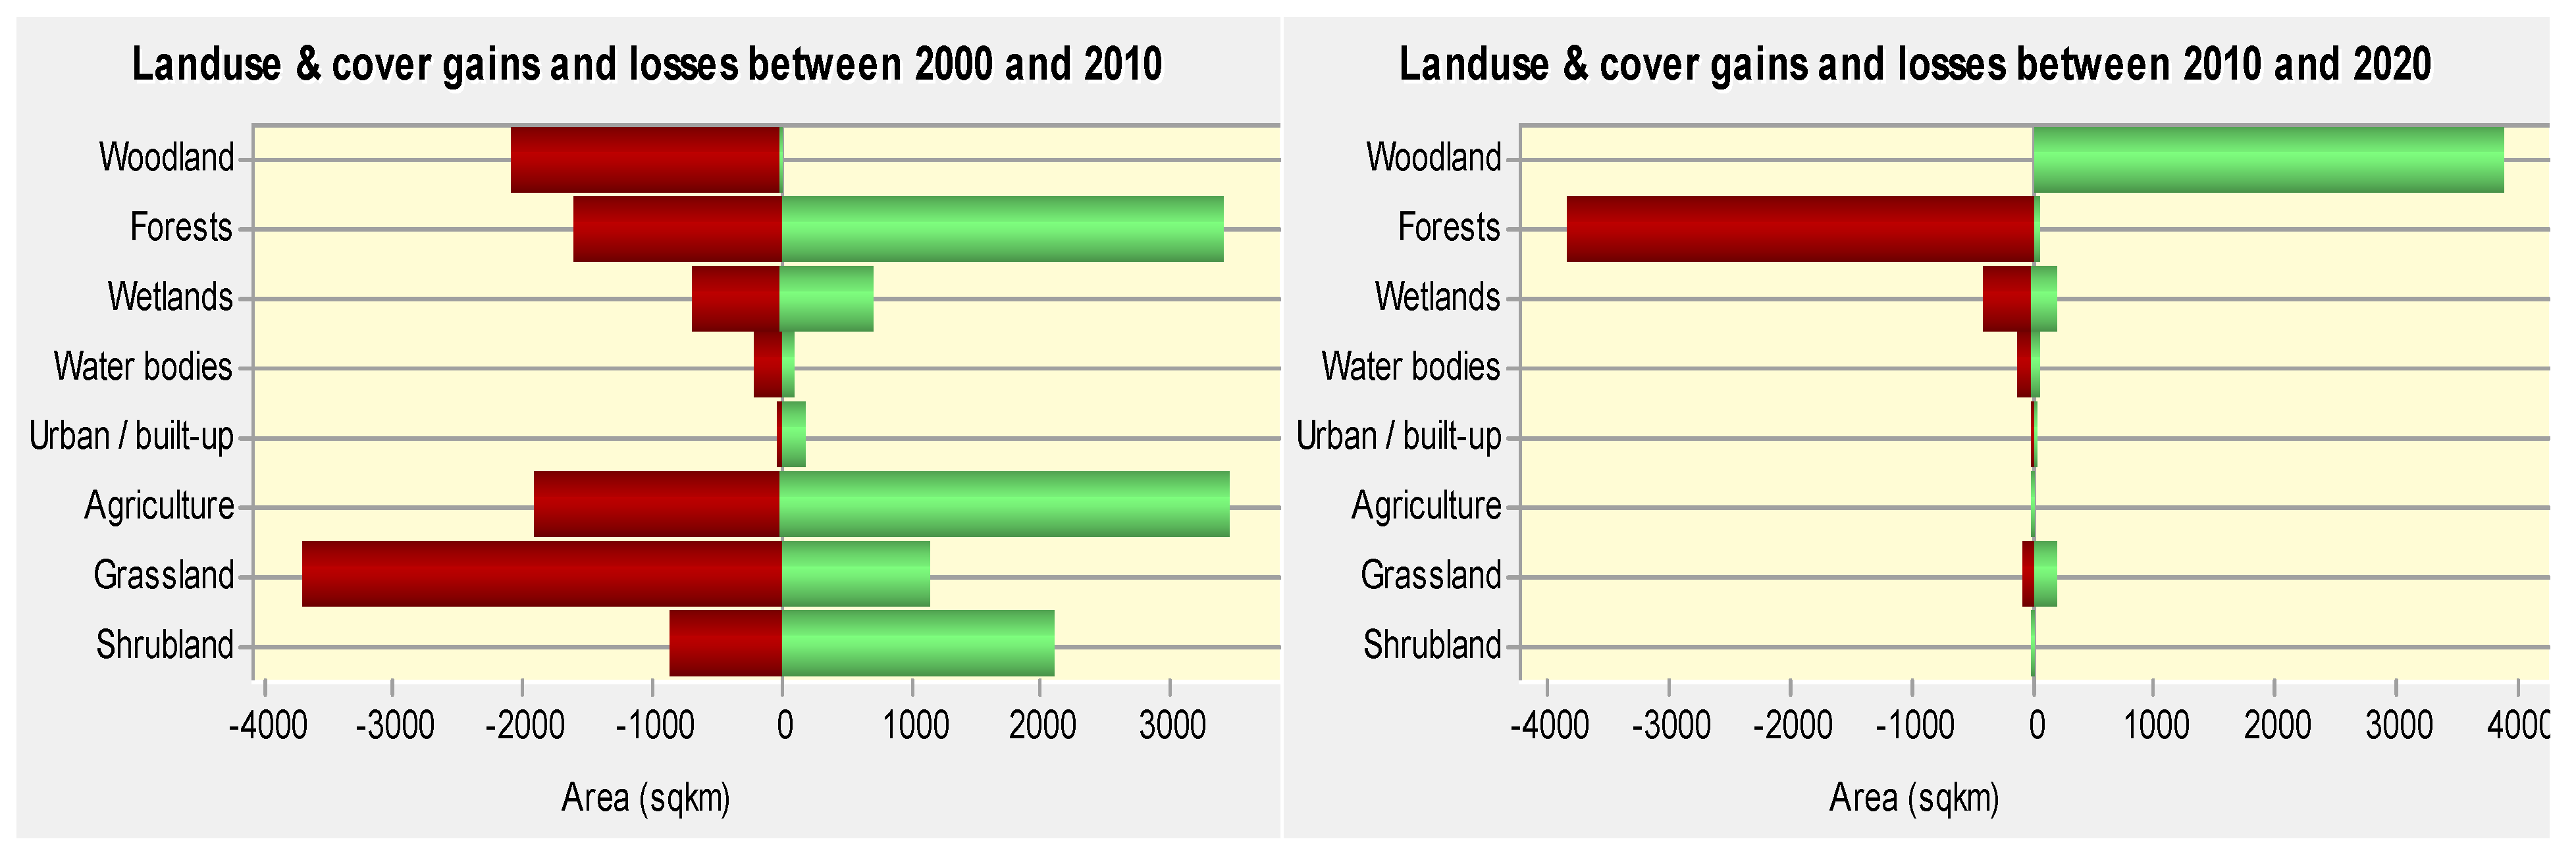
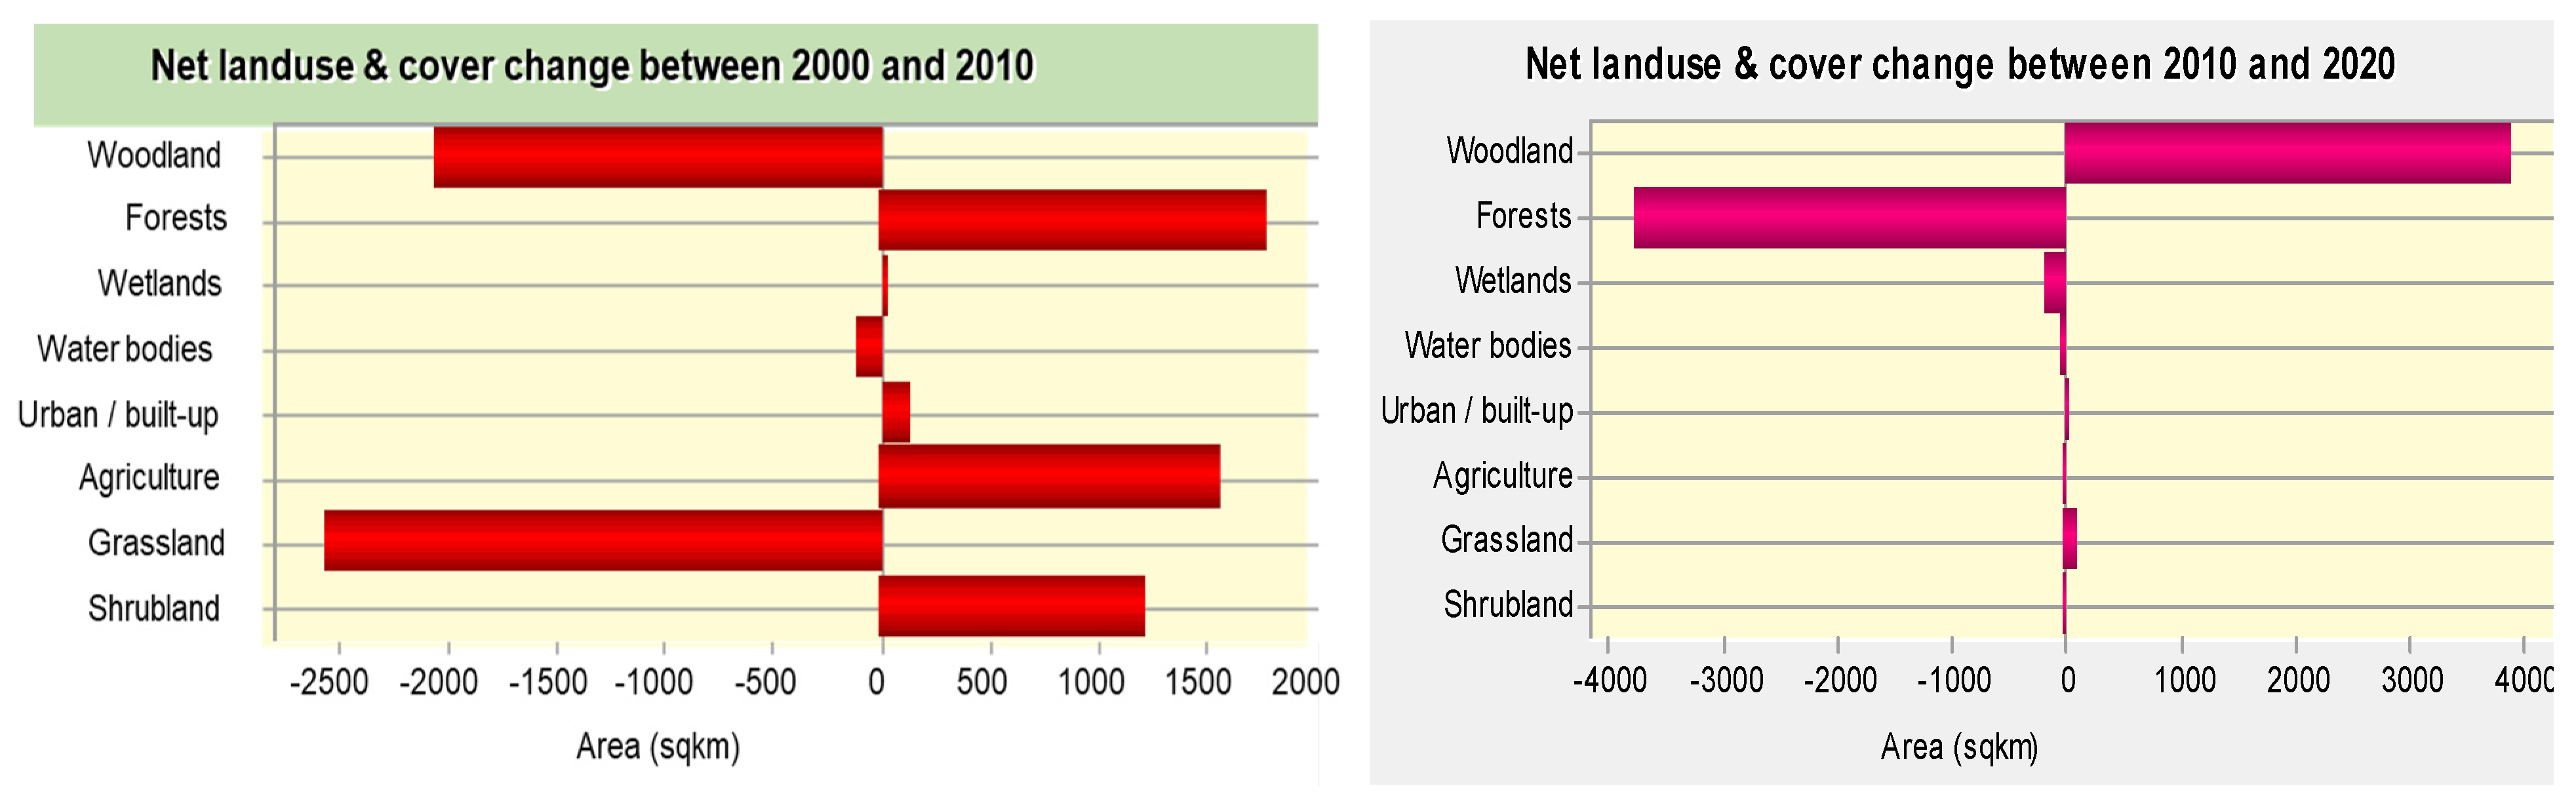
114]. Most of the forests, grasslands, woodlands and shrublands have been destroyed for different reasons, including agriculture and charcoal burning to provide for the ever-growing human demands for energy in the form of charcoal, timber, and livestock grazing, which has impacted water quality, including reduction of essential DO [115,116,117]. The only relatively intact natural resources are those gazeted and guarded by security, like Afromontane Mt. Elgon Forest, Elgon National Park, Pian Upe wildlife reserve and woodlots planted by individuals [118]. These areas are however, being encroached upon for settlement, and agriculture due to the increasing population pressure.
Wetlands play a key role in filtering nutrients and settling sediments from the catchments before the water enters the lake ecosystem; they also act as refugia and nursery areas for fish [119,120]. Lake Kyoga and its catchment wetlands, in the 1980s used to have a dense network of natural vegetation with Miscanthidium spp, papyrus, and Typha, being the primary vegetation [71], and the lake had good water quality. Since the increased conversion of wetlands areas into mainly rice fields [118], an economic activity which cannot sequestrate nutrients like the natural vegetation [121,122,
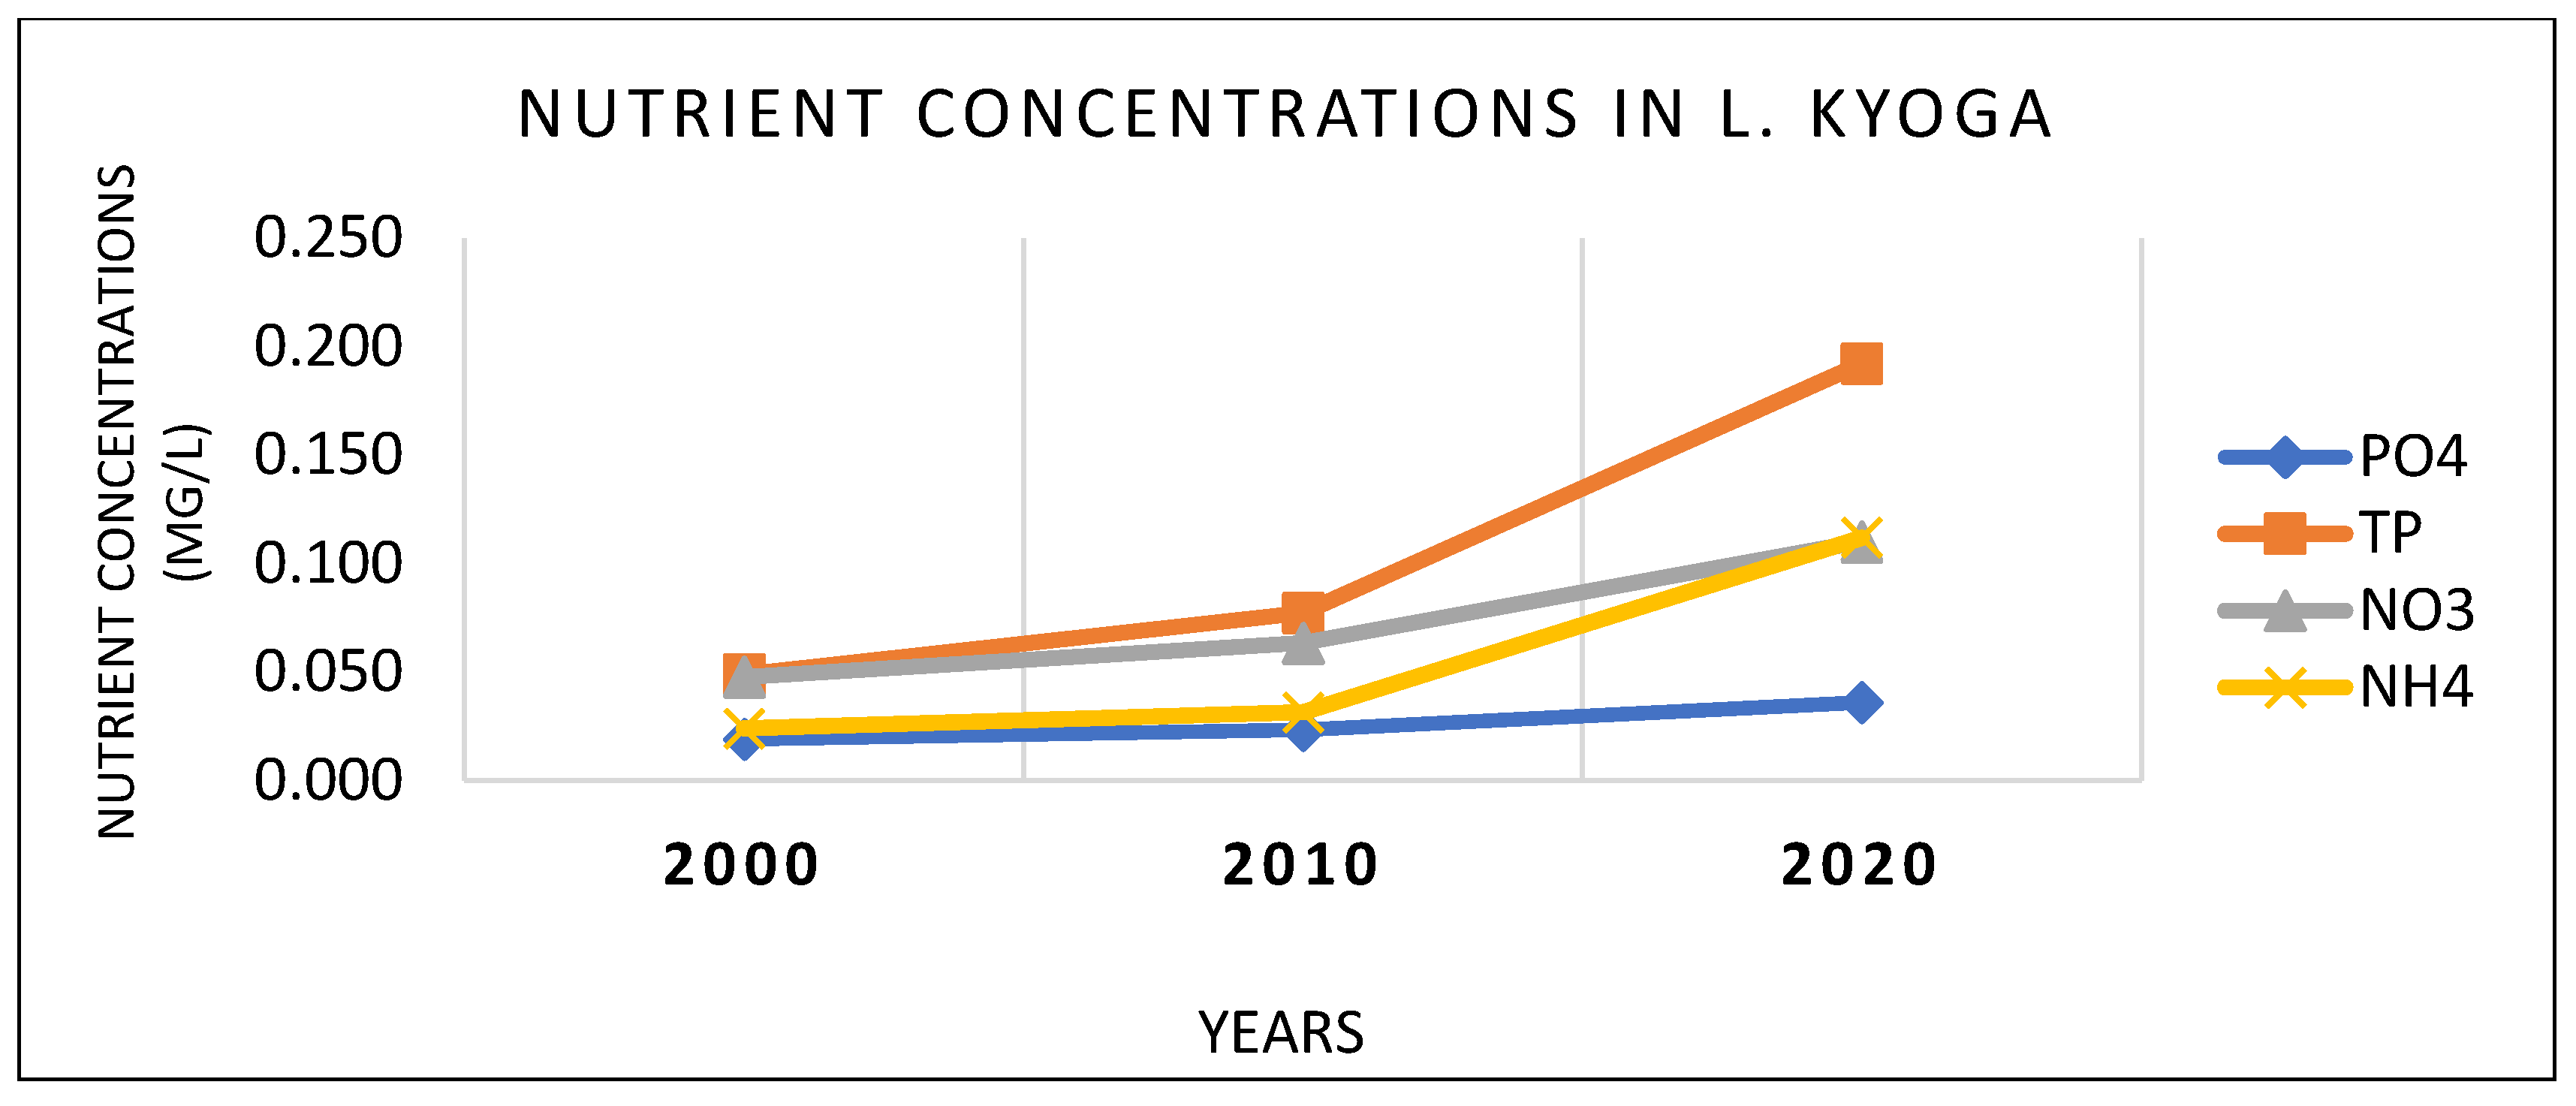
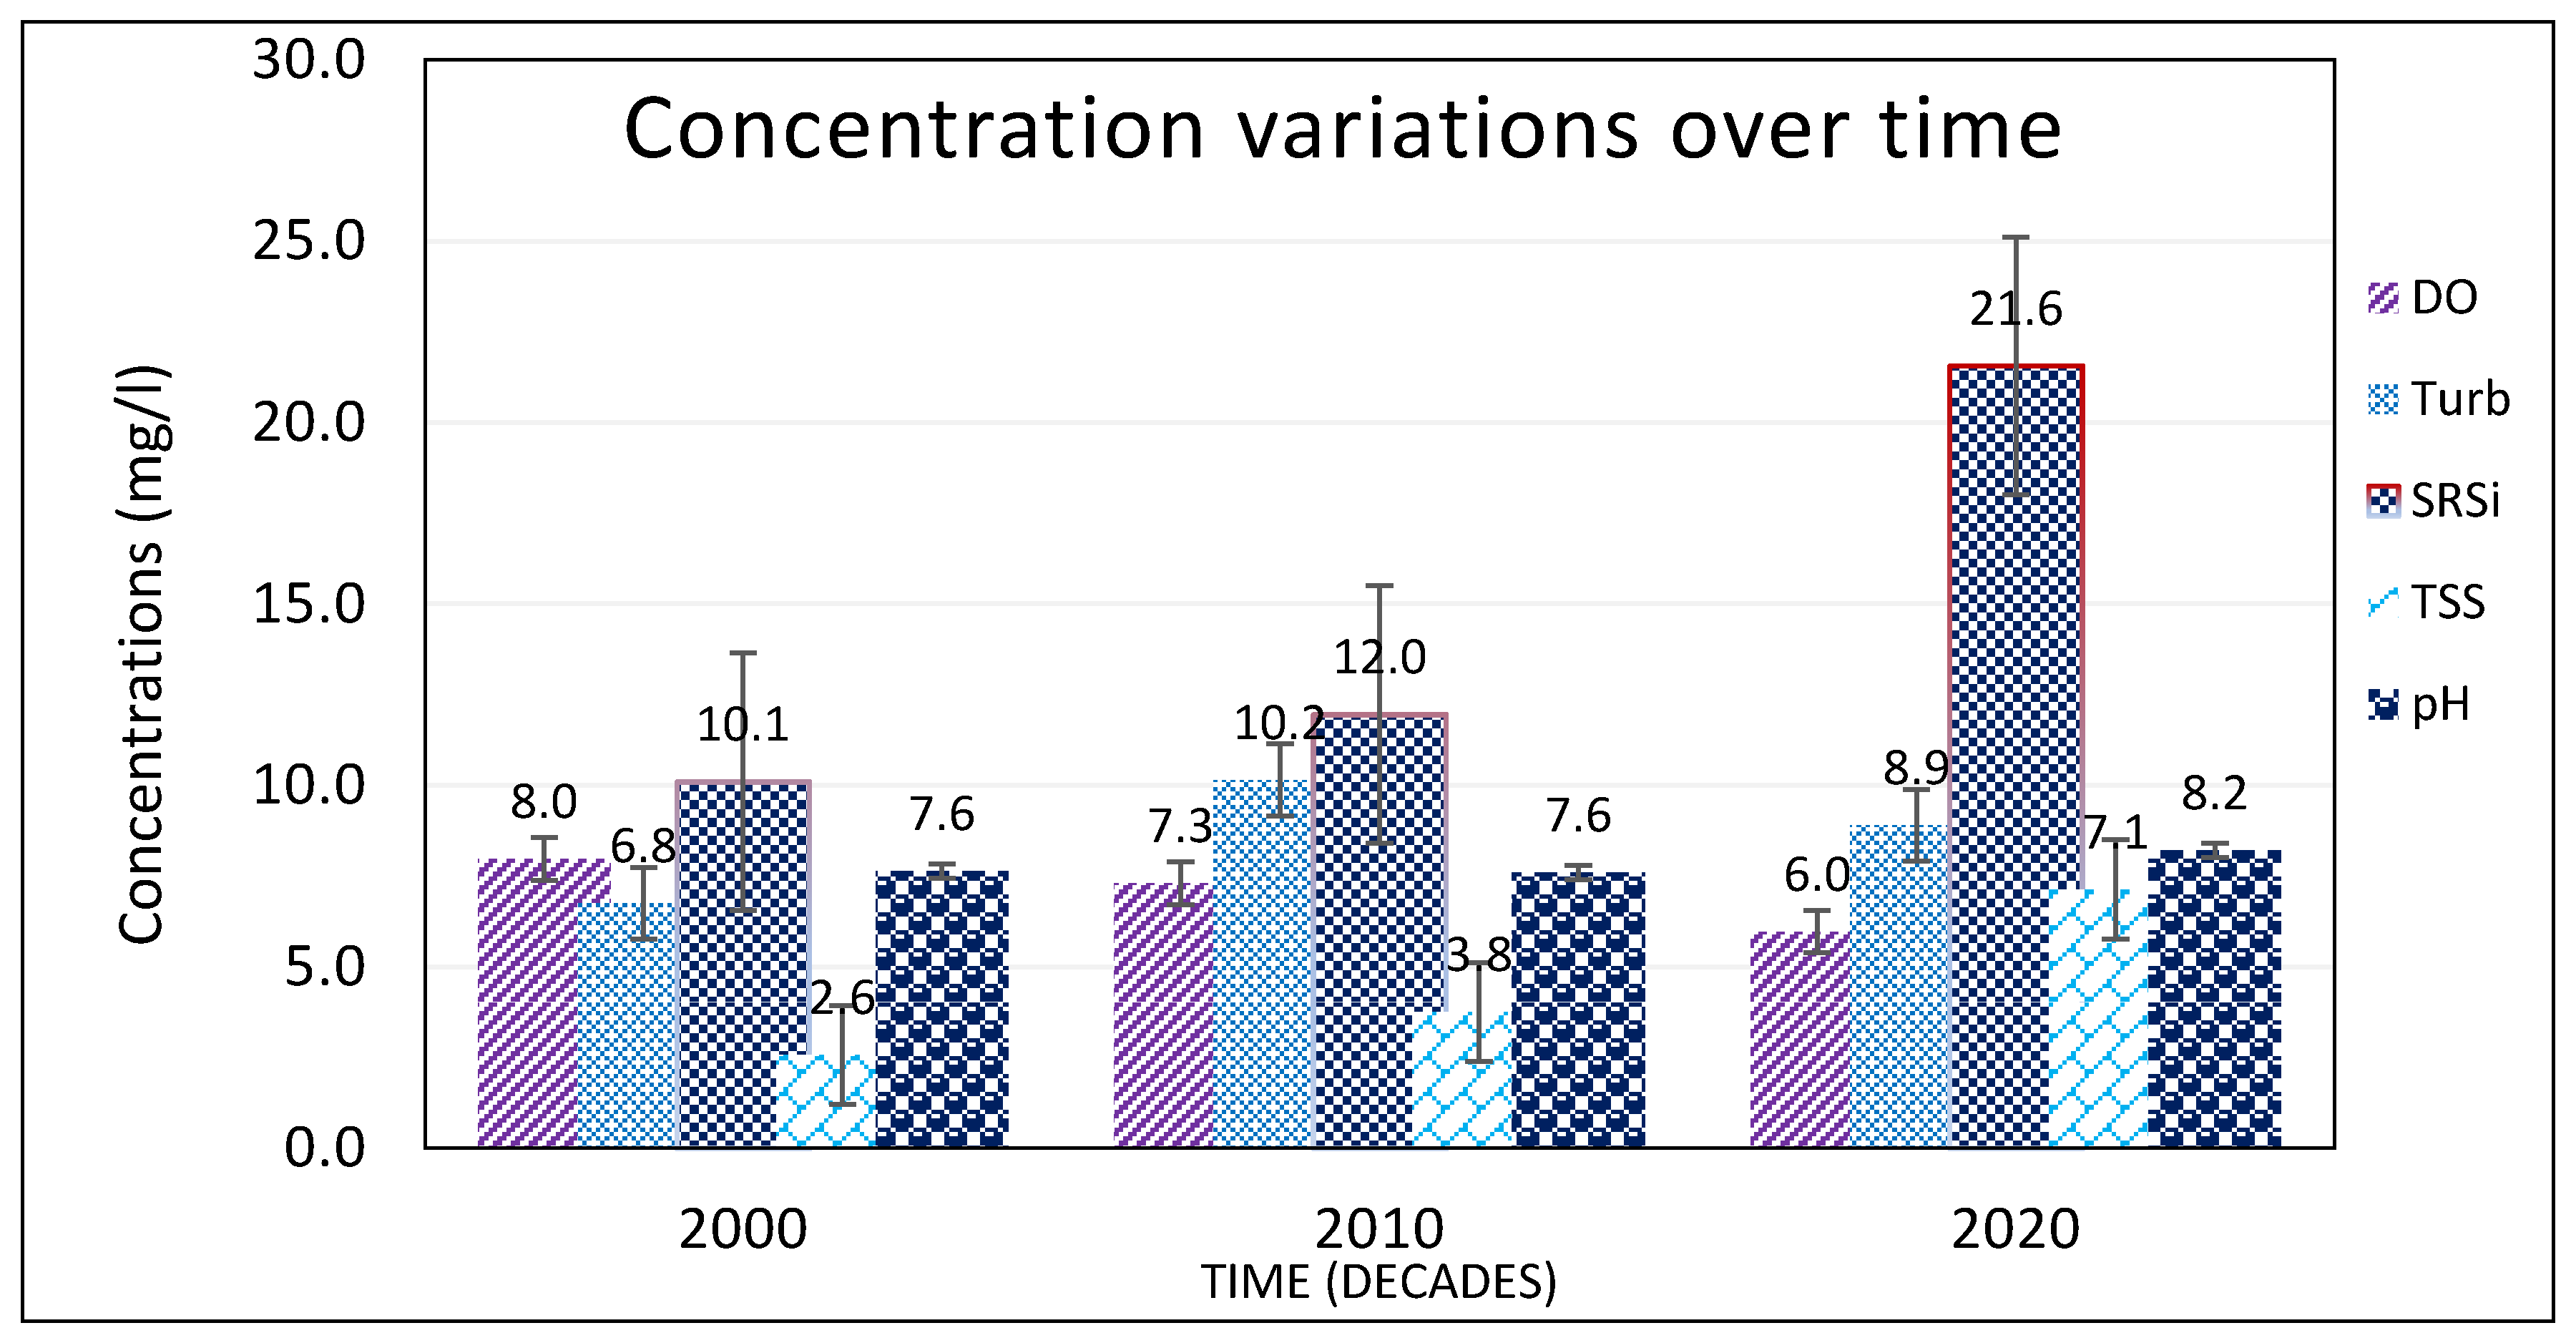
123], loading of nutrients into the lake has continued. This was indicated by the increase in the concentrations of nutrients, sediments and chl-a over the study period (Figure 4). The increase in urban/built-up areas, especially from 2010, could be associated with population increase and shortage of land for agriculture in the study area. The developing is driven by business purposes as an alternative source of livelihoods. These centers affect not only the water quality through point and non-point sources, but also hydrology of rivers and channels. They are sources of nutrients and sediments into L. Kyoga. The strong correlation between increase in urban centers with physico-chemical and biological parameters, especially DO, temp, turb, SRP, TP, nitrate, TN, BOD, and TSS is evidence of this relationship. Studies from other countries [14,59,124,125,126,127] agree with these findings. Water bodies showed a slightly decreasing trend over the study area; and this could be associated with increased evapotranspiration due to high temperatures and droughts caused by climate change [106]. This decrease had an impact on all the water quality parameters in L. Kyoga as seen by solid positive and negative correlations. Similar results were obtained by other authors [29,30,128,129]. The degradation of wetlands, especially for agriculture [123] was driven by land shortage and the growing demand for food and income from an ever-growing population. Therefore, to protect the lake from further deterioration of water quality, there is need to manage LU activities in the catchment.
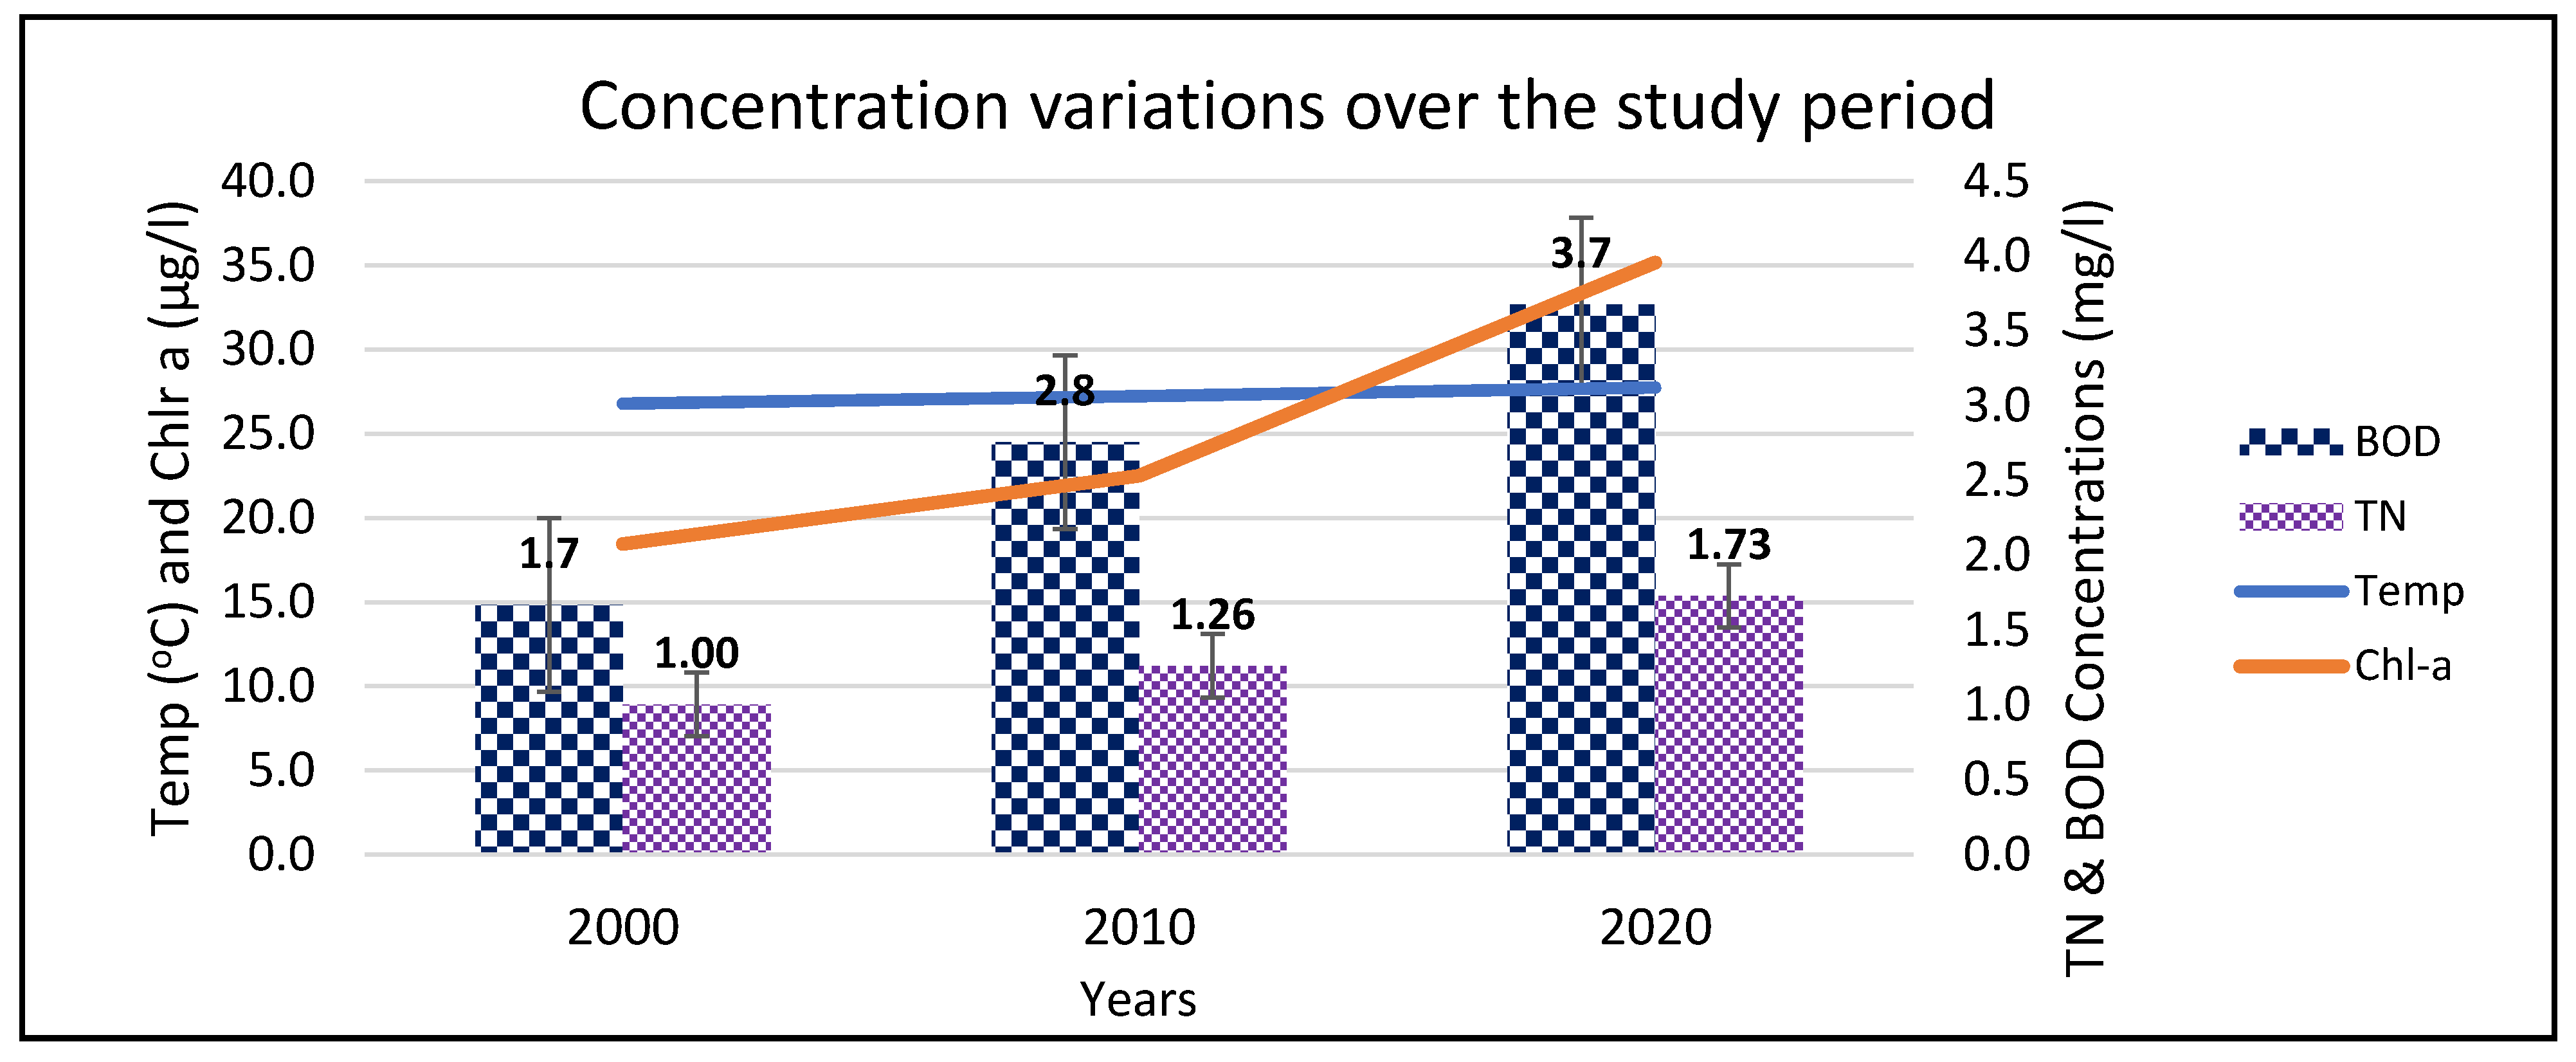
The LULC change activities in Awoja, Mpologoma, and Lwere catchments had impacts on the water quality in the eastern arm of L. Kyoga. This was shown by the steady deterioration over the study period, from year 2000 to 2020. This could be the same situation throughout the lake. The major physical, chemical, and biological parameters showed an increasing trend over the study period (Figure 4, Figure 5 and Figure 6). These nutrients do not work in isolation, but synergize with each other to cause impacts on flora and fauna of the Lake Kyoga ecosystem. They play an essential role in the functioning and productivity of the lake, as pointed out by Wiens [7] and Miranda et al. [43]. Phosphorus, for example, is a limiting factor for algal growth and lake productivity in many aquatic ecosystems; hence its input together with nitrogen to L. Kyoga from the catchments had an impact on the trophic status of the lake, which agrees with the findings of Miranda et al. [43]. Algae and macrophytes, which are primary producers, require these nutrients for their growth, hence forming the basis of the food chain in the lake, thereby supporting fish and other fauna that depend on these nutrients. However, the continued nutrient enrichment of L. Kyoga from agro-chemicals in quantities beyond the systems’ ecological requirements is a threat. It has led to a shift in the lake’s trophic status to a eutrophic state, tending to a hypereutrophic state, characterized by algal blooms, shortage of DO, and increased macrophyte biomass, as has been pointed out by other authors [130,131,132,133]. The consequences are reduced transparency, and an increase in organic matter [86], siltation and reduction of the lake depth; deposition and hence storage of nutrients in sediments, unprecedented death of Nile perch in 2020 [134], as was observed by other earlier studies in L. Victoria basin [135,136]. The lake’s shallow nature makes resuspension of nutrients especially phosphorus by wind action, making nutrients available for algae and other flora [137]. Phosphorus, in particular, is reported to be more in the water column in the shallow lakes than in the sediment due to low retention capacity and frequent sediment resuspension of shallow lakes [138], since it is a limiting factor for algae, its ever presence leads to algal blooms.
Temperature plays a significant role in controlling the rates of reactions in the water body, especially in shallow lakes, which do not experience stratification. The observed increase in temperature results in an increased algal and macrophyte productivity; together with nutrient enrichment, it has favored the invasion and spread of tropical invasive water weeds, especially S. molesta (locally known as Nankabirwa weed) and Eichhornia crassipes [139,140]. These invasive weeds have destroyed fish breeding areas, reduced light penetration into the lake, and hence reduced the concentration of DO in the water, affecting fauna and flora in the lake. They have also affected fisheries by destroying fishing gear, affected water supply, watering of domestic animals, and navigation, as has been reported by other authors [64,67]. Further, an increase in temperatures results in increased evapotranspiration rates, leading to the lake’s net water loss, as has been pointed out by other studies [28,141,142]. The reduction in water bodies, together with wetland degradation, and forest and woodland reduction impacted chl-a, SRSi, and pH (Table 4), which agrees with other findings [85,143,144]. The increased algal biomass, indicated by increased chl-a, impacts fish yields; by supporting secondary and tertiary producers, and also increases DO levels in the lake. But the increased nutrient enrichment from the catchment has led to increased poor water quality, with negative impacts in the L. Kyoga ecosystem, as has been observed in other studies [24,145]. Although SRSi is vital for the growth of invertebrates like snails and diatoms, its increased enrichment is a cause of concern as it could increase algal blooms and proliferation of invertebrates. The pH of a water body influences the release of SRP from sediments [146], and the growth of macrophytes [147], it also buffers water and helps in dissolution of metals in water [85]. Its variation over the study period, therefore, had impacts on the functioning, food chain, and food web interactions, and EC of L. Kyoga ecosystem. There was an observed increase in EC over the study period, a finding which agrees with results from other studies [117,148], and is likely to affect the mineral balance of the lake. The increase in BOD5 showed raised loading of organic matter, which is biodegraded by aerobic microorganisms, leading to the reduction of DO, and release of nutrients as has been reported by other authors [149,150,151]. Further, studies in Poland, Brazil, and Malawi [85,152,153] also showed the same correlation between DO and LULC changes.
The impacts of LULC change do not only affect water quality, but also economic activities and livelihoods. For example, fishing in L. Kyoga for Nile perch, Nile tilapia, and silverfish locally called ‘Mukene’ [67], is one of the major economic activities that provides food/protein and generate revenue for the central and local governments, in addition to the local communities. The lake’s pollution from catchment LULC change activities is threatening not only the fisheries but also other ecosystem functions and services provided by lake Kyoga. For example, the lake ecosystem has a huge potential for tourism, water supply to the riparian communities and upcoming cities like Mbale and Soroti, irrigation, and agriculture, which are under threat. Therefore, restoration of forests, woodlands, grasslands, shrublands, and wetlands, which are great sinks for nutrients and sediments from the catchments and management of urban centers should be prioritized as pointed out by the findings of MWE in the Awoja catchment plan report [75]. Proper management of built-up areas will lead to reduction in the concentrations of physico-chemical and biological parameters and an increase in DO. The impacts of LULC change have also been observed in Chaohu Lake Basin China, USA, and Japan [124,154,155,156].

5. Conclusions

This study has proved the linkage between land and water resources as observed in different parts of the world. It has further shown that LULC change activities in the catchment affect the water quality of the adjacent water bodies, with climate change being the catalyst of the linkage. Over the study period, the water quality of L. Kyoga has shown a deteriorating trend associated with LULC change activities in the catchments, and these trends will continue getting worse if no action is taken to restore good water quality. The deterioration of water quality has been rapid, especially from 2010 to 2020, a worrying trend that requires urgent mitigation measures. The trends showed degraded water quality, as indicated by physico-chemical and biological parameters that are getting degraded. This study has proved that Lake Kyoga is in a eutrophic state, tending to a hypereutrophic state according to the Florida physico-chemical trophic state indices. The consequences of this eutrophic state include invasion of the lake by invasive water weeds like water hyacinth and Nankabirwa and death of Nile Perch in the lake due to poor water quality, especially reduction in the concentration of DO. The suitability of this water for drinking, irrigation, biodiversity conservation, fisheries, and recreation are also threatened. Agriculture was a dominant land use form in the lake’s catchment, alongside land, the cover was characterized by forests, wetlands, woodlands, grasslands, shrublands, and urban centers. These LULC changes impact the water quality of L. Kyoga negatively in most cases.
Any efforts to improve the water quality of the Lake Kyoga ecosystem from the current degradation trend should prioritize management of LULC changes in the catchments. The responsible stakeholders, like local government officials and the line ministries, need to enforce statutory laws and regulations on protecting water bodies. Like river bank protection, protecting and preserving of 100–200 m of lake banks, prohibition of wetland degradation. These findings are, therefore valuable for all relevant stakeholders, including decision and policy-makers responsible for the management of water resources including L. Kyoga. These include MWE, MAAIF, and regional bodies like Nile Basin Initiative (NBI) Countries, CSOs, and NGOs. Drivers and pressures of these LULC changes that include population increase, poverty, shortage of land, need for energy in the form of charcoal, and shortage of better alternative ways of livelihoods should be studied, pointed out, and addressed. This will help reduce the pressure of the LULC changes and water quality eventually. Management activities, like restoration of wetlands, re-afforestation, and forestation, improvement of agricultural practices like the use of terraces of the steep slopes of Mt. Elgon, and provision of cheaper alternative sources of power like solar and biogas should be prioritized.
Conservation and restoration efforts are being made in the study area by MWE, through the wetlands department and regional offices under KWMZ, together with local governments, non-government organizations (NGOs), civil society organizations (CSOs), and the local community. The continued degradation trend shows that more work remains to be done to stop and reverse the situation. This kind of research should be extended to other water bodies in Uganda and the region. Therefore, strategic measures for sustainable utilization of the lake’s resources, management, and protection of its catchment from further degradation to stem further water quality deterioration should be prioritized. This study focused on the physico-chemical and biological aspects of the lake’s water quality. There is a need to study the impact of LULC activities on other aspects of L. Kyoga ecosystem, including sediment deposition and quality; bathymetry studies should be helpful in this area. Other limnological aspects like zooplankton, phytoplankton, macroinvertebrates, macrophytes dynamics with LULC changes should be done. The other potential source of nutrients load into the lake includes atmospheric deposition, and it is recommended that this is done to facilitate a wholistic mitigation approach. Monitoring of pollution status of aquatic ecosystems like lakes, reservoirs, streams and rivers, and wetlands is vital for management purposes. It is therefore recommended that Uganda, East Africa, and Africa as a whole should develop water quality trophic status indices to guide management options by policy and decision-makers.

Author Contributions

The corresponding author J.P.O., a student at Addis Ababa University under Africa Centre of Excellence for Water Management, came up with the topic, designed and planned the research work. He collected and analyzed data, drafted the manuscript, and incorporated all comments from the supervisors. S.M. played an important advisory role and also revision of the manuscript. T.A., R.O. and T.F. all made an essential contribution by reviewing the draft manuscript and providing essential comments. All authors have read and agreed to the published version of the manuscript.

Funding

The funding for the production of this research work was through the Ph. D scholarship offered to the corresponding author under Africa Centre of Excellence for Water Management (ACEWM), Addis Ababa University, Addis Ababa, Ethiopia. The Grand number (ACEWN/GSR/9873/11).

Institutional Review Board Statement

Not applicable.

Informed Consent Statement

Not applicable.

Data Availability Statement

Primary water quality data are available as a zipped file and will be uploaded. Secondary data are however not available for free from the institutions that have it. It can however be available on request through www.mwe.go.ug and www.firi.go.ug, accessed on 21 September 2021.

Acknowledgments

The authors would like to acknowledge the contribution of ACEWM for the guidance before and during the study period. Special appreciation also goes to the Ministry of Water and Environment (MWE) Uganda, for providing working space, data and laboratory analyses. National Fisheries Resources Research Institute (NAFIRRI) also provided data on water quality of L. Kyoga; you are appreciated.

Conflicts of Interest

The authors of this research work declare no conflict of interest in the production and publication of this paper.

References

  1. Alemayehu, F.; Taha, N.; Nyssen, J.; Girma, A.; Zenebe, A.; Behailu, M.; Deckers, S.; Poesen, J. The impacts of watershed management on land use and land cover dynamics in Eastern Tigray (Ethiopia). Resour. Conserv. Recycl. 2009, 53, 192–198. [Google Scholar] [CrossRef]
  2. Hassan, Z.; Shabbir, R.; Ahmad, S.S.; Malik, A.H.; Aziz, N.; Butt, A.; Erum, S. Dynamics of land use and land cover change (LULCC) using geospatial techniques: A case study of Islamabad Pakistan. Springer Plus 2016, 5, 1–11. [Google Scholar] [CrossRef] [Green Version]
  3. Abdulkareem, J.; Pradhan, B.; Sulaiman, W.; Jamil, N.R. Prediction of spatial soil loss impacted by long-term land-use/land-cover change in a tropical watershed. Geosci. Front. 2019, 10, 389–403. [Google Scholar] [CrossRef]
  4. Imran, A.M. Flood and landslide vulnerability as natural hazard in Parepare City. In IOP Conference Series: Earth and Environmental Science; IOP Publishing: Bristol, UK, 2019; Volume 235, p. 012079. [Google Scholar]
  5. Fowler, D.; Coyle, M.; Skiba, U.; Sutton, M.A.; Cape, J.N.; Reis, S.; Sheppard, L.J.; Jenkins, A.; Grizzetti, B.; Galloway, J.N.; et al. The global nitrogen cycle in the twenty-first century. Philos. Trans. R. Soc. B Biol. Sci. 2013, 368, 20130164. [Google Scholar] [CrossRef] [PubMed]
  6. Goyette, J.-O.; Bennett, E.M.; Howarth, R.W.; Maranger, R. Changes in anthropogenic nitrogen and phosphorus inputs to the St. Lawrence sub-basin over 110 years and impacts on riverine export. Glob. Biogeochem. Cycles 2016, 30, 1000–1014. [Google Scholar] [CrossRef] [Green Version]
  7. Wiens, J.A. Riverine landscapes: Taking landscape ecology into the water. Freshw. Biol. 2002, 47, 501–515. [Google Scholar] [CrossRef]
  8. Sanford, W.E.; Pope, J.P.; Selnick, D.L.; Stumvoll, R.F. Simulation of Groundwater Flow in the Shallow Aquifer System of the Delmarva Peninsula, Maryland and Delaware; USGS: Reston, VA, USA, 2012. [CrossRef] [Green Version]
  9. Jasechko, S.; Kirchner, J.W.; Welker, J.M.; McDonnell, J.J. Substantial proportion of global streamflow less than three months old. Nat. Geosci. 2016, 9, 126–129. [Google Scholar] [CrossRef]
  10. Obubu, J.P.; Mengistou, S.; Fetahi, T.; Graf, W.; Odong, R. A critical review of macroinvertebrate-based bioassessment approaches in Africa’s lotic systems: Developments, challenges, and legal requirements. Afr. J. Aquat. Sci. 2021, 46, 1–13. [Google Scholar] [CrossRef]
  11. Risal, A.; Parajuli, P.B.; Dash, P.; Ouyang, Y.; Linhoss, A. Sensitivity of hydrology and water quality to variation in land use and land cover data. Agric. Water Manag. 2020, 241, 106366. [Google Scholar] [CrossRef]
  12. West, L.; Feagley, S. The chemical composition of atmospheric deposition collected from six Louisiana sites from 1983 to 1992. Atmospheric Environ. 1995, 29, 1211–1217. [Google Scholar] [CrossRef]
  13. Howarth, R.W.; Sharpley, A.; Walker, D. Sources of nutrient pollution to coastal waters in the United States: Implications for achieving coastal water quality goals. Estuaries 2002, 25, 656–676. [Google Scholar] [CrossRef]
  14. Coulter, C.B.; Kolka, R.K.; Thompson, J.A. Water quality in agricultural, urban, and mixed land use watersheds. JAWRA J. Am. Water Resour. Assoc. 2004, 40, 1593–1601. [Google Scholar] [CrossRef]
  15. Ongley, E.D.; Xiaolan, Z.; Tao, Y. Current status of agricultural and rural non-point source Pollution assessment in China. Environ. Pollut. 2010, 158, 1159–1168. [Google Scholar] [CrossRef]
  16. Fuentealba, M.; Latorre, C.; Frugone-Álvarez, M.; Sarricolea, P.; Giralt, S.; Contreras-Lopez, M.; Prego, R.; Bernárdez, P.; Valero-Garcés, B. A combined approach to establishing the timing and magnitude of anthropogenic nutrient alteration in a mediterranean coastal lake- watershed system. Sci. Rep. 2020, 10, 1–13. [Google Scholar] [CrossRef] [Green Version]
  17. Gorgoglione, A.; Gregorio, J.; Ríos, A.; Alonso, J.; Chreties, C.; Fossati, M. Influence of Land Use/Land Cover on Surface-Water Quality of Santa Lucía River, Uruguay. Sustainability 2020, 12, 4692. [Google Scholar] [CrossRef]
  18. Song, F.; Su, F.; Zhu, D.; Li, L.; Li, H.; Sun, D. Evaluation and driving factors of sustainable development of the wetland ecosystem in Northeast China: An emergy approach. J. Clean. Prod. 2020, 248, 119236. [Google Scholar] [CrossRef]
  19. Bonansea, M.; Bazán, R.; Germán, A.; Ferral, A.; Beltramone, G.; Cossavella, A.; Pinotti, L. Assessing land use and land cover change in Los Molinos reservoir watershed and the effect on the reservoir water quality. J. S. Am. Earth Sci. 2021, 108, 103243. [Google Scholar] [CrossRef]
  20. Huang, W.; Mao, J.; Zhu, D.; Lin, C. Impacts of Land Use and Land Cover on Water Quality at Multiple Buffer-Zone Scales in a Lakeside City. Water 2019, 12, 47. [Google Scholar] [CrossRef] [Green Version]
  21. El-Alfy, M.A.; Darwish, D.; El-Amier, Y.A. Land use Land cover of the Burullus Lake shoreline (Egypt) and health risk assessment of metal-contaminated sediments. Hum. Ecol. Risk Assess. Int. J. 2021, 27, 898–920. [Google Scholar] [CrossRef]
  22. Seeboonruang, U. A statistical assessment of the impact of land uses on surface water quality indexes. J. Environ. Manag. 2012, 101, 134–142. [Google Scholar] [CrossRef]
  23. Padedda, B.M.; Sechi, N.; Lai, G.G.; Mariani, M.A.; Pulina, S.; Sarria, M.; Satta, C.T.; Virdis, T.; Buscarinu, P.; Lugliè, A. Consequences of eutrophication in the management of water resources in Mediterranean reservoirs: A case study of Lake Cedrino (Sardinia, Italy). Glob. Ecol. Conserv. 2017, 12, 21–35. [Google Scholar] [CrossRef]
  24. Le Moal, M.; Gascuel-Odoux, C.; Ménesguen, A.; Souchon, Y.; Étrillard, C.; Levain, A.; Moatar, F.; Pannard, A.; Souchu, P.; Lefebvre, A.; et al. Eutrophication: A new wine in an old bottle? Sci. Total Environ. 2018, 651, 1–11. [Google Scholar] [CrossRef] [Green Version]
  25. Rojas, C.; Munizaga, J.; Rojas, O.; Martínez, C.; Pino, J. Urban development versus wetland loss in a coastal Latin American city: Lessons for sustainable land use planning. Land Use Policy 2019, 80, 47–56. [Google Scholar] [CrossRef]
  26. Desta, H.; Fetene, A. Land-use and land-cover change in Lake Ziway watershed of the Ethiopian Central Rift Valley Region and its environmental impacts. Land Use Policy 2020, 96, 104682. [Google Scholar] [CrossRef]
  27. Guan, Q.; Feng, L.; Hou, X.; Schurgers, G.; Zheng, Y.; Tang, J. Eutrophication changes in fifty large lakes on the Yangtze Plain of China derived from MERIS and OLCI observations. Remote Sens. Environ. 2020, 246, 111890. [Google Scholar] [CrossRef]
  28. Paerl, H.W.; Paul, V.J. Climate change: Links to global expansion of harmful cyanobacteria. Water Res. 2012, 46, 1349–1363. [Google Scholar] [CrossRef]
  29. Du Plessis, A.; Harmse, T.; Ahmed, F. Quantifying and Predicting the Water Quality Associated with Land Cover Change: A Case Study of the Blesbok Spruit Catchment, South Africa. Water 2014, 6, 2946–2968. [Google Scholar] [CrossRef] [Green Version]
  30. Erle, E.; Robert, P. Land-use and land-cover change. In Encyclopedia of Earth Cutler J. Cleveland: Environmental Information Coalition; National Council for Science and the Environment: Washington, DC, USA, 2010. [Google Scholar]
  31. Tong, S.T.; Chen, W. Modeling the relationship between land use and surface water quality. J. Environ. Manag. 2002, 66, 377–393. [Google Scholar] [CrossRef] [PubMed]
  32. Guo, Q.; Ma, K.; Yang, L.; He, K. Testing a Dynamic Complex Hypothesis in the Analysis of Land Use Impact on Lake Water Quality. Water Resour. Manag. 2010, 24, 1313–1332. [Google Scholar] [CrossRef] [Green Version]
  33. Tu, J. Spatially varying relationships between land use and water quality across an urbanization gradient explored by geographically weighted regression. Appl. Geogr. 2011, 31, 376–392. [Google Scholar] [CrossRef]
  34. Junior, R.V.; Varandas, S.G.P.; Fernandes, L.S.; Pacheco, F.A. LGroundwater quality in rural watersheds with environmental land use conflicts. Sci. Total Environ. 2014, 493, 812–827. [Google Scholar]
  35. Pacheco, F.; Fernandes, L.F.S. Environmental land use conflicts in catchments: A major cause of amplified nitrate in river water. Sci. Total Environ. 2016, 548, 173–188. [Google Scholar] [CrossRef]
  36. Lintern, A.; Webb, J.A.; Ryu, D.; Liu, S.; Waters, D.; Leahy, P.; Bende-Michl, U.; Western, A.W. What Are the Key Catchment Characteristics Affecting Spatial Differences in Riverine Water Quality? Water Resour. Res. 2018, 54, 7252–7272. [Google Scholar] [CrossRef]
  37. Patterson, J.J.; Smith, C.; Bellamy, J. Understanding enabling capacities for managing the ‘wicked problem’ of nonpoint source water pollution in catchments: A conceptual framework. J. Environ. Manag. 2013, 128, 441–452. [Google Scholar] [CrossRef]
  38. Akasaka, M.; Takamura, N.; Mitsuhashi, H.; Kadono, Y. Effects of land use on aquatic macrophyte diversity and water quality of ponds. Freshw. Biol. 2010, 55, 909–922. [Google Scholar] [CrossRef]
  39. Lu, Y.; Song, S.; Wang, R.; Liu, Z.; Meng, J.; Sweetman, A.; Jenkins, A.; Ferrier, R.C.; Li, H.; Luo, W.; et al. Impacts of soil and water pollution on food safety and health risks in China. Environ. Int. 2015, 77, 5–15. [Google Scholar] [CrossRef] [PubMed] [Green Version]
  40. Bhagowati, B.; Ahamad, K. A review on lake eutrophication dynamics and recent developments in lake modeling. Ecohydrol. Hydrobiol. 2019, 19, 155–166. [Google Scholar] [CrossRef]
  41. Mendoza, R.; Silva, R.; Jiménez, A.; Rodríguez, K.; Sol, A. Lake Zirahuen, Michoacan, Mexico: An approach to sustainable water resource management based on the chemical and bacterial assessment of its water body. Sustain. Chem. Pharm. 2015, 2, 1–11. [Google Scholar] [CrossRef]
  42. Cai, H.; Mei, Y.; Chen, J.; Wu, Z.; Lan, L.; Zhu, D. An analysis of the relation between water pollution and economic growth in China by considering the contemporaneous correlation of water pollutants. J. Clean. Prod. 2020, 276, 122783. [Google Scholar] [CrossRef]
  43. Miranda, L.E.; Andrews, C.S.; Kröger, R. Connectedness of land use, nutrients, primary production, and fish assemblages in oxbow lakes. Aquat. Sci. 2014, 76, 41–50. [Google Scholar] [CrossRef]
  44. Jung, K.-W.; Lee, S.-W.; Hwang, H.-S.; Jang, J.-H. The effects of spatial variability of land use on stream water quality in a costal watershed. Paddy Water Environ. 2008, 6, 275–284. [Google Scholar] [CrossRef]
  45. Wilson, C.; Weng, Q. Assessing Surface Water Quality and Its Relation with Urban Land Cover Changes in the Lake Calumet Area, Greater Chicago. Environ. Manag. 2010, 45, 1096–1111. [Google Scholar] [CrossRef]
  46. Rimer, A.E.; Nissen, J.A.; Reynolds, D.E. Characterization and impact of stormwater runoff from various land cover types. J. Water Pollut. Control. Fed. 1978, 50, 252–264. [Google Scholar]
  47. Donohue, I.; McGarrigle, M.L.; Mills, P. Linking catchment characteristics and water chemistry with the ecological status of Irish rivers. Water Res. 2006, 40, 91–98. [Google Scholar] [CrossRef] [PubMed]
  48. Sun, R.; Chen, L.; Chen, W.; Ji, Y. Effect of Land-Use Patterns on Total Nitrogen Concentration in the Upstream Regions of the Haihe River Basin, China. Environ. Manag. 2013, 51, 45–58. [Google Scholar] [CrossRef]
  49. Bu, H.; Meng, W.; Zhang, Y.; Wan, J. Relationships between land use patterns and water quality in the Taizi River basin, China. Ecol. Indic. 2014, 41, 187–197. [Google Scholar] [CrossRef]
  50. Dekker, A.G. Detection of Optical Water Quality Parameters for Eutrophic Waters by High Resolution Remote Sensing. Ph.D. Thesis, Vrije University, Amsterdam, The Netherlands, 1993. [Google Scholar]
  51. Dustin, D.L.; Jacobson, P.C. Predicting the extent of lakeshore development using GIS datasets. Lake Reserv. Manag. 2015, 31, 169–179. [Google Scholar] [CrossRef]
  52. Thakur, J.K.; Srivastava, P.K.; Singh, S.K.; Vekerdy, Z. Ecological monitoring of wetlands in semi-arid region of Konya closed Basin, Turkey. Reg. Environ. Chang. 2012, 12, 133–144. [Google Scholar] [CrossRef]
  53. Huang, C.; Wang, X.; Yang, H.; Li, Y.; Wang, Y.; Chen, X.; Xu, L. Satellite data regarding the eutrophication response to human activities in the plateau lake Dianchi in China from 1974 to 2009. Sci. Total Environ. 2014, 485–486, 1–11. [Google Scholar] [CrossRef]
  54. Santos, C.; da Silva, R.M.; Silva, A.M.; Neto, R.M.B. Estimation of evapotranspiration for different land covers in a Brazilian semi-arid region: A case study of the Brígida River basin, Brazil. J. S. Am. Earth Sci. 2017, 74, 54–66. [Google Scholar] [CrossRef]
  55. Wei, W.; Gao, Y.; Huang, J.; Gao, J. Exploring the effect of basin land degradation on lake and reservoir water quality in China. J. Clean. Prod. 2020, 268, 122249. [Google Scholar] [CrossRef]
  56. Azhar, S.C.; Aris, A.Z.; Yusoff, M.K.; Ramli, M.F.; Juahir, H. Classification of River Water Quality Using Multivariate Analysis. Procedia Environ. Sci. 2015, 30, 79–84. [Google Scholar] [CrossRef] [Green Version]
  57. Kändler, M.; Blechinger, K.; Seidler, C.; Pavlů, V.; Sanda, M.; Dostál, T.; Krása, J.; Vitvar, T.; Štich, M. Impact of land use on water quality in the upper Nisa catchment in the Czech Republic and in Germany. Sci. Total Environ. 2017, 586, 1316–1325. [Google Scholar] [CrossRef]
  58. Duta, S.; Dwivedi, A.; Kumar, M.S. Use of water quality index and multivariate statistical techniques for the assessment of spatial variations in water quality of a small river. Environ. Monit. Assess. 2018, 190, 718. [Google Scholar] [CrossRef] [PubMed]
  59. Nepomuscene, N.J.; Jewitt, G.; Graham, M. Effects of land use and land cover changes on water quality in the uMngeni river catchment, South Africa. Phys. Chem. Earth Parts A/B/C 2018, 105, 247–264. [Google Scholar] [CrossRef]
  60. Chen, Q.; Mei, K.; Dahlgren, R.A.; Wang, T.; Gong, J.; Zhang, M. Impacts of land use and population density on seasonal surface water quality using a modified geographically weighted regression. Sci. Total Environ. 2016, 572, 450–466. [Google Scholar] [CrossRef] [PubMed] [Green Version]
  61. Kibena, J.; Nhapi, I.; Gumindoga, W. Assessing the relationship between water quality parameters and changes in landuse patterns in the Upper Manyame River, Zimbabwe. Phys. Chem. Earth Parts A/B/C 2014, 67, 153–163. [Google Scholar] [CrossRef]
  62. Teixeira, Z.; Teixeira, H.; Marques, J.C. Systematic processes of land use/land cover change to identify relevant driving forces: Implications on water quality. Sci. Total Environ. 2014, 470, 1320–1335. [Google Scholar] [CrossRef] [Green Version]
  63. Rajaei, F.; Sari, A.E.; Salmanmahiny, A.; Randhir, T.O.; Delavar, M.; Behrooz, R.D.; Bavani, A.M. Simulating long-term effect of Hyrcanian forest loss on phosphorus loading at the sub-watershed level. J. Arid. Land 2018, 10, 457–469. [Google Scholar] [CrossRef] [Green Version]
  64. Andama, M.; Ongom, R.; Lukubye, B. Proliferation of Salvinia molesta at Lake Kyoga Landing Sites as a Result of Anthropogenic Influences. J. Geosci. Environ. Prot. 2017, 5, 160–173. [Google Scholar]
  65. Uganda Bureau of Standards (UBoS). Population Estimates and Projections, Kampala Uganda. 2020. Available online: https://www.unbs.go.ug (accessed on 12 October 2021).
  66. Bi, W.; Weng, B.; Yuan, Z.; Ye, M.; Zhang, C.; Zhao, Y.; Yan, D.; Xu, T. Evolution Characteristics of Surface Water Quality Due to Climate Change and LUCC under Scenario Simulations: A Case Study in the Luanhe River Basin. Int. J. Environ. Res. Public Health 2018, 15, 1724. [Google Scholar] [CrossRef] [PubMed] [Green Version]
  67. Ogutu-Ohwayo, R.; Odongkara, K.; Okello, W.; Mbabazi, D.; Wandera, S.B.; Ndawula, L.M.; Natugonza, V. Variations and changes in habitat, productivity, composition of aquatic biota and fisheries of L. Kyoga system: Lessons for management. Afr. J. Aquat. Sci. 2013, 38 (Suppl. 1), 1–14. [Google Scholar] [CrossRef]
  68. Li, S.; Gu, S.; Liu, W.; Han, H.; Zhang, Q. Water quality in relation to land use and land cover in the upper Han River Basin, China. Catena 2008, 75, 216–222. [Google Scholar] [CrossRef]
  69. Huang, J.; Klemas, V. Using Remote Sensing of Land Cover Change in Coastal Watersheds to Predict Downstream Water Quality. J. Coast. Res. 2012, 28, 930–944. [Google Scholar] [CrossRef]
  70. Burgis, M.J.; Symoens, J.J. African Wetlands and Shallow Water Bodies = Zones Humides et Lacs Peu Profonds d’Afrique; ORSTOM: Paris, France, 1987; 650p, ISBN 2-7099-0881-6. ISSN 0371-6023. [Google Scholar]
  71. Mungoma, S. Horizontal differentiation in the limnology of a tropical river-lake (Lake Kyoga, Uganda). Hydrobiologia 1988, 162, 89–96. [Google Scholar] [CrossRef]
  72. Mbabazi, D.; Ogutu-Ohwayo, R.; Wandera, S.B.; Kiziito, Y. Fish species and trophic diversity of haplochromine cichlids in the Kyoga satellite lakes (Uganda). Afr. J. Ecol. 2004, 42, 59–68. [Google Scholar] [CrossRef]
  73. Mbabazi, D.; Makanga, B.; Orach-Meza, F.; Hecky, R.E.; Balirwa, J.; Ogutu-Ohwayo, R.; Verburg, P.; Chapman, L.; Muhumuza, E. Intra-lake stable isotope ratio variation in selected fish species and their possible carbon sources in Lake Kyoga (Uganda): Implications for aquatic food web studies. Afr. J. Ecol. 2010, 48, 667–675. [Google Scholar] [CrossRef]
  74. Byaruhanga, A. Important Bird Areas in Uganda; Nature Uganda, the East African Natural History Society: Kampala, Uganda, 2001. [Google Scholar]
  75. Ministry of Water and Environment (MWE). Catchment Management for Awoja Catchment; Ministry of Water and Environment (MWE): Kampala, Uganda, 2015.
  76. Ministry of Water and Environment. Mpologoma Catchment Management Plan; Ministry of Water and Environment: Kampala, Uganda, 2018.
  77. Camberlin, P. “Nile basin climates” in the Nile: Origin, Environments, Limnology and Human Use; Dumont, H.J., Ed.; Springer: Berlin, Germany, 2009; pp. 307–333. [Google Scholar]
  78. Nsubuga, F.W.; Olwoch, J.M.; Rautenbach, C.J.D.W. Climatic Trends at Namulonge in Uganda: 1947–2009. J. Geogr. Geol. 2011, 3, 119. [Google Scholar] [CrossRef]
  79. Yu, D.; Shi, P.; Liu, Y.; Xun, B. Detecting land use-water quality relationships from the viewpoint of ecological restoration in an urban area. Ecol. Eng. 2013, 53, 205–216. [Google Scholar] [CrossRef]
  80. Makwinja, R.; Kaunda, E.; Mengistou, S.; Alamirew, T. Impact of land use/land cover dynamics on ecosystem service value—A case from Lake Malombe, Southern Malawi. Environ. Monit. Assess. 2021, 193, 1–23. [Google Scholar] [CrossRef] [PubMed]
  81. APHA (American Public Health Association). Standards Methods for the Examination of Water and Wastewater, 21st ed.; American Public Health Association: Washington, DC, USA, 2005. [Google Scholar]
  82. Garaba, S.P.; Voß, D.; Zielinski, O. Physical, Bio-Optical State and Correlations in North–Western European Shelf Seas. Remote Sens. 2014, 6, 5042–5066. [Google Scholar] [CrossRef] [Green Version]
  83. FewsNet. FEWS NET Data Center. 2019. Available online: http://fews.net/fews-data/333 (accessed on 24 October 2021).
  84. Pratt, B.; Chang, H. Effects of land cover, topography, and built structure on seasonal water quality at multiple spatial scales. J. Hazard. Mater. 2012, 209, 48–58. [Google Scholar] [CrossRef] [PubMed]
  85. Nkwanda, I.S.; Feyisa, G.L.; Zewge, F.; Makwinja, R. Impact of land-use/land-cover dynamics on water quality in the Upper Lilongwe River basin, Malawi. Int. J. Energy Water Resour. 2021, 5, 193–204. [Google Scholar] [CrossRef]
  86. Bernstein, L.S.; Adler-Golden, S.M.; Jin, X.; Gregor, B.; Sundberg, R.L. Quick atmospheric correction (QUAC) code for VNIR-SWIR spectral imagery: Algorithm details. In Proceedings of the 2012 4th Workshop on Hyperspectral Image and Signal Processing: Evolution in Remote Sensing (WHISPERS), Shanghai, China, 4–7 June 2012; pp. 1–4. [Google Scholar]
  87. Li, M.; Zang, S.; Zhang, B.; Li, S.; Wu, C. A review of remote sensing image classification techniques: The role of spatio-contextual information. Eur. J. Remote Sens. 2014, 47, 389–411. [Google Scholar] [CrossRef]
  88. Mohd Hasmadi, I.; Kamaruzaman, J. Hyperspectral Imaging of Forest Resources: The Malaysian Experience. In Proceedings of the 4S Symposium Small Satellites Systems and Services, Rhodes, Greece, 26–30 May 2008; Volume 660, p. 41. [Google Scholar]
  89. Owojori, A.; Xie, H. Landsat image-based LULC changes of San Antonio, Texas using advanced atmospheric correction and object-oriented image analysis approaches. In Proceedings of the 5th International Symposium on Remote Sensing of Urban Areas, Tempe, AZ, USA, 14–16 March 2005. [Google Scholar]
  90. Congalton, R.G. A review of assessing the accuracy of classifications of remotely sensed data. Remote Sens. Environ. 1991, 37, 35–46. [Google Scholar] [CrossRef]
  91. Cohen, J. A Coefficient of Agreement for Nominal Scales. Educ. Psychol. Meas. 1960, 20, 37–46. [Google Scholar] [CrossRef]
  92. Lakewatch, F. Trophic State: A Water Body’s Ability to Support Plants Fish and Wildlife. Florida University, Department of Fisheries and Aquatic Sciences. 2004. Available online: http://lakewatch.ifas.ufl.edu (accessed on 6 November 2021).
  93. Hanh, P.T.M.; Sthiannopkao, S.; Ba, D.T.; Kim, K.-W. Development of Water Quality Indexes to Identify Pollutants in Vietnam’s Surface Water. J. Environ. Eng. 2011, 137, 273–283. [Google Scholar] [CrossRef]
  94. Usman, A.; Dube, K.; Shukla, S.P.; Salaskar, P.; Prakash, C.; Sawant, P.B.; Singh, R. Water quality index as a tool for assessment of status of an Urban Lake of Mumbai. Int. J. Curr. Microbiol. Appl. Sci. 2018, 7, 520–533. [Google Scholar] [CrossRef] [Green Version]
  95. Pradeep, V.; Deepika, C.; Urvi, G.; Hitesh, S. Water quality analysis of an organically polluted lake by investigating different physical and chemical parameters. Int. J. Res. Chem. Environ. 2012, 2, 105–111. [Google Scholar]
  96. Hansda, S.K.; Swain, K.K.; Vaidya, S.P.; Jagtap, R.S. Assessment of Water Quality Trends of Khadakwasla Reservoir Using CCME-WQI. In Environmental Pollution; Springer: Singapore, 2017; pp. 381–401. [Google Scholar]
  97. Tsegaye, T.; Sheppard, D.; Islam, K.; Tadesse, W.; Atalay, A.; Marzen, L. Development of Chemical Index as a Measure of In-Stream Water Quality in Response to Land-Use and Land Cover Changes. Water Air Soil Pollut. 2006, 174, 161–179. [Google Scholar] [CrossRef]
  98. WHO. Guidelines for Drinking-Water Quality, 4th ed.; World Health Organization: Geneva, Switzerland, 2011; pp. 303–304. [Google Scholar]
  99. The United States Environmental Protection Agency. Water Quality Criteria. 2002. In A Guide to Tropical Freshwater Zooplankton Identification, Ecology and Impact on Fisheries. Leiden (The Netherlands); Fernando, C., Ed.; Backhuys Publishers: Washington, DC, USA, 2020. [Google Scholar]
  100. Pesce, S.F.; Wunderlin, D.A. Use of water quality indices to verify the impact of Córdoba City (Argentina) on Suquía River. Water Res. 2000, 34, 2915–2926. [Google Scholar] [CrossRef]
  101. Mishra, P.C.; Patel, R.K. Study of the pollution load in the drinking water of Rairangpur, a small tribal dominated town of North Orissa. Indian J. Environ. Ecoplan. 2001, 5, 293–298. [Google Scholar]
  102. Fataei, E.; Seyyedsharifi, A.; Seiiedsafaviyan, T.; Nasrollahzadeh, S. Water quality assessment based on WQI and CWQI Indexes in Balikhlou River, Iran. J. Basic Appl. Sci. Res. 2013, 3, 263–269. [Google Scholar]
  103. United Nations. ECE Standard Statistical Classification of Surface Freshwater Quality for the Maintenance of Aquatic Life; United Nations: Geneva, Switzerland, 1992. [Google Scholar]
  104. Guzha, A.; Rufino, M.; Okoth, S.; Jacobs, S.; Nobrega, R. Impacts of land use and land cover change on surface runoff, discharge and low flows: Evidence from East Africa. J. Hydrol. Reg. Stud. 2018, 15, 49–67. [Google Scholar] [CrossRef]
  105. Fatumah, N.; Tilahun, S.A.; Mohammed, S. Effect of tillage systems and tillage direction on soil hydrological properties and soil suspended particle concentration in arable land in Uganda. Heliyon 2020, 6, e05616. [Google Scholar] [CrossRef] [PubMed]
  106. Obubu, J.P.; Mengistou, S.; Fetahi, T.; Alamirew, T.; Odong, R.; Ekwacu, S. Recent Climate Change in the Lake Kyoga Basin, Uganda: An Analysis Using Short-Term and Long-Term Data with Standardized Precipitation and Anomaly Indexes. Climate 2021, 9, 179. [Google Scholar] [CrossRef]
  107. Azanga, O.E. Land-use and land cover, sediment and nutrient hotspot areas changes in Lake Tanganyika Basin. Afr. J. Rural Dev. 2016, 1, 75. [Google Scholar]
  108. Göransson, G.; Larson, M.; Bendz, D. Variation in turbidity with precipitation and flow in a regulated river system–river Göta Älv, SW Sweden. Hydrol. Earth Syst. Sci. 2013, 17, 2529–2542. [Google Scholar] [CrossRef] [Green Version]
  109. Hughes, A.O.; Quinn, J.M.; McKergow, L.A. Land use influences on suspended sediment yields and event sediment dynamics within two headwater catchments, Waikato, New Zealand. N. Z. J. Mar. Freshw. Res. 2012, 46, 315–333. [Google Scholar] [CrossRef] [Green Version]
  110. Degife, A.; Worku, H.; Gizaw, S.; Legesse, A. Land use land cover dynamics, its drivers and environmental implications in Lake Hawassa Watershed of Ethiopia. Remote Sens. Appl. Soc. Environ. 2019, 14, 178–190. [Google Scholar] [CrossRef]
  111. Wan, R.; Cai, S.; Li, H.; Yang, G.; Li, Z.; Nie, X. Inferring land use and land cover impact on stream water quality using a Bayesian hierarchical modeling approach in the Xitiaoxi River Watershed, China. J. Environ. Manag. 2014, 133, 1–11. [Google Scholar] [CrossRef]
  112. Dai, X.; Zhou, Y.; Ma, W.; Zhou, L. Influence of spatial variation in land-use patterns and topography on water quality of the rivers inflowing to Fuxian Lake, a large deep lake in the plateau of southwestern China. Ecol. Eng. 2017, 99, 417–428. [Google Scholar] [CrossRef]
  113. Kröger, R.; Cooper, C.M.; Moore, M.T. A preliminary hydrological investigation into an innovative controlled drainage strategy in surface drainage ditches: Low grade weirs. Agric. Water Manag. 2008, 95, 678–687. [Google Scholar] [CrossRef]
  114. Luyiga, S.; Haande, S.; Semyalo, R.P.; Kizito, Y.S.; Miyingo-Kezimbira, A.; Brettum, P.; Solheim, A.L.; Odong, R.; Asio, S.M.; Jensen, K.H.; et al. How water exchange and seasonality affect the eutrophication of Murchison Bay, Lake Victoria. Limnologica 2015, 53, 60–73. [Google Scholar] [CrossRef]
  115. Wetzel, R.G. Limnology: Lake and River Ecosystems; Gulf Professional Publishing: Houston, TX, USA, 2001. [Google Scholar]
  116. Pullanikkatil, D.; Palamuleni, L.; Ruhiiga, T. Assessment of land use change in Likangala River catchment, Malawi: A remote sensing and DPSIR approach. Appl. Geogr. 2016, 71, 9–23. [Google Scholar] [CrossRef]
  117. Makwinja, R.; Kosamu, I.B.M.; Kaonga, C.C. Determinants and Values of Willingness to Pay for Water Quality Improvement: Insights from Chia Lagoon, Malawi. Sustainability 2019, 11, 4690. [Google Scholar] [CrossRef] [Green Version]
  118. Ministry of Water and Environment (MWE). Water and Environment Sector Performance Report, Kampala Uganda. 2020. Available online: https://www.mwe.go.ug (accessed on 5 September 2021).
  119. Chapman, L.J.; Balirwa, J.S.; Bugenyi, F.W.B.; Chapman, C.; Crisman, T.L. Wetlands of East Africa: Biodiversity, exploitation and policy perspectives. In Biodiversity in Wetlands: Assessment, Function and Conservation; Gopal, B., Junk, W.J., Davis, J.A., Eds.; Backhuys Publishers: Leiden, The Netherlands, 2001; pp. 101–131. [Google Scholar]
  120. Fuhrimann, S.; Stalder, M.; Winkler, M.S.; Niwagaba, C.B.; Babu, M.; Masaba, G.; Kabatereine, N.B.; Halage, A.A.; Schneeberger, P.; Utzinger, J.; et al. Microbial and chemical contamination of water, sediment and soil in the Nakivubo wetland area in Kampala, Uganda. Environ. Monit. Assess. 2015, 187, 1–15. [Google Scholar] [CrossRef] [PubMed] [Green Version]
  121. Kyambadde, J.; Kansiime, F.; Gumaelius, L.; Dalhammar, G. A comparative study of Cyperus papyrus and Miscanthidium violaceum-based constructed wetlands for wastewater treatment in a tropical climate. Water Res. 2004, 38, 475–485. [Google Scholar] [CrossRef] [PubMed]
  122. Van Dam, A.A.; Kipkemboi, J.; Mazvimavi, D.; Irvine, K. A synthesis of past, current and future research for protection and management of papyrus (Cyperus papyrus L.) wetlands in Africa. Wetl. Ecol. Manag. 2014, 22, 99–114. [Google Scholar] [CrossRef] [Green Version]
  123. Were, D.; Kansiime, F.; Fetahi, T.; Hein, T. A natural tropical freshwater wetland is a better climate change mitigation option through soil organic carbon storage compared to a rice paddy wetland. SN Appl. Sci. 2020, 2, 1–13. [Google Scholar] [CrossRef]
  124. Huang, J.; Zhan, J.; Yan, H.; Wu, F.; Deng, X. Evaluation of the Impacts of Land Use on Water Quality: A Case Study in The Chaohu Lake Basin. Sci. World J. 2013, 2013, 1–7. [Google Scholar] [CrossRef] [Green Version]
  125. Corbett, C.W.; Wahl, M.; Porter, D.E.; Edwards, D.; Moise, C. Nonpoint source runoff modeling A comparison of a forested watershed and an urban watershed on the South Carolina coast. J. Exp. Mar. Biol. Ecol. 1997, 213, 133–149. [Google Scholar] [CrossRef]
  126. Mallin, M.A.; McIver, M.R. Pollutant impacts to Cape Hatteras National Seashore from urban runoff and septic leachate. Mar. Pollut. Bull. 2012, 64, 1356–1366. [Google Scholar] [CrossRef] [PubMed]
  127. Shi, P.; Zhang, Y.; Li, Z.; Li, P.; Xu, G. Influence of land use and land cover patterns on seasonal water quality at multi-spatial scales. Catena 2017, 151, 182–190. [Google Scholar] [CrossRef]
  128. Elias, E.; Seifu, W.; Tesfaye, B.; Girmay, W. Impact of land use/cover changes on lake ecosystem of Ethiopian central rift valley. Cogent Food Agric. 2019, 5, 159587. [Google Scholar]
  129. Tahiru, A.A.; Doke, D.A.; Baatuuwie, B.N. Effect of land use and land cover changes on water quality in the Nawuni Catchment of the White Volta Basin, Northern Region, Ghana. Appl. Water Sci. 2020, 10, 1–14. [Google Scholar] [CrossRef]
  130. Dubois, N.; Saulnier-Talbot, É.; Mills, K.; Gell, P.; Battarbee, R.; Bennion, H.; Chawchai, S.; Dong, X.; Francus, P.; Flower, R.; et al. First human impacts and responses of aquatic systems: A review of palaeolimnological records from around the world. Anthr. Rev. 2018, 5, 28–68. [Google Scholar] [CrossRef]
  131. Paerl, H.; Havens, K.E.; Xu, H.; Zhu, G.; McCarthy, M.J.; Newell, S.E.; Scott, J.T.; Hall, N.S.; Otten, T.G.; Qin, B. Mitigating eutrophication and toxic cyanobacterial blooms in large lakes: The evolution of a dual nutrient (N and P) reduction paradigm. Hydrobiologia 2020, 847, 4359–4375. [Google Scholar] [CrossRef]
  132. Diatta, J.; Waraczewska, Z.; Grzebisz, W.; Niewiadomska, A.; Tatuśko-Krygier, N. Eutrophication Induction Via N/P and P/N Ratios Under Controlled Conditions—Effects of Temperature and Water Sources. Water Air Soil Pollut. 2020, 231, 1–18. [Google Scholar] [CrossRef] [Green Version]
  133. Moser, K.A.; Baron, J.S.; Brahney, J.; Oleksy, I.A.; Saros, J.E.; Hundey, E.J.; Sadro, S.A.; Kopáček, J.; Sommaruga, R.; Kainz, M.J.; et al. Mountain lakes: Eyes on global environmental change. Glob. Planet. Change 2019, 178, 77–95. [Google Scholar] [CrossRef] [Green Version]
  134. Ministry of Agriculture, Animal Industry and Fisheries (MAAIF). Statement on the Fish Kills in Lakes Victoria and Kyoga, Kampala, Uganda. Available online: https://www.nema.go.ug2021; (accessed on 10 October 2021).
  135. Ochumba, P.B. Massive fich kills within the Nyanza Gulf of Lake Victoria, Kenya. Hydrobiologia 1990, 208, 93–99. [Google Scholar] [CrossRef]
  136. Njiru, M.; Nyamweya, C.; Gichuki, J.; Mugidde, R.; Mkumbo, O.; Witte, F. Increase in Anoxia in Lake Victoria and Its Effects on the Fishery; Padilla, P., Ed.; In Tech: Rijeka, Croati, 2012; pp. 99–128. ISBN 978-953-307-664-5. [Google Scholar] [CrossRef] [Green Version]
  137. Scheffer, M.; van Nes, E.H. Shallow lakes theory revisited: Various alternative regimes driven by climate, nutrients, depth and lake size. In Shallow Lakes in a Changing World; Springer: Dordrecht, The Netherlands, 2007; pp. 455–466. [Google Scholar]
  138. Noges, T.; Järvet, A.; Kisand, A.; Laugaste, R.; Loigu, E.; Skakalski, B.; Noges, P. Reaction of large and shallow lakes Peipsi and Võrtsjärv to the changes of nutrient loading. In Shallow Lakes in a Changing World; Springer: Dordrecht, The Netherlands, 2007; pp. 253–264. [Google Scholar]
  139. Koutika, L.S.; Rainey, H.J. A review of the invasive, biological and beneficial characteristics of aquatic species Eichhornia Crassipes and Salvinia molesta. Appl. Ecol. Environ. Res. 2015, 13, 85–97. [Google Scholar]
  140. Chapman, D.; Coetzee, J.; Hill, M.; Hussner, A.; Netherlands, M.; Newman, J.; Tanner, R. Salvinia molesta DS Mitch. EPPO Bull. 2017, 47, 531–536. [Google Scholar] [CrossRef] [Green Version]
  141. Jakobsen, H.H.; Blanda, E.; Staehr, P.A.; Højgård, J.K.; Rayner, T.A.; Pedersen, M.F.; Jepsen, P.M.; Hansen, B.W. Development of phytoplankton communities: Implications of nutrient injections on phytoplankton composition, pH and ecosystem production. J. Exp. Mar. Biol. Ecol. 2015, 473, 81–89. [Google Scholar] [CrossRef]
  142. Stockwell, J.D.; Doubek, J.P.; Adrian, R.; Anneville, O.; Carey, C.C.; Carvalho, L.; De Senerpont Domis, L.; Dur, G.; Frass, M.A.; Wilson, H.L. Storm impacts on phytoplankton community dynamics in lakes. Glob. Change Biol. 2020, 26, 2756–2784. [Google Scholar] [CrossRef] [Green Version]
  143. Jones, J.R.; Hoyer, M.V. Sportfish Harvest Predicted by Summer Chlorophyll-α Concentration in Midwestern Lakes and Reservoirs. Trans. Am. Fish. Soc. 1982, 111, 176–179. [Google Scholar] [CrossRef]
  144. Heino, J.; Muotka, T. Landscape Position, Local Environmental Factors, and the Structure of Molluscan Assemblages of Lakes. Landsc. Ecol. 2006, 21, 499–507. [Google Scholar] [CrossRef]
  145. Lintern, A.; McPhillips, L.E.; Winfrey, B.K.; Duncan, J.; Grady, C. Best Management Practices for Diffuse Nutrient Pollution: Wicked Problems Across Urban and Agricultural Watersheds. Environ. Sci. Technol. 2020, 54, 9159–9174. [Google Scholar] [CrossRef] [PubMed]
  146. Jensen, H.S.; Andersen, F.O. Importance of temperature, nitrate, and pH for phosphate release from aerobic sediments of four shallow, eutrophic lakes. Limnol. Oceanogr. 1992, 37, 577–589. [Google Scholar] [CrossRef]
  147. Lacoul, P.; Freedman, B. Environmental influences on aquatic plants in freshwater ecosystems. Environ. Rev. 2006, 14, 89–136. [Google Scholar] [CrossRef]
  148. Welde, K.; Gebremariam, B. Effect of land use land cover dynamics on hydrological response of watershed: Case study of Tekeze Dam watershed, northern Ethiopia. Int. Soil Water Conserv. Res. 2017, 5, 1–16. [Google Scholar] [CrossRef]
  149. Ding, J.; Jiang, Y.; Liu, Q.; Hou, Z.; Liao, J.; Fu, L.; Peng, Q. Influences of the land use pattern on water quality in low-order streams of the Dongjiang River basin, China: A multi-scale analysis. Sci. Total Environ. 2016, 551, 205–216. [Google Scholar] [CrossRef]
  150. Bakure, B.Z.; Fikadu, S.; Malu, A. Analysis of physicochemical water quality parameters for streams under agricultural, urban and forest land-use types: In the case of gilgel Gibe catchment, Southwest Ethiopia. Appl. Water Sci. 2020, 10, 1–8. [Google Scholar] [CrossRef]
  151. Chemura, A.; Rwasoka, D.; Mutanga, O.; Dube, T.; Mushore, T. The impact of land-use/land cover changes on water balance of the heterogeneous Buzi sub-catchment, Zimbabwe. Remote Sens. Appl. Soc. Environ. 2020, 18, 100292. [Google Scholar] [CrossRef]
  152. Lawniczak, A.E.; Zbierska, J.; Nowak, B.; Achtenberg, K.; Grześkowiak, A.; Kanas, K. Impact of agriculture and land use on nitrate contamination in groundwater and running waters in central-west Poland. Environ. Monit. Assess. 2016, 188, 1–17. [Google Scholar] [CrossRef] [PubMed] [Green Version]
  153. Mello, K.; Valente, R.A.; Randhir, T.O.; dos Santos, A.C.A.; Vettorazzi, C.A. Effects of land use and land cover on water quality of low-order streams in Southeastern Brazil: Watershed versus riparian zone. Catena 2018, 167, 130–138. [Google Scholar] [CrossRef]
  154. Amiri, B.J.; Nakane, K. Modeling the Linkage Between River Water Quality and Landscape Metrics in the Chugoku District of Japan. Water Resour. Manag. 2009, 23, 931–956. [Google Scholar] [CrossRef]
  155. Wang, J.; Da, L.; Song, K.; Li, B.-L. Temporal variations of surface water quality in urban, suburban and rural areas during rapid urbanization in Shanghai, China. Environ. Pollut. 2008, 152, 387–393. [Google Scholar] [CrossRef]
  156. Mcmahon, G.; Harned, D.A. Effect of Environmental Setting on Sediment, Nitrogen, and Phosphorus Concentrations in Albemarle-Pamlico Drainage Basin, North Carolina and Virginia, USA. Environ. Manag. 1998, 22, 887–903. [Google Scholar] [CrossRef] [PubMed]
Figure 1. Geographical location of the study area.
Sustainability 14 00372 g001
Figure 2. Sampling sites in the eastern arm of L. Kyoga.
Sustainability 14 00372 g002
Figure 3. Conceptual framework of the relationship between LULC change and water quality.
Sustainability 14 00372 g003
Figure 4. Variations in nutrient concentrations over the study period.
Sustainability 14 00372 g004
Figure 5. Concentrations of BOD, TN, Temp, and Chl-a over the study period.
Sustainability 14 00372 g005
Figure 6. Variations in concentrations of DO, Turb, SRSi, TSS, and pH over the study period.
Sustainability 14 00372 g006
Figure 7. LULC changes over the study area.
Sustainability 14 00372 g007
Figure 8. LULC changes in the L. Kyoga eastern basin.
Sustainability 14 00372 g008
Figure 9. LULC gains and losses over the study period (2000−2020).
Sustainability 14 00372 g009
Figure 10. Net LULC change gains and losses over the study area in two decades (2000−2020).
Sustainability 14 00372 g010
Table 1. Properties of the images acquired for LULC analysis.
ImagePath/RowPeriod of AcquisitionPercent Cloud Cover
Landsat 7170,171, 172/59&60May 20003%
Landsat 5170,171, 172/59&60July, 20105%
Landsat 8170,171, 172/59&60June, 20206%
Table 2. Descriptive statistics (mean, max, min, and standard deviation), n = 5 for parameters.
Year200020102020
ParameterMeanMaxMinStdevMeanMaxMinStdevMean MaxMinStdev
EC (µS/cm)24527022714.77925628622620.653204218152.189
pH [H+]7.68.17.20.2877.68.56.50.5158.29.90.30.169
DO (mg/L)8.09.86.61.0727.38.655.70.9416.08.810.90.621
Temp (°C)26.82825.80.57627.228.725.80.95627.730.40.60.185
Turb (NTU)6.810.33.61.82810.214.46.12.1758.913.31.80.685
PO4 (mg/L)0.0190.0260.0140.0030.0230.0580.0090.0160.0360.2100.0030.012
TP (mg/L)0.0490.0840.0270.0140.0770.1110.0540.0190.1920.9300.0140.042
NO3 (mg/L)0.0480.1100.0170.0270.0630.1070.0220.0280.1100.4500.0170.026
TN (mg/L)1.0031.3000.7000.1761.2621.7000.7290.2691.7282.9300.1760.089
NH4 (mg/L)0.0240.0420.0120.0080.0310.0600.0180.0110.1120.7800.0080.047
BOD5 (mg/L)1.72.50.90.3822.84.81.30.8883.719.30.41.197
SRSi (mg/L)10.113.28.51.212.014.99.01.721.631.01.21.229
TSS (mg/L)2.63.71.80.6473.85.52.60.8047.122.00.60.938
Chl-a (µg/L)18.523.514.42.53422.535.89.66.93135.292.32.54.386
Table 3. Description of LULC categories.
Land Cover Descriptions
ShrublandInclude areas with small closed or scattered trees
GrasslandThis category includes pastures, savanna vegetation, grazing lands, bare lands, rocks, and unmanaged areas that are not covered by any of the categories.
AgricultureCultivated and cultivable land with crops, animals, and also agroforestry areas that do not qualify as forest lands
Urban/built-upThis includes an area used for settlements, permanent concentration buildings, and artificial structures, such as transport infrastructure and activities, ranging from large villages to town scale
Water bodies Areas of catchment covered with large volumes of water, such as lakes, rivers, and reservoirs
ForestsAreas with herbaceous layer, broad-leaved deciduous trees, closed and vegetative cover with abiotic and biotic forces of its biotope
Wetlands Are areas where water covers the soil or is present either at or near the surface of the soil all year or for varying periods during the year with vegetation
Woodland Areas of the catchment with more than 0.5 hectares with trees higher than 5 m and a canopy cover of 5–10 percent, sometimes with the cover of shrubs, bushes, and grasses. Tree plantations and woodlots are part of woodlands
Table 4. Distribution of LULC change classes by Area and Percentage.
Class TypeAREA (Km2)
200020102020Over all change
LULC ClassArea, km2 %Area, km2 %Area, km2 %Area, km2 2000–2020%
Shrubland17726.2299010.4301010.4+1238+4.3
Grassland568019.7307310.7319211.1−2488−8.6
Agriculture11,52440.013,20445.813,23045.9+1706+5.9
Urban/built-up1080.42100.72080.7+100+0.3
Water bodies24078.422827.922227.7−185−0.6
Wetlands18706.518946.617105.9−161−0.6
Forests333511.6512417.813864.8−1949−6.8
Woodland21177.3360.1385513.4+1738+6.0
Total28,81310028,81310028,813100
Table 5. Accuracy and Kappa coefficient results.
YearOverall AccuracyKappa Coefficient (%)
200087.4173
201095.5782
202091.8978
Table 6. Pearson correlation results for LULC change and water quality parameters change, n = 3.
Water QualityShrublandGrasslandAgricultureUrban/Built-upWaterbodiesWetlandsForestsWoodland
EC (µs/cm)−0.3030.265−0.317−0.3030.5550.997 *0.961−0.937
pH 0.500−0.4660.5130.500−0.721−0.991 *−0.8790.841
DO (mg/L)−0.7680.742−0.777−0.7680.9150.8850.661−0.603
Temp (°C)0.832−0.8100.8400.832−0.953−0.830−0.5760.514
Turb (NTU)0.925−0.9400.9200.925−0.784−0.0030.354−0.423
PO4 (mg/L)0.682−0.6530.6930.682−0.858−0.936−0.7490.698
TP (mg/L)0.866−0.8460.8730.866−0.971−0.792−0.5230.458
NO3 (mg/L)0.998 **−0.999 *0.999 **0.997 **−0.961−0.381−0.027−0.048
TN (mg/L)0.822−0.7990.8300.822−0.948−0.840−0.5910.530
NH4 (mg/L)0.500−0.4660.5130.500−0.721−0.991 *−0.8790.841
BOD5 (mg/L)0.893−0.8750.9000.893−0.983−0.756−0.4730.406
SRSi (mg/L)0.627−0.5960.6390.627−0.819−0.959−0.7950.748
TSS (mg/L)0.706−0.6780.7170.706−0.875−0.924−0.7270.674
Chl-a (µg/L)0.685−0.6560.6960.685−0.860−0.935−0.7460.695
* Correlation is significant at the 0.05 level (2-tailed); ** Correlation is significant at the 0.01 level (2-tailed).
Table 7. Trophic water quality status of L. Kyoga.
Year200020102020Trophic States
ParameterMeanMeanMeanOligotrophicMesotrophicEutrophicHypereutrophicL. Kyoga Trophic state
Chl-a (µg/L)18.522.535.2<33.0–7.07.0–40.0>40Eutrophic (2000–2020)
TP (mg/L)0.0490.0770.192<0.0150.015–0.0250.025–0.10>0.1Eutrophic (2000–2010) Hypereutrophic (2020)
TN (mg/L)1.0031.2621.728<0.40.4–0.60.6–1.5>1.5Eutrophic (2000–2010) hypereutrophic (2020)
Sechi depth (m)1.10.90.9>3.962.44–3.960.9–2.44<0.9Eutrophic (2000–2020)
Table 8. Water quality status indices.
Years200020102020
ParameterMeanRangeMeanRangeMeanRangeWQIReferences
EC (µS/cm)245227–270256226–286204173–2182250[93,94]
pH [H+]7.67.2–8.17.66.5–858.26.9–9.96.5–8.5[95,96]
DO (mg/L)8.06.6–9.87.35.7–8.76.00.67–8.81>6.0 [97]
Temp (°C)26.825.8–2827.225.8–28.727.725.6–30.430[98]
Turb (NTU)6.83.6–10.310.26.1–14.48.91.01–13.3<5[98]
PO4 (mg/L)0.0190.014–0.0260.0230.009–0.0580.0360.001–0.210.025[99]
TP (mg/L)0.0490.027–0.0840.0770.054–0.1110.1920.05–0.93
NO3 (mg/L)0.0480.017–0.1100.0630.022–0.1070.1100.02–0.4520[100,101]
TN (mg/L)1.0030.700–1.3001.2620.729–1.7001.7280.89–2.93
NH4 (mg/L)0.0240.012–0.0420.0310.018–0.0600.1120.001–0.78
BOD (mg/L)1.70.9–2.52.81.3–4.83.70.7–19.3<2[93,94,102]
SRSi (mg/L)10.18.5–13.212.08.9–14921.613–31
TSS (mg/L)2.61.8–3.73.82.6–5.57.11.0–22
Chl-a (µg/L)18.514.4–23.522.59.6–35.835.28.4–92.3<4.0[103]
Publisher’s Note: MDPI stays neutral with regard to jurisdictional claims in published maps and institutional affiliations.

