
Challenge of Using Groundwater for Buildings Air Conditioning in Subtropical Areas


Abstract
:1. Introduction
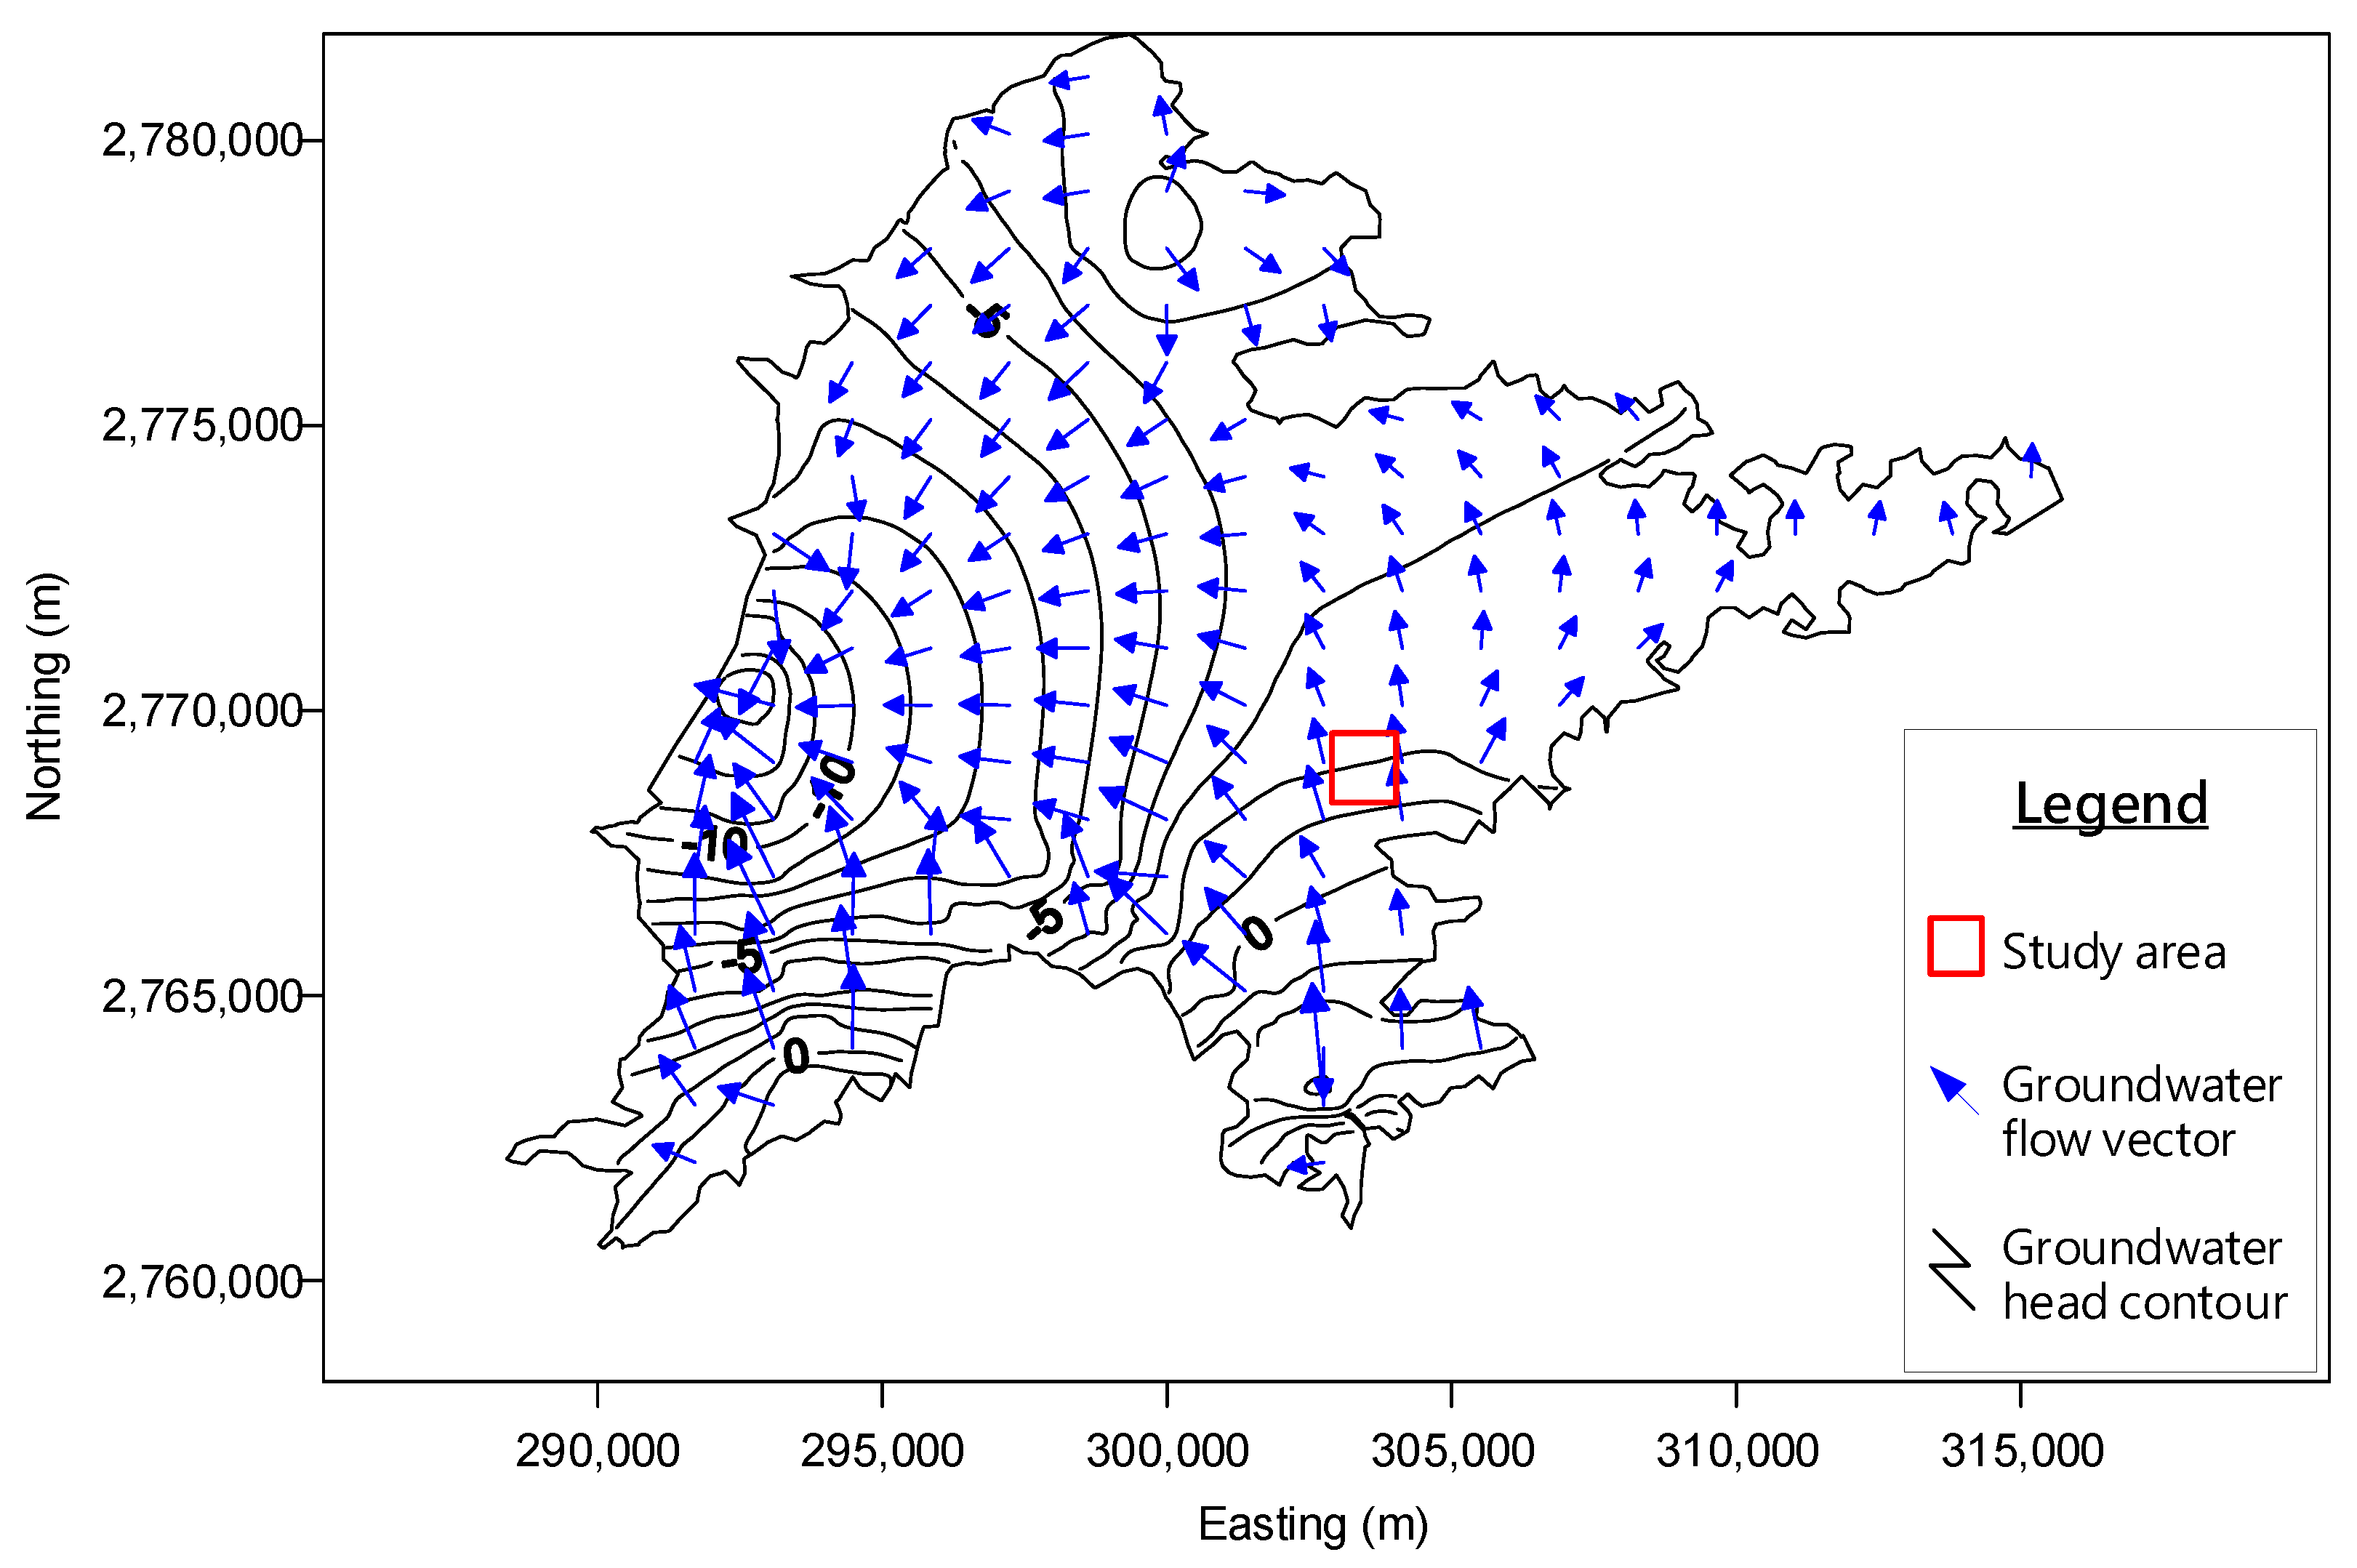
2. Groundwater of Taipei Basin
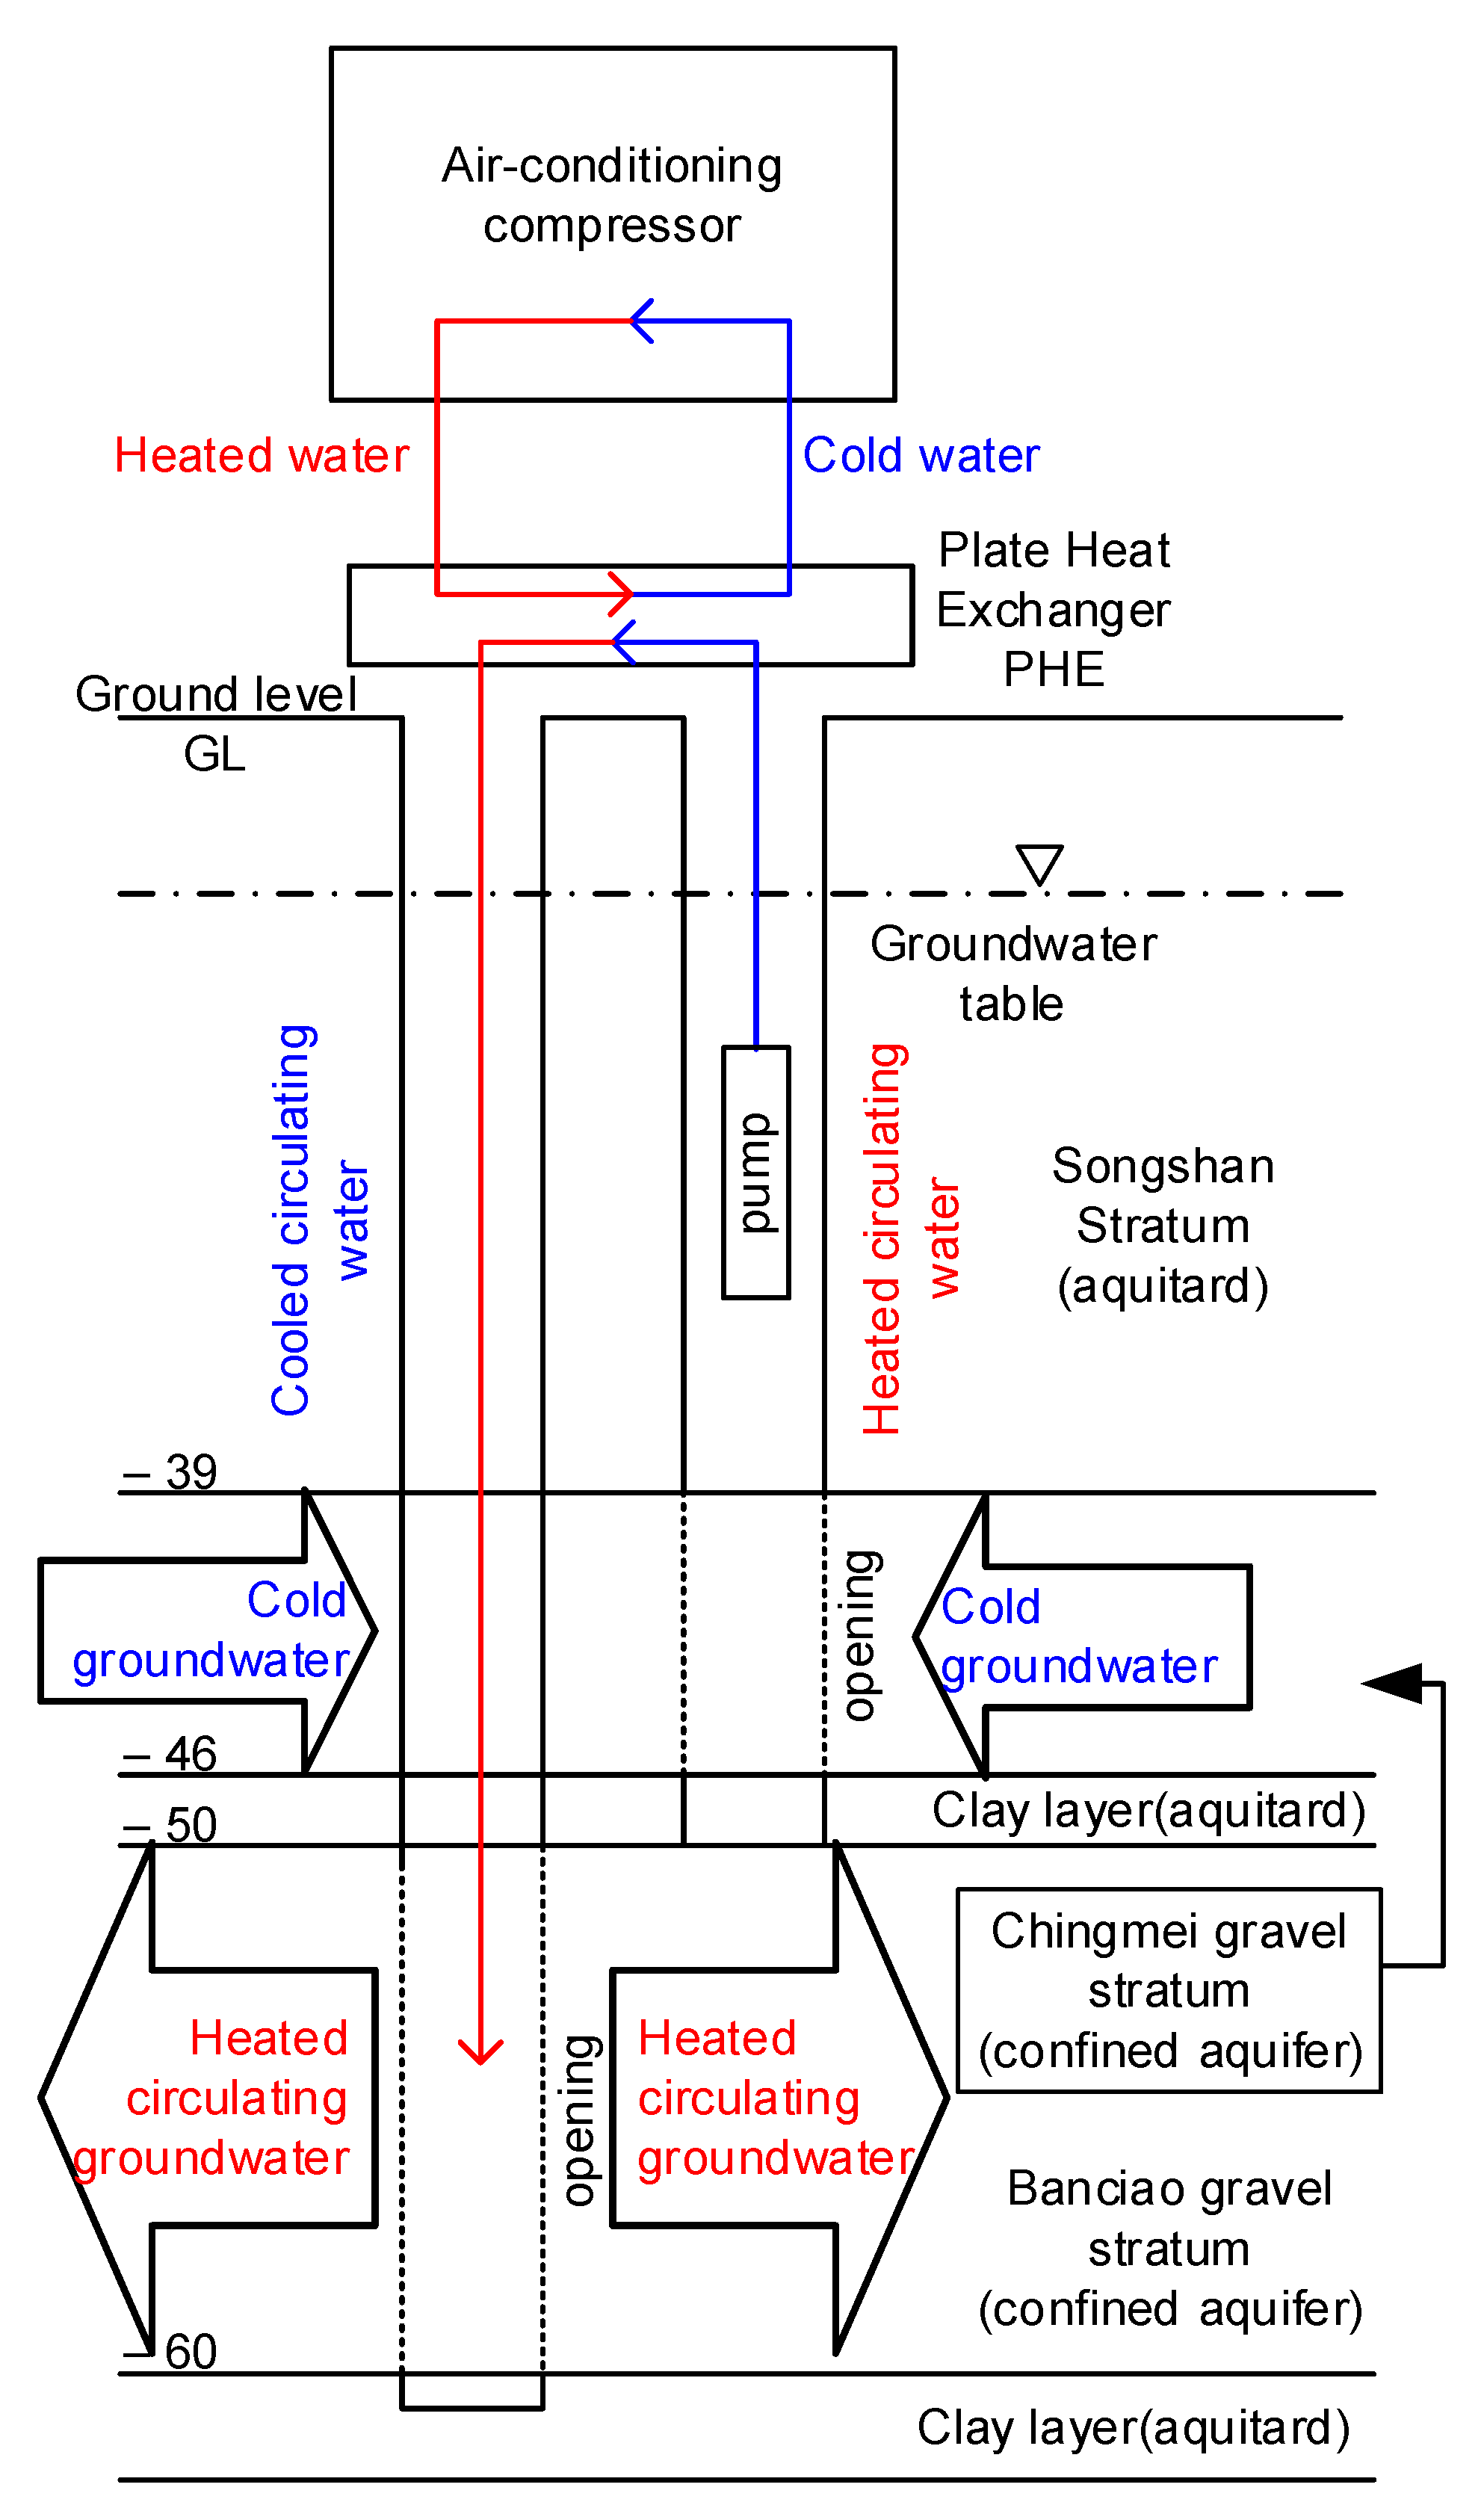
3. Experimental System and Arrangement
4. Experimental Results
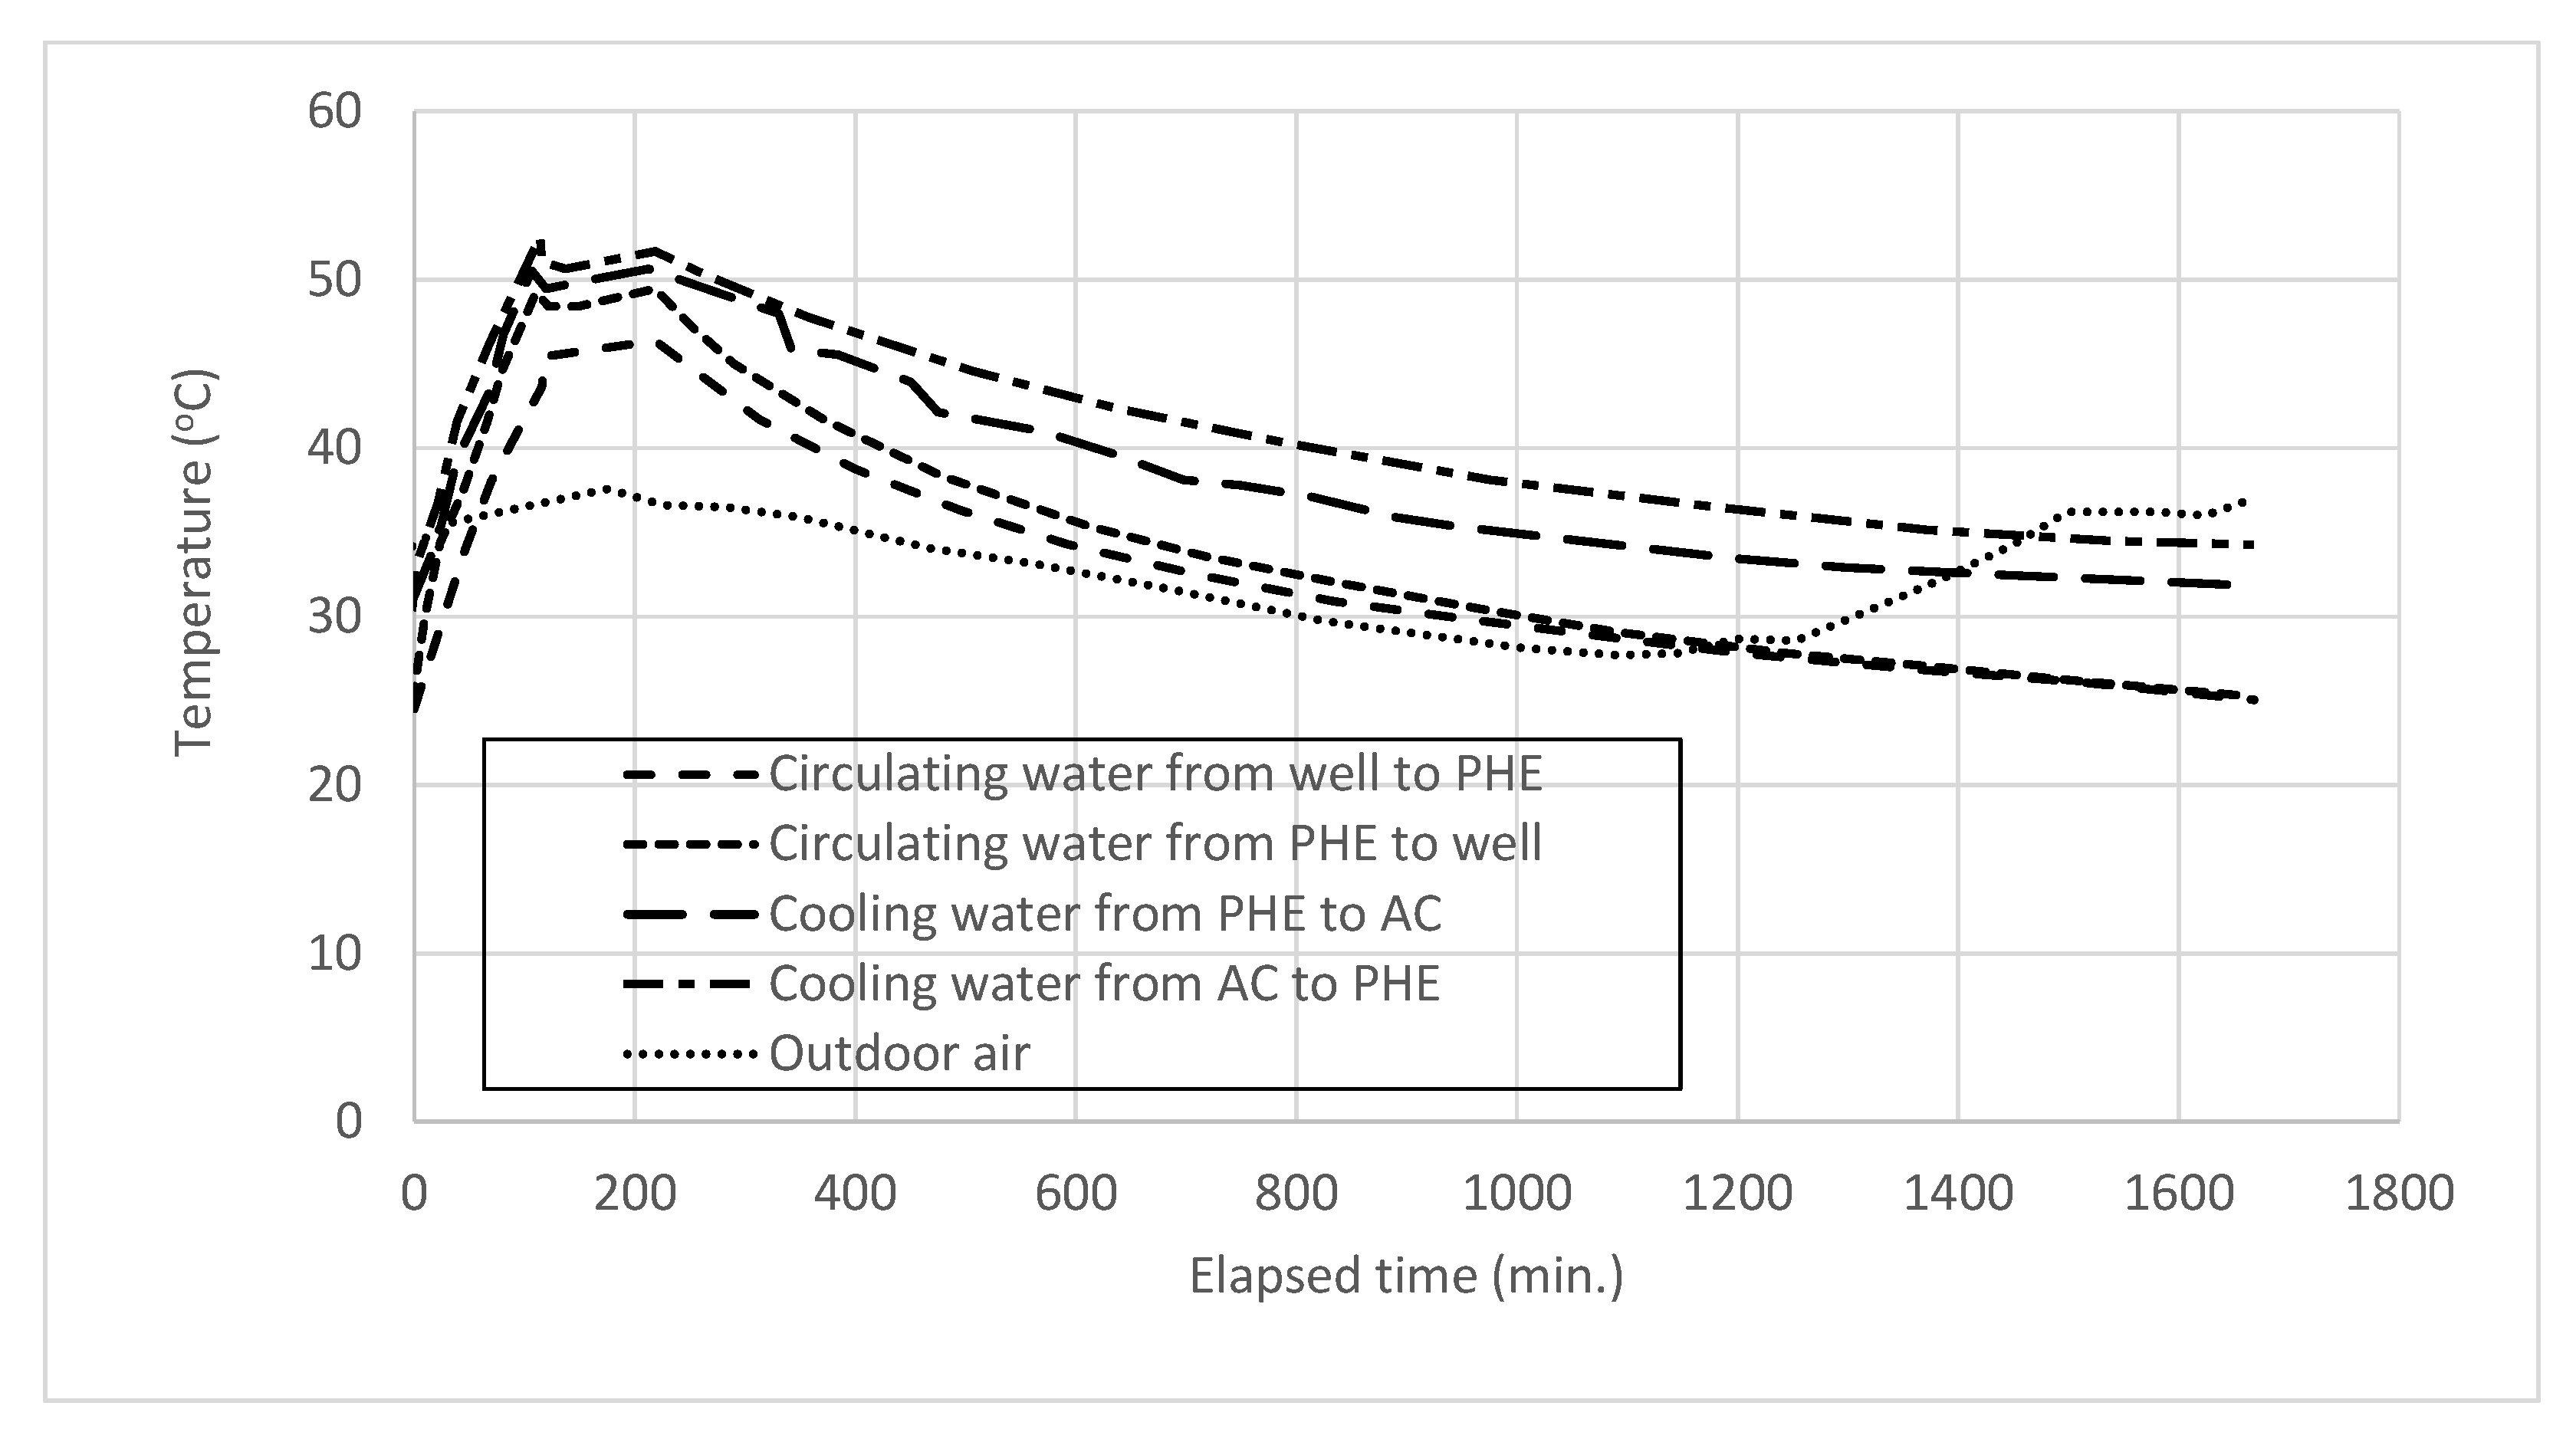
4.1. Closed Circulating Water System
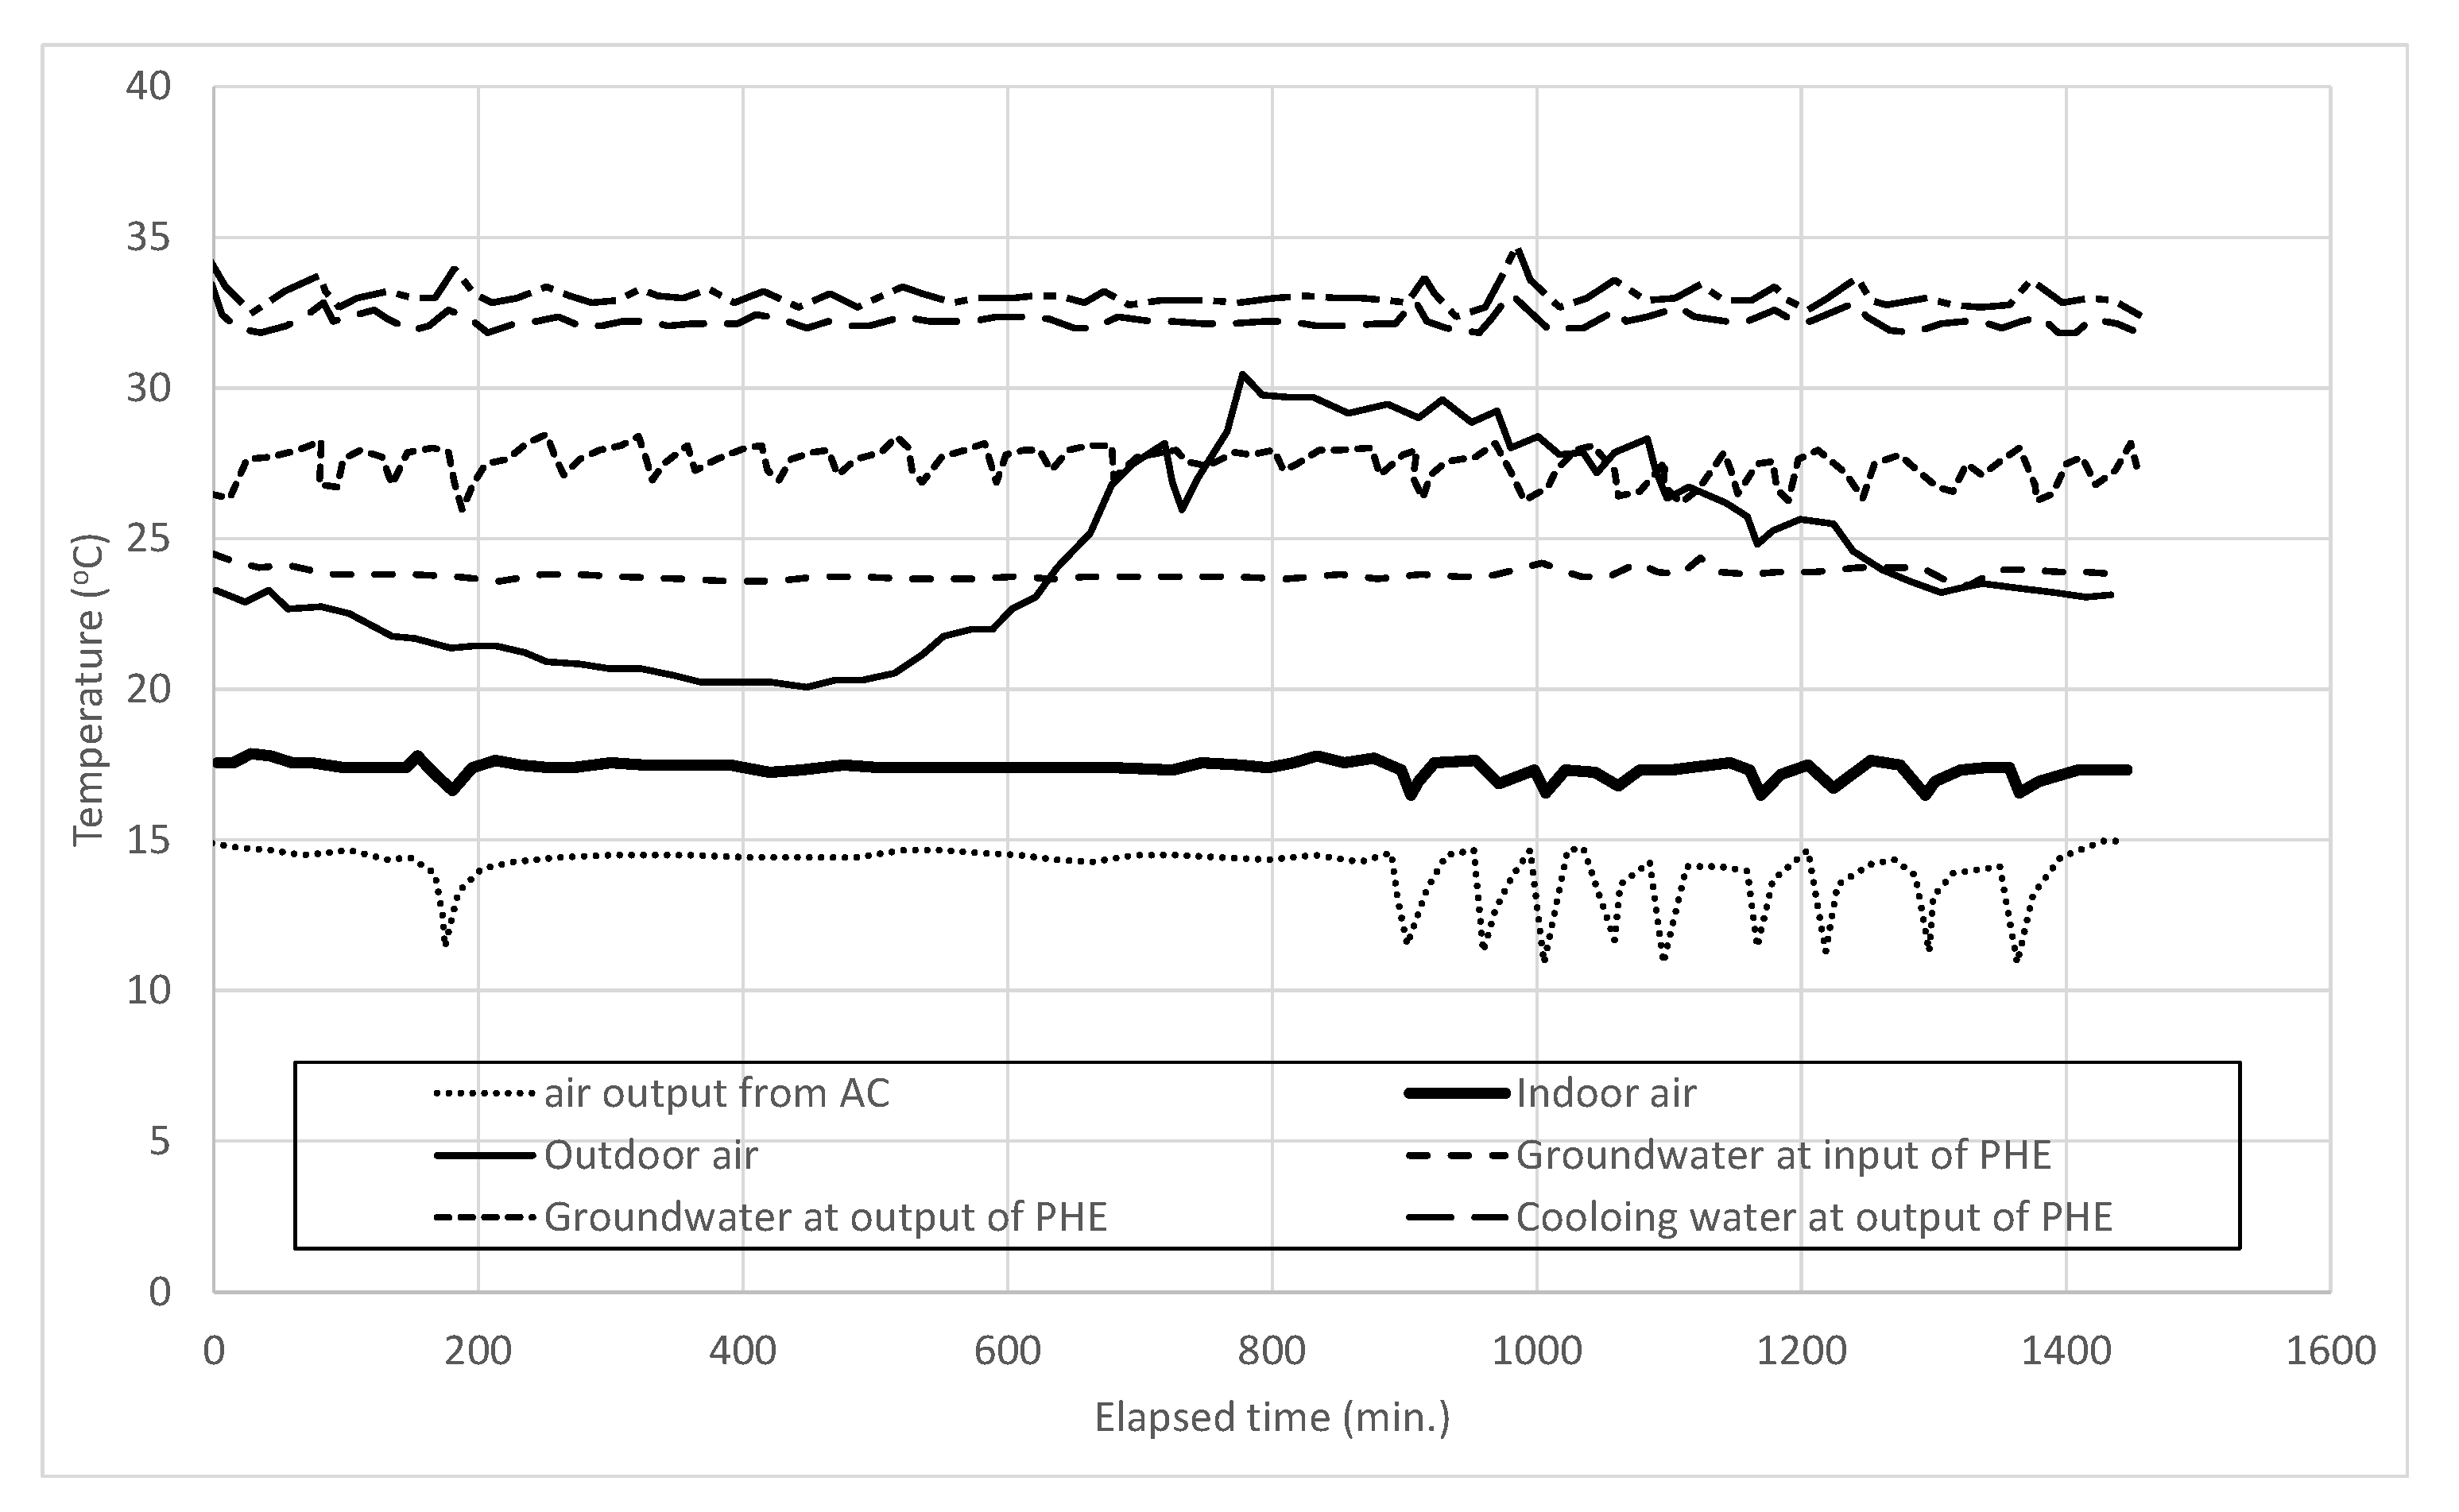
4.2. Open Circulating Groundwater System
4.3. The Amount of Heat Produced by the Air Conditioner and That Absorbed by the Stratum
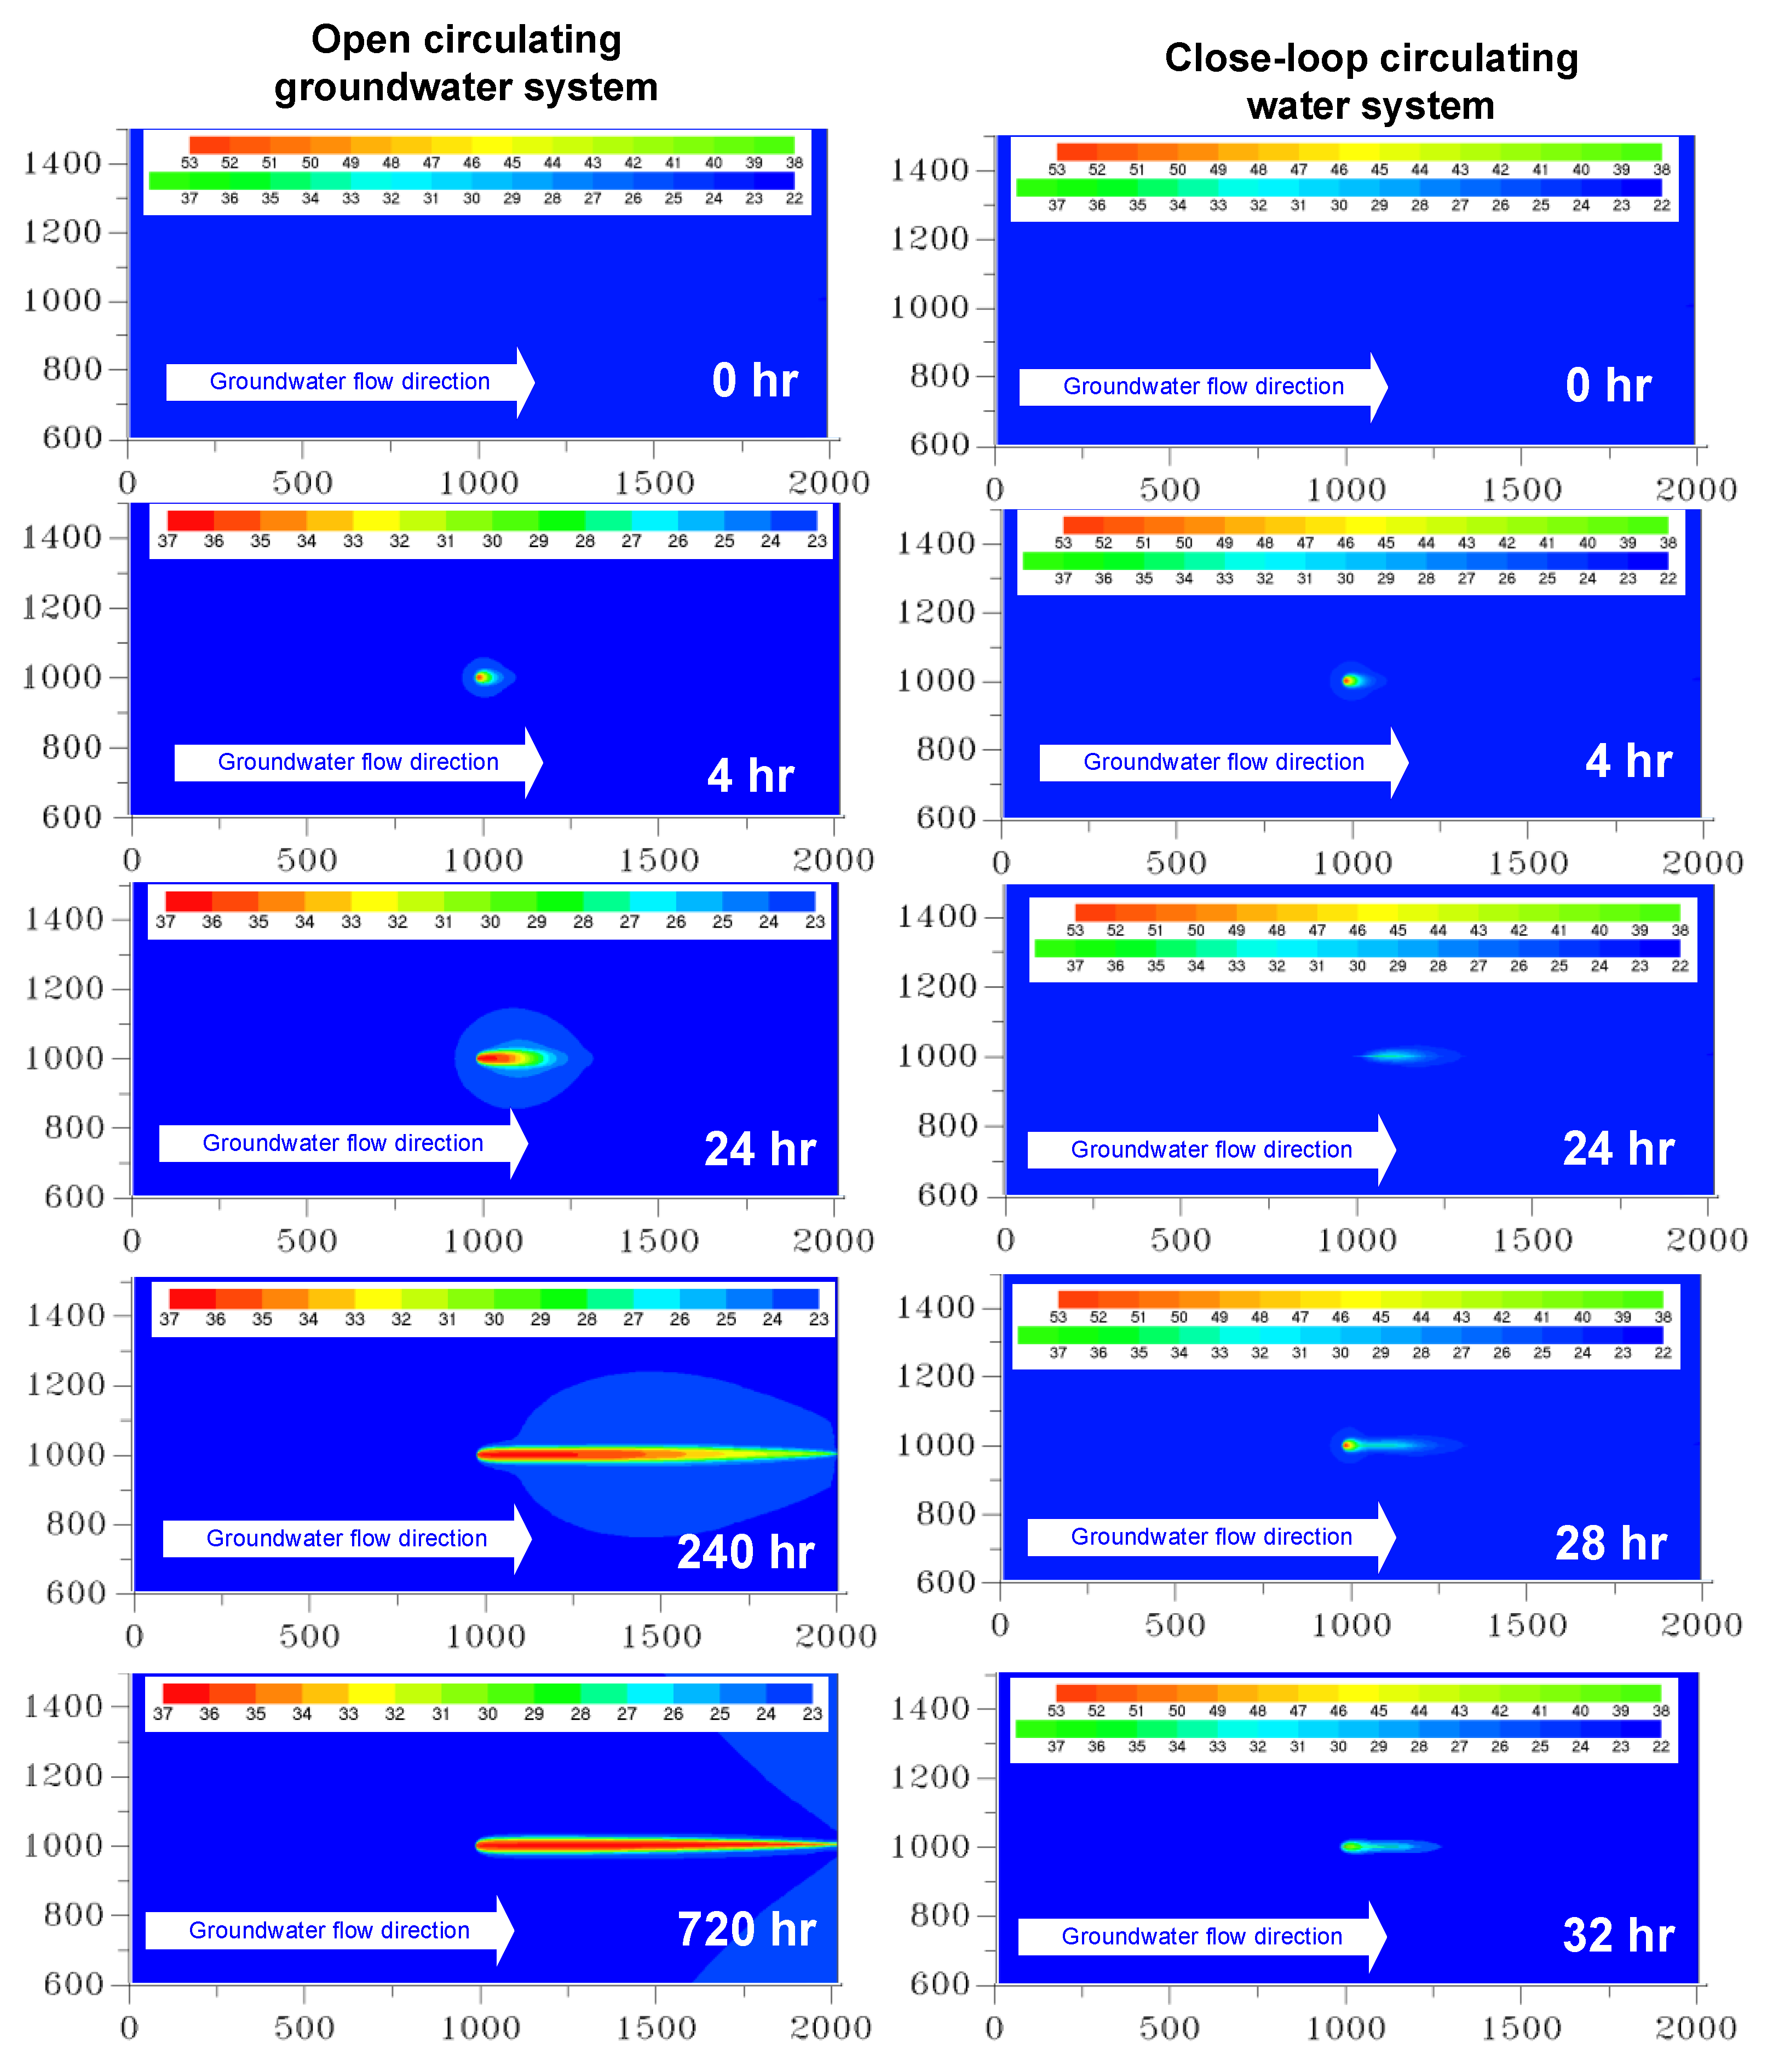
5. Simulation of the Heat Dissipation Capacity of Groundwater
6. Evaluation and Planning of the System’s Energy Conservation Effectiveness
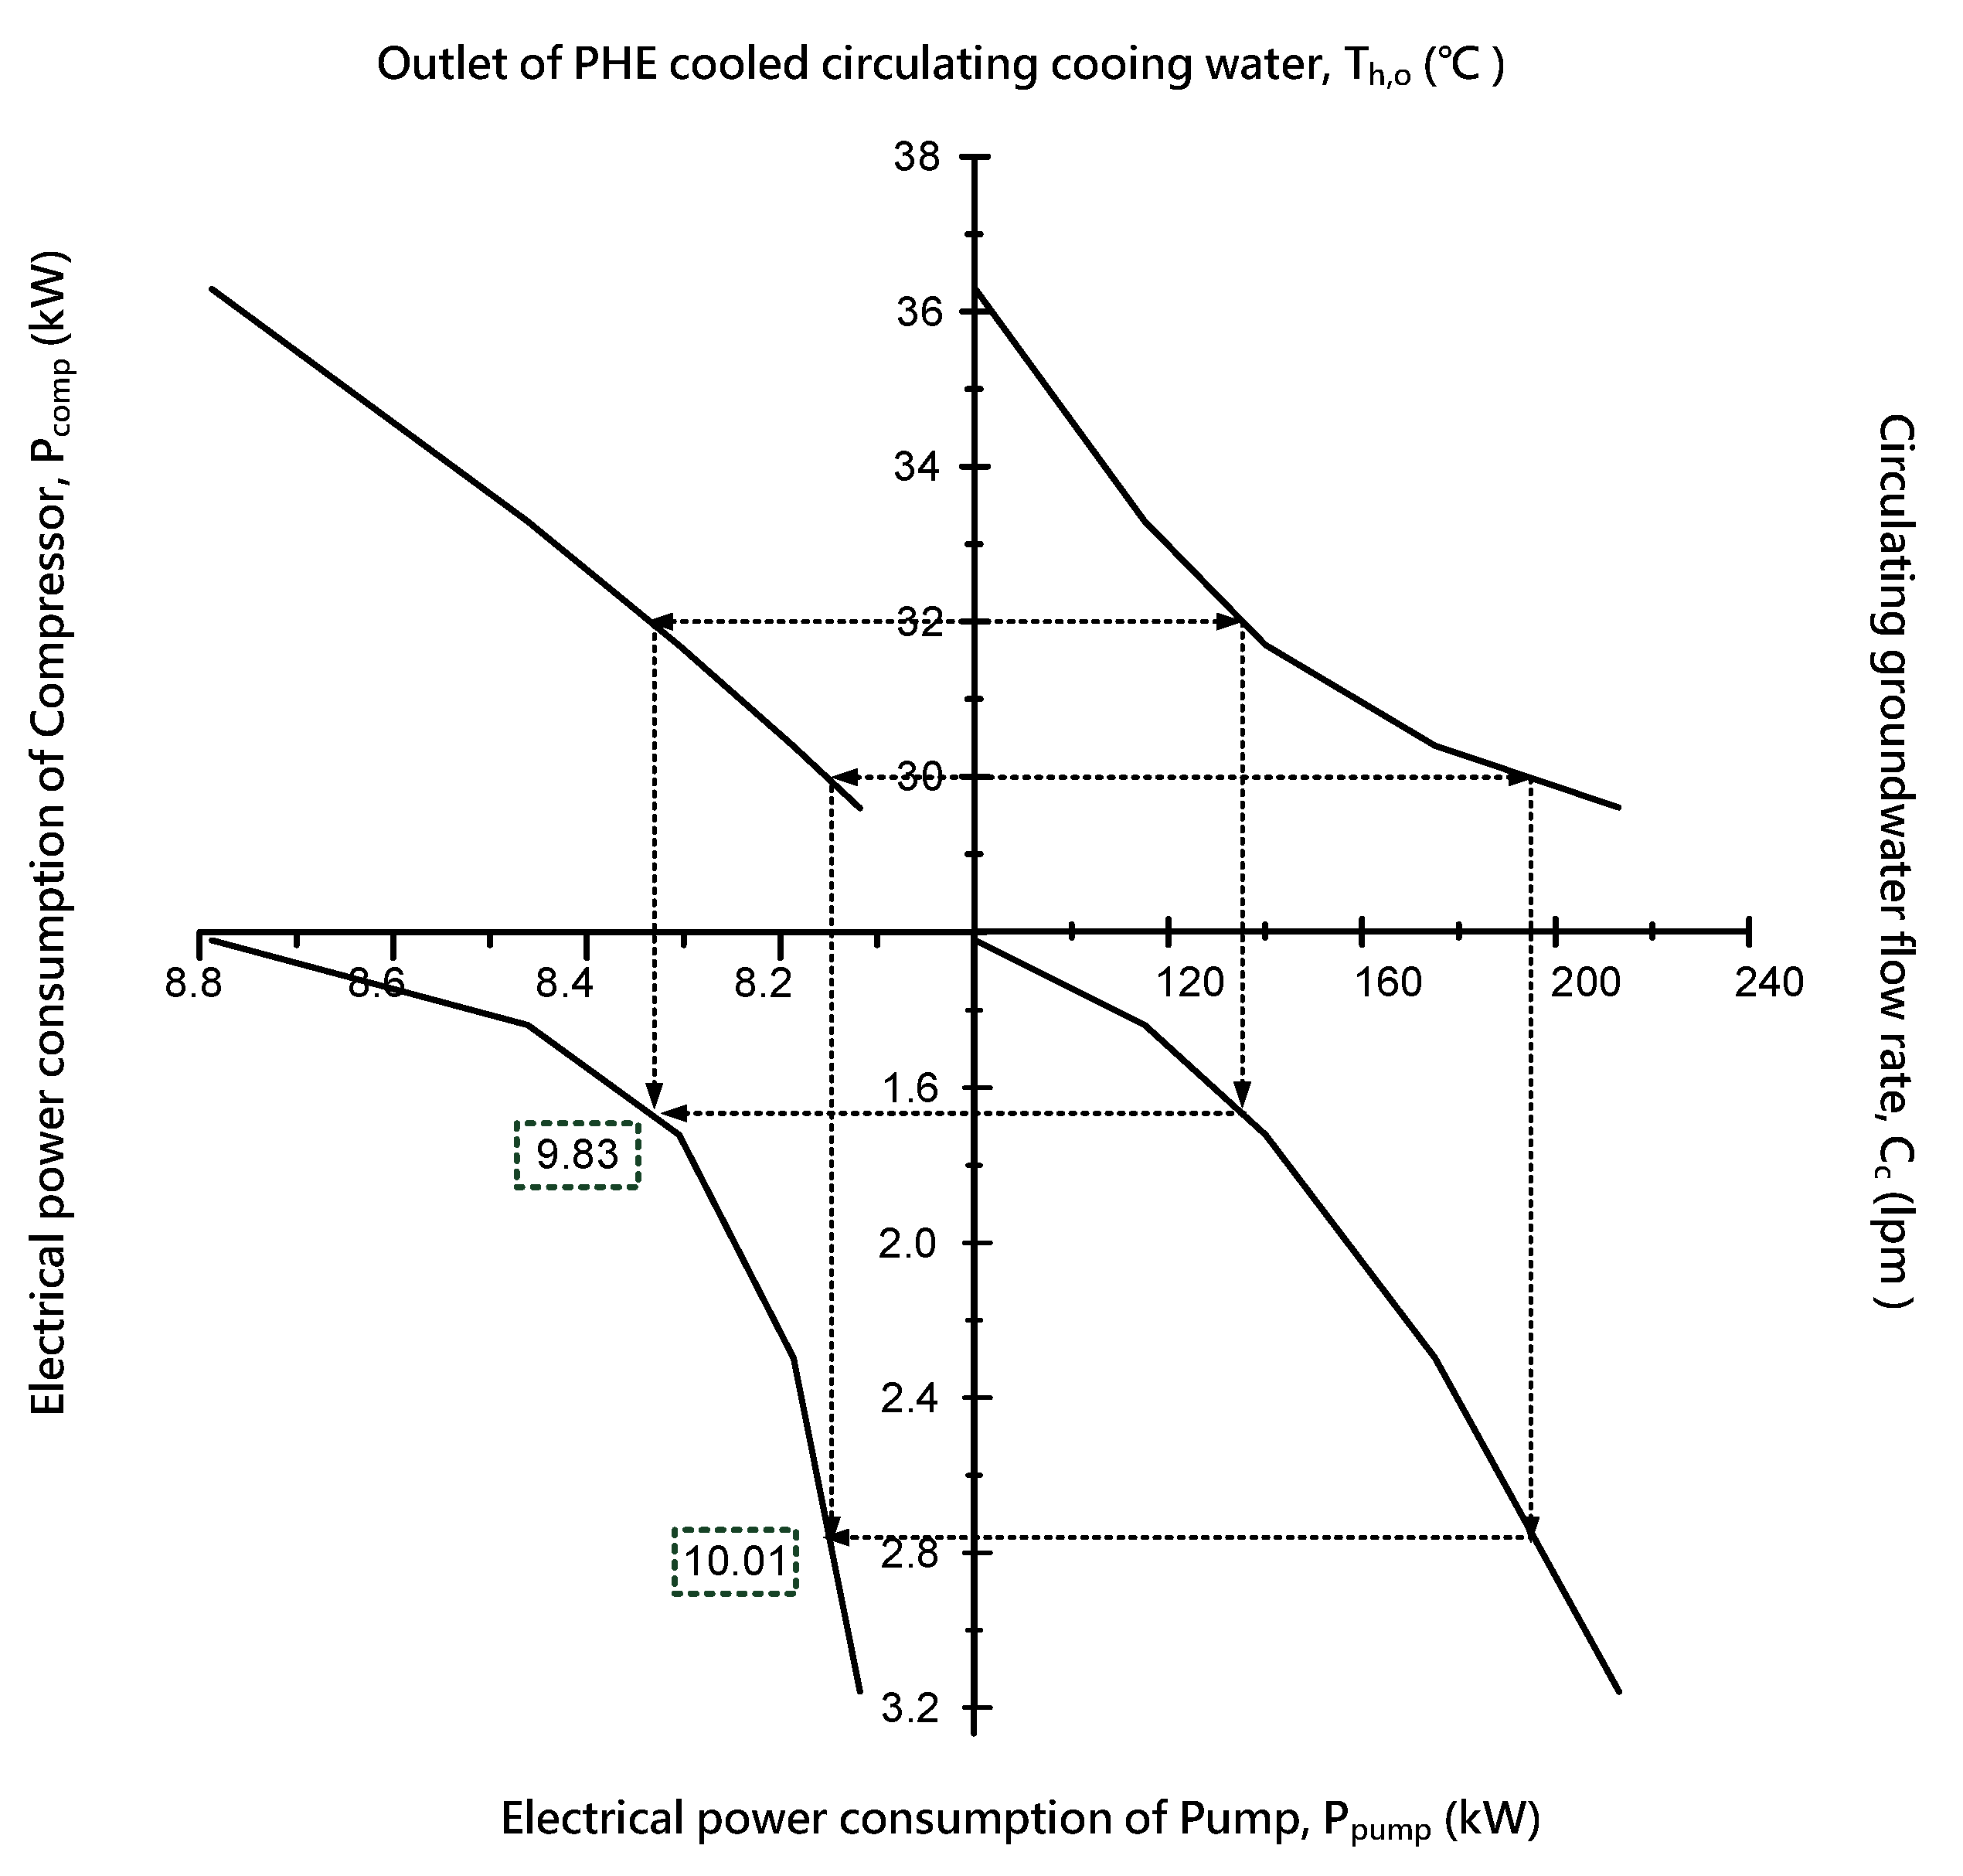
7. Open System Power Consumption Optimization Calculation
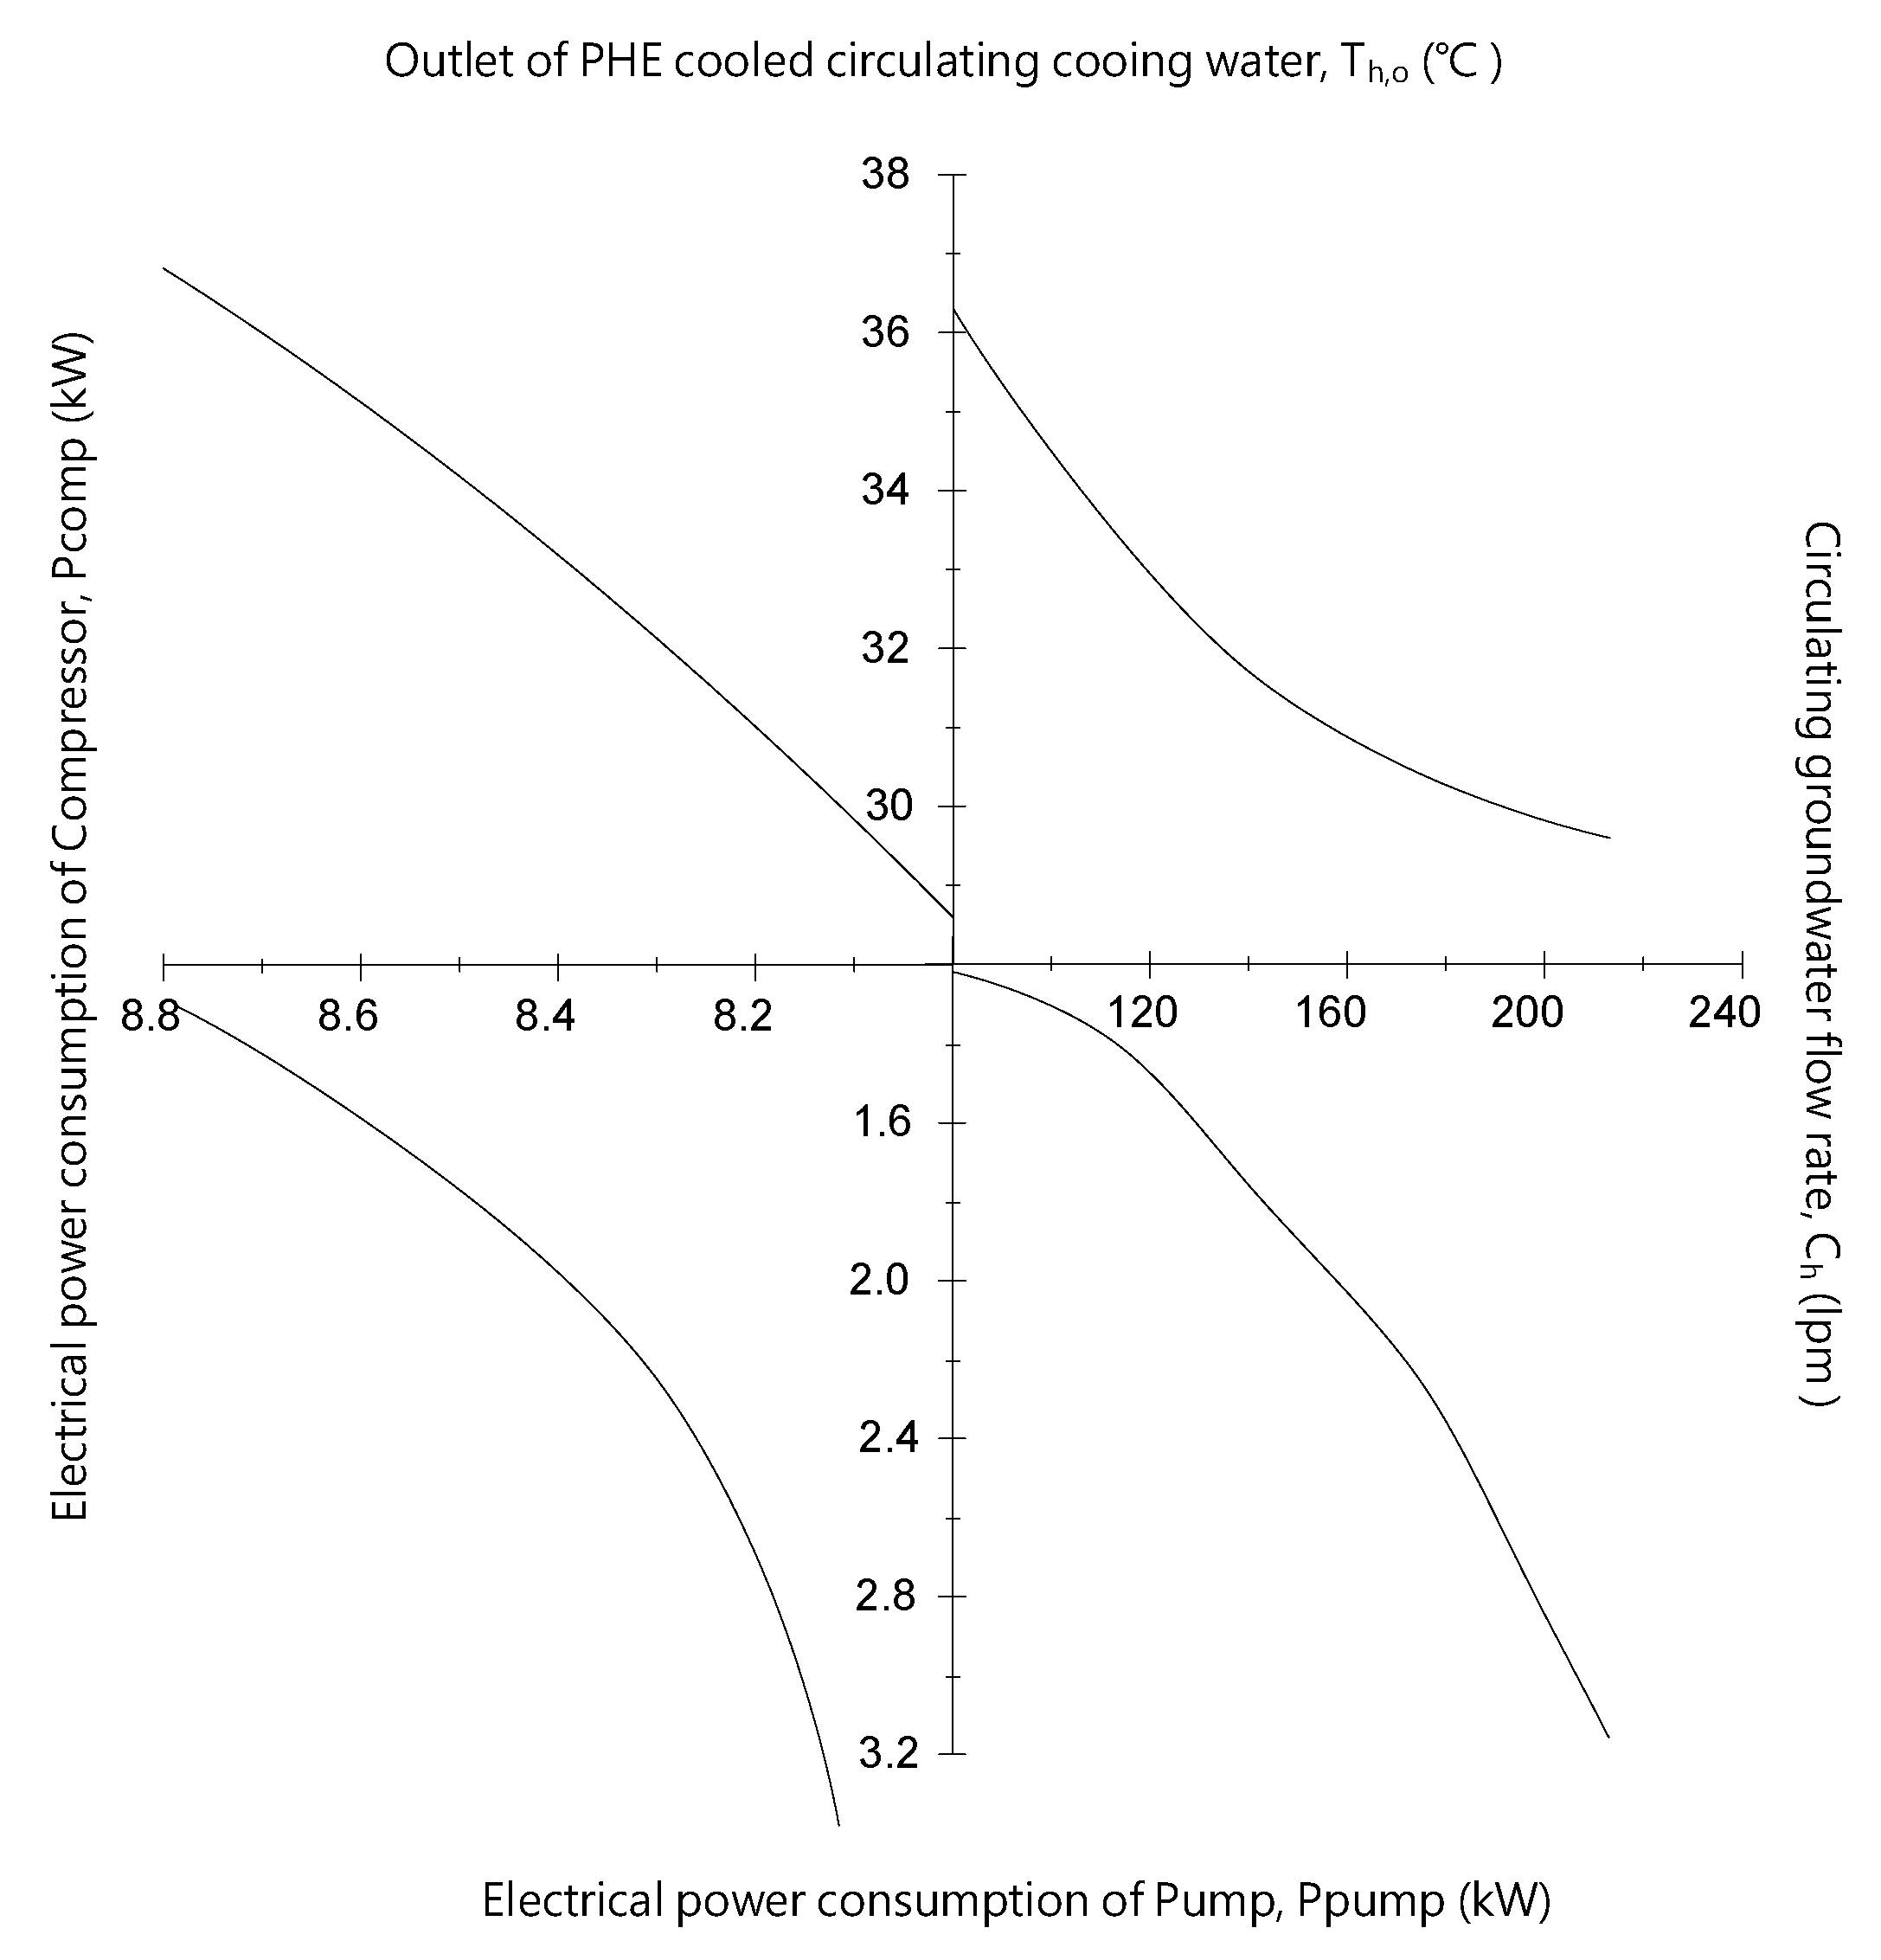
- The overall system heat exchange only occurs in the air conditioner, plate heat exchanger, and stratum;
- The heat source only comes from the air conditioner, and the air conditioner heat output remains at 78.98 kW;
- The groundwater inlet temperature (Tc,i) remains at 23.6 °C;
- The maximum cooling water inlet temperature (Th,i) is 37 °C;
- The maximum groundwater outlet temperature (Tc,o) is only 0.5 °C lower than the cooling water outlet temperature (36.5 °C);
- The circulating groundwater discharge (Cc) shall not be higher than 196 lpm (required rated cooling water quantity for a 15RT packaged air conditioning);
- The fluid pressure loss on both sides of the heat exchanger is lower than 50 kPa, the flow velocity is lower than 6 m/s.
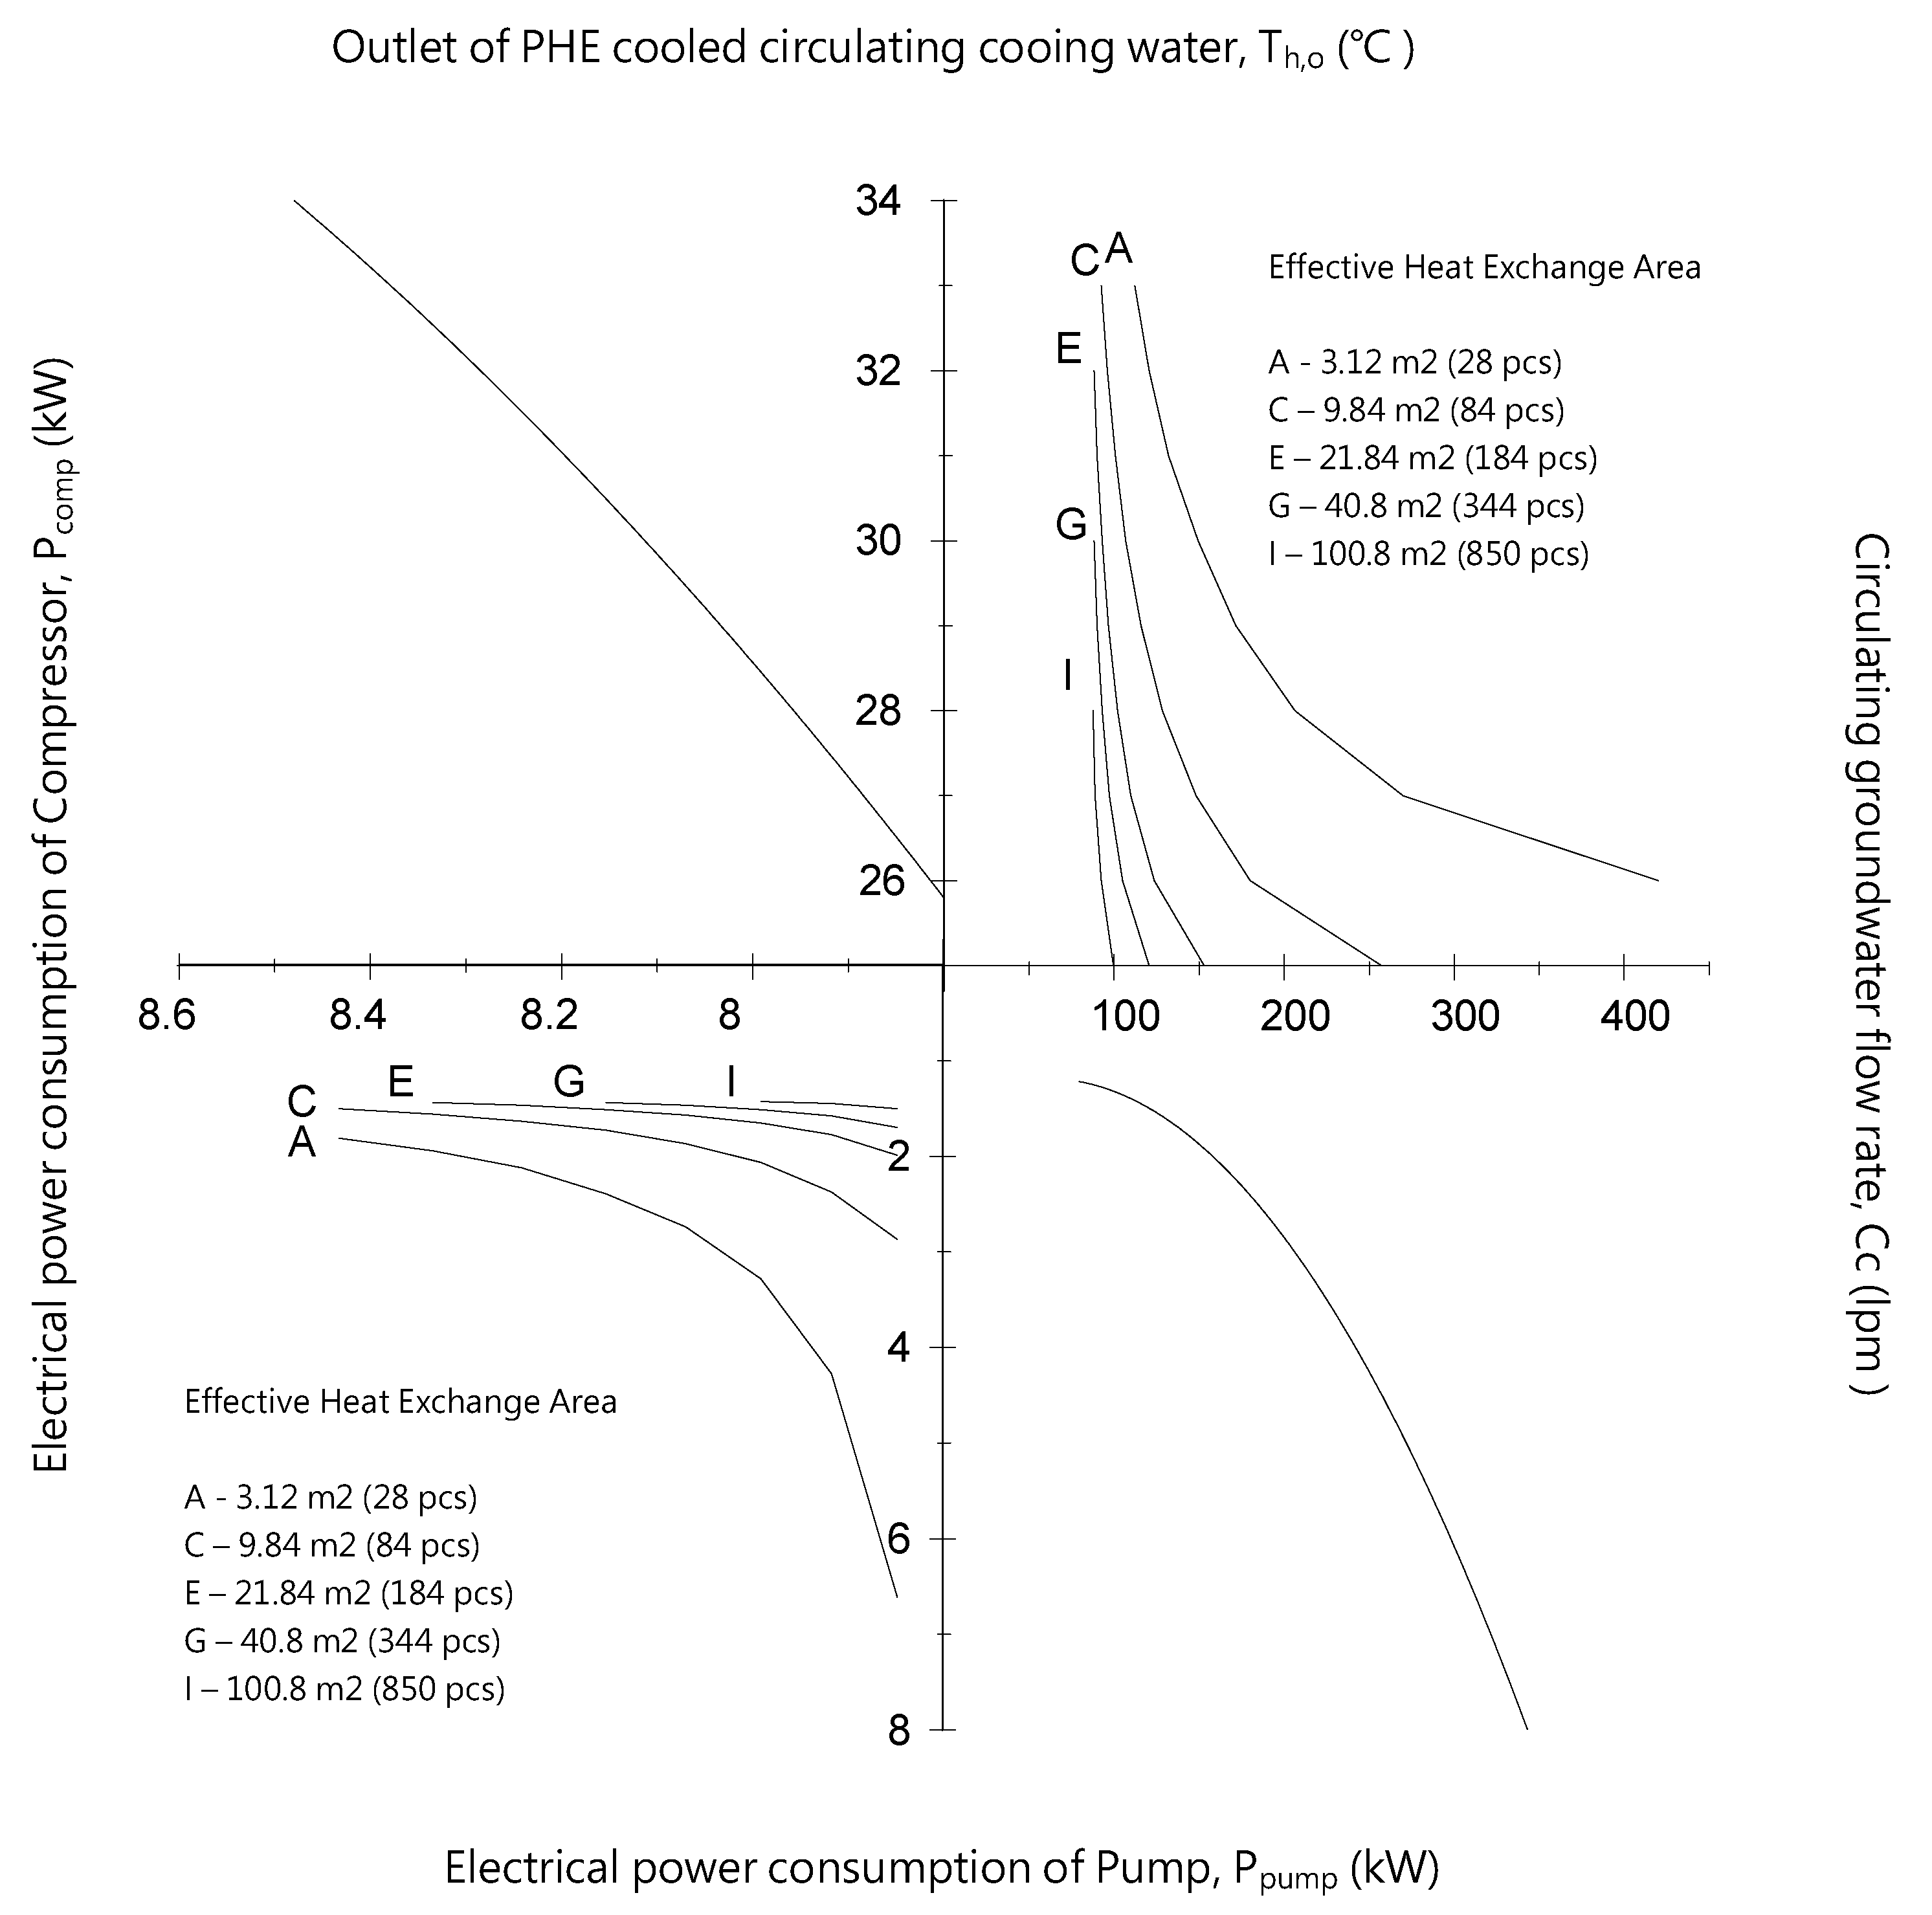
- The heat exchange area of the original plate heat exchanger for the test is 3.12 m2 (number of plates = 28). When the minimum (Th,o) is 26 °C, the required circulating groundwater discharge decreases to 420 lpm, which is lower than the required circulating groundwater discharge = 1446 lpm when (Th,o) is 26 °C in the simulated scenario (A) in Table 2;
- When the heat exchange area is larger than 4.56 m2 (number of plates = 40), the available minimum (Th,o) is 25 °C, but it cannot be lower even if the heat exchange area (number of plates) increases to 100.8 m2 (850 plates);
- When the heat exchange area is larger than 21.84 m2 (the number of plates = 184), the available maximum (Th,o) decreases, and the available (Th,o) is only 28 °C when the area is 100.8 m2 (number of plates = 850);
- The aforesaid results show when the heat exchange area of the heat exchange model is larger than 21.84 m2 (number of plates = 184), the difference among different heat exchange areas in the required (Cc) for the same available (Th,o) decreases.
8. Comparison with Cooling Tower Method
9. Conclusions
- Regarding a 15-RT air conditioner using a closed circulating cooling system, the heat exchange between the closed cooling water and the strata are slower than the rate of heat production of an air conditioner. Therefore, an air conditioner can only operate 4 h a day, and it needs to be shut down before starting operation again the next day. However, all-day air conditioning is possible after the simulation of stratum temperature distribution if several units of closed systems and their locations can be arranged appropriately to operate under different schedules.
- For a 15-RT air conditioner using an open circulating system, employing circulating groundwater with a temperature lower than that of the nameplate cooling water can discharge heat to strata and keep the air conditioner operating continuously for 24 h. This heat dissipation effect of strata can prevent a compressor from breaking down due to overheating. The results showed that every 1°C decrease in cooling water temperature enabled the air conditioner compressor to make energy savings of approximately 1% to 2%. This could achieve superior energy conservation than using cooling water provided by a cooling tower. No exhaust heat is discharged into the air by using the proposed circulating groundwater system. It can help mitigate the worsening heat-island effect in the Taipei Basin. The power consumption of the compressor can be reduced by 22%, considering the aforesaid energy saved after system optimization, the total power consumption can be reduced by about 28%.
- The volume ratio of the plate heat exchanger for this test to the actual cooling tower with the same refrigerating capacity is 1.36%. Even if different models of heat exchangers are used, the plate heat exchanger and circulating groundwater well can save more than 98.1% of installation space compared with the cooling tower, meaning about 8.7% of electricity can be saved after system optimization.
- To save the cost of drilling wells for the proposed method, the wells installed for dewatering to stabilize deep excavation are suggested to be used herein since they would be shut off after the engineering.
Author Contributions
Funding
Institutional Review Board Statement
Informed Consent Statement
Data Availability Statement
Acknowledgments
Conflicts of Interest
References
- Central Weather Bureau, CWB. Weather Monitoring Data. 2021. Available online: https://www.cwb.gov.tw/V8/C/C/Statistics/monthlydata.html (accessed on 22 December 2021).
- de Munck, C.; Pigeon, G.; Masson, V.; Meunier, F.; Bousquet, P.; Tréméac, B.; Merchat, M.; Poeuf, P.; Marchadier, C. How much can air conditioning increase air temperatures for a city like Paris, France? Int. J. Clim. 2013, 33, 210–227. [Google Scholar] [CrossRef]
- Hsieh, C.M.; Aramakia, T.; Hanakia, K. Estimation of heat rejection based on the air conditioner use time and its mitigation from buildings in Taipei City. Build. Environ. 2007, 42, 3125–3137. [Google Scholar] [CrossRef]
- Radhi, H.; Sharples, S. Quantifying the domestic electricity consumption for air-conditioning due to urban heat islands in hot arid regions. Appl. Energy 2013, 112, 371–380. [Google Scholar] [CrossRef]
- Santamouris, M. On the energy impact of urban heat island and global warming on buildings. Energy Build. 2014, 82, 100–113. [Google Scholar] [CrossRef]
- Kappler, G.; Dias, J.B.; Haeberle, F.; Wander, P.R.; Moraes, C.A.M.; Modolo, R.C.E. Study of an earth-to-water heat exchange system which relies on underground water tanks. Renew. Energy 2018, 133, 1236–1246. [Google Scholar] [CrossRef]
- Emad, D.S.; Schincariol, R.A.; Olofsson, B. Impact of Groundwater Flow and Energy Load on Multiple Borehole Heat Ex-changers. Groundwater 2015, 53, 558–571. [Google Scholar] [CrossRef] [PubMed]
- Aprianti, T.; Tan, E.; Diu, C.; Sprivulis, B.; Ryan, G.; Srinivasan, K.; Chua, H.T. A comparison of ground and air source heat pump performance for domestic applications: A case study in Perth, Australia. Int. J. Energy Res. 2021, 45, 20686–20699. [Google Scholar] [CrossRef]
- Piga, B.; Casasso, A.; Pace, F.; Godio, A.; Sethi, R. Thermal Impact Assessment of Groundwater Heat Pumps (GWHPs): Rigorous vs. Simplified Models. Energies 2017, 10, 1385. [Google Scholar] [CrossRef] [Green Version]
- Sedaghat, A.; Habibi, M.; Hakkaki-Fard, A. A novel ground thermal recovery system for horizontal ground heat exchangers in a hot climate. Energy Convers. Manag. 2020, 224, 113350. [Google Scholar] [CrossRef]
- Todorov, O.; Alanne, K.; Virtanen, M.; Kosonen, R. Aquifer Thermal Energy Storage (ATES) for District Heating and Cooling: A Novel Modeling Approach Applied in a Case Study of a Finnish Urban District. Energies 2020, 13, 2478. [Google Scholar] [CrossRef]
- Al-Madhlom, Q.; Al-Ansari, N.; Laue, J.; Nordell, B.; Hussain, H.M. Site Selection of Aquifer Thermal Energy Storage Systems in Shallow Groundwater Conditions. Water 2019, 11, 1393. [Google Scholar] [CrossRef] [Green Version]
- Al-Madhlom, Q.; Nordell, B.; Chabuk, A.; Al-Ansari, N.; Lindblom, J.; Laue, J.; Hussain, H.M. Potential use of UTES in Babylon Governorate, Iraq. Groundw. Sustain. Dev. 2019, 10, 100283. [Google Scholar] [CrossRef]
- Song, W.; Ni, L.; Yao, Y. Analyses of different operation modes of pumping and recharging well using an indoor sandbox test. Energy Build. 2019, 208, 109660. [Google Scholar] [CrossRef]
- National Development Council. The Research on Policy of Groundwater Resources in Taiwan; National Development Council: Taipei, Taiwan, 2014. (In Chinese)
- Environmental Protection Agency, EPA. Regional Groundwater Monitoring Data. 2021. Available online: https://data.epa.gov.tw/dataset/wqx_p_02/resource/298f84f7-fd4c-4cf1-8113-b9e51b8d1fa0 (accessed on 22 December 2021).
- Wang, C.M.; Cheng, Y.M.; Wang, Y. Investigation of geology and sediment of Taipei Basin. Taiwan Miner. Ind. 1978, 30, 350–380. [Google Scholar]
- Chia, Y.P.; Chang, M.H.; Liu, W.Y.; Lai, T.C. Hydrogeology research of groundwater of Taipei Basin. In Special Publication of the Central Geological Survey; MOEA: Taipei, Taiwan, 1999. [Google Scholar]
- Hong, N.M.; Tan, C.C.; Lin, S.T.; Tsay, T.S. Uncertainty analysis of groundwater exchange at boundaries in Taipei Basin. In Geophysical Research Abstracts; European Geosciences Union: Vienna, Austria, 2007. [Google Scholar]
- Clauser, C. (Ed.) Numerical Simulation of Reactive Flow in Hot Aquifers, SHEMAT and Processing SHEMAT; Springer: Berlin/Heidenburg, Germany, 2003; p. 332. [Google Scholar]
- Trescott, P.C.; Larson, S.P. Documentation of Finite-Difference Model for Simulation of Three-Dimensional Ground-Water Flow; U.S. Geological Survey: Reston, VA, USA, 1976.
- Chiang, W.H.; Kinzelbach, W. 3D-Groundwater Modeling with PMWIN; Springer: Berlin/Heidenburg, Germany, 2005. [Google Scholar]
- Tindall, J.A.; Kunkel, J.R. Unsaturated Zone Hydrology for Scientists and Engineers; Prentice-Hall: London, UK, 1999. [Google Scholar]


| Fixed Flow of Cooling Water (A) | Variable Flow of Cooling Water (B) | Ratio of Power Saving | ||||||
|---|---|---|---|---|---|---|---|---|
| Th,o [°C] | Ppump [kW] | Pcomp [kW] | Total P(A) [kW] | Th,o [°C] | Ppump [kW] | Pcomp [kW] | Total P(B) [kW] | 100 − P(B)/P(A) [%] |
| 36.3 | 1.46 | 8.79 | 10.25 | 33.0 | 1.81 | 8.43 | 10.24 | 2.2 |
| 33.3 | 2.07 | 8.46 | 10.53 | 32.0 | 1.94 | 8.33 | 10.27 | 3.7 |
| 31.7 | 2.39 | 8.30 | 10.69 | 31.0 | 2.12 | 8.24 | 10.36 | 5.2 |
| 30.4 | 2.91 | 8.19 | 11.10 | 30.0 | 2.39 | 8.15 | 10.54 | 5.5 |
| 29.6 | 3.74 | 8.12 | 11.86 | 29.0 | 2.73 | 8.07 | 10.80 | 5.7 |
| 28.0 | 6.67 | 7.99 | 14.66 | 28.0 | 3.28 | 7.99 | 11.27 | 23.1 |
| 27.0 | 10.51 | 7.92 | 18.43 | 27.0 | 4.27 | 7.92 | 12.18 | 33.9 |
| 26.0 | 22.61 | 7.85 | 30.46 | 26.0 | 6.61 | 7.85 | 14.46 | 52.5 |
| Heat Exchange Areas [m2] | Th,i [°C] | Th,o [°C] | Ch [lpm] | Tc,i [°C] | Tc,o [°C] | Cc [lpm] |
|---|---|---|---|---|---|---|
| 3.12 | 37.0 | 33.0 | 285.2 | 23.6 | 33.7 | 112.2 |
| 37.0 | 32.0 | 228.1 | 23.6 | 33.0 | 120.6 | |
| 37.0 | 31.0 | 190.1 | 23.6 | 32.2 | 132.0 | |
| 37.0 | 30.0 | 162.9 | 23.6 | 31.2 | 149.4 | |
| 37.0 | 29.0 | 142.5 | 23.7 | 30.2 | 171.6 | |
| 37.0 | 28.0 | 126.6 | 23.6 | 29.1 | 206.4 | |
| 37.0 | 27.0 | 114.0 | 23.6 | 27.8 | 270.0 | |
| 37.0 | 26.0 | 103.6 | 23.6 | 26.3 | 420.0 | |
| 4.56 | 37.0 | 33.0 | 285.2 | 23.6 | 34.6 | 103.2 |
| 37.0 | 32.0 | 228.1 | 23.6 | 34.0 | 109.2 | |
| 37.0 | 31.0 | 190.1 | 23.6 | 33.2 | 117.6 | |
| 37.0 | 30.0 | 162.9 | 23.6 | 32.5 | 128.4 | |
| 37.0 | 29.0 | 142.5 | 23.7 | 31.4 | 146.4 | |
| 37.0 | 28.0 | 126.6 | 23.6 | 30.3 | 169.2 | |
| 37.0 | 27.0 | 114.0 | 23.6 | 28.9 | 213.0 | |
| 37.0 | 26.0 | 103.6 | 23.6 | 27.4 | 295.8 | |
| 37.0 | 25.0 | 94.9 | 23.6 | 25.6 | 571.2 | |
| 9.84 | 37.0 | 33.0 | 285.2 | 23.6 | 35.9 | 92.4 |
| 37.0 | 32.0 | 228.1 | 23.6 | 35.4 | 96.0 | |
| 37.0 | 31.0 | 190.1 | 23.6 | 34.9 | 100.8 | |
| 37.0 | 30.0 | 162.9 | 23.7 | 34.2 | 106.8 | |
| 37.0 | 29.0 | 142.5 | 23.6 | 33.4 | 115.8 | |
| 37.0 | 28.0 | 126.6 | 23.6 | 32.4 | 128.4 | |
| 37.0 | 27.0 | 114.0 | 23.6 | 31.3 | 148.2 | |
| 37.0 | 26.0 | 103.6 | 23.6 | 29.9 | 180.0 | |
| 37.0 | 25.0 | 94.9 | 23.6 | 28.0 | 257.4 | |
| 16.8 | 37.0 | 33.0 | 285.2 | 23.6 | 36.5 | 88.2 |
| 37.0 | 32.0 | 228.1 | 23.6 | 36.2 | 90.0 | |
| 37.0 | 31.0 | 190.1 | 23.7 | 35.8 | 93.0 | |
| 37.0 | 30.0 | 162.9 | 23.6 | 35.4 | 96.6 | |
| 37.0 | 29.0 | 142.5 | 23.6 | 34.8 | 101.4 | |
| 37.0 | 28.0 | 126.6 | 23.6 | 34.1 | 108.0 | |
| 37.0 | 27.0 | 114.0 | 23.6 | 33.1 | 118.8 | |
| 37.0 | 26.0 | 103.6 | 23.6 | 31.9 | 137.4 | |
| 37.0 | 25.0 | 94.9 | 23.6 | 30.0 | 177.0 | |
| 21.84 | 37.0 | 32.0 | 228.1 | 23.7 | 36.4 | 88.2 |
| 37.0 | 31.0 | 190.1 | 23.6 | 31.0 | 90.0 | |
| 37.0 | 30.0 | 162.9 | 23.6 | 35.8 | 93.0 | |
| 37.0 | 29.0 | 142.5 | 23.6 | 35.4 | 96.6 | |
| 37.0 | 28.0 | 126.6 | 23.6 | 34.7 | 102.0 | |
| 37.0 | 27.0 | 114.0 | 23.6 | 33.9 | 109.8 | |
| 37.0 | 26.0 | 103.6 | 23.6 | 32.8 | 123.6 | |
| 37.0 | 25.0 | 94.9 | 23.6 | 31.0 | 153.0 | |
| 29.28 | 37.0 | 31.0 | 190.1 | 23.6 | 36.4 | 88.2 |
| 37.0 | 30.0 | 162.9 | 23.6 | 36.2 | 90.0 | |
| 37.0 | 29.0 | 142.5 | 23.6 | 35.8 | 93.0 | |
| 37.0 | 28.0 | 126.6 | 23.6 | 35.3 | 97.2 | |
| 37.0 | 27.0 | 114.0 | 23.6 | 34.6 | 103.2 | |
| 37.0 | 26.0 | 103.6 | 23.6 | 33.6 | 114.0 | |
| 37.0 | 25.0 | 94.9 | 23.7 | 32.0 | 135.0 | |
| 40.8 | 37.0 | 30.0 | 162.9 | 23.6 | 36.5 | 88.2 |
| 37.0 | 29.0 | 142.5 | 23.6 | 36.2 | 90.0 | |
| 37.0 | 28.0 | 126.6 | 23.6 | 35.8 | 93.0 | |
| 37.0 | 27.0 | 114.0 | 23.6 | 35.3 | 97.2 | |
| 37.0 | 26.0 | 103.6 | 23.7 | 34.4 | 105.0 | |
| 37.0 | 25.0 | 94.9 | 23.6 | 33.0 | 120.6 | |
| 60.48 | 37.0 | 28.0 | 126.6 | 23.6 | 36.3 | 89.4 |
| 37.0 | 27.0 | 114.0 | 23.7 | 35.8 | 92.4 | |
| 37.0 | 26.0 | 103.6 | 23.6 | 35.2 | 97.8 | |
| 37.0 | 25.0 | 94.9 | 23.6 | 34.0 | 109.2 | |
| 100.8 | 37.0 | 28.0 | 126.6 | 23.7 | 36.5 | 87.6 |
| 37.0 | 27.0 | 114.0 | 23.6 | 36.3 | 88.8 | |
| 37.0 | 26.0 | 103.6 | 23.6 | 35.9 | 92.4 | |
| 37.0 | 25.0 | 94.9 | 23.6 | 35.0 | 99.6 |
| Heat Exchange Areas [m2] | |||||||||||
|---|---|---|---|---|---|---|---|---|---|---|---|
| 3.12 | 4.56 | 9.84 | |||||||||
| Th,o [°C] | Ppump [kW] | Pcomp [kW] | Total P [kW] | Th,o [°C] | Ppump [kW] | Pcomp [kW] | Total P [kW] | Th,o [°C] | Ppump [kW] | Pcomp [kW] | Total P [kW] |
| 33.0 | 1.81 | 8.43 | 10.24 | 33.0 | 1.67 | 8.43 | 10.10 | 33.0 | 1.50 | 8.43 | 9.93 |
| 32.0 | 1.94 | 8.33 | 10.27 | 32.0 | 1.76 | 8.33 | 10.09 | 32.0 | 1.55 | 8.33 | 9.89 |
| 31.0 | 2.12 | 8.24 | 10.36 | 31.0 | 1.89 | 8.24 | 10.13 | 31.0 | 1.63 | 8.24 | 9.87 |
| 30.0 | 2.39 | 8.15 | 10.54 | 30.0 | 2.06 | 8.15 | 10.21 | 30.0 | 1.72 | 8.15 | 9.87 |
| 29.0 | 2.73 | 8.07 | 10.80 | 29.0 | 2.34 | 8.07 | 10.41 | 29.0 | 1.86 | 8.07 | 9.93 |
| 28.0 | 3.28 | 7.99 | 11.27 | 28.0 | 2.70 | 7.99 | 10.69 | 28.0 | 2.06 | 7.99 | 10.05 |
| 27.0 | 4.27 | 7.92 | 12.18 | 27.0 | 3.38 | 7.92 | 11.30 | 27.0 | 2.37 | 7.92 | 10.28 |
| 26.0 | 6.61 | 7.85 | 14.46 | 26.0 | 4.67 | 7.85 | 12.52 | 26.0 | 2.86 | 7.85 | 10.71 |
| 25.0 | - | - | - | 25.0 | 8.97 | 7.78 | 16.75 | 25.0 | 4.07 | 7.78 | 11.86 |
| Heat Exchange Areas [m2] | |||||||||||
| 16.8 | 21.84 (184) | 29.28 | |||||||||
| Th,o [°C] | Ppump [kW] | Pcomp [kW] | Total P [kW] | Th,o [°C] | Ppump [kW] | Pcomp [kW] | Total P [kW] | Th,o [°C] | Ppump [kW] | Pcomp [kW] | Total P [kW] |
| 33.0 | 1.43 | 8.43 | 9.86 | 33.0 | - | - | - | 33.0 | - | - | - |
| 32.0 | 1.46 | 8.33 | 9.79 | 32.0 | 1.43 | 8.33 | 9.77 | 32.0 | - | - | - |
| 31.0 | 1.51 | 8.24 | 9.75 | 31.0 | 1.46 | 8.24 | 9.70 | 31.0 | 1.43 | 8.24 | 9.67 |
| 30.0 | 1.56 | 8.15 | 9.72 | 30.0 | 1.51 | 8.15 | 9.66 | 30.0 | 1.46 | 8.15 | 9.61 |
| 29.0 | 1.64 | 8.07 | 9.71 | 29.0 | 1.56 | 8.07 | 9.63 | 29.0 | 1.51 | 8.07 | 9.58 |
| 28.0 | 1.74 | 7.99 | 9.73 | 28.0 | 1.65 | 7.99 | 9.64 | 28.0 | 1.57 | 7.99 | 9.56 |
| 27.0 | 1.91 | 7.92 | 9.83 | 27.0 | 1.77 | 7.92 | 9.69 | 27.0 | 1.67 | 7.92 | 9.58 |
| 26.0 | 2.20 | 7.85 | 10.05 | 26.0 | 1.99 | 7.85 | 9.83 | 26.0 | 1.84 | 7.85 | 9.68 |
| 25.0 | 2.82 | 7.78 | 10.60 | 25.0 | 2.44 | 7.78 | 10.23 | 25.0 | 2.16 | 7.78 | 9.95 |
| Heat Exchange Areas [m2] | |||||||||||
| 40.8 | 60.48 | 100.8 | |||||||||
| Th,o [°C] | Ppump [kW] | Pcomp [kW] | Total P [kW] | Th,o [°C] | Ppump [kW] | Pcomp [kW] | Total P [kW] | Th,o [°C] | Ppump [kW] | Pcomp [kW] | Total P [kW] |
| 33.0 | - | - | - | 33.0 | - | - | - | 33.0 | - | - | - |
| 32.0 | - | - | - | 32.0 | - | - | - | 32.0 | - | - | - |
| 31.0 | - | - | - | 31.0 | - | - | - | 31.0 | - | - | - |
| 30.0 | 1.43 | 8.15 | 9.58 | 30.0 | - | - | - | 30.0 | - | - | - |
| 29.0 | 1.46 | 8.07 | 9.53 | 29.0 | - | - | - | 29.0 | - | - | - |
| 28.0 | 1.51 | 7.99 | 9.50 | 28.0 | 1.45 | 7.99 | 9.44 | 28.0 | 1.42 | 7.99 | 9.41 |
| 27.0 | 1.57 | 7.92 | 9.49 | 27.0 | 1.50 | 7.92 | 9.41 | 27.0 | 1.44 | 7.92 | 9.36 |
| 26.0 | 1.69 | 7.85 | 9.54 | 26.0 | 1.58 | 7.85 | 9.43 | 26.0 | 1.50 | 7.85 | 9.35 |
| 25.0 | 1.94 | 7.78 | 9.72 | 25.0 | 1.76 | 7.78 | 9.54 | 25.0 | 1.61 | 7.78 | 9.39 |
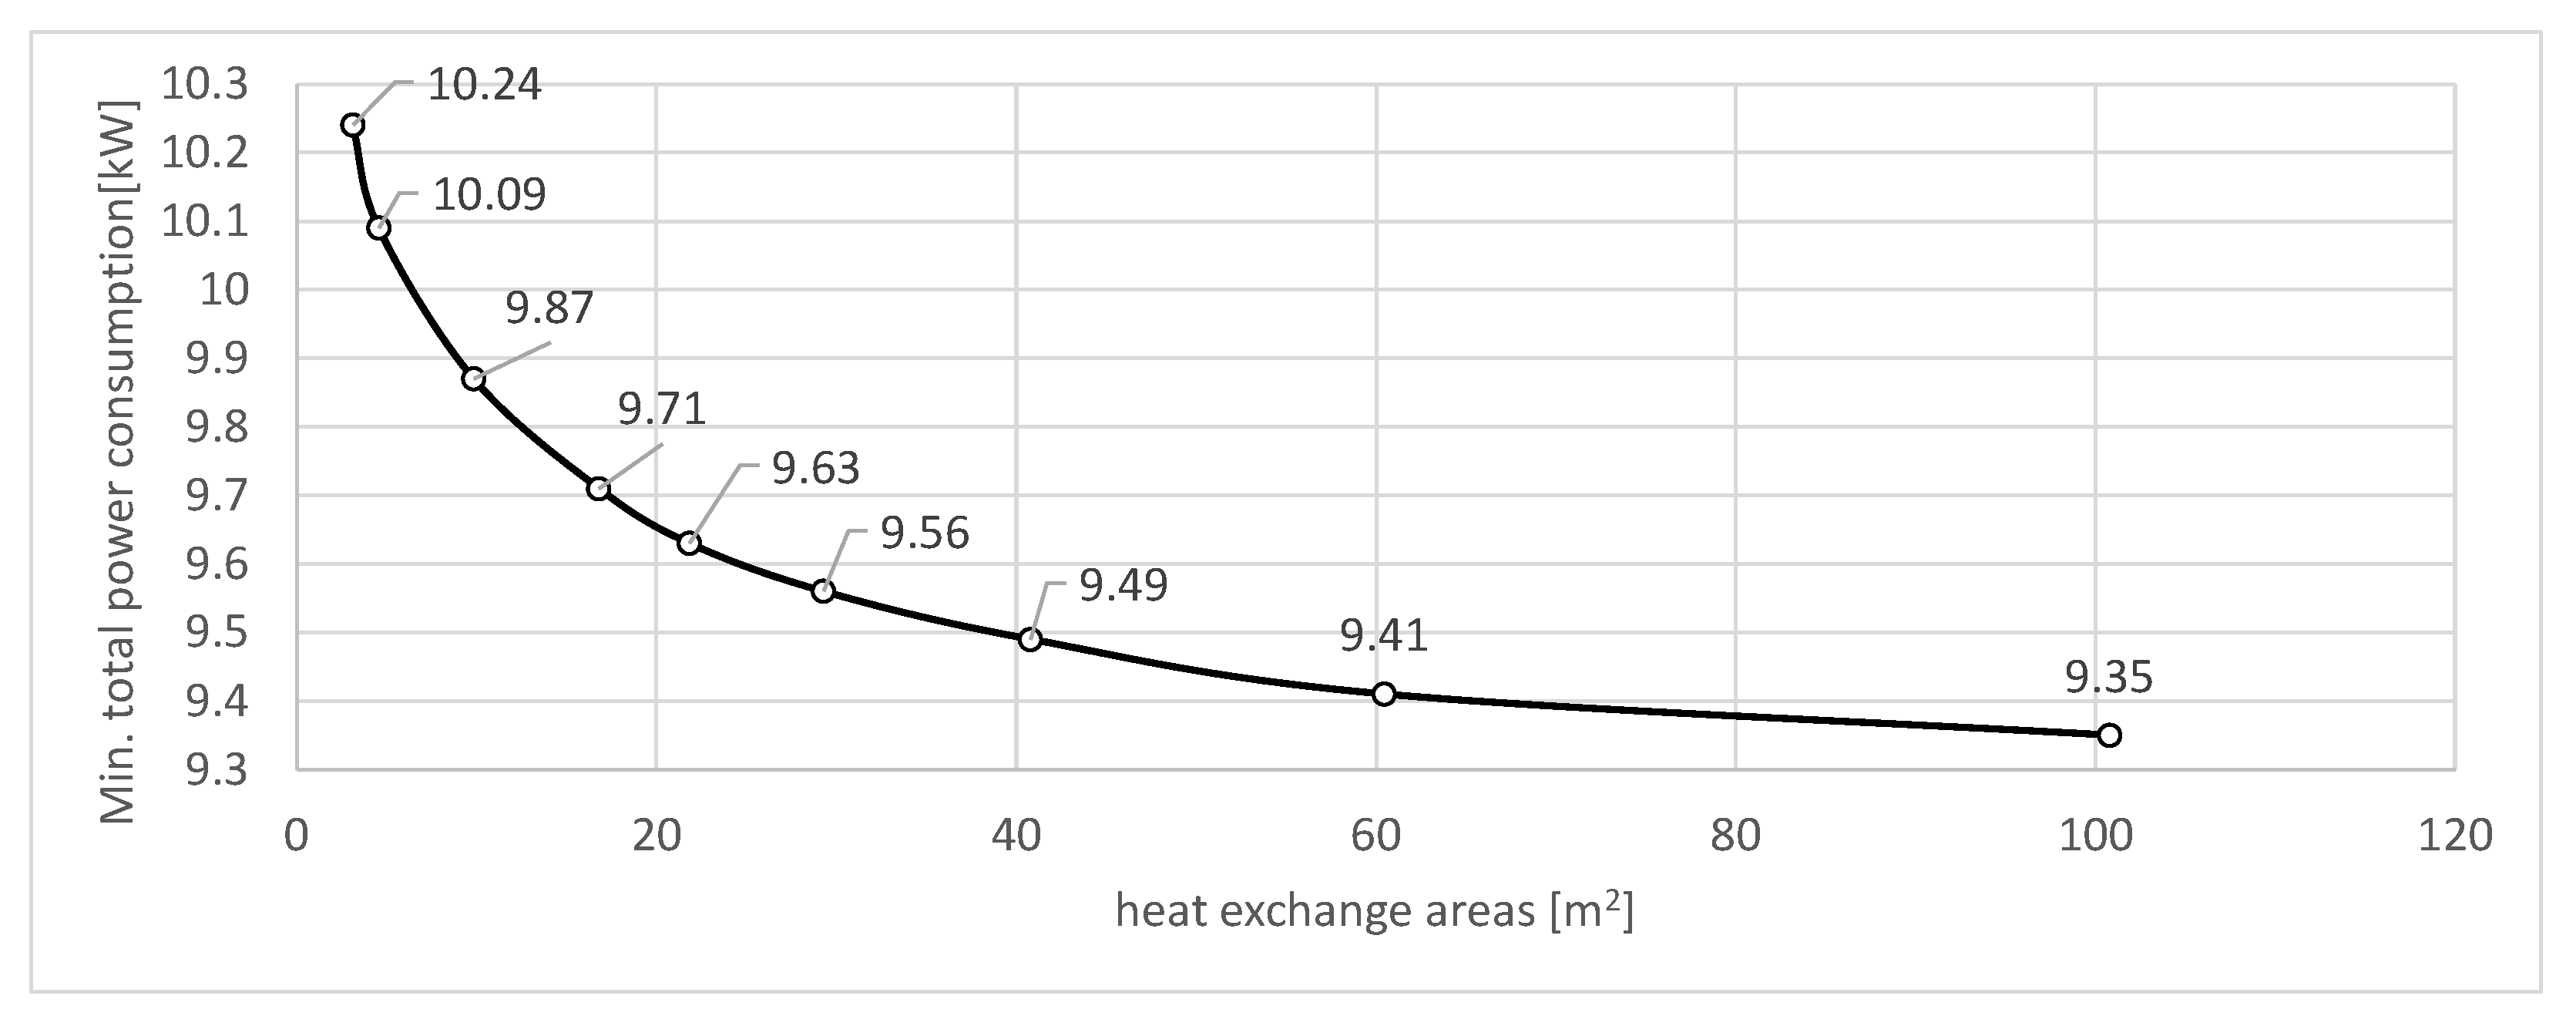
| heat exchange areas [m2] | 3.12 | 4.56 | 9.84 | 16.8 | 21.84 | 29.28 | 40.8 | 60.48 | 100.8 |
| Min. total power consumption [kW] | 10.24 | 10.09 | 9.87 | 9.71 | 9.63 | 9.56 | 9.49 | 9.41 | 9.35 |
| Power saving ratio [%] | 0 | 1.46 | 3.61 | 5.18 | 5.96 | 6.64 | 7.32 | 8.11 | 8.69 |
| Increasement of power saving ratio [%] | - | 1.46 | 2.15 | 1.57 | 0.78 | 0.68 | 0.68 | 0.79 | 0.58 |
Publisher’s Note: MDPI stays neutral with regard to jurisdictional claims in published maps and institutional affiliations. |
© 2021 by the authors. Licensee MDPI, Basel, Switzerland. This article is an open access article distributed under the terms and conditions of the Creative Commons Attribution (CC BY) license (https://creativecommons.org/licenses/by/4.0/).
Share and Cite
Kuo, C.-P.; Liao, H.-J. Challenge of Using Groundwater for Buildings Air Conditioning in Subtropical Areas. Sustainability 2022, 14, 364. https://doi.org/10.3390/su14010364
Kuo C-P, Liao H-J. Challenge of Using Groundwater for Buildings Air Conditioning in Subtropical Areas. Sustainability. 2022; 14(1):364. https://doi.org/10.3390/su14010364
Chicago/Turabian StyleKuo, Chih-Ping, and Hung-Jiun Liao. 2022. "Challenge of Using Groundwater for Buildings Air Conditioning in Subtropical Areas" Sustainability 14, no. 1: 364. https://doi.org/10.3390/su14010364
APA StyleKuo, C.-P., & Liao, H.-J. (2022). Challenge of Using Groundwater for Buildings Air Conditioning in Subtropical Areas. Sustainability, 14(1), 364. https://doi.org/10.3390/su14010364