Article

Analysis on Spatio-Temporal Characteristics and Influencing Factors of Industrial Green Innovation Efficiency—From the Perspective of Innovation Value Chain

1
School of Management, Shandong University of Technology, Zibo 255000, China
2
School of Business and Creative Industries, University of the West of Scotland, Paisley PA1 2BE, UK
*
Author to whom correspondence should be addressed.
Sustainability 2022, 14(1), 342; https://doi.org/10.3390/su14010342
Submission received: 26 November 2021 / Revised: 24 December 2021 / Accepted: 27 December 2021 / Published: 29 December 2021

Abstract

:
Green innovation has become an important combination of high-quality economic growth and ecological sustainability. In this paper, the super-efficiency network SBM model was used to measure the two-stage green innovation efficiency of the industrial technology research and development (R&D) stage and achievement transformation stage in China (30 provinces and cities) from 2009 to 2019. The results show the following points. Firstly, in terms of temporal series, the efficiency of technology R&D and achievement transformation has experienced three stages of “upward-declining-revitalized period”. Secondly, in terms of spatial trend, the industrial green innovation efficiency gradually increases from northwest to southeast. The high-efficiency areas are still concentrated in the eastern coastal region, with a clear trend towards balanced development in the central and western regions. Finally, openness, industrial structure, government technical expenditures, enterprise scale, and environmental regulation all have different degrees of impact on the efficiency of green innovation in the two stages. Based on the above, this paper is helpful for the government to formulate laws and regulations and coordinate the level of regional economic development and clarify the spatio-temporal characteristics and influencing factors of the efficiency of green innovation.

1. Introduction

The COVID-19 pandemic has brought tremendous changes to the world. “Green development” has become one of the development trends in the world, and especially “green recovery” has become a development goal of all around the world post-COVID-19 pandemic [1]. COVID-19 has brought severe challenges to China’s economic development and social stability. In the process of fighting COVID-19, China has achieved a stage victory. However, China’s weak industrial base and lack of experience in technological innovation have led to the decline in production efficiency of some industrial enterprises and slow output of innovative green products [2]. With the global spread of the COVID-19 pandemic, the core technologies and production equipment of industrial enterprises that rely on imports have also been impacted to varying degrees, and the disadvantages of low localization of high-end equipment are further reflected. In order to improve the technological innovation capability of Chinese industrial enterprises and adhere to sustainable development, and to mitigate the negative impact of COVID-19 pandemic, how to further improve the level of independent industrial innovation capability and green innovation has become an important issue.
As the baton of green economic development, the new development concept aims to reduce the additional environmental cost of economic growth [3] and promote the transformation of economic development from speed to quality. More importantly, the industrial industry, as the main battlefield of green innovation activities, is the backbone and important gripper of implementing scientific and technological innovation and plays an important role in promoting efficient and stable economic growth and enhancing comprehensive national strength. However, for a long time, in the development process of green innovation, “borrowlism” [4] and “empiricism” were prevalent. Industry–University–Research is seriously decoupled, the innovation elements are fragmented and patched, and the innovation driving ability is weak. In addition, the problems of unbalanced regional development, low efficiency of scientific and technological achievements transformation, and high additional environmental costs are becoming increasingly prominent, which seriously hinder the development of industrial green innovation to high quality, specialization, and deep level [5]. Therefore, how to effectively promote the coordinated development of industrialization and green innovation is very important. In addition, scientific measurement of industrial green innovation efficiency is a strategic measure to guide economic development from extensive to resource-saving and environment-friendly.
The concept of green innovation was first put forward by Fussler et al. [6]. They proposed that the coexistence of positive externalities of innovation results and positive externalities of environmental benefits is a typical feature of green innovation. At present, the academic definition of green innovation has not formed a unified conclusion. Starting from the goal orientation [7], some scholars believe that green innovation focuses on saving resources and reducing environmental pollution through technology R&D and clean energy production technology. From the perspective of the product life cycle, some scholars believe that green innovation can effectively reduce the cost of new products, which is reflected in a series of processes from technical concept to product R&D, to sales promotion, and finally to product marketization [8]. Generally speaking, green innovation is an integrated concept. Although different scholars have different definitions of its concept, it is generally believed that any creative behavior that is conducive to the harmonious development of “Economic-Resource-Environment” can be called green innovation.
At present, the research on green innovation mainly focuses on the following three aspects: discuss and measure the efficiency of green innovation; study regional (industry) differences of green innovation efficiency; analyze influencing factors of green innovation efficiency. Although academic research on green innovation has made rich achievements, there are still the following shortcomings. Firstly, most of the existing studies on green innovation efficiency only focus on the overall innovation input–output, and there is little phased analysis of innovation activities. However, in fact, the process of green innovation is made up of many sub-processes, such as R&D manufacturing, sales promotion, and product commercialization [9]. Secondly, most scholars examine the influencing factors of industrial green innovation efficiency from an overall perspective, ignoring that factors such as location resource endowment and corporate density may have different degrees of influence on the industrial green innovation efficiency in two stages, and treating them as a continuous process will hide the influence intensity of different stages on industrial innovation level. Therefore, this paper creatively decomposes green innovation into two stages, the technology R&D stage and achievement transformation stage, and discusses the life cycle and evolution of different stages, respectively.
In view of the above, based on the perspective of the innovation value chain, this paper uses the super-efficient network SBM model to calculate the efficiency of two-stage industrial green innovation in 30 provinces and cities in China from 2009 to 2019. At the same time, this paper also combined exploratory spatial data analysis (ESDA) and spatial econometric model to explore the temporal change characteristics and spatial evolution law of industrial green innovation efficiency and creatively analyzed the action mechanism of various influencing factors on green innovation efficiency (dividing the green innovation efficiency into two stages: technology R&D stage and achievement transformation stage). In addition, this study established the key factors affecting the efficiency of industrial green innovation and expects to provide targeted suggestions for improving the efficiency of China’s industrial green innovation from the perspective of regional coordination.
This paper attempted to answer the following questions: (1) What is the temporal series of China’s industrial green innovation efficiency? (2) What are the spatial distribution characteristics of industrial green innovation efficiency in various provinces and cities in China? (3) What is the mechanism of different driving factors on the industrial green innovation efficiency, and is there a spatial spillover effect?

2. Literature Review and Hypothesis Development

In recent years, green innovation has become a hot research topic in academic circles. Among them, green innovation efficiency, as the supplement and perfection of traditional efficiency, takes technological innovation, environmental friendliness, and resource conservation into consideration and becomes an important indicator of green innovation capability.

2.1. Research on the Scientific Measurement of Green Innovation Efficiency

There are abundant researches on the efficiency measurement of green innovation in academic circles, mainly including two methods: Firstly, there is the stochastic frontier analysis method (SFA). Zhang et al. [10] used SFA to build a three-stage combined efficiency measurement model to calculate the green innovation efficiency of high-tech industries in 28 provinces and cities in China. The second is data envelopment analysis (DEA). Jia et al. [11] discussed the efficiency of green technology innovation in 30 provinces in China through the traditional DEA-BCC model. Feng [12] aimed at the problem that the traditional DEA model ignores the “relaxation” of elements and cannot solve the unexpected output; the DEA-SBM model was used to measure the green innovation efficiency of eight economic regions in China and was compared with the traditional CCR model, and it was found that the SBM model is more realistic and the conclusion is more scientific. Therefore, the super-efficiency DEA model not only solves the problems of slack variables and unpredictable output but also overcomes the problem of not being able to compare the differences of the same decision-making units and has been widely used in efficiency measurement. For example, Dong et al. [13] used the super-efficiency SBM model considering unexpected output and exploratory spatial data analysis to deeply discuss the spatial evolution characteristics of green innovation efficiency in the Great Bay area of Guangdong, Hong Kong, and Macao. Cui et al. [14] used the super-efficiency SBM Malmquist index model to calculate the green innovation efficiency of 30 provinces in China from the dual perspective of environmental pollution and innovation quality.

2.2. Study on the Temporal and Spatial Correlation of Green Innovation Efficiency

The research on green innovation efficiency involves two levels: micro and macro. Micro-fields are mainly enterprises and industries, including tourism [15], manufacturing industry [16], high-tech industry [17], etc. This research focuses on the evaluation of green innovation efficiency to reduce the additional cost of an industrial (enterprise) development environment. For example, Silvestre et al. [18] believed that industrial enterprises in various regions of China are not independent individuals, and the geographical proximity makes the corporate technological innovation activities produce agglomeration effect and diffusion effect. Fritsch et al. [19] found that the flow of human resources and the exchange of technical information among industrial enterprises in different regions are helpful to promote the innovation activities of enterprises in neighboring regions, thus resulting in the spillover effect of green technology.
At the macro level, it is more inclined to regional studies such as provincial [20], urban agglomeration [21], and prefecture-level cities [22], which mainly emphasize the temporal change, spatial characteristics, and regional heterogeneity of green innovation efficiency. For example, Zhou et al. [23] found that there is significant spatial heterogeneity in China’s provincial green innovation efficiency, and the spatial transition shows a high degree of spatial stability. Chen et al. [24] studied the regional differences of industrial green technology innovation efficiency in China and found that the level of green technology innovation in eastern China is higher than that in central and western China, and the gap continues to expand. Xu et al. [25] studied the green innovation efficiency of the Yangtze River economic belt and found that there are obvious differences in the level of green innovation efficiency in the lower, middle, and upper reaches of the Yangtze River.

2.3. Research on the Driving Factors of Green Innovation Efficiency

Analysis of influencing factors of green innovation efficiency: Green innovation efficiency is affected by both the external environment and internal driving forces. From the perspective of external environmental factors, government technical expenditures and degree of openness [26] can significantly improve the efficiency of green innovation; the impact of environmental regulation [27] and industrial structure [28] on the efficiency of green innovation is diversified. From the perspective of internal driving factors, firm scale [29] is conducive to improving the level of green innovation. Although R&D investment [30] is conducive to improving corporate innovation efficiency, it needs to match the enterprise scale. Government innovation policy [31] can provide institutional guarantees for enterprises and avoid the risks encountered in the innovation process as much as possible. Gao et al. [32] believed that government innovation policies could significantly promote the efficiency of local green innovation. Because scholars choose different research areas and research methods, the research conclusions are not exactly the same.

2.4. Hypothesis Development

By focusing on the research of green innovation efficiency in spatiotemporal characteristics, Xu et al. [33] studied the panel data of China’s 31 provinces (municipalities and autonomous regions) from 2010 to 2018 and found that although China’s green innovation efficiency fluctuates, it generally shows a slow-growth trend. China’s regional green innovation efficiency is characterized by a stepped distribution that decreases from the east to the central and western regions, and the gap between the eastern and central regions is much higher than that between the central and western regions. There are great spatial differences in the regional green innovation efficiency in China. Du et al. [34] found that the regional green innovation efficiency in China showed a significant positive spatial correlation, which indicated that regional innovation activities had obvious spatial spillover and time effect, which was a dynamic process. Based on the above, this paper proposes Hypothesis 1 and Hypothesis 2.
Hypothesis 1 (H1).
In terms of temporal change, the two-stage industrial green innovation efficiency of China has a significant trend.
Hypothesis 2 (H2).
In terms of spatial change, the spatial agglomeration of two-stage industrial green innovation efficiency in China is becoming more and more obvious.
In terms of the driving mechanism of green innovation efficiency, scholars have explored the following contents. Ghisetti et al. [35] explored the impact of enterprise openness on manufacturing enterprises’ access to green innovation resources. Du et al. [28] believed that the industrial structure improves the green technology innovation efficiency in the region and has a significant spatial spillover effect on the surrounding areas. This is because the upgrading of the industrial structure not only promotes economic growth but also reduces pollution emissions and energy consumption, which is conducive to the improvement of green innovation efficiency. The government technical expenditures also provide a good development environment for enterprises to carry out green innovation activities, thus promoting green innovation. Lin et al. [36] found that there is a negative correlation between enterprise scale and industrial green technology innovation efficiency; that is, the larger firms showed smaller efficiency. Because with the expansion of enterprise scale, energy consumption and pollution also increase, which offset the economies of scale, thus reducing the green innovation efficiency. Du et al. [28] found that moderate environmental regulation policies can promote green technology innovation, and severe environmental regulation policies can hinder green technology innovation. Therefore, this paper proposes hypothesis 3.
Hypothesis 3 (H3).
Openness, industrial structure, government technical expenditures, firm size, and environmental regulations: the above internal and external influencing factors have different degrees of influence on the two-stage green innovation efficiency.

3. Research Methods and Index Selection

3.1. Model Selection

3.1.1. Super-Efficient Network SBM Model

Through the literature search, it was found that the methods used in the study of green innovation efficiency are constantly improving. The traditional DEA model mainly focuses on radial distance. In terms of inefficiency measurement, only the proportion of input and output reduced or increased was considered, without considering the part of relaxation improvement. The SBM model proposed by Tone et al. [37] is helpful to solve this problem. Compared with the traditional DEA model, the super-efficiency network SBM model can explain the internal operation law of the green innovation system, open the “black box” of innovation activities, decompose it into multiple sub-processes, and locate the specific source of output inefficiency. In addition, the model modifies the constraints based on input–output angle, which greatly improves the measurement accuracy.
In this paper, the two-stage industrial green innovation efficiency was studied based on the super-efficiency network SBM model considering unexpected output from a non-radial angle. The slack variable is placed into the objective function, which solves the slack problem of input and output in the traditional DEA model, and at the same time, solves the efficiency problem when considering unexpected output, and can evaluate the efficiency of industrial green innovation more effectively. At the same time, considering that there is more than one effective efficiency value obtained by simply using the network SBM model, it is difficult to distinguish the value of effective efficiency. Therefore, using the super-efficiency network SBM model to evaluate the efficiency of industrial green innovation can more accurately obtain the overall efficiency and two-stage efficiency, which is conducive to comparing the differences of efficiency values.
Based on the previous research [33], this paper calculates the two-stage green innovation efficiency through the super-efficiency network SBM model. The specific equations are as follows.
ρ 0 = min k = 1 K w k [ 1 + 1 m k i = 1 m k s i k x i 0 k ] k = 1 K w k [ 1 1 u 1 k + u 1 k ( r = 1 u 1 k s r d k y r 0 d k + r = 1 u 2 k s r b k y r 0 b k ) ] s . t .   x 0 k j = 1 , 0 n λ j k x j k + s k ,   y 0 d k j = 1 , 0 n λ j k x j d k + s d k , y 0 b k j = 1 , 0 n λ j b y j b k s b k ,   ε 1 - 1 u 1 k + u 1 k ( r = 1 v 1 k s r d k y r 0 d k + r = 1 v 2 k s r b k y r 0 b k ) , z ( k , h ) λ h = z ( k , h ) λ k ,   j = 1 , 0 N λ j k = k = 1 K w k = 1 , λ k 0 , w k 0 , s k 0 , s d k 0 , s b k 0
ρ 0 1 = 1 + 1 m 1 i = 1 m 1 s i 1 x i 0 k 1 1 ψ r = 1 ψ s r 1 + z r 0 , ρ 0 2 = 1 + 1 ψ r = 1 ψ s r 1 + z r 0 1 1 u 12 + u 22 ( r = 1 u 12 s r d y r 0 d + r = 1 u 22 s r b y r 0 b )
where n stands for 30 provinces and cities of the decision-making unit, and mk and uk represent input and output, respectively. Ψk is the number of intermediate indicators. x j k represents the input of stage k. Yd and Yb matrices represent expected output and unexpected output, respectively. z j ( k , h ) represents the intermediate product between node k and node h. λk and wk represent the K-stage model and node weight, respectively. s i 1 , s r 1 + , s r d , and s r b represent the slack variables of input and output in the first stage and the second stage, respectively. u12 and u22 are the numbers of expected outputs of the second stage, respectively. ρ 0 , ρ 0 1 , and ρ 0 2 , respectively, represent the overall efficiency of green innovation, the efficiency value of the first stage, and the efficiency value of the second stage.

3.1.2. Kernel Density Estimation

Kernel density estimation, as a non-parametric estimation method, has the advantage that it does not need the specific form of preset function, thus avoiding the sensitivity to the set model [38]. Assuming that the probability density of continuous random variable x at x0 is f(x0), the specific equation is:
f ( x ) = 1 N h i = 1 N K ( X i x h )
where N represents the number of research samples, Xi represents the independent identically distributed observations, x is the average value, and h is the Bandwidth. The function K represents the kernel density function. In this paper, the Gaussian kernel function is used to study the efficiency of industrial green innovation dynamically.

3.1.3. Spatial Econometric Model

Different from traditional regression methods, the spatial econometric model can effectively solve the complex problem of spatial dependence. The commonly used models in previous research mainly include the spatial autoregressive model (SAR), spatial error model (SEM), and spatial Dubin model (SDM).
In addition, in the empirical analysis part of this paper, the econometric regression results of the three models are displayed. After comparing R2 with the maximum likelihood estimation (MLE), the optimal econometric regression result was selected for further analysis. In order to better test the reliability of the empirical analysis results, the author also added the regression analysis results of the general linear model; for details, see Section 4 of the article.
Because the spatial Dubin model (SDM) considers the spatial correlation of dependent variables and independent variables at the same time, it has a stronger explanatory ability. Therefore, this paper takes the spatial Dubin model as the starting point of econometric model analysis, and its general form is as follows:
ln E f f i , t = ρ W ln E f f j , t + γ i W X i , t + β i X i + μ t + η i + ε i , t
Based on the theoretical model derivation, the empirical model of this paper is:
ln E f f i , t = ρ W ln E f f j , t + γ 1 W ln E S + γ 2 W ln I N S + γ 3 W ln O P E N + γ 4 W ln G O V + γ 5 W ln E R + β 1 ln E S + β 2 ln I N S + β 3 ln O P E N + β 4 ln G O V E + β 5 ln E R + μ t + η i + ε i , t
In the equation, ρ represents the spatial lag item coefficient, γi is the spatial autoregressive coefficient of the explanatory variable. μt and ηi represent individual fixed effect and time fixed effect, respectively. εi,t is a random interference term.

3.2. Index Selection

For variable selection, referring to the research results of Nasierowski et al. [39], green innovation is divided into two stages: technical R&D and achievement transformation. The details are as follows.
Input indicators for phase I: The input factors of green innovation mainly consider both human and capital factors. For the capital input of green innovation, previous research usually uses R&D expenditure to express it. However, this approach ignores the effect of the previous capital stock on innovation results and fails to reflect the cumulative effect and time lag effect of capital input on green innovation. Therefore, based on the treatment method of Chen et al. [40], this paper uses the perpetual inventory method to calculate the R&D capital stock of each region. Manpower input is usually expressed by the number of R&D personnel or the full-time equivalent (FTE) of R&D practitioners [41]. Considering that both the labor force and the length of practical work have an impact on green innovation activities, this paper believes that the latter can better represent the level of human input.
Input indicators for phase II include intermediate output and additional input. The green intermediate output of innovation mainly refers to technical output. This paper selects the total number of patent applications, the number of invention patents, and the number of new product development projects to represent the technical output. The additional investment includes R&D funds for new products, purchase of domestic technology, and total industrial energy consumption. In addition, as an important participant in green innovation activities, industrial enterprises need to consume a lot of energy in the process of green innovation. Therefore, the total industrial energy consumption is selected as an additional investment.
The final output indexes mainly include economic output and unexpected output. As for economic output, most of the existing researches adopts economic scale or sales revenue of new products. Considering the overlap of the two data and the fact that the sales revenue of new products can better reflect the profit-making ability of green innovation, the sales revenue of new products is selected as the representative. The characteristics of accidents are industrial SO2 discharge, industrial wastewater discharge, industrial solid waste discharge, and industrial smoke (powder) dust discharge. These four indicators can reflect the direct impact of excessive resource consumption, unreasonable industrial structure, and extensive production mode on the environment in the process of innovation. Specific indicators are shown in Table 1.

3.3. Data Collection

The selected sample data of 30 provinces (cities and autonomous regions) in China from 2009 to 2019: Considering the availability and authenticity of the data, the sample does not include Tibet Autonomous Region, Hong Kong, Macao, and Taiwan. The index data come from China Statistical Yearbook, China Science and technology statistical yearbook, China Industrial statistical yearbook, China Patent statistical annual report, and EPS database over the years. For the missing data of the year, the interpolation method is used to supplement.

4. Result

4.1. Temporal and Spatial Evolution of Industrial Green Innovation Efficiency

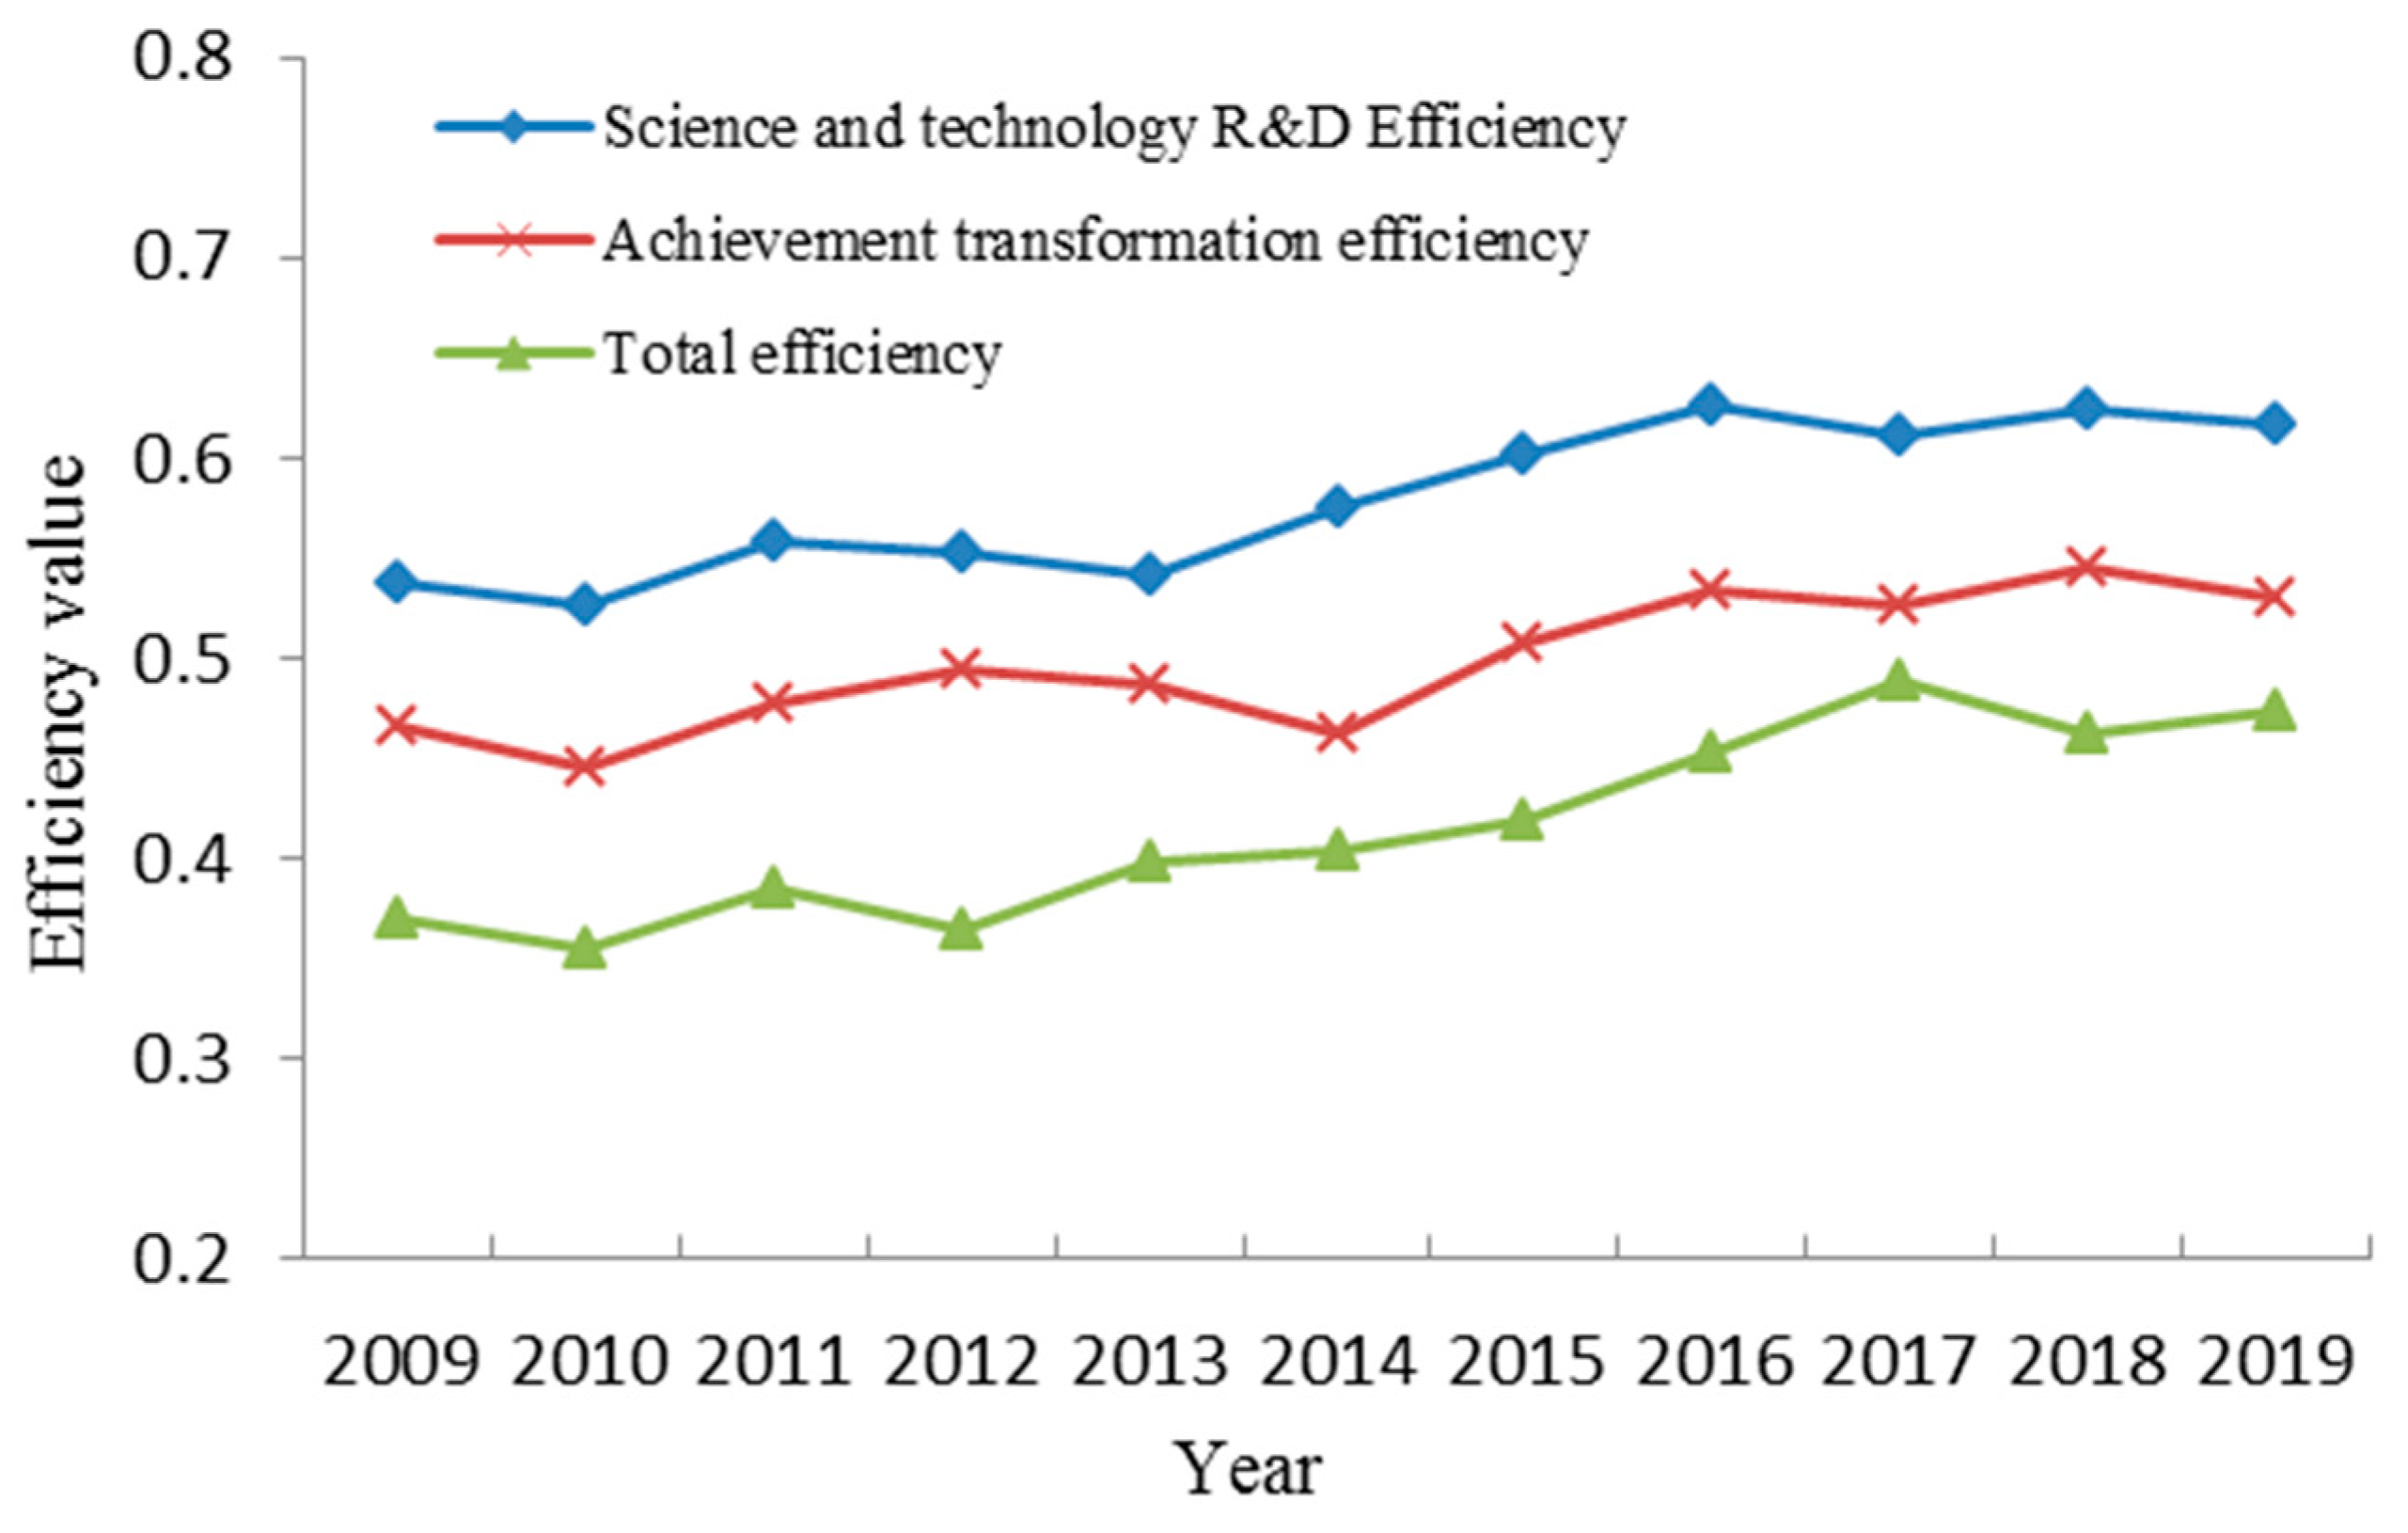
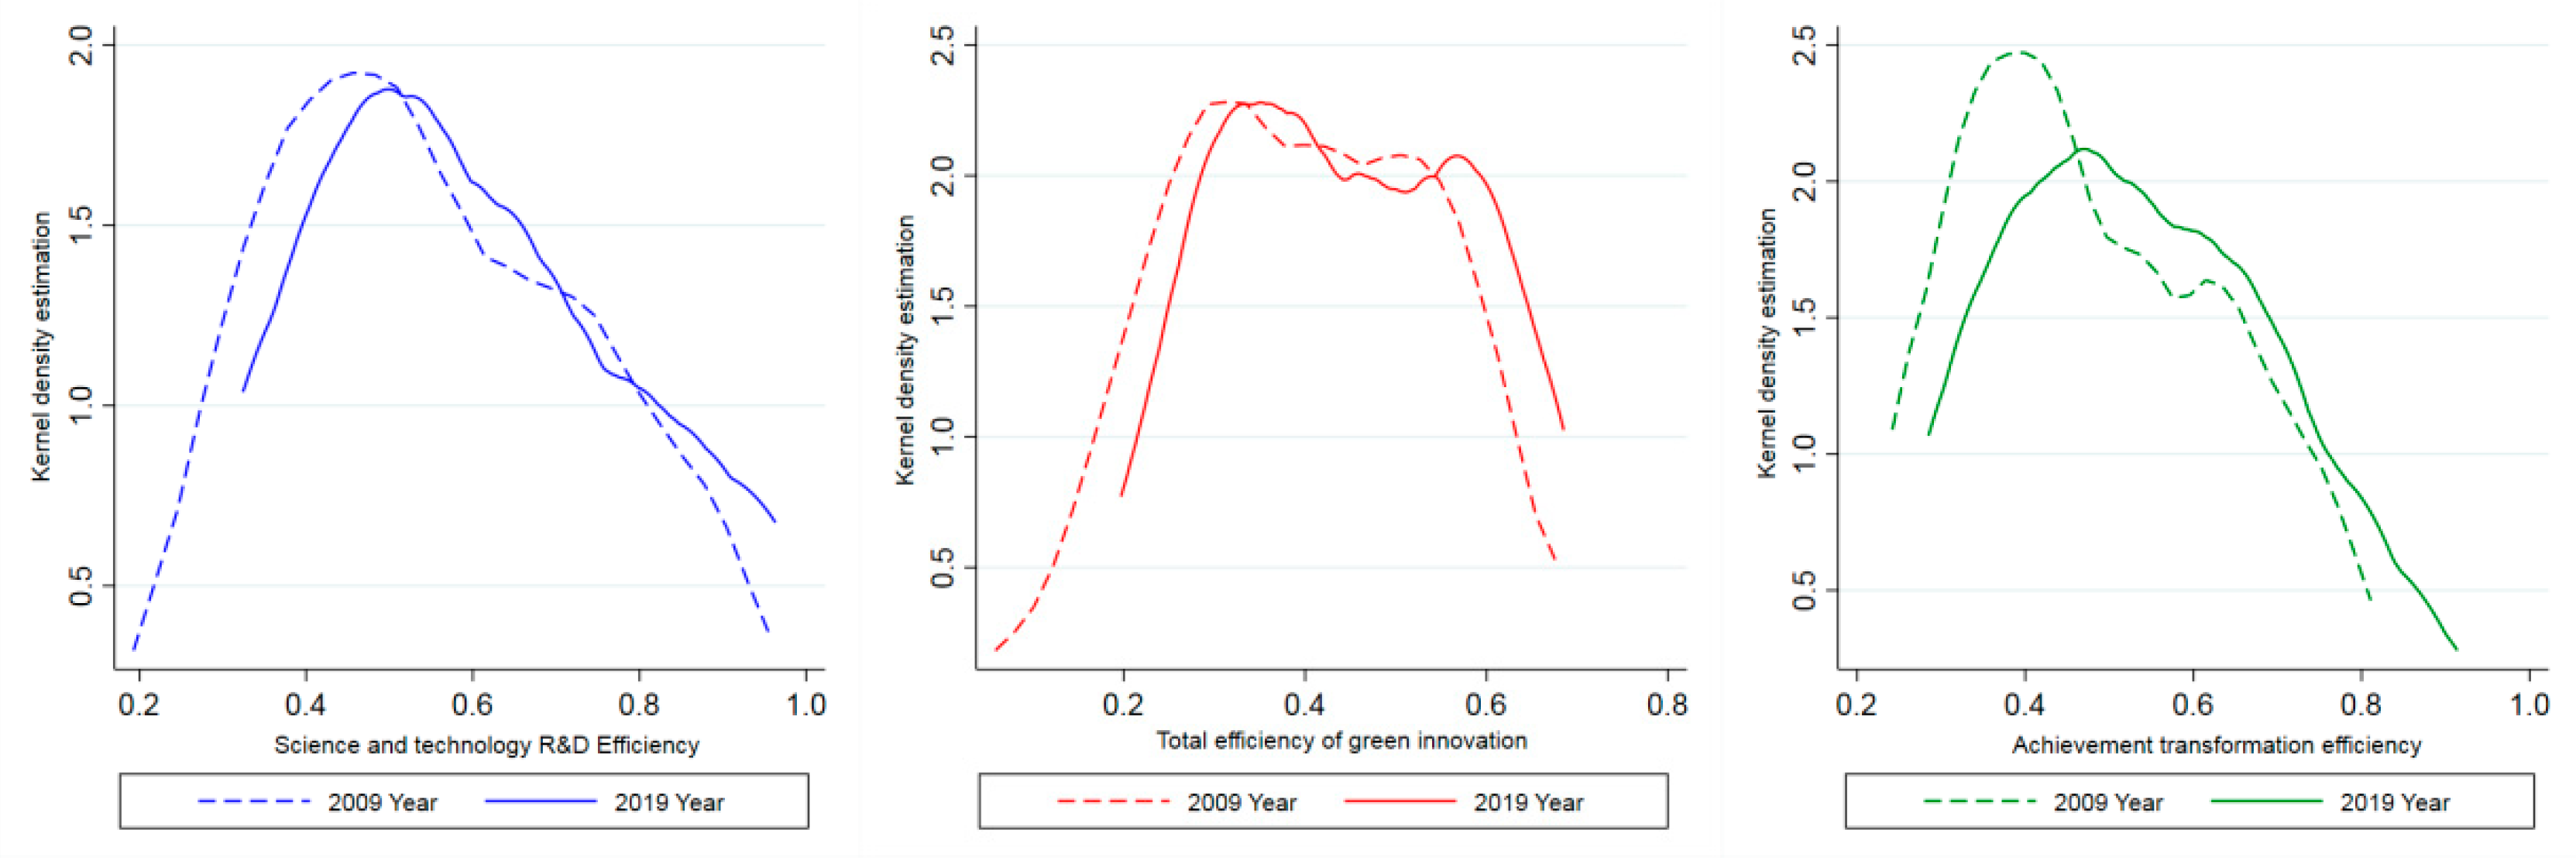
4.1.1. Analysis of temporal Series Characteristics of Industrial Green Innovation Efficiency

The network DEA-SBM model is used to calculate the R&D efficiency of science and technology, achievement transformation efficiency, and total efficiency of industrial green innovation in 30 provinces and cities of China.
The results show that (Figure 1) the average total efficiency is in a fluctuating upward trend from 2009 to 2019, but the efficiency values are lower than 0.5, which indicates that although industrial green innovation has been steadily improved, it is still at a low level. The allocation of innovation resources needs to be further optimized, which has great room for improvement.
There are two main reasons for the steady increase in the efficiency of Industrial Green Innovation: Firstly, China’s economy is in the primary stage of gradually changing from the “three high and one low” [42] black development model transform into the innovation-driven green development pattern [43], which has increased the space for enterprise innovation activities, increased the initial investment in innovation and development, accelerated the pace of building an innovative country, and a variety of factors jointly drive the improvement of industrial green innovation efficiency. Secondly, under the constraints of ecological civilization construction in recent years, China’s economy has gradually transformed from “rapid development” to “high-quality development” [24]. The government has increased investment in environmental protection, strengthened environmental pollution control, improved resource utilization efficiency through environmental regulation, improved the green innovation environment of enterprises, and forced enterprises to improve production methods and innovation ability.
It can be seen from Figure 1 that, in terms of stages, the efficiency of technology R&D and achievement transformation efficiency showed the evolution trend of “rising-declining-rising”. In the stage of technology R&D, with the deepening understanding of new development concepts, the initial resources such as scientific research funds and human capital are increased. Local governments pay attention to the introduction and cultivation of high-tech talents and constantly introduce policies conducive to innovation, which have laid a good environment for innovation activities of enterprises, created an efficient and convenient green channel, promoted the efficiency of scientific and technological research and development, and provided preconditions for the output of knowledge achievements. In the stage of achievement transformation, the efficiency of achievement transformation is far lower than that of scientific and technological research and development. The reason is that, on the one hand, China’s market of scientific and technological achievements is still in its infancy, the absorption and transformation ability of innovation achievements is relatively weak, and the market service system is imperfect, and the resource ratio is unreasonable. The excessive emphasis on the economic benefits brought by achievement transformation leads to the problems of input redundancy and output inefficiency, which leads to low marketization efficiency in the stage of achievement transformation. On the other hand, the efficiency of achievement transformation depends on the efficiency of technology R&D. Because of the long research period, slow effectiveness and certain lag in the stage of scientific and technological research and development, and the slight increase in knowledge achievements, such as papers, works, and appearance patents, etc., the efficiency of achievement transformation is low. Therefore, improving the market transformation efficiency of scientific and technological achievements becomes the key to improving the efficiency of industrial green innovation.
In order to further reveal the dynamic evolution characteristics of green innovation efficiency in two stages of the industry, the kernel density estimation method is used to investigate the changes of efficiency curve distribution and peak shape, as shown in Figure 2. During the research period, the core density curves of the total efficiency of industrial green innovation, the efficiency of scientific and technological R&D, and the efficiency of achievement transformation gradually moved to the right with the passage of time, but the moving range was small, and the left skewness distribution of each curve was basically the same. This phenomenon indicated that the efficiency showed an increasing trend as a whole, but it was still dominated by low-efficiency areas. From the peak shape, the total efficiency of green innovation has gradually formed a pattern of “one master and one time”, with the curve on the right side of 0.8 increasing, the overall development trend is good, and the pattern of “polarization” has gradually become prominent. The peak value of achievement transformation efficiency decreased noticeably, the peak value degenerated into a broad peak, the regional differences narrowed, and the high-efficiency areas increased. In this regard, inter-regional exchanges and cooperation should be strengthened to form the “technology catch-up” effect in low-efficiency areas and promote the transformation and upgrading of industrial structures.

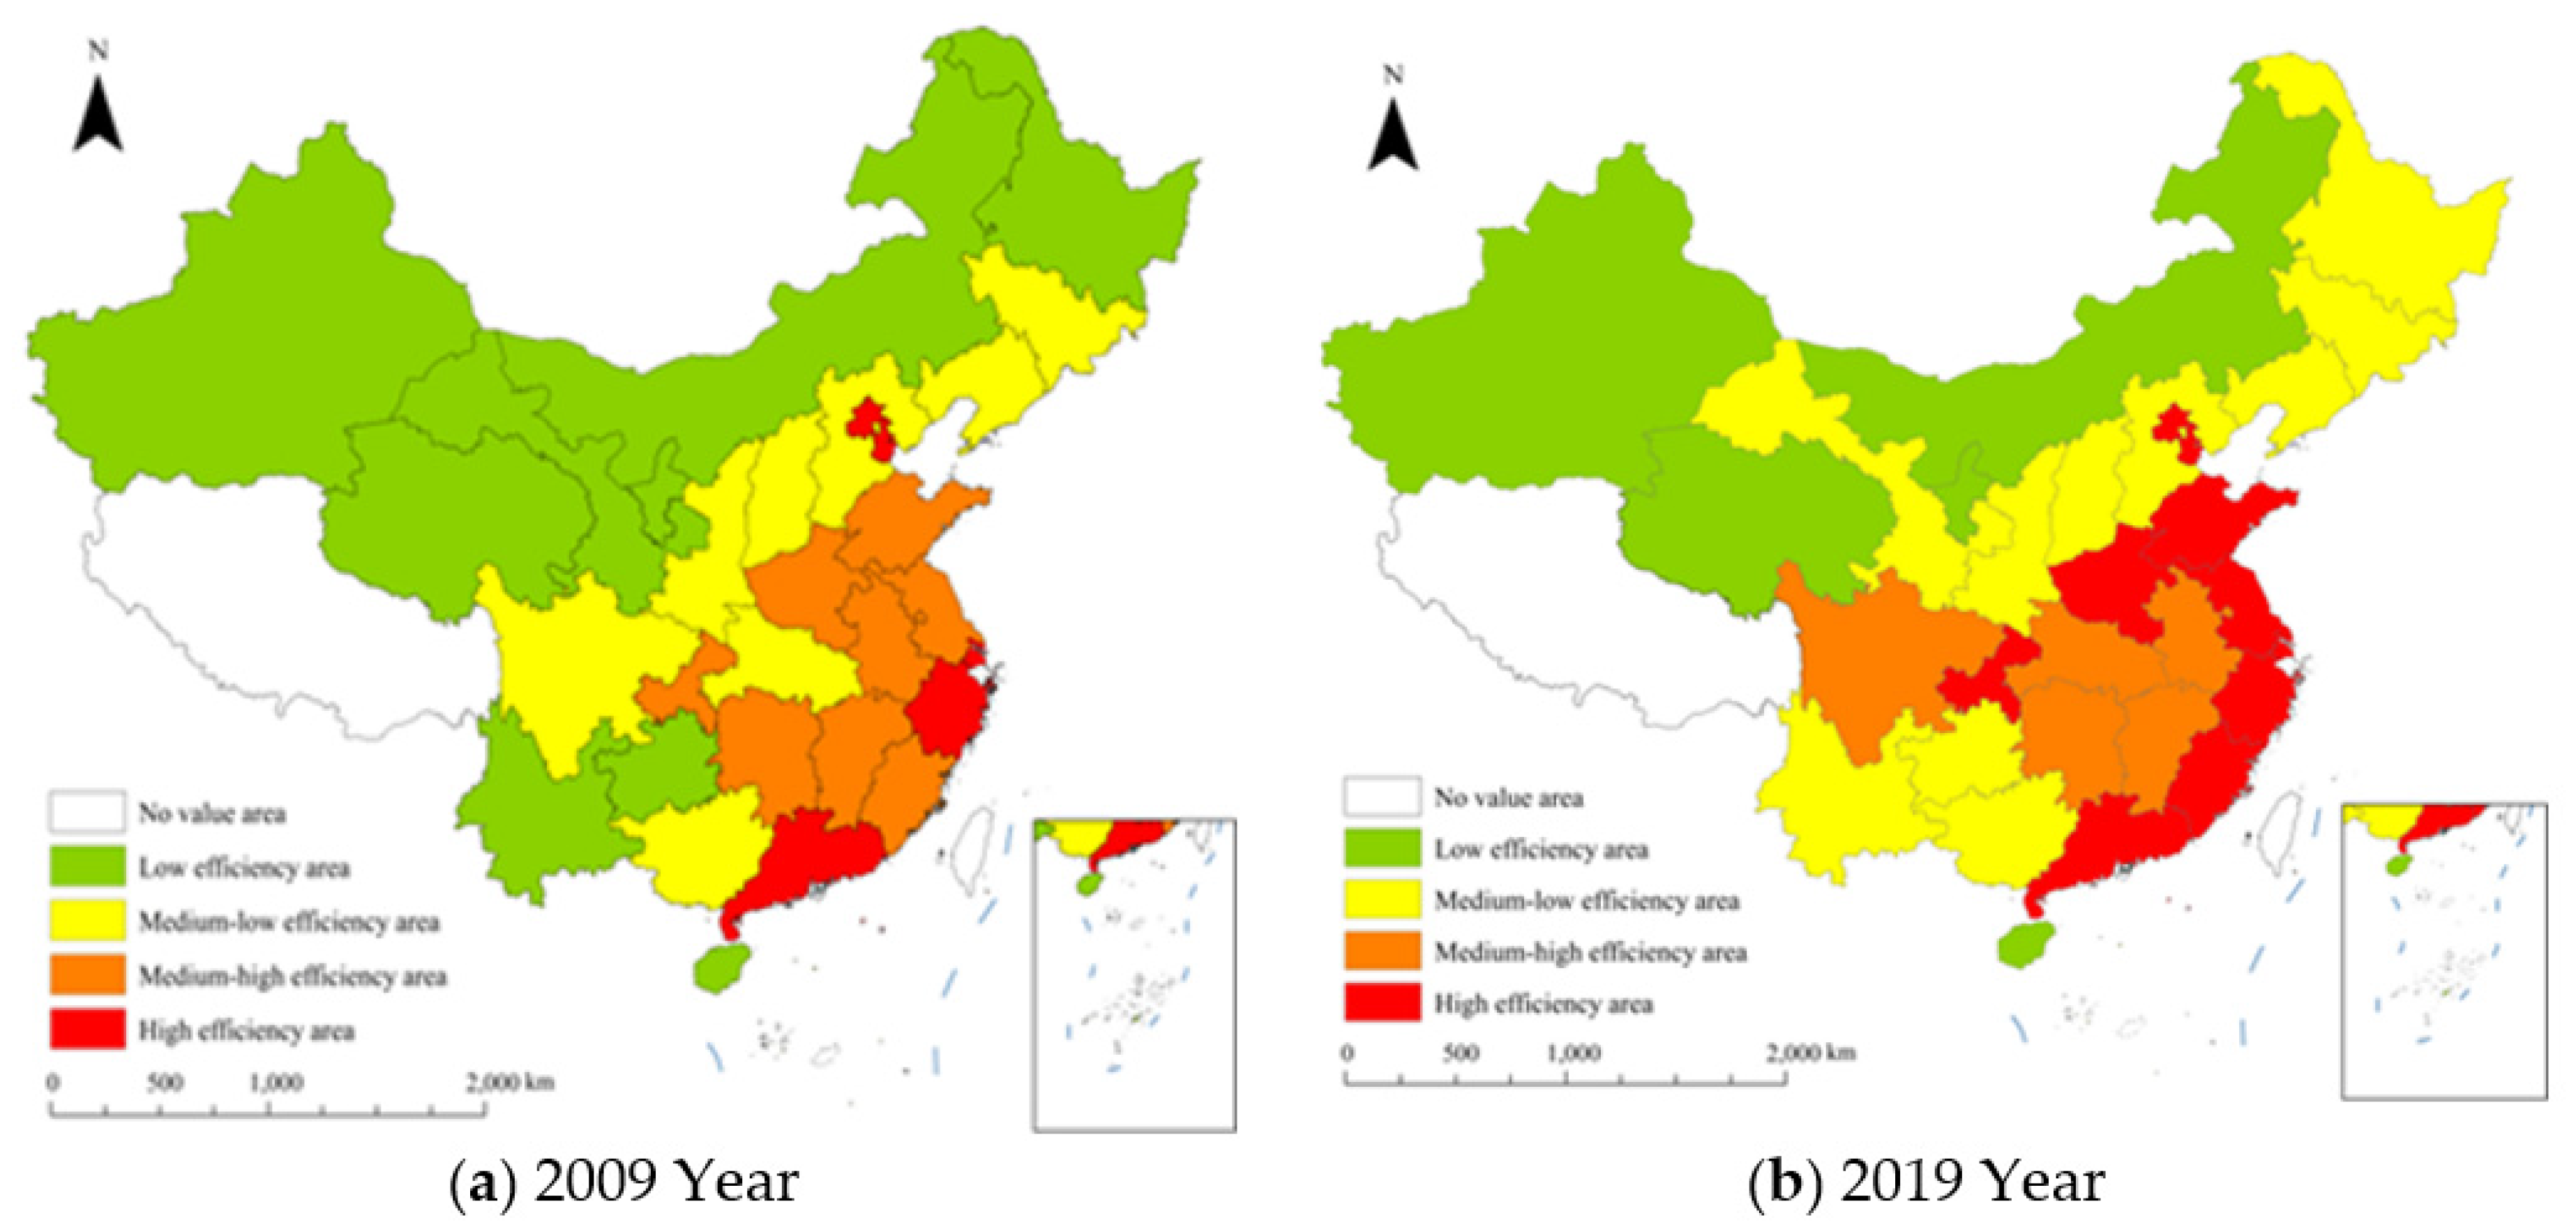
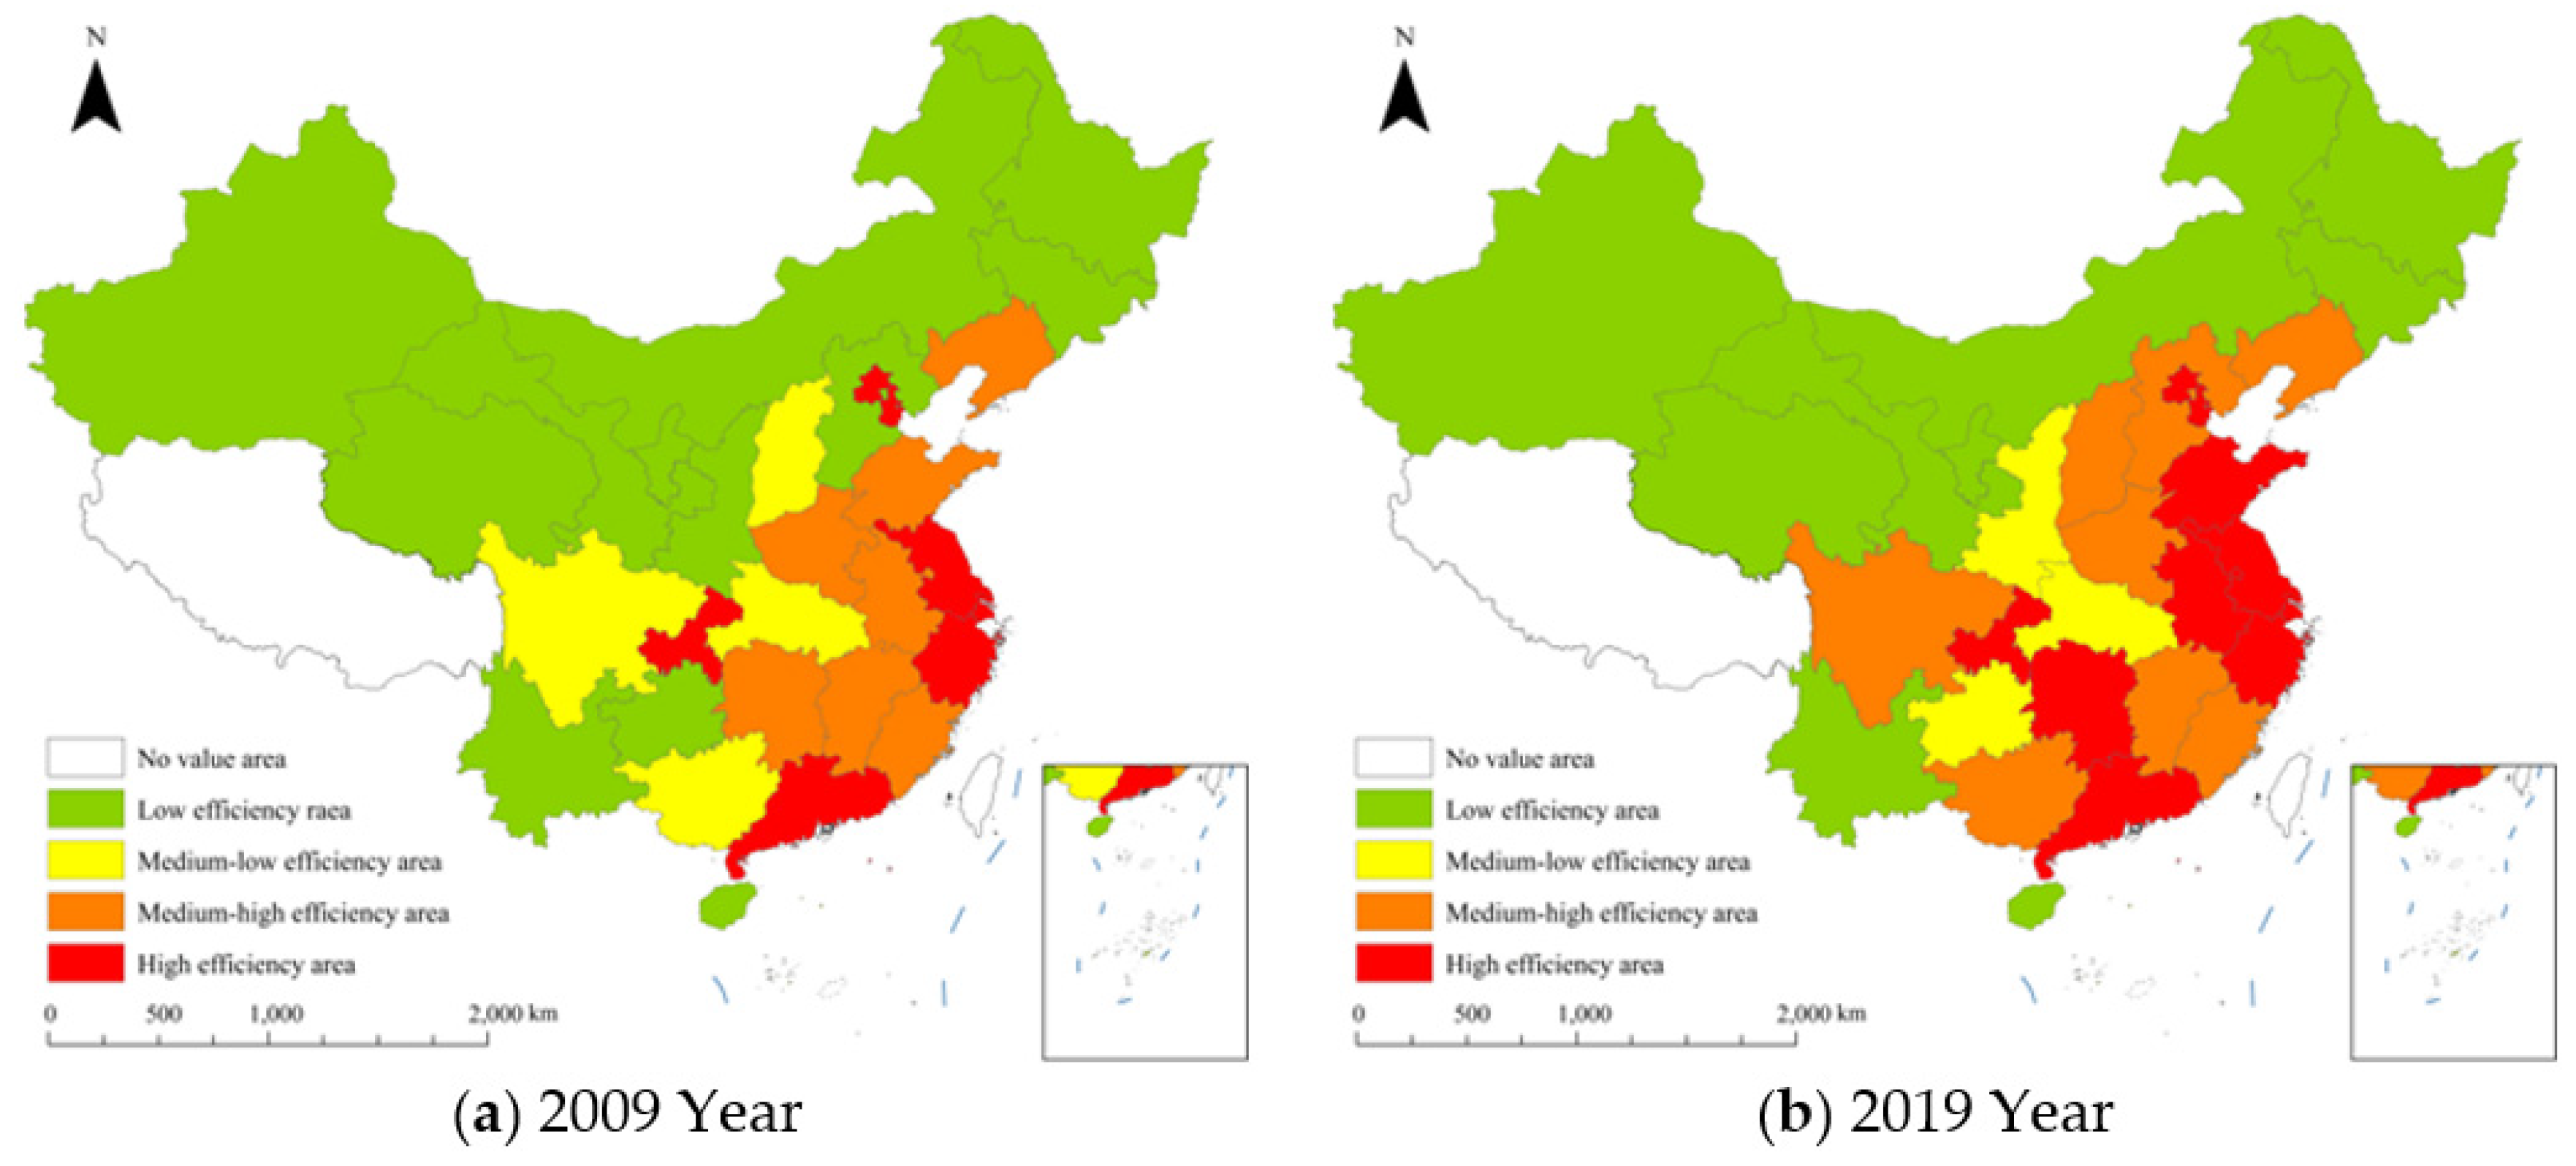
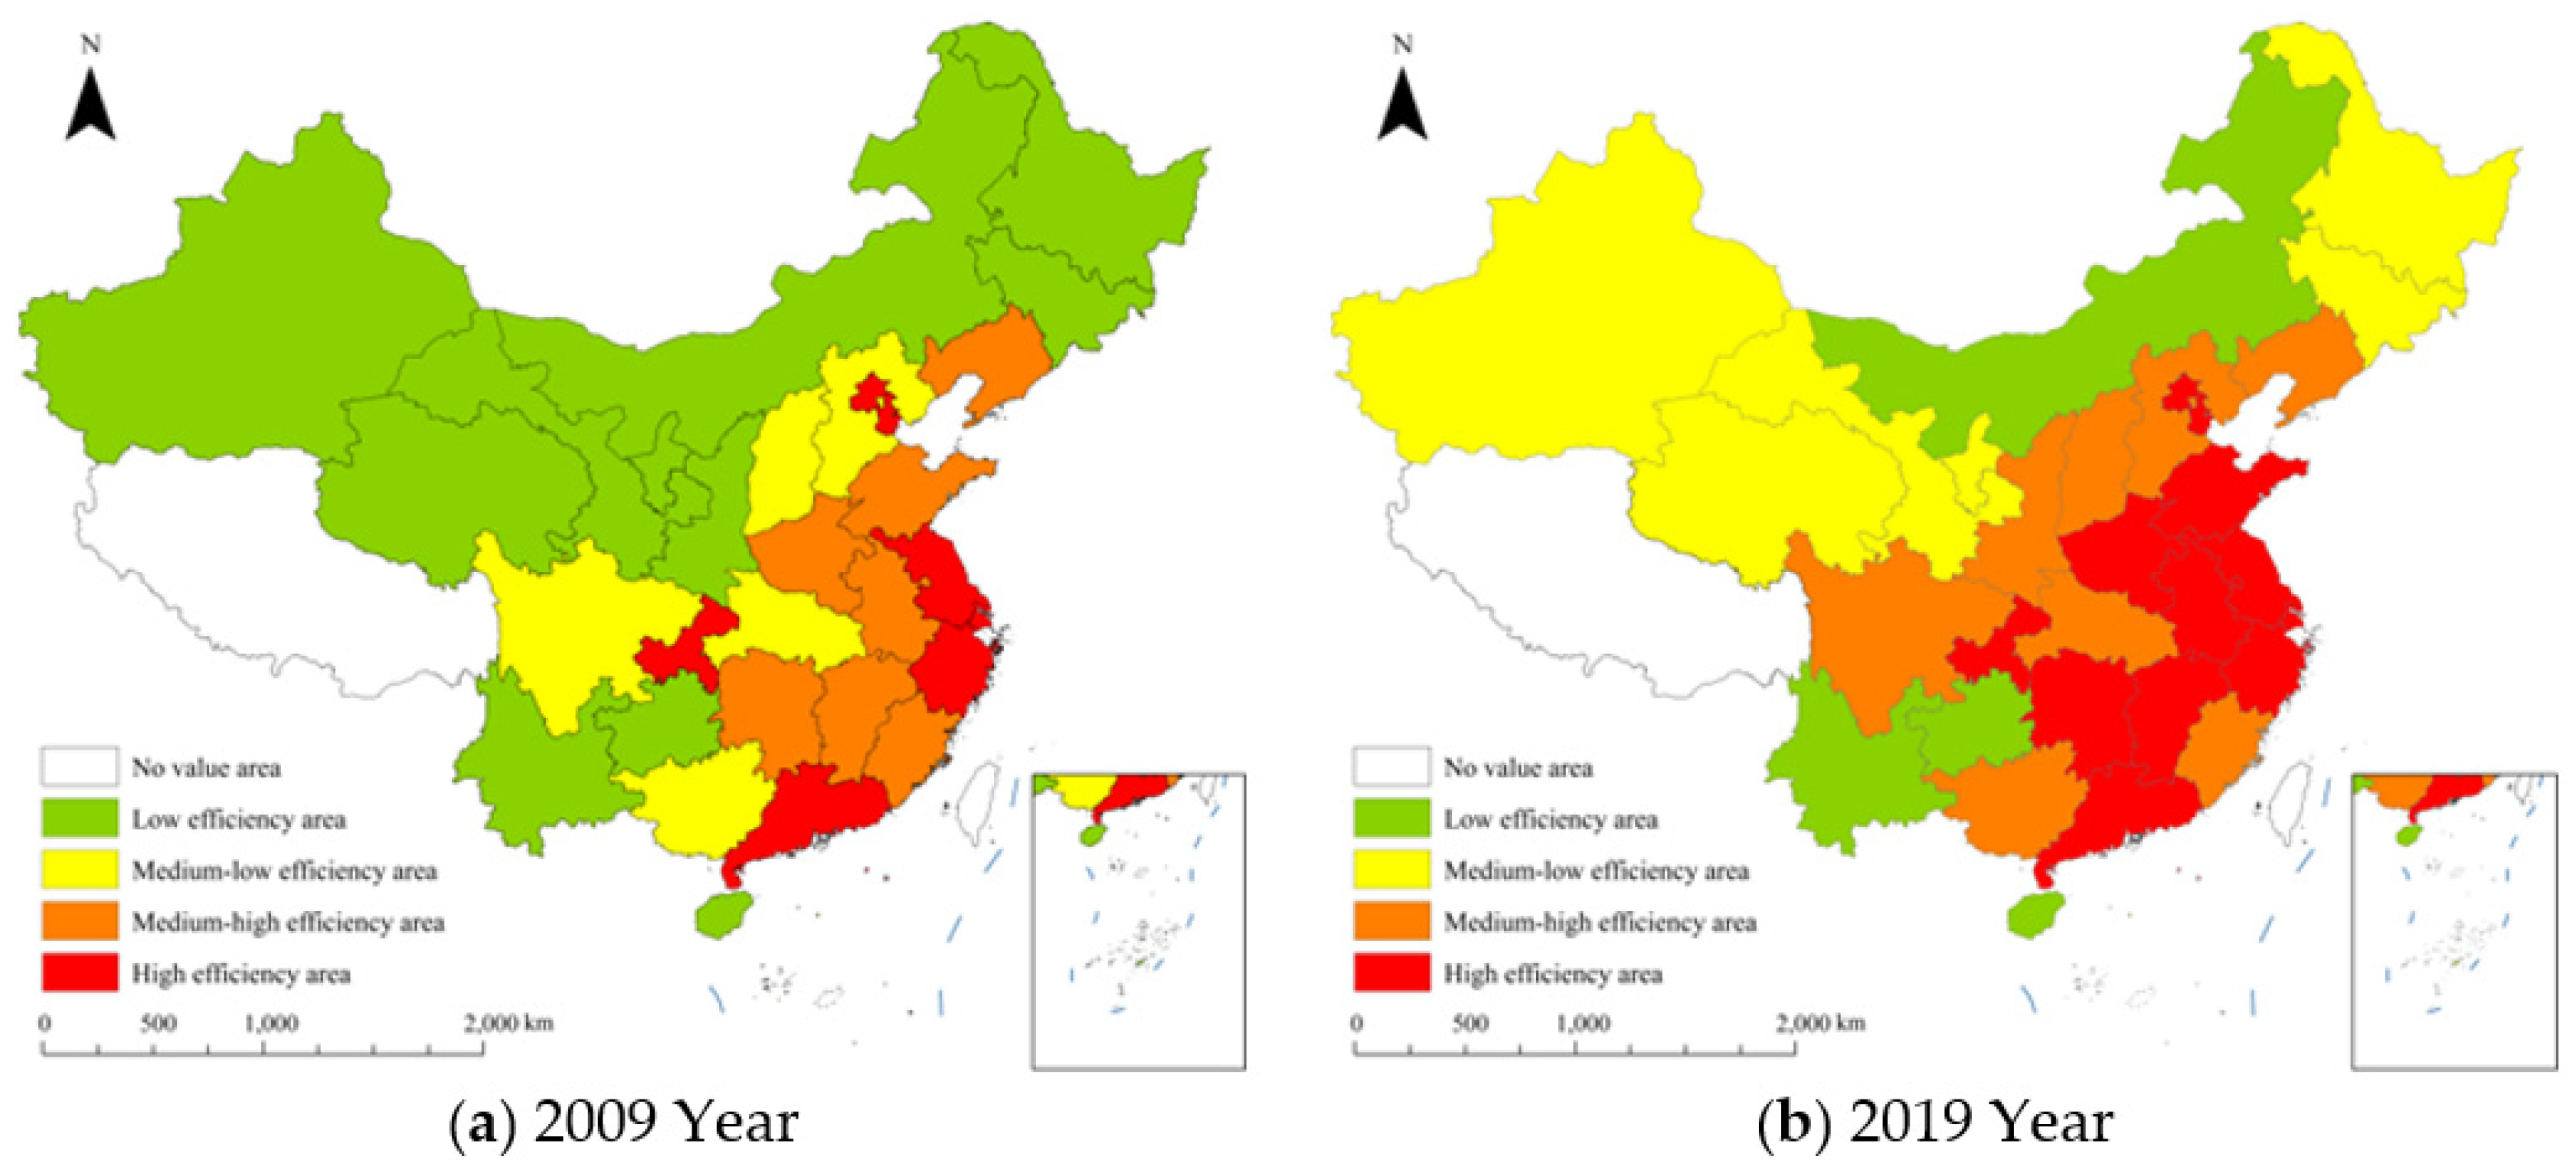
4.1.2. Analysis of Spatial Characteristics of Industrial Green Innovation Efficiency

With the help of ArcGIS 10.2 software, the spatial distribution map of industrial green innovation efficiency in 2009 and 2019 was drawn, and the total innovation efficiency, scientific and technological research and development efficiency, and achievement transformation efficiency were divided into four grades by using natural breakpoint method, which was low-efficiency zone, medium–low-efficiency zone, medium–high-efficiency zone, and high-efficiency zone from low to high. From the total efficiency of green innovation (Figure 3), during the inspection period, Beijing, Tianjin, Zhejiang, Guangdong, and Shanghai were always located in high-efficiency areas. Compared with 2009, Shandong, Henan, Anhui, Jiangsu, Fujian, Sichuan, and other provinces joined the high-efficiency zone, while Yunnan, Guizhou, Gansu, Heilongjiang, and other provinces withdrew from the low-efficiency zone. The relative changes between the provinces in the medium–low-efficiency zone and the medium–high-efficiency zone were relatively stable, accounting for about 60% all the time. From the spatial distribution pattern, it can be seen that in 2009, the efficiency of industrial green innovation showed the distribution law of increasing gradually from northwest to southeast.
Among them, the high-efficiency areas are mainly distributed in the southeast coast (Shanghai, Zhejiang, Guangdong) and Beijing–Tianjin–Hebei region, while the medium–high-efficiency areas are mostly concentrated in North China (Shandong, Anhui, etc.) and South China (Hunan, Jiangxi, etc.), while the medium–low-efficiency areas are mainly distributed in the chain of “Jilin-Hebei-Shaanxi-Sichuan”, and the low-efficiency areas are concentrated in the northwest connecting areas (Xinjiang, Inner Mongolia, Gansu, etc.) and the southwest.
In 2019, the “ladder” feature of the spatial distribution of industrial green innovation efficiency is further highlighted, which is characterized by concentrated and contiguous “linear” and “block-shaped” distribution, with the most significant difference in southwest China, where the high-efficiency areas are still concentrated in coastal areas, and the range of low-efficiency areas is further expanded, forming high-efficiency “uplift areas” in Beijing, Tianjin and Sichuan. Specifically, the high-efficiency areas have greatly expanded, mainly distributed in the Bohai Sea, East China Sea, South China Sea, and along the Yangtze River basin (Shandong, Jiangsu, Zhejiang, Guangdong, Chongqing, etc.), while the medium–high-efficiency areas and medium–low-efficiency areas are mainly distributed in northeast China (Heilongjiang, Jilin, Liaoning), North China (Hebei, Shanxi, etc.), South China (Hunan, Jiangxi, etc.), and southwest China (Yunnan, Guizhou, etc.).
It can be seen that during 2009–2019, the overall level of industrial green innovation efficiency has improved, the development of the eastern region has been steadily rising, and the central and western regions have gradually developed towards equilibrium and high efficiency. The evolution pattern of polarization of provincial green innovation efficiency in China needs to be improved urgently.
By stages (Figure 4 and Figure 5), the efficiency of green innovation in seven provinces (cities) such as Beijing, Shanghai, Sichuan, Zhejiang, etc. is in the high-efficiency zone in two stages, which is mainly due to its superior geographical location, strong economic foundation, developed private economy and preferential national policies, and the use of local advantages for gathering a large number of high-tech industries and high-tech talents, which provides preconditions for efficient green innovation. For example, Zhejiang Province first established an online technology market to build a bridge for the transformation of scientific and technological achievements, and now it has become a “depression” for the latest technological achievements and technological demand transactions in Zhejiang Province and even the whole country. After 2008, Chongqing introduced a large number of leading enterprises mainly engaged in electronic information, such as Foxconn and Hewlett–Packard, which became an important support point and foothold for industrial transfer in western China. Shandong, Anhui, and Hunan have achieved rapid improvement in the efficiency of R&D and achievements transformation, and all of them will join the high-efficiency zones by 2019. These three provinces have invested heavily in basic research R&D and are important R&D bases and knowledge condensation places in China. The innovation efficiency of North China (Henan, Hebei, Shanxi, etc.) and South China (Hubei, Jiangxi, Fujian, etc.) has been improved to varying degrees, mainly concentrated in the high-efficiency areas and medium–high-efficiency areas, mainly because these provinces are adjacent to the eastern coastal areas or located along the two major river basins, with a high level of economic development and relatively abundant innovation resources, and there is much room for improvement. The technological innovation in Northeast China (Heilongjiang, Jilin) and Northwest China (Xinjiang, Qinghai, Gansu, Ningxia) has a small change range and is still in a low-efficiency area. However, the transformation efficiency of its achievements increased rapidly, and all of them entered the lower efficiency zone. Yunnan, Hainan, and Inner Mongolia are all in low-efficiency areas. Influenced by geographical location, economic conditions, talent guarantee, and other factors, these provinces have unbalanced input and output of scientific and technological innovation and uncoordinated connection between two stages of innovation, resulting in weak innovation ability and achievement transformation ability, thus inhibiting the improvement of industrial scientific and technological research and development and achievement transformation efficiency.
It can be seen from Figure 4 and Figure 5. From the spatial distribution pattern, it can be seen that the efficiency of scientific and technological R&D and achievement transformation in the eastern region is at the leading level. This is because the industry and high-tech industry in the eastern region started earlier and developed rapidly. The investment of initial innovation resources such as human capital is sufficient, the advantages of economic scale and innovation environment are significant, and by relying on the advantages of the natural location to attract foreign investment, learning from foreign advanced technology level and management experience, it took the lead in becoming the key promotion area and leading area of domestic green innovation development strategy. In addition, policy support further enhanced the green innovation advantages of the eastern region.
However, the efficiency of scientific and technological R&D in the western region has increased slowly and changed slightly, but the efficiency of achievement transformation has increased rapidly, which is basically consistent with the national average growth level. This is mainly due to the efficient utilization of innovative resources in Sichuan, Chongqing, and other places, providing scientific and technological talent guarantee for enterprises, and further broadening the achievement transformation platform with the support of the western development policy so that scientific and technological achievements can fully create economic value.

4.2. Analysis on Influencing Factors of Industrial Green Innovation Efficiency

Index Selection of Influencing Factors

The influencing factors of China’s industrial green innovation efficiency are complex and diverse. Most scholars use traditional measurement methods such as least squares regression and the Tobit model to discuss the aspects of government support and education level. The research process often ignores the spatial heterogeneity of samples. Based on the existing research results [44], this paper comprehensively investigates the industrial distribution characteristics and development status, enriches and improves the influencing factors of industrial green innovation efficiency, and constructs the influencing factor index system from five aspects: enterprise-scale, opening-up level, industrial structure, government science and technology expenditure, and environmental regulation.
Enterprise scale (ES): There are two main viewpoints on the relationship between enterprise scale and industrial green innovation. The first is is that the enterprise scale determines its ability to obtain economy. The larger the scale is, the more conducive it is to green innovation, and there is a positive correlation between them [36]. Another view is that large-scale enterprises will lead to problems such as multiple management levels, solidified operation systems, and strong resource dependence, which hinder the improvement of green innovation efficiency. The industrial GDP/number of enterprises of each province and city are selected to represent the enterprise scale.
Degree of opening to the outside world (OPEN): Opening to the outside world influences green innovation through technological knowledge and foreign investment spillover. Scholars generally believe that the stronger the ability to absorb capital and technology in areas with a high degree of opening to the outside world, the easier it is to stimulate the innovation vitality of enterprises. Therefore, this paper selects the total import and export volume to express the degree of opening to the outside world.
Industrial structure (INS): Industrial structure is closely related to the unexpected output in the green innovation system, and it is an important factor to realize the sustainable development of green innovation. This paper expresses the industrial structure by the proportion of the added value of the secondary industry.
Government technical expenditures (GOV): Government scientific and technical expenditure can promote the efficiency of green innovation within an appropriate threshold, but excessive government support will reduce the innovation enthusiasm of local enterprises, cause enterprises to rely on government finance, and hinder the process of enterprise innovation. In short, the impact of government support is the result of the game between positive and negative externalities.
Environmental regulation (ER). Environmental regulation is a “double-edged sword” for the green innovation system. Appropriate regulation can significantly reduce the emission of industrial “three wastes” and reduce unexpected output. Excessive environmental regulation will lead to the “follow cost theory”, that is, government environmental regulation makes enterprises need to pay certain environmental treatment expenses in the production process. In order to make up for this part of the cost, enterprises will increase energy input to obtain high output, resulting in an increase in the emission of environmental pollutants. In this paper, the investment in industrial pollution control was used to characterize environmental regulation, and the specific indicators are shown in Table 2.

4.3. Spatial Econometric Model Estimation Results

According to Tobler’s First Law of Geography (TFL), things or attributes are interrelated in space, which is characterized by agglomeration, randomness, and regular distribution [45]. If the spatial correlation of the research object is ignored, the prediction results will be biased. Before spatial econometric regression, this paper uses the Moran index to test the spatial correlation of industrial green innovation efficiency based on an adjacency weight matrix. The results are shown in Table 3. During the study period, the Moran index of the total industrial green innovation efficiency was positive and passed the significance test at the 10% level, indicating that the efficiency of industrial green innovation was spatially dependent between different regions. The index value showed a fluctuating upward trend from 2009 to 2019, always floating in the range of 0.135 and 0.251, and the spatial impact of industrial green innovation efficiency continued to output. In terms of stages, the Moran index of scientific and technological R&D efficiency is positive and significant at the level of 5%. The possible reason is that the scientific and technological R&D stage is mainly the investment of initial resources such as research funds and technicians and the frequent flow of production factors such as labor and capital among regions, which enhances the exchange and cooperation of enterprises in different regions. In addition, scientific and technological innovation achievements are mainly based on papers, patents, monographs, and other explicit knowledge are dominant, which is easy to be absorbed and utilized by innovation subjects. By relying on knowledge and technology spillover, the spatial spillover effect of scientific and technological R&D efficiency is significant. The Moran index of achievement transformation efficiency is positive, but some years fail to pass the significance test. Because the achievement transformation stage mainly involves commercialization activities such as promotion, sales, and market segmentation of new products, the spillover of achievement transformation efficiency is restrained based on market competition and privacy protection.
Stata16.0 software was used to conduct spatial econometric regression on the influencing factors of green innovation efficiency in 30 provinces and cities in China. The Hausman test results reject the original hypothesis at the 5% significant level, so the fixed effect model was selected. By considering the heterogeneity of geographical location and economic development level in the research sample, the spatio-temporal double fixed effect model was selected. The specific results are shown in Table 4. Combined with the Ansenlin judgment criterion, through the comparison of corrected R2 and Log-likelihood estimation results, the spatial Dubin model (SDM) was selected for further analysis.
Because green innovation activities include two stages of scientific and technological R&D and achievement transformation, in order to avoid repeated discussion, this paper focused on the regression results of various influencing factors on scientific and technological R&D efficiency and achievement transformation efficiency.

4.3.1. Technology R&D Stage

It can be seen from Table 3, from the empirical results of the technology R&D stage, the influencing factors have the following three characteristics. Firstly, geographical proximity has a significant positive impact on science and technology R&D efficiency. Correlation coefficients of spatial Dobbin model (SDM) and spatial error model (SEM) were ρ 0.241 and 0.207, respectively. In the spatial lag model (SAR), λ, the value is 0.135, and all pass the significance test at the 1% level. The spatial lag coefficient of openness, industrial structure, and environmental regulation all pass the test at the 5% level, which indicates that the scientific and technological R&D efficiency of a province and city is affected by the surrounding areas, and there is an obvious regional correlation effect in space.
Secondly, openness, industrial structure, government technical expenditures, and environmental regulation have a significant positive impact on science and technology R&D efficiency. It can be seen from Table 3 that the regression coefficient of openness is 0.322, which is significant at the level of 5%, and the coefficient is the largest among all influencing factors, indicating that the higher the degree of openness, the greater the regional tolerance and the more opportunities to communicate with foreign businessmen, so as to form regional cultural diversity, promote the emergence of innovative ideas and technology exchange and interaction, and improve the efficiency of scientific and technological R&D. The regression coefficient of industrial structure is 0.106, which is significant at the level of 1%, indicating that industrial agglomeration and the expansion of the number of enterprises have a significant positive impact on science and technology R&D. industrial enterprises have had economies of scale in the R&D process, and the industrial structure has gradually changed to advanced, rationalized, and green, reducing environmental pollution and improving the utilization rate of local resources and the efficiency of science and technology R&D. The regression coefficient of government technical expenditures is 0.097, which is significant at the level of 1%, and fully shows that government support is the basic guarantee for enterprises to realize green innovation. Government technical expenditures enhance the innovation enthusiasm of small and medium-sized enterprises to a certain extent, alleviate the shortage of funds in the R&D process, reduce the innovation risk of enterprises, and improve the efficiency of scientific and technological innovation. The regression coefficient of environmental regulation is 0.144, which is significant at the level of 1%. This result is consistent with the inference of “Porter Hypothesis”, indicating that environmental regulation can effectively promote the efficiency of scientific and technological research and development [46]. The government forces enterprises to carry out independent innovation through incentive and command regulation means so as to improve the internal production efficiency and technical level of enterprises, and then produce “innovation compensation” for the cost of environmental compliance effect.
Thirdly, the regression coefficient of enterprise scale on technology R&D efficiency is negative but not significant. This conclusion is similar to the research results of Wentao [47], which may be because the science and technology R&D process has high requirements for an innovative environment and diversified system. Compared with small and micro enterprises, large enterprises have complex levels, rigid operation modes, and lack of innovation flexibility.

4.3.2. Achievement Transformation Stage

From the empirical results of the achievement transformation stage, the influencing factors of achievement transformation efficiency have the following four characteristics: firstly, geographical proximity has a significant positive impact on achievement transformation efficiency. It can be seen from Table 4 that the spatial correlation coefficients are 0.037, 0.145, and 0.187, respectively, which pass the significance test, but the spatial dependence is weaker than that in the scientific and technological R&D stage, which is consistent with the results of spatial autocorrelation test. In addition, the spatial lag coefficient of enterprise scale and openness is significant at the level of 10%.
Secondly, enterprise scale and openness have a significant positive impact on the efficiency of achievement transformation. The regression coefficient of the enterprise scale is 0.151, which is significant at the level of 5%. The difference from the scientific and technological R&D stage is that in the achievement transformation if the enterprise scale is small, it is easy to lead to the rupture of capital chain and the termination of production and operation activities, while large-scale enterprises can invest a lot of manpower and capital to promote the commercialization and marketization of technical products. It can be seen from Table 4 that the regression coefficient of the degree of opening to the outside world is 0.318, which is significant at the level of 1%. The possible reason is that opening to the outside world is conducive to product upgrading, promoting enterprise technical exchange and cooperation, and market competition. In order to seize the market opportunity, enterprises will continue to enhance their independent innovation ability to carry out technological innovation, thus improving the innovation level and achievement conversion rate.
Thirdly, it can be seen from Table 4 that the regression coefficient of industrial structure and government technical expenditures on achievement transformation efficiency is 0.217, but it is not significant. The main reason is that industries in different regions focus on learning advanced management experience and technical knowledge exchange, have less contact with product R&D and transformation and market competition, and new product achievements rely more on the enterprise’s own production plan and marketization experience, and the industrial structure fails to promote the efficiency of achievement transformation effectively. Government technical expenditures are mainly to improve the independent innovation ability of enterprises. The financial support obtained by enterprises is mostly used in the scientific and technological R&D stage, and the achievement transformation stage is less affected.
Fourthly, it can be seen from Table 4 that the regression coefficient of environmental regulation is −0.114, which is significant at the level of 1%. The main reason is that China’s economy is in the initial stage of transforming from extensive growth to high-quality development, the absorption and transformation capacity of innovative resources is relatively weak, and the enhancement of environmental regulation means leads to the closure of some enterprises with high pollution, high consumption, and serious waste of resources. In addition, the R&D stage of science and technology has the characteristics of a long R&D cycle and slow results, and the knowledge condensation based on patents, monographs, and papers has little impact. In the long run, environmental regulation can effectively stimulate scientific and technological R&D, which is an important guarantee for the prominent benefits of later application research.

5. Discussion

This paper innovatively divides the green innovation efficiency into two stages (Technology R&D efficiency stage and achievement transformation efficiency stage) to analyze Temporal evolution, spatial evolution, and influencing factors. By combing the literature, it is found that previous studies usually regard the innovation process as a “black box”, ignoring the internal structure and operating mechanism of innovation [48]. A complete innovation process is composed of a series of interrelated sub-processes. However, most of the literature regards corporate green innovation as a whole, and few researchers study green innovation in different stages. Therefore, according to the theory of “innovation value chain” put forward by Hansen et al. [49], this paper divides the process of green innovation into two stages: scientific and technological R&D stage and achievement transformation stage, so as to open the “black box” of innovation and help to deeply analyze the internal mechanism of the process of green innovation. The scientific and technological R&D stage mainly refers to the process that initial resources such as capital and technicians are put into the output of new products, and the scientific and technological achievements in this stage will be applied as intermediate products to the achievement transformation stage. The achievement transformation stage mainly refers to the process in which research achievements are gradually transformed into productive forces, and economic benefits are realized.
As quantitative research, there are still some limitations and future research in this paper. The samples of this study choose industrial sectors, which leads to the regional and industrial limitations of the research conclusions. Then, whether there are differences among high-tech industries, tertiary industries, and other industries needs to be further explored. This paper selects representative internal and external influencing factors (openness, industrial structure, government technical expenditures, firm size, and environmental regulation). The impact mechanism of other influencing factors on the efficiency of industrial green innovation needs to be further studied.

6. Conclusions

Based on the perspective of the innovation value chain, this paper calculates the green innovation efficiency of industrial enterprises in China’s 30 provinces and cities from 2009 to 2019 by using the super-efficiency network SBM model, innovatively dividing the green innovation efficiency into two stages, namely, technology R&D Efficiency stage and achievement transformation efficiency stage. Furthermore, combined with the exploratory spatial data analysis (ESDA) and the spatial multi-objective model, this paper comprehensively and systematically analyzes the spatio-temporal evolution characteristics and influencing factors of industrial green innovation efficiency. In general, the overall efficiency of green innovation in China’s industry is low, and there is much room for improvement. The main conclusions are as follows.
Firstly, based on the temporal series, technology R&D efficiency, achievement transformation efficiency, and total efficiency all show an evolution trend of “rise-decline-rise” and an overall slow rise from 2009 to 2019. The main reason, on the one hand, China’s market of scientific and technological achievements is still in its initial stage, and the absorption and transformation capacity of innovative achievements is relatively weak, resulting in low marketization efficiency in the stage of achievement transformation. On the other hand, the achievement transformation efficiency depends on the technology R&D efficiency, which is due to the long research period (papers, works, appearance patents, and other knowledge achievements), slow effectiveness, and hysteresis at the stage of technology R&D efficiency, resulting in low achievement transformation efficiency.
Secondly, from the perspective of spatial distribution patterns, technology R&D efficiency and achievement transformation efficiency in the eastern region are at the leading level. This is due to the early start and rapid development of industry and high-tech industries in the eastern region. In addition, the initial innovation resources such as human capital are fully invested, and the advantages of economic scale and innovation environment are remarkable. By relying on the advantages of natural location, attracting foreign investment, and learning from a foreign advanced technical level and management experience, the eastern region has taken the lead in becoming the key promotion area and leading area of China’s green innovation development strategy. In contrast, the technology R&D efficiency in the western region grew slowly and changed little, but the efficiency of achievement transformation increased rapidly. This is mainly due to the efficient utilization of innovative resources in Sichuan, Chongqing, and other places in the west, so as to provide scientific and technological talents for enterprises. On the whole, the efficiency of China’s industrial green innovation is low, and the gap is large. On the whole, it shows the situation of East High and low middle. The areas with high green innovation efficiency are coastal areas with a relatively developed economy, while the relatively backward northwest and the middle reaches of the Yellow River have low green innovation efficiency.
On the whole, China’s industrial green innovation efficiency is generally low, with a large gap, and it is generally high in the east, low in the central regions. The areas with high green innovation efficiency are coastal areas with a relatively developed economy, while the economically backward northwest and the middle reaches of the Yellow River have low green innovation efficiency. This further illustrates the correlation between the industrial green innovation efficiency and the regional economic development level.
Thirdly, from the internal and external driving factors of two-stage green innovation efficiency, this paper draws the following conclusions: from the empirical results of technology R&D stage, it is concluded that geographical proximity, openness, industrial structure, government technical expenditures, and environmental regulation have a significant positive impact on technology R&D efficiency. The impact of enterprise scale on technology R&D efficiency is not significant. From the achievement transformation stage, geographical proximity, openness, and enterprise scale have a significant positive impact on the efficiency of achievement transformation. Industrial structure and government technical expenditures have no significant impact on the efficiency of achievement transformation. Environmental regulation has a significant negative impact on the efficiency of achievement transformation.

Author Contributions

This paper is a collaborative work of all the authors. Formal analysis, P.L., L.Z. and H.T.; funding acquisition, P.L. and L.Z.; investigation, P.L. and L.Z.; methodology, Z.Y.; software, Z.Y.; supervision, H.T.; validation, P.L. and L.Z.; writing—original draft, P.L. and L.Z. All authors have read and agreed to the published version of the manuscript.

Funding

This research was funded by The National Social Science Fund of China, grant number 19BJY085.

Institutional Review Board Statement

The authors declare that they have no known competing financial interests or personal relationships that seem to affect the work reported in this article. We declare that we have no human participants, human data, or human tissues.

Informed Consent Statement

Not applicable.

Data Availability Statement

The datasets used and/or analyzed during the current study are available from the corresponding author on reasonable request.

Conflicts of Interest

The authors declare no conflict of interest.

References

  1. Rowan, N.J.; Galanakis, C.M. Unlocking Challenges and Opportunities Presented by COVID-19 Pandemic for Cross-Cutting Disruption in Agri-Food and Green Deal Innovations: Quo Vadis? Sci. Total Environ. 2020, 748, 141362. [Google Scholar] [CrossRef]
  2. Chen, Y.; Zhu, M.; Lu, J.; Zhou, Q.; Ma, W. Evaluation of Ecological City and Analysis of Obstacle Factors under the Background of High-Quality Development: Taking Cities in the Yellow River Basin as Examples. Ecol. Indic. 2020, 118, 106771. [Google Scholar] [CrossRef]
  3. Renjie, Z.; Dong, H. Temporal and Spatial Evolution and Influencing Factors of China’s Industrial Ecological Efficiency Based on Provincial Scale. Econ. Geogr. 2020, 7, 124–132, 173. [Google Scholar] [CrossRef]
  4. Duan, Y.; Liu, S.; Cheng, H.; Chin, T.; Luo, X. The Moderating Effect of ABSORPTIVE Capacity on Transnational Knowledge Spillover and the Innovation Quality of High-Tech Industries in host Countries: Evidence from the Chinese Manufacturing Industry. Int. J. Prod. Econ. 2021, 233, 108019. [Google Scholar] [CrossRef]
  5. Cao, X.; Yu, J. Regional Innovation Efficiency in China from the Green Low-Carbon Perspective. China Popul. Resour. Environ. 2015, 25, 10–19. [Google Scholar]
  6. Fussler, C.; James, P. Driving Eco-Innovation: A Breakthrough Discipline for Innovation and Sustainability; Financial Times/Prentice Hall: Hoboken, NJ, USA, 1996. [Google Scholar]
  7. Mirata, M.; Emtairah, T. Industrial Symbiosis Networks and the Contribution to Environmental Innovation: The Case of the Landskrona Industrial Symbiosis Programme. J. Clean. Prod. 2005, 13, 993–1002. [Google Scholar] [CrossRef]
  8. Tariq, A.; Badir, Y.F.; Safdar, U.; Tariq, W.; Badar, K. Linking Firms’ Life Cycle, Capabilities, and Green Innovation. J. Manuf. Technol. Manag. 2019, 31, 284–305. [Google Scholar] [CrossRef]
  9. Camisón, C.; Monfort-Mir, V.M. Measuring Innovation in Tourism from the Schumpeterian and the Dynamic-Capabilities Perspectives. Tour. Manag. 2012, 33, 776–789. [Google Scholar] [CrossRef]
  10. Zhang, F.; Ren, S.; Yin, X. High-Tech Industry Green Technology Innovation Efficiency and Its Scale Quality Threshold Effect. Sci. Technol. Prog. Policy 2020, 37, 59–68. [Google Scholar]
  11. Jia, X.; Lin, S. A Factor Market Distortion Research Based on Enterprise Innovation Efficiency of Economic Kinetic Energy Conversion. Sustain. Energy Technol. Assess. 2021, 44, 101021. [Google Scholar]
  12. Feng, Z. Research on Industrial Enterprises’ Green Innovation Efficiency in China—Based on Provincial Data by a Dea-Sbm Approach. Forum Sci. Technol. China 2013, 2, 82–88. (In Chinese) [Google Scholar]
  13. Dong, H.; Li, X.; Zhang, R. Analysis on Temporal and Spatial Characteristics and Driving Factors of Green Innovation Efficiency in Dawan District, Guangdong, Hong Kong and Macao. Econ. Geogr. 2021, 41, 134–144. [Google Scholar]
  14. Cui, R.; Fei, J.; Sun, Y. Research on the Change of Green Innovation Productivity and Its Spatial Spillover Effect among Provinces in China. Macroeconomics 2019, 6, 132–145. Available online: http://www.cqvip.com/qk/96811b/201906/7002498243.html (accessed on 10 November 2021).
  15. Gürlek, M.; Koseoglu, M.A. Green Innovation Research in the Field of Hospitality and Tourism: The Construct, Antecedents, Consequences, and Future Outlook. Serv. Ind. J. 2021, 41, 734–766. [Google Scholar] [CrossRef]
  16. Feng, Z.; Zeng, B.; Ming, Q. Environmental Regulation, Two-Way Foreign Direct Investment, and Green Innovation Efficiency in China’s Manufacturing Industry. Int. J. Environ. Res. Public Health 2018, 15, 2292. [Google Scholar] [CrossRef] [Green Version]
  17. Mills, E.F.E.A.; Zeng, K.; Fangbiao, L.; Fangyan, L. Modeling Innovation Efficiency, Its Micro-Level Drivers, and Its Impact on Stock Returns. Chaos Solitons Fractals 2021, 152, 111303. [Google Scholar] [CrossRef]
  18. Silvestre, B.D.S.; Dalcol, P.R.T. Geographical Proximity and Innovation: Evidences from the Campos Basin Oil & Gas Industrial Agglomeration—Brazil. Technovation 2009, 29, 546–561. [Google Scholar]
  19. Fritsch, M.; Franke, G. Innovation, Regional Knowledge Spillovers and R&D Cooperation. Res. Policy 2004, 33, 245–255. [Google Scholar]
  20. Jiang, Z.; Lyu, P.; Ye, L.; Zhou, Y.W. Green Innovation Transformation, Economic Sustainability and Energy Consumption during China’s New Normal Stage. J. Clean. Prod. 2020, 273, 123044. [Google Scholar] [CrossRef]
  21. Huang, Y.; Wang, Y. How Does High-Speed Railway Affect Green Innovation Efficiency? A Perspective of Innovation Factor Mobility. J. Clean. Prod. 2020, 265, 121623. [Google Scholar] [CrossRef]
  22. Li, J.; Du, Y. Spatial Effect of Environmental Regulation on Green Innovation Efficiency: Evidence from Prefectural-Level Cities in China. J. Clean. Prod. 2021, 286, 125032. [Google Scholar] [CrossRef]
  23. Zhou, X.; Yu, Y.; Yang, F.; Shi, Q. Spatial-Temporal Heterogeneity of Green Innovation in China. J. Clean. Prod. 2021, 282, 124464. [Google Scholar] [CrossRef]
  24. Chen, W.; Wang, X.; Peng, N.; Wei, X.; Lin, C. Evaluation of the Green Innovation Efficiency of Chinese Industrial Enterprises: Research Based on the Three-Stage Chain Network SBM Model. Math. Probl. Eng. 2020, 2020, 3143651. [Google Scholar] [CrossRef]
  25. Xu, S.; Wu, T.; Zhang, Y. The Spatial-Temporal Variation and Convergence of Green Innovation Efficiency in the Yangtze River Economic Belt in China. Environ. Sci. Pollut. Res. 2020, 27, 26868–26881. [Google Scholar] [CrossRef] [PubMed]
  26. Xiao, R.; Song, Y.; Qian, L. Research on Spatial Spillover Effect of Enterprises’ Green Innovation Output from the Perspective of Value Chain in Two Stages. Financ. Trade Res. 2019, 30, 71–83. [Google Scholar]
  27. Fei, F.; Lian, H.; Liu, X.; Wang, X. Can Environmental Regulation Promote Urban Green Innovation Efficiency? An Empirical Study Based on Chinese Cities. J. Clean. Prod. 2021, 287, 125060. [Google Scholar]
  28. Du, K.; Cheng, Y.; Yao, X. Environmental Regulation, Green Technology Innovation, and Industrial Structure Upgrading: The Road to the Green Transformation of Chinese Cities. Energy Econ. 2021, 98, 105247. [Google Scholar] [CrossRef]
  29. Robinson, S.; Stubberud, H.A. Green Innovation in Germany: A Comparison by Business Size. J. Int. Bus. Res. 2013, 12, 47. [Google Scholar]
  30. Pan, X.; Guo, S.; Chu, J. P2P Supply Chain Financing, R&D Investment and Companies’ Innovation Efficiency. J. Enterp. Inf. Manag. 2021, 34, 578–597. [Google Scholar]
  31. Tebaldi, E.; Elmslie, B. Does Institutional Quality Impact Innovation? Evidence from Cross-Country Patent Grant Data. Appl. Econ. 2011, 45, 887–900. [Google Scholar] [CrossRef]
  32. Gao, Y.; Tsai, S.-B.; Xue, X.; Ren, T.; Du, X.; Chen, Q.; Wang, J. An Empirical Study on Green Innovation Efficiency in the Green Institutional Environment. Sustainability 2018, 10, 724. [Google Scholar] [CrossRef] [Green Version]
  33. Zhao, L.; Gao, H.; Xiao, Q. An Empirical Study on the Impact of Environmental Regulation on the Efficiency of Green Technology Innovation. Stat. Decis. 2021, 37, 125–129. [Google Scholar]
  34. Du, J.-L.; Liu, Y.; Diao, W.-X. Assessing Regional Differences in Green Innovation Efficiency of Industrial Enterprises in China. Int. J. Environ. Res. Public Health 2019, 16, 940. [Google Scholar] [CrossRef] [PubMed] [Green Version]
  35. Ghisetti, C.; Marzucchi, A.; Montresor, S. The Open Eco-Innovation Mode. An Empirical Investigation of Eleven European Countries. Res. Policy 2015, 44, 1080–1093. [Google Scholar] [CrossRef]
  36. Lin, W.-L.; Cheah, J.-H.; Azali, M.; Ho, J.A.; Yip, N. Does Firm Size Matter? Evidence on the Impact of the Green Innovation Strategy on Corporate Financial Performance in the Automotive Sector. J. Clean. Prod. 2019, 229, 974–988. [Google Scholar] [CrossRef]
  37. Tone, K.; Tsutsui, M. An Epsilon-Based Measure of Efficiency in Dea–a Third Pole of Technical Efficiency. Eur. J. Oper. Res. 2010, 207, 1554–1563. [Google Scholar] [CrossRef]
  38. He, Y.; Li, H. Probability Density Forecasting of Wind Power Using Quantile Regression Neural Network and Kernel Density Estimation. Energy Convers. Manag. 2018, 164, 374–384. [Google Scholar] [CrossRef]
  39. Nasierowski, W.; Arcelus, F. About Efficiency of Innovations: What Can Be Learned from the Innovation Union Scoreboard Index. Procedia—Soc. Behav. Sci. 2012, 58, 792–801. [Google Scholar] [CrossRef] [Green Version]
  40. Chen, K.; Kou, M.; Fu, X. Evaluation of Multi-Period Regional R&D Efficiency: An Application of Dynamic Dea to China’s Regional R&D Systems. Omega 2018, 74, 103–114. [Google Scholar]
  41. Eilat, H.; Golany, B.; Shtub, A. Constructing and Evaluating Balanced Portfolios of R&D Projects with Interactions: A DEA Based Methodology. Eur. J. Oper. Res. 2006, 172, 1018–1039. [Google Scholar]
  42. Liu, Y.; Zhao, G.; Zhao, Y. An analysis of Chinese Provincial Carbon Dioxide Emission Efficiencies Based on Energy Consumption Structure. Energy Policy 2016, 96, 524–533. [Google Scholar] [CrossRef]
  43. Sabir, R.I.; Sabir, R.M. Managing Technological Innovation: China’s Strategy and Challenges. J. Technol. Manag. China 2010, 5, 213–226. [Google Scholar] [CrossRef]
  44. Peng, J.; Xu, R.; Fu, L.; Yi, M.; Xu, Y. The Evolution Pattern of Green Innovation Efficiency of Industrial Enterprises in the Yangtze River Economic Belt. China Environ. Sci. 2019, 39, 4886–4900. [Google Scholar]
  45. Sui, D.Z. Tobler’s First Law of Geography: A Big Idea for a Small World? Ann. Assoc. Am. Geogr. 2004, 94, 269–277. [Google Scholar] [CrossRef]
  46. Lanoie, P.; Patry, M.; Lajeunesse, R. Environmental Regulation and Productivity: Testing the Porter Hypothesis. J. Prod. Anal. 2008, 30, 121–128. [Google Scholar] [CrossRef]
  47. Yu, W. Research on Creative Industry Agglomeration and Its Production Efficiency—An Empirical Analysis Based on Provincial Capital and Sub Provincial Cities. Economist 2016, 6, 51–57. [Google Scholar]
  48. Choi, K.; Narasimhan, R.; Kim, S.W. Opening the Technological Innovation Black Box: The Case of the Electronics Industry in Korea. Eur. J. Oper. Res. 2016, 250, 192–203. [Google Scholar] [CrossRef]
  49. Hansen, M.T.; Birkinshaw, J. The Innovation Value Chain. Harv. Bus. Rev. 2007, 85, 121. [Google Scholar]
Figure 1. Average change trend of industrial green innovation efficiency.
Sustainability 14 00342 g001
Figure 2. Kernel density curve of industrial green innovation efficiency.
Sustainability 14 00342 g002
Figure 3. Spatial Distribution Pattern of Total Efficiency of Industrial Green Innovation.
Sustainability 14 00342 g003
Figure 4. Spatial distribution pattern of R&D Efficiency.
Sustainability 14 00342 g004
Figure 5. Spatial distribution pattern of achievement transformation efficiency.
Sustainability 14 00342 g005
Table 1. Selection of efficiency index of industrial green innovation.
Indicator TypeEvaluating IndicatorVariableUnit
Phase I input indexCapital investmentR&D capital stock10,000 Chinese yuan (RMB)
human inputFull-time equivalent of R&D practitionersPeople
Phase II input indexIntermediate outputsTotal patent applicationsPiece
Authorized amount of invention patentsPiece
Number of new product development projectsPiece
Additional investmentNew product R&D funds10,000 Chinese yuan (RMB)
The cost of purchasing domestic technology10,000 Chinese yuan (RMB)
Total industrial energy consumption10,000 tons of standard coal
Final outputEconomic outputSales Revenue of New ProductsTen thousand Chinese yuan (RMB)
Undesirable outputIndustrial SO2 emission10,000 tons
Industrial wastewater discharge10,000 tons
Discharge of industrial solid waste10,000 tons
Industrial smoke (powder) dust emission10,000 tons
Table 2. Influencing factors of industrial green innovation efficiency.
VariablesIndexVariable CodeUnit
Enterprise scaleIndustrial GDP/number of enterprisesES10,000 yuan/piece
Degree of opening to the outside worldtotal imports and exportsOPENTen thousand dollars
Industrial structureAdded value of secondary industry/Total GDPINS%
Government science and technology expenditureGovernment science and technology expenditure/Total GDPGOV%
Environmental regulationInvestment in industrial pollution controlERTen thousand Chinese yuan (RMB)
Table 3. Overall efficiency of industrial green innovation and Two stages Moran’s I.
YearTotal EfficiencyTechnology R&D EfficiencyAchievement Transformation Efficiency
Moran’s IZ Valuep ValueMoran’s IZ ValueP ValueMoran’s IZ Valuep Value
20090.135 ***2.5510.0010.155 ***2.9540.0030.0881.1250.156
20100.154 **2.0830.0140.176 ***2.8870.0030.155 **1.4790.035
20110.147 *1.6540.0550.194 ***2.5420.0000.124 **1.2750.025
20120.219 **1.6620.0350.225 ***2.1140.0000.097 *1.5520.075
20130.176 *1.4450.0750.216 **1.8440.0170.105 **1.7580.034
20140.251 ***2.6680.0010.207 **2.4390.0110.1331.8740.185
20150.168 ***2.1050.0010.258 ***2.9770.0000.154 **2.0330.044
20160.227 **1.8570.0250.244 ***3.0120.0010.1271.7760.274
20170.215 ***2.7610.0000.269 ***3.1740.0000.144 *1.8360.077
20180.226 ***1.7950.0000.231 ***2.7850.0000.166 **2.1050.021
20190.238 ***2.2230.0010.285 ***2.6550.0000.183 **2.1540.030
Notes: *, ** and *** Denote statistical significance at the 10%, 5% and 1% levels, respectively.
Table 4. Regression results of two-stage green innovation efficiency.
VariablesScience and Technology R&D EfficiencyAchievement Transformation Efficiency
OLSSARSEMSDMOLSSARSEMSDM
lnES−0.035 *−0.131−0.041−0.1280.277 *0.182 **0.107 **0.151 **
lnOPEN0.396 **0.277 ***0.286 **0.322 ***0.303 ***0.411 ***0.274 ***0.318 ***
lnINS0.057 ***0.077 **0.106 ***0.063 ***0.1540.1350.1180.217
lnGOV0.085 ***0.121 ***0.097 ***0.141 ***0.124 *0.0880.1150.136
lnER0.158 ***0.141 ***0.131 ***0.144 ***−0.065 **−0.117 ***−0.104 ***−0.114 ***
lnES × W 0.215 −2.04 **
lnOPEN × W 0.211** 0.234 ***
lnINS × W 0.041*** 0.146
lnGOV × W 0.124 0.159
lnER × W 0.087** 0.102
λ/ρ 0.135 ***0.207 ***0.241 *** 0.037 *0.145 ***0.187 ***
R2-ad0.7010.6770.7150.7370.6510.6350.6880.704
Log-likelihood 215.225227.326248.542 210.235214.568227.305
Individual effect FixedFixedFixedFixedFixedFixedFixedFixed
Time effectFixedFixedFixedFixedFixedFixedFixedFixed
N330330330330330330330330
Notes: *, ** and *** Denote statistical significance at the 10%, 5% and 1% levels, respectively.
Publisher’s Note: MDPI stays neutral with regard to jurisdictional claims in published maps and institutional affiliations.

