Article

Green Technology Innovation, Globalization, and CO2 Emissions: Recent Insights from the OBOR Economies

1
School of Economics, Zhongnan University of Economics and Law, Wuhan 430073, China
2
Business School, Yunnan University of Finance and Economics, Kunming 650221, China
3
Vivekananda Institute of Professional Studies, IP University, New Delhi 110034, India
4
School of Economics, Hainan University, Haikou 570228, China
*
Authors to whom correspondence should be addressed.
Sustainability 2022, 14(1), 236; https://doi.org/10.3390/su14010236
Submission received: 3 November 2021 / Revised: 17 December 2021 / Accepted: 20 December 2021 / Published: 27 December 2021
(This article belongs to the Special Issue Green Energy, Energy Innovation and Environmental Economics)

Abstract

:
This study explores the connection between technological innovation, globalization, and CO2 emissions by controlling the critical influence of information and communication technology (ICT) and economic growth in a panel of One Belt One Road (OBOR) countries from 1991 to 2019, utilizing advanced and robust econometric strategies (second generation). In addition, this study also uses an interaction variable (TI*GLOB) to check the interaction role of technological innovation on the linkage between globalization and CO2 emission, besides their direct effect on CO2 emissions in OBOR countries. The outcomes revealed that the linkage between technological innovation and CO2 emissions is negative, and statically significant in all the regions (e.g., OBOR, South Asia, East and Southeast Asia, MENA, Europe, and Central Asia). Moreover, the results of globalization show a significant positive relationship with CO2 emissions in OBOR and South Asia region. Nevertheless, it significantly negatively affects environmental pollution in East and Southeast Asia, MENA, Europe, and Central Asia. The results of TI*GLOB indicate that, for the OBOR sample, East and Southeast Asia, and Central Asia, the moderation effects of technological innovation with globalization are significantly negatively associated with CO2 emissions. However, in MENA and Europe, the interaction effect is a significant positive. The coefficient of ICT for OBOR, Europe, and Central Asia are positive and statistically significant; however, for East, Southeast Asia, and MENA regions, these results are statistically negative. Furthermore, the findings are robust, according to various robustness checks that we have performed for checking the reliability of our main findings. The study establishes numerous polities and makes various recommendations, in light of relevant conclusions.

1. Introduction

Climate change has created tremendous obstacles to humankind’s existence and development, including harsh weather, species mortality, and food shortages [1]. Coupled with this disturbing reality, the Paris Agreement, adopted at the Conference of the Parties (COP21) in December 2015, underlines the importance of worldwide carbon emissions peaking around 2020 and temperature increases staying below 2 degrees Celsius [2]. Thorough knowledge of regional carbon emissions factors and trends is crucial for developing effective approaches to address the greatest polluters [1]. Furthermore, one of the most debated and studied subjects in current times in the framework of globalization and technological innovation is economic integration. Therefore, according to the sustainable economic growth idea, increasing research and development (R&D) spending can enhance economic output efficiency and resource usage efficiency; nevertheless, the effect of technical innovation on environmental quality, particularly carbon dioxide (CO2) emissions, is debatable [3,4]. Technological innovation plays a vital part in lowering emissions while also aiding in energy conservation. Furthermore, technological innovation plays an important role in the efficient use of both conventional and renewable energy sources. Technological developments also improve renewable energy capabilities, boosting renewable energy supply to meet prospective energy needs. Because of the ever-increasing demand for energy, it has been determined that renewable energy will be the most important form of energy in the future, and it is also an environmentally friendly source of power [5]. Most researchers feel that technological innovation can help reduce CO2 emissions and improve environmental sustainability [6,7,8].
In current times, there has been a rise in the number of scholars studying the relationship between energy resources, globalization, and their usage. We see an incredible rise in the flow of commodities, services, and knowledge from one region of the world to another as a result of the globalization process [9]. Countries across the world are liberalizing their economies by reducing trade barriers. Furthermore, globalization faces a setback as the prospect of environmental deterioration grows. As a result, globalization is associated with a rapid expansion of pollution. Furthermore, environmental pollution has a tremendous impact on human life across the globe [10]. Technological spillovers in exporting economies gradually add to the gains in the world’s wealth and output, so it is expected that globalization will cut energy usage and CO2 emissions over time. Technology spillovers eventually increase globalization’s increase in income and productivity in exporting countries; thus, globalization is likely to cut energy consumption and CO2 emissions over time. Numerous experts, however, have discovered that globalization has a positive ecological influence [11,12]. According to these studies, the ecological repercussions of globalization vary from country to country and region to region. Globalization does not have the same effect on every country. As a result, the global map shows which countries are the most and least globalized. The same rationale may be applied to globalization and energy linkages, but the connections are different in the long and short term.
According to the preceding assertion, technical innovation and globalization play distinct parts to improve economic growth, as well as enhancing environmental quality, and efforts must be made to separate environmental deterioration from the energy consumption–growth track. As a result, understanding the link between technological innovation, globalization, and CO2 emissions is critical. Therefore, the current study looks at the connection between technical innovation, globalization, information and communication technology, economic growth, and environmental pollution in the One Belt One Road Initiative (OBOR) economies. In September 2013, the Chinese administration proposed the construction of the Silk Road Economic Belt to establish regional integration among other countries. A month later, the Indonesian authorities requested the creation of the Asian Infrastructure Development Bank (AIDB) and the development of the 21st Century Maritime Silk Road [13]. This course of action was authorized by the State Council in March 2015 [14], and later that year, China formally referred to these plans as the OBOR or the Belt and Road Initiative. According to a Chinese report, 65 countries would actively engage in the OBOR, including 24 from Europe, 26 from Asia (8 from East Asia, 2 from Southeast Asia, 11 from Central Asia, and the other 5 from South Asia), and 15 from the Middle East and North Africa [15].
It involves 4.4 billion people, or 62.3 percent of the world’s population, and 30 percent of world GDP. Financial and economic progress will be attained through this project through excellent policy administration and cultural and personnel interactions among involved nations. This is one of the massive projects with massive financial estimates spanning from 1.4 trillion USD to 6 trillion USD [14]. Nonetheless, in addition to these 65 countries, another 48 countries have expressed an interest in becoming active members of the OBOR. However, in 2017, the number of collaborating countries hosted by the State Information Center increased to 71, with an investment amount of USD 6 trillion (representing 34% of world GDP) [16]. Furthermore, the OBOR has broad economic goals, such as financial cooperation, unhindered trade, facility, infrastructural integration, economic liberalization and expansion, and effective resource usage [14]. In 2015, the United Nations (UN) adopted a framework of Sustainable Development Goals (SDGs) to eradicate poverty, promoting socioeconomic inclusion encompassing environmental preservation. Since sustainable development is a global, multidimensional, and multidisciplinary goal, it requires investments being organized in a multi-layer framework [17]. Hence, this study focuses on the OBOR sample because OBOR is a one-of-a-kind platform for broad globalization and mutually productive engagement [18]. In addition, OBOR countries currently account for almost 63 percent of global GDP in US dollars. This program will increase commerce and strengthen economic integration throughout Asia, Europe, Africa, and maybe beyond. Furthermore, investing activities are needed to boost economic growth and prosperity among OBOR participants [19], and the collaboration among member countries will also promote technological advancement. However, such economic activities can have negative effects on environmental quality. Thus, understanding environmental effects in OBOR countries has become an essential research agenda among member countries. There are a number of objectives of this study, but here, we concentrate only on those which are primarily concerned, as follows:
  • To evaluate the relationship between technological innovation, globalization, and the environment for specified OBOR countries.
  • To check the moderation effect between technological innovation and globalization (TI*GLOB) on CO2 emissions.
This work is innovative in several ways. First, it enhances the environmental function by including technological innovation and globalization as determinants of economic growth, information communication technology, and the environment for specified OBOR countries. Adding technological innovation and globalization to the model avoids specification bias. Second, in this study, we also assessed the moderation effect between technological innovation and globalization (TI*GLOB) on CO2 emissions; this moderation effect enhances the contribution of this study. It also gives reliable results that help mitigate pollution levels in OBOR economies. Therefore, this study is the first to look into the innovation–globalization–environment link from the angle of OBOR countries. Third, this study employs the cross-sectional dependence approach to determine cross-sectional dependence in the data. To account for cross-sectional dependency and heterogeneity in panel data, the cross-sectional augmented Dickey–Fuller (CADF) and cross-sectional Im, Pesaran, and Shin (CIPS) panel unit root tests, as well as the Westerlund [20] cointegration test, are utilized. The dynamic seemingly unrelated regression approach is used to test long-run associations. In addition, dynamic ordinary least squares (DOLS) and fully modified ordinary least squares (FMOLS) are applied for the robustness of the findings. Furthermore, this research also sheds light on the relationship between technological innovation, globalization, and environment at the panel and regions levels (e.g., OBOR, South Asia, East, and Southeast Asia, MENA, Europe, and Central Asia). Lastly, the findings of this study are useful for academicians, development practitioners, environmentalists, and government officials. This study endeavors policy implications for conserving the environment in the contemporary globalizing world. The findings are useful for countries deprived of technological innovation and for increasingly globalizing countries.
The remaining section is structured as follows. The next section provides the literature review methodological framework of the study. Section 3 describes data sources, and Section 4 presents results and their discussion. Finally, Section 5 concludes the study and provides relevant policy implications.

2. Literature Review

This research examines the impact of technological innovation and globalization on environmental quality in OBOR countries. This encouraged us to split the existing literature review into the following two sections: (a) impact of technological innovation on environmental quality and (b) impact of globalization on environmental quality.

2.1. Technological Innovation and Environmental Quality

Technological innovation is projected to have a considerable impact on pollution reduction. Environmental legislation, combined with technological progress, has reduced pollutant concentrations, and has boosted environmental efficiency in respective countries. Several analyses have been carried out to study the association between technological innovation and environmental quality. For instance, Lantz and Feng [21] investigated the impact of population, income, and technological innovation on CO2 emissions in Canada. Population expansion and income levels, according to them, increase CO2 emissions, whereas technological improvement decreases CO2 emissions. Their empirical findings suggested that technological advances and modifications in economic structure will help to reduce carbon emissions. Furthermore, Sun et al. [22] examined the connection between patent technology and CO2 emissions in China. The study showed that technological advancement significantly cuts carbon emissions. Additionally, their comparative study found that, when compared with other areas, the Eastern area is more effective in incorporating innovations and environmentally friendly approaches. Similarly, Sohag et al. [23] investigated the impact of TI on CO2 emissions in Malaysia. According to their empirical findings, technological developments improve energy efficiency and reduce CO2 emissions.
Furthermore, the authors emphasize that substituting obsolete technologies with novel technologies can only be accomplished through public–private collaborations, as such partnerships can stimulate innovation in sustainable and energy-efficient technologies. From 1990 to 2012, Álvarez-Herránz et al. [24] investigated the association between air pollution and energy innovation in Organization for Economic Cooperation and Development (OECD) countries. According to the empirical evidence, developing countries should raise their expenditures for energy sector growth and improve the accessibility of renewable energy in order to reduce CO2 emissions. Chen and Lei [25] tested the impact of technological innovation on the environment–energy growth link in 30 nations between 1980 and 2014. They observed a significant negative relationship between technological innovation and carbon emissions, implying that countries with high carbon production can lower pollution by increasing investments in technological breakthroughs. From 1955 through 2016, Shahbaz et al. [26] investigated the influence of energy innovation on environmental sustainability in France. They discovered that energy innovation improves the quality of the atmosphere. Recently, Danish and Ulucak [27], from 1992 to 2014, researched the influence of technological innovation on sustainable progress in the economies of Brazil, Russia, India, China, and South Africa (BRICS). Their empirical research indicated that environmental technology makes a significant contribution to the BRICS economies’ long-term progress. They urged that the BRICS economies promote energy sector innovations in order to satisfy sustainability targets and facilitate development in the long run.

2.2. Globalization and Environmental Quality

Numerous studies have been carried to investigate the empirical relationship between globalization and CO2 emissions. Shahbaz et al. [28] employed Chinese data from 1970 to 2012 to examine the relationship between globalization and CO2 emissions using autoregressive distributed lag (ARDL) bounds testing. They conclude that globalization enhances Chinese environmental quality by lowering CO2 emissions. Lv and Xu [29] utilized panel data from 15 emerging economies from 1970 to 2012 to analyze the influence of economic globalization on CO2 emissions. According to the conclusions, economic globalization lowered CO2 emissions. The link was discovered to be robust across a variety of econometric specifications. Haseeb et al. [11] examined the influence of energy usage, financial development, globalization, economic growth, and urbanization on CO2 emissions in BRICS countries by utilizing econometric methods, which were robust to heterogeneity and cross-sectional dependence. They revealed that energy usage and financial progress contribute to CO2 emissions, whereas globalization and urbanization have a negative but insignificant association with CO2 emissions. Likewise, Shujah-ur-Rahman et al. [30] studied the role of financial sectors, globalization, and renewable and non-renewable energy consumption for a sustainable environment in the Central and Eastern European (CEE) nations. They used annual data of 16 CEE economies from 1980 to 2016. The empirical findings of dynamic, seemingly unrelated regression confirm that globalization enhances the environmental performance of the CEE economies.
Koengkan et al. [31] employed panel ARDL to analyze the asymmetric link between economic globalization and CO2 emissions in 18 Latin American nations. Their empirical study shows that economic globalization enhances environmental sustainability by cutting CO2 emissions. Bilgili et al. [32] used a Markov regime-switching approach to see if the Turkish economy’s CO2 emissions grow due to globalization. They point out that environmental performance benefits from globalization. However, some studies found that globalization decreases the quality of the environment. For instance, Kalaycı and Hayaloğlu [33] investigated the connection between economic globalization and carbon emissions in the context of North American Free Trade Agreement (NAFTA) economies. They discover that economic globalization harms the environment by raising CO2 emissions. Khan and Ullah [34] explored the influence of globalization in ensuring a sustainable environment in Pakistan from 1975 to 2015. Their long-run estimates of the ARDL approach demonstrate that globalization greatly increases carbon emissions.
The above-mentioned literature assessment clearly shows that research into the empirical linkage between technological innovation, globalization, and CO2 emissions in the framework of OBOR countries is worthwhile. However, the majority of research that investigated such a connection in different circumstances struggle from methodological problems. Furthermore, to the extent of the authors’ understanding, no work has yet evaluated the impacts of both technological innovation and globalization on CO2 emissions for OBOR countries. As a result, this research bridges the gap.

3. Data and Methodology

Theoretical Framework and Data Descriptions

This study looks into the association between technological innovation (TI), globalization (GLOB), and CO2 emissions by controlling the critical influence of information and communication technology (ICT) and economic growth (GDP) in the panel of OBOR countries. Shahbaz et al. [26] suggest that technological innovations may have an impact on environmental sustainability by promoting energy advancements and energy-efficient equipment. Globalization alters economic advancement and creates relative benefits through cooperation with other countries. It has substantial consequences on the environment as well as local means of production [35,36]. It promotes improvements in trade policy aimed at reducing cross-border barriers and encouraging the adoption of green technologies. Such modifications may indirectly impact ecological administration strategies, distribution of resources, and the environment. According to Godil et al. [37], while information and communication technology is highly vital for growth and sustainable progress, it also degrades environmental efficiency due to hazardous emissions that occur during the manufacturing and development of information and communication technology devices. Modern information and communication technologies, in particular, consume a lot of energy. As information and communication technology becomes more developed, it consumes more energy, resulting in increased CO2 emissions. According to Yang et al. [38,39], economic progress is the key source of excessive pollution levels, since economic expansion is highly reliant on excessive energy demand, which steadily degrades environmental quality. Such reasoning led us to develop the following general carbon emissions function:
This study examines the composite effects of technology innovation, ICT, and globalization on environmental CO2 emissions for OBOR economies during the period from 1991 to 2019. The basic function of the model is studying the panel analysis. The basic functional form of the model is:
CO 2 it = f ( TI it , GLOB it , ICT it , GDP it )
where CO2 denotes the CO2 emissions, TI denotes technology innovation, GlOB denotes globalization, ICT denotes information and communication technologies, GDP is economic growth, i is country, and t is time period. For empirical investigation, we used a log–linear formulation instead of a linear formulation and converted all parameters to natural logarithms, this was because it provides outcomes that are more reliable and constant [40]. The below is a log–linear representation of the function of the CO2 emissions:
ln CO 2 it = β 0 + β 1 ln TI it + β 2 ln GLOB it + β 3 ln ICT it   + β 4 ln GDP it + ε it
where ln is the natural log and ε is the error term.
In addition, this study proposes that “TI” and “GLOB” might have an interaction role besides their direct effect on CO2 emissions in OBOR countries. Hence, addressing this subject, this paper tries to examine the interaction role of TI on the linkage between GLOB and CO2 emission. Thus, to empirically examine the moderating effect of TI*GLOB on CO2 emissions, we include an interaction term in Equation (2), and obtain a new equation, as follows:
ln CO 2 it = β 0 + β 1 ln TI it + β 2 ln GLOB it +   β 3 ln TI GLOB it   +   β 4 ln ICT it   + β 5 ln GDP it + ε it
The moderating impact will be detected when the interaction parameter displays a statistically significant link [41]. Therefore, if the coefficient is statistically significant, we can assume that the moderating impact of TI in the study will be confirmed. TI raises environmental performance if β1 < 0; otherwise, the atmosphere is polluted by a rise in TI. We expect β2 > 0 if GLOB is not environmentally friendly; if it is environmentally friendly, then β2 < 0. We expect that the link between TI*GLOB and CO2 emissions is negative if β3 < 0; otherwise, an increase in TI*GLOB raises pollution if β4 > 0. ICT raises environmental pollution and hinders environmental quality if β4 > 0—if not, then β4 < 0. We expect β5 > 0 if the connection between GDP and CO2 emissions is positive if not β5 < 0.
We use the balanced panel data of 44 OBOR countries from 1991–2019. Unfortunately, data unavailability limited the sample size and the time span of the investigation. As a result, our sample size was reduced to 44 countries. The names of the countries are listed in the Appendix (see Table A1). Carbon dioxide emission is proxied by CO2 emissions kilotons and obtained from the World Development Indicators data set (WDI). The dataset on technological innovations is derived from the World Intellectual Property Organization (WIPO), and it measures the number of patent applications submitted each year. The globalization index was taken from the KOF Swiss Economic Institute to measure globalization [42]. The KOF Index of Globalization was created by combining economic, political, and social factors. The data of information and communication technology is measured as the number of internet users and mobile users, and economic growth is measured as constant; 2010 USD were obtained from WDI.

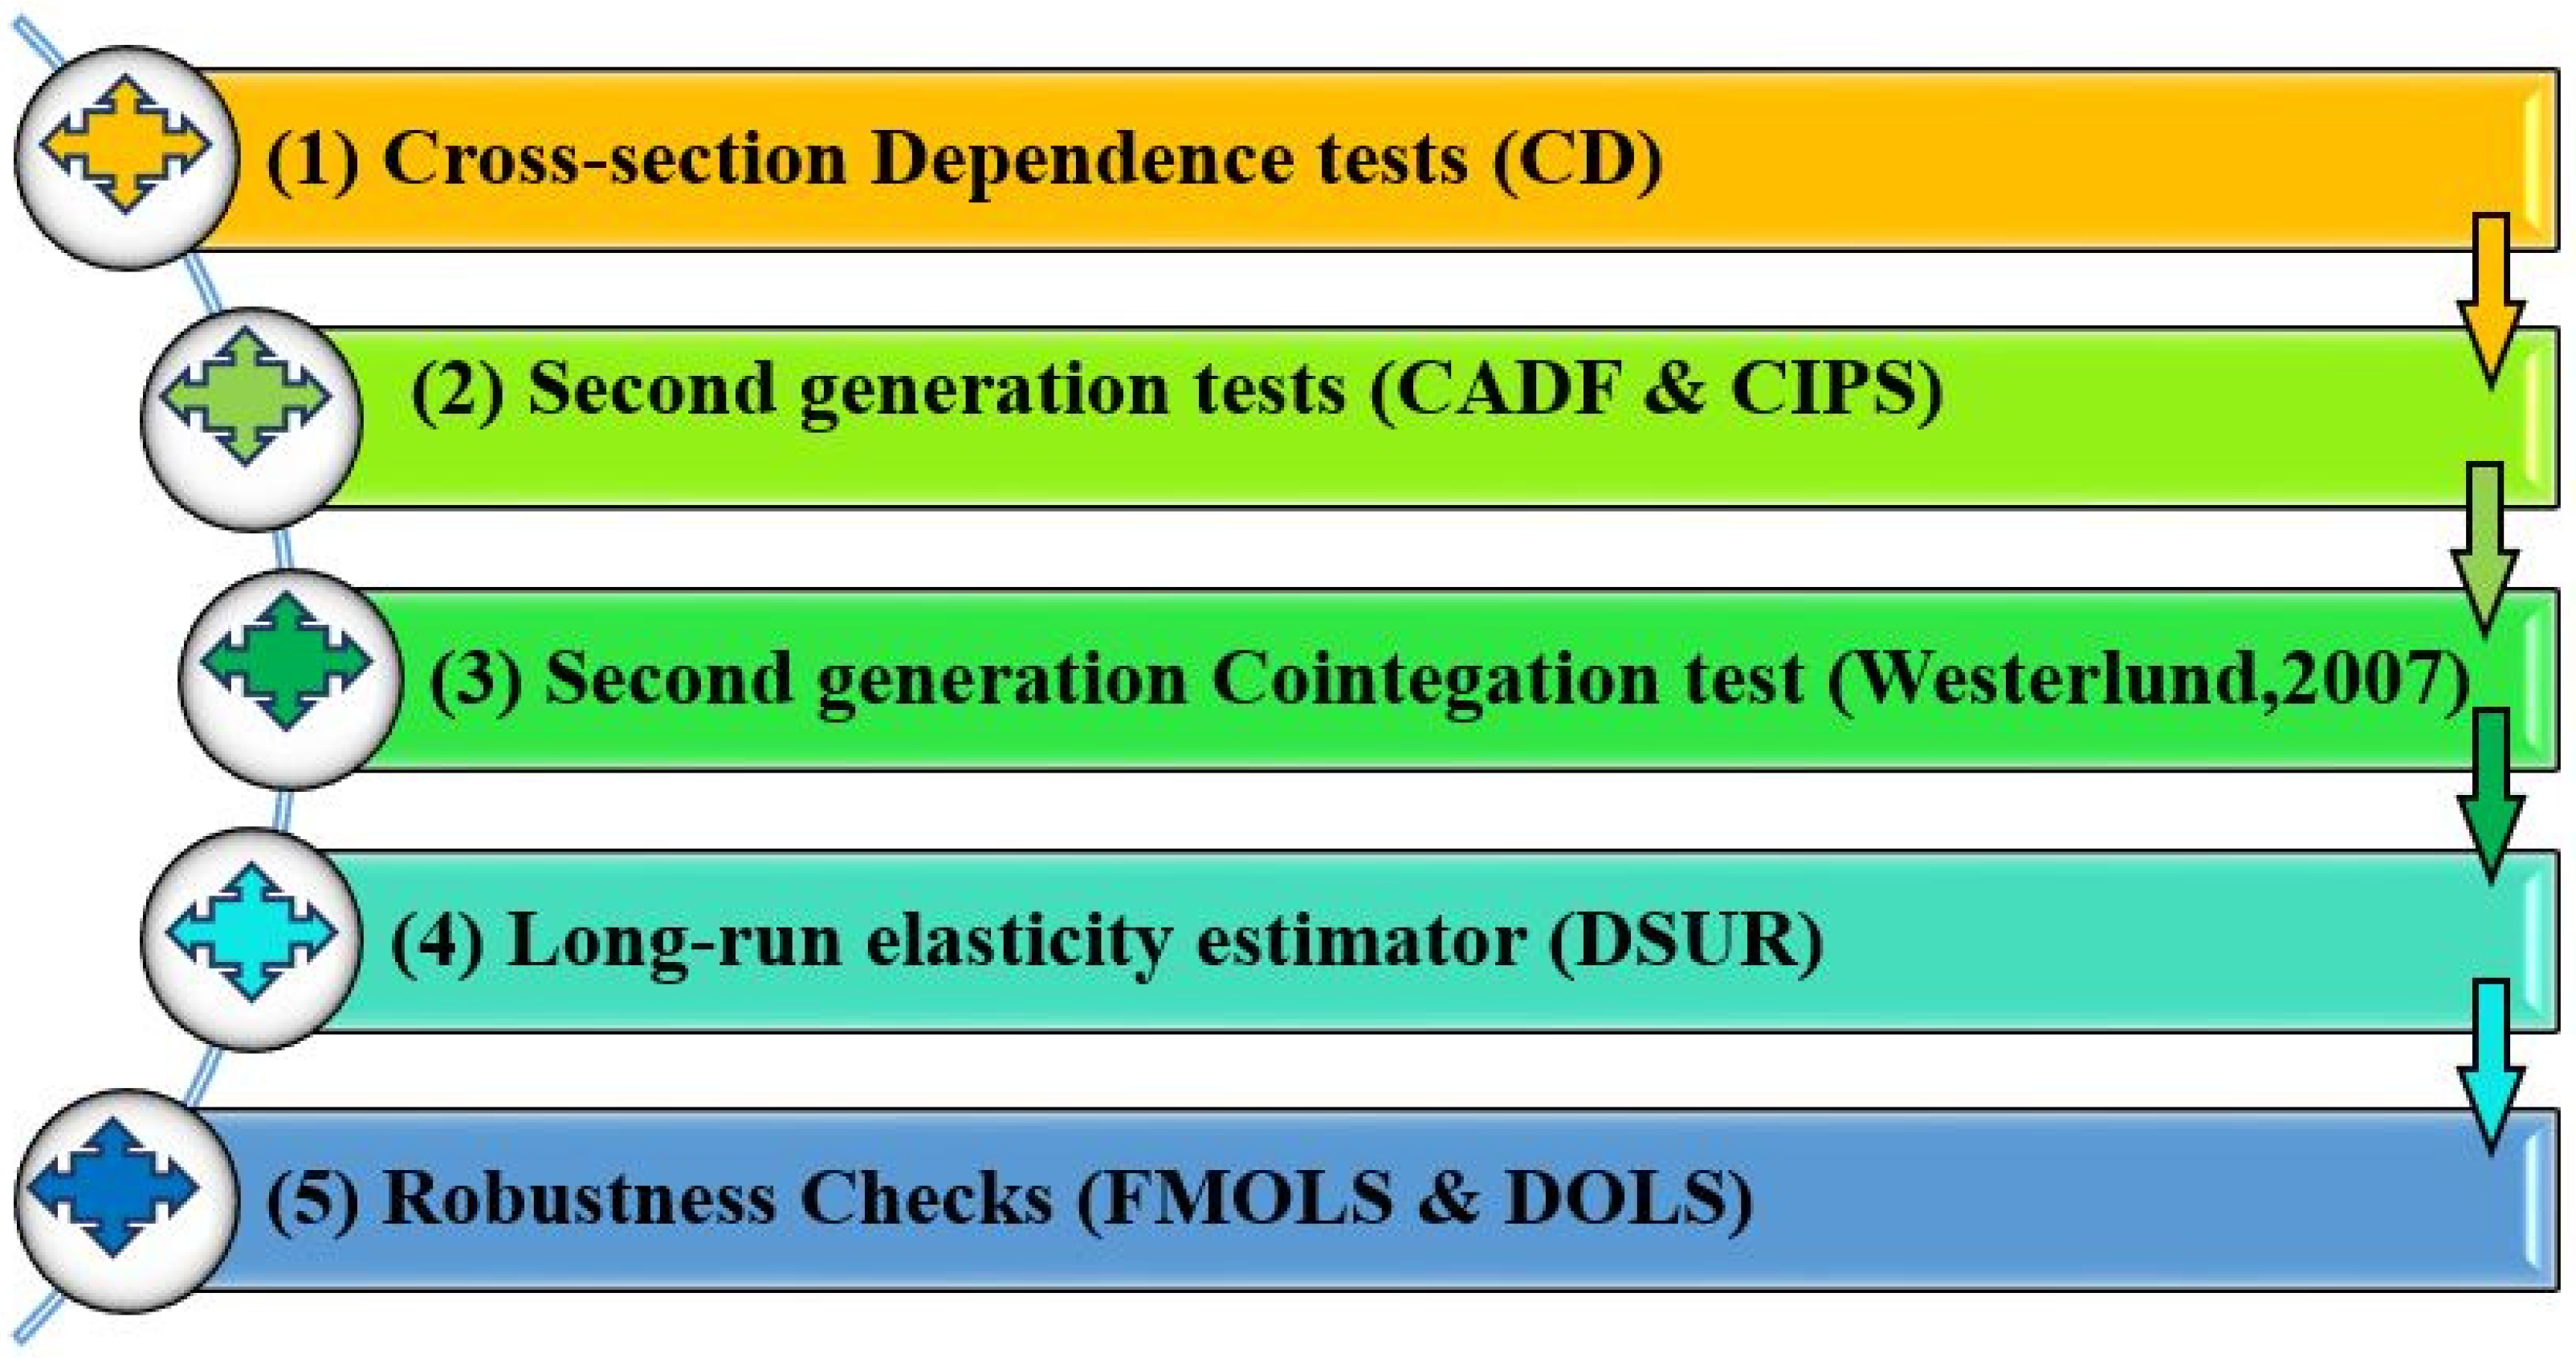
4. Estimation Strategy

4.1. Cross-Sectional Dependency (CSD) Test

The first stage in our econometric investigation is to confirm cross-sectional dependence (CSD) in panel data. Although this is a typical problem with panel data, we might obtain incorrect or biased results if panels are not cross-sectionally dependent. The CSD test is extremely beneficial in the situation of small time span (T) and big cross-sections or groups (N), i.e., T < N. Thus, to address the issue of CSD, we used the CSD test recommended by Pesaran [43]. The null hypothesis (H0) of this approach stated that all of the parameters listed above are not cross-sectionally dependent.

4.2. Unit Root Testing

We did not apply the first-generation unit root test due to the cross-sectional dependence in our data, which may lead to misleading conclusions. To address this concern, we used second-generation, improved unit root techniques to evaluate the data’s stationarity. We employed Pesaran [44] cross-sectional Im, Pesaran, and Shin (CIPS) unit root tests and cross-sectional augmented Dickey–Fuller (CADF) unit root approaches, which are more appropriate for producing accurate results in the presence of CSD [38,45,46].

4.3. Panel Cointegration Test

Unlike prior research, this article uses a more relevant technique. Westerlund’s [20] approach efficiently deals with the issue of CSD in the panel data, and it yields long-run cointegration findings for the model. This method employs four kinds of statistics, two for group statistics and two for panel statistics. The group panel statistics offer a null hypothesis for the entire group, whereas the panel statistics confirm the null of at least one cointegrated cross-section. The group statistics are represented by Gt and Ga, whereas Pt and Pa designate the panel statistics.

4.4. Long-Run Estimations

Since the cointegration analysis above supports parameter cointegration, we can now estimate the regressors long-run elasticities with CO2. We used Mark et al.’s [47] second-generation econometric method, defined as dynamic seemingly unrelated regression (DSUR). DSUR can manage CSD, heterogeneity, and other panel data difficulties and provide accurate results. Therefore, we applied the DSUR technique to calculate the long-run elasticities of the parameters.
Furthermore, we assessed the robustness of our outcomes employing the fully modified ordinary least squares (FMOLS) and dynamic ordinary least squares (DOLS) regression techniques. FMOLS, according to Phillips and Hansen [48], is a stochastically unbiased and robust semi-parametric approach for removing correlation problems [49]. DOLS, on the other hand, includes lags and leads to predictor variables, keeping the error component orthogonal to stochastic regressor trends in the cointegrating model. By contending with disturbance factors, FMOLS and DOLS can aid with serial correlation and endogeneity difficulties in the equation [50]. Figure 1 represents the road map of econometric techniques of the current study.

5. Empirical Results and Discussion

5.1. Results

Table 1 documents the descriptive statistics of the studied variables employed. This shows that the mean value of CO2 emissions is 11.0307, the maximum value is 16.3441, and the minimum value is 7.5396 with a standard deviation, which is 1.6881. The mean value of TI is 5.9138, with a maximum value of 14.1475 and the minimum value of 0.6931 with a standard deviation, which is 2.0366. The mean value of GLOB is 4.0732, with a maximum value of 4.4624, and a minimum value of 3.1223, with a standard deviation, which is 0.2589. The mean values of ICT and GDP are 5.8804 and 8.3342, with maximum values of 42.7644 and 10.9865, and minimum values of 9.0481 and 5.9051, respectively.
To cope with the issue of CSD, we apply the CSD test proposed by Pesaran (2004). Here, we accepted the alternative hypothesis and concluded that all the included variables in selected countries are cross-sectionally dependent, as seen in Table 2. After applying the CSD test, our next task is to apply second generation panel unit root tests, i.e., cross-sectional augmented Dickey–Fuller (CADF) and (CIPS) to confirm the order of integration among the included variables for the empirical analysis. Table 3 presents the CADF and CIPS results. It is indicated that we accept the alternative hypothesis and reject the null hypothesis for all the selected variables. However, all the selected variables are stationary at the first difference; therefore, it is evident that the order of the integration is one.
After finding the order of integration, we investigated the long-run association among the selected variables. For this purpose, we applied the latest available test by [20]. The main advantage of this test is that we can apply it in the presence of CSD and heterogeneity in the data. We have presented the results of this test in Table 4. The Westerlund cointegration estimation technique revealed that all the included variables are cointegrated; therefore, we can conclude a long-run association among the selected variables for the group of OBOR economies.
After investigating the order of integration among the selected independent variables and CO2 emissions, we were interested in estimating the long-run coefficients of the independent variables, for example, TI, Glob, TI*Glob, ICT, and GDP. As aforementioned, the order of integration of the variables is, for example, I (1). We confirmed the presence of integration by using the Westerlund cointegration test. Therefore, in the next step, in Table 5, we applied the DSUR method to estimate long-run associations.
Table 5 shows the long-run associations between studied variables. The link between TI and CO2 emissions is negative and statically significant in all the regions (e.g., OBOR, South Asia, East and Southeast Asia, MENA, Europe, and Central Asia). This empirical result is aligned with previous research investigations, such as Qayyum et al. [51], for India, and Cheng et al., [52] for OECD countries. However, the findings of Chunling et al. [53] in the case of Pakistan are opposed to our outcomes. They concluded that TI in Pakistan is increasing pollution. Moreover, the results of GLOB indicate a significant positive relationship with CO2 emissions in OBOR and South Asia region. However, it significantly negatively affects environmental pollution in East Asia, Southeast Asia, MENA, Europe, and Central Asia. Furthermore, the empirical results indicate that for the OBOR sample, East Asia, Southeast Asia, and Central Asia the moderation effects (TI*GLOB) of technological innovation with globalization are significantly negatively associated with CO2 emissions. However, in MENA and Europe, the interaction effect is a significant positive.
As indicated in Table 5, the long-run coefficient of ICT for OBOR, Europe, and Central Asia are positive and statistically significant at 1% and 5%, respectively. This also implies that internet use has a favorable effect on CO2 emissions. Similarly, the findings of GDP depict a significant positive connection towards CO2 emissions in all the regions. It indicates that an increase in economic growth degrades the quality of the environment. This outcome is consistent with the research study of Yang, Ali, Hashmi et al. [38], and Shabir et al. [46], which found a positive link between economic expansion and pollution. However, these findings are contrary to the conclusion of [51]. Besides, this study used FMOLS and DOLS long-run estimators to support the DSUR long-run estimation outcomes. Table 6 presents the empirical results of the OBOR sample by using DOLS and FMOLS. The results are aligned with the DSUR long-run estimate.

5.2. Discussion

In the course of our empirical analyses, this study examined the impact of technological innovations (TI), globalization (GLOB), and CO2 emissions by controlling the critical influence of information and communication technology (ICT) and economic growth (GDP) in the panel of OBOR countries. Firstly, the empirical results signify that technological innovations and CO2 emissions is negative and statically significant in all the regions. It shows that TI helps reduce carbon emissions in all the regions and is a critical component in enhancing the efficiency of the atmosphere. Implementing new technology, patents, or ideas connected to environmental conservation could reflect the detrimental direct repercussions of TI towards CO2 emissions. As more emphasis is placed on carbon emissions and climate change, the research and deployment of carbon-reduction strategies accelerate. Carbon sequestration and storing technology, CO2 fixation techniques, integrated heat and power generating technology, sustainable green building ideas, green chemistry techniques, and so on, are examples of these techniques. These strategies’ reducing effects have been validated in earlier publications as well as in practice. In the OBOR countries, some of these strategies were extensively used, while others were rapidly evolving. As a result, technological innovation reduces CO2 emissions in all studied countries.
Secondly, the results of globalization show a significant positive association with environmental pollution in OBOR and South Asia region. However, it significantly adversely affects environmental degradation in East Asia, Southeast Asia, MENA, Europe, and Central Asia. These positive findings demonstrate that GLOB is the primary cause of environmental pollution. According to these results, countries must focus on developing environmentally friendly technologies and establishing tight rules and regulations for polluting derived sectors that lead to further environmental pollution in the panel of OBOR and South Asia. These results are similar to the outcomes of [54]. Regarding negative effects, one probable explanation is that these economies are promoting sophisticated and green technology through globalization, which improves energy efficiency and, in turn, mitigates environmental pollution. Globalization reduces carbon emissions through increasing access to modern energy-efficient technology, advanced manufacturing processes, managerial skill dissemination, and quick recourse to green technologies [55]. Another probable reason is that, in order to achieve the threshold level faster, many economies are making it easier for international capitalists to invest in their country. New investments provide cutting-edge techniques and energy-efficient production methods, contributing to the host country’s economic progress. The host country’s domestic enterprises use cutting-edge production methods and improve energy efficiency by implementing energy-efficient techniques [56]. These results are analogous to the outcomes of [30].
Thirdly, the negative effect of TI*GLOB signifies that globalization introduces eco-friendly and energy-efficient innovations to the host country through international investment and trade openness. Globalization thus introduces new manufacturing techniques and technological advancements to the country, promoting economic activity without impairing environmental quality. Globalization exacerbates carbon emissions through the technique, scale, and income effect [28]. Thus, governments should promote new commercial partners and market access by balancing their current foreign policies. Simultaneously, they should assist enterprises and individuals in importing eco-friendly technological innovations by offering further assistance, such as subsidizing, allowing for discretion in stated laws and regulations, or reducing customs taxes on certain commodities, among other things. They can do so by increasing the volume of economic globalization, which improves the atmosphere of these economies. On the other hand, the possible rationale for the positive effect of TI*GLOB is that technological innovation coming through the channel of globalization is not environmentally friendly in these countries. It is evident from the analysis that most of the technologically innovative products are energy-intensive products. Therefore, they are increasing the level of emissions in these economies. According to this hypothesis, over time, economic integration and technological innovation foster investment in the transportation sector and in energy-intensive good and services, which in turn trigger the level of emissions in these economies [57].
Forth, a rise in ICT can raise emissions in the studied countries. This means that increased use of ICT by individuals harms the environment by causing considerable CO2 emissions due to electricity consumption. The positive effect of ICT on CO2 emissions is also consistent with the conclusions of research conducted by Salahuddin et al. [58] for OECD economies. However, the coefficient of ICT for East and Southeast Asia and for MENA is negative and statistically significant at 1%, respectively. It implies that ICTs such as e-commerce, food delivery orders, online meetings, and webinars are more advantageous, energy-saving, and use less carbon than traveling for these activities, which is a substantial cause of CO2 emissions in East and Southeast Asia and MENA countries. These outcomes are comparable to the conclusions of Chien et al. [59] for the BRICS nations. Fifth, it is observed that coefficient of ICT for OBOR, Europe, and Central Asia are positive and statistically significant, and the findings of GDP depict a significant positive connection towards CO2 emissions in all the regions. They found that a rise in GDP increases the quality of the environment [60]. The main cause for the positive link is that fossil fuels are the dominant sources of energy for agricultural and industrial, resulting in increasing economic growth and lower environmental sustainability [61,62,63,64,65]. Another possible explanation could be a rise in environmental contamination due to the country’s industrial growth, which is associated with the development of infrastructure and economic capitalization, all of which have a beneficial impact on funding and economic activity, and therefore increase energy consumption. This disclosure should act as a wake-up call to studied countries’ environmental administrators and lawmakers to lessen their pollution levels. [66,67,68,69,70].

6. Conclusions and Policy Implications

6.1. Conclusions

At COP 21 in Paris, the United Nations Framework Convention on Climate Change (UNFCCC) members struck a landmark consensus to combat climate change and expedite and reinforce the policies and investments required to secure a viable low-carbon future. The Paris Agreement expanded on this, by bringing all countries together for the first time to take systematic measures to combat and adapt to climate change, including increased support for developing countries. This also charted a new course for the global climate agenda. The OBOR countries embrace the task of reducing the environmental effect of CO2 emissions and, as a result, are strongly devoted to a climate of sustained development. As a result, this study investigates the relationship between technological innovation, globalization, and CO2 emissions by controlling the critical influence of information and communication technology, as well as economic growth, in a panel of OBOR countries from 1991 to 2019 utilizing cross-sectional dependence, Westerlund’s [20] cointegration, and the DSUR approach. In addition, this study also uses an interaction variable (TI*GLOB) to check the interaction role of technological innovation on the linkage between globalization and CO2 emissions, besides their direct effect on CO2 emissions in OBOR countries.
Westerlund’s [20] cointegration results give statistically substantial proof of the cointegration link between parameters. The DSUR empirical estimation reveals a significant relationship between CO2 emissions, technological innovation, globalization, TI*GLOB, information and communication technology, and economic growth. The linkage between technological innovation and CO2 emissions is negative and statically significant in all the regions (e.g., OBOR, South Asia, East and Southeast Asia, MENA, Europe, and Central Asia). Besides, the results of globalization show a significant positive relationship with CO2 emissions in OBOR and South Asia region. Nevertheless, it significantly negatively affects environmental pollution in East and Southeast Asia, MENA, Europe, and Central Asia. The results of TI*GLOB indicate that for the OBOR sample, East and Southeast Asia, and Central Asia, the moderation effects of technological innovation with globalization are significantly negatively associated with CO2 emissions. However, in MENA and Europe, the interaction effect is a significant positive. The coefficient of information and communication technology for OBOR, Europe, and Central Asia are positive and statistically significant, but for East and Southeast Asia and for MENA, it is statistically negative. The findings of economic growth depict a significant positive connection towards CO2 emissions in all the regions. It specifies that a surge in economic evolution destroys the quality of the environment. Moreover, the robustness check outcomes of fully modified ordinary least squares and dynamic ordinary least squares are equivalent to the DSUR estimation findings.

6.2. Policy Implications

These findings have substantial policy implications because they refute the current policies of the OBOR economies. Presently, OBOR countries are among the leading energy consumers and, as a result, are the highest CO2 emitters. Based on the findings, this study recommends the following policies are proposed. First, technological innovation must be fostered in order to achieve not only greener consumption at home, but also better output. Second, for OBOR and South Asia, technological innovation is essential through constant research and development investing in energy to counterbalance the pace of globalization and economic functions. Third, the positive influence of information and communication technology on CO2 emissions in OBOR, Europe, and Central Asia demonstrates that citizens of OBOR countries must adopt cleaner energy as well as energy-efficient information and communication technology equipment. The rise in CO2 emissions in OBOR countries could be attributed to a lack of renewable energy investment. The use of information and communication technology technologies, such as online banking, internet shopping, other mobile apps, efficient electricity usage, and the endorsement of more information and communication technology equipment expansion will help mitigate CO2 emissions even further. Finally, a wide range of policy approaches to increasing economic progress and environmental quality, and ensuring its long-term viability, should be studied. The development of the ICT infrastructure can enhance the power of policies and have a significant role in developing peoples’ ecological consciousness. To tackle the positive influence of energy consumption on CO2 emissions, allocation of the implementation of renewable energy resources and energy conservation projects for a better quality of the environment and the introduction of eco-friendly technologies can also reduce risks of environmental degradation. Policies favoring energy efficiency and the energy transition to renewable sources help mitigate carbon emissions. Finally, it is advised that attention be paid to the fertility rate, as population growth exerts pressure over the CO2 emissions. Various strategies, such as taxing polluting products and financial incentives for low-carbon products, can help improve the environment. OBOR economies should not ignore the globalization process in the policy framework regarding a sustainable environment and strike a balance between the economic benefits of globalization at cost of environmental degradation. The overall encouragement of globalization will attract foreign investments that will bring with them innovative methods of production, advanced industrial technology, and fresh knowledge and skills to home soil. As energy is a crucial source of economic development and the second largest source of environmental degradation, energy conservation tends not to be viable in these economies. The policymakers should encourage clean and green foreign investment and must welcome that investment, which brings technical skills, the production of eco-friendly technologies, and carbon-free methods to OBOR countries.
The heterogeneity of the countries under analysis imposes some limitations on our research. The next step should be to advance research by exploring econometric techniques that allow the decomposition of short-run and long-run effects and explore the differences between developing and developed countries.

Author Contributions

Conceptualization, A.B.; methodology, A.B. and X.L.; software, A.B.; validation, N.Z., R.S. and A.J.; formal analysis, A.B. and N.Z.; investigation, A.B. and A.J.; resources, N.Z. and X.L.; writing—original draft preparation, A.B and A.J.; writing—review and editing, A.B. and A.J.; supervision, X.L.; project administration, N.Z. All authors have read and agreed to the published version of the manuscript.

Funding

This research was funded by the National Natural Science Foundation of China (Grant No.71961031).

Institutional Review Board Statement

Not applicable.

Informed Consent Statement

Not applicable.

Data Availability Statement

The datasets used and/or analyzed during the current study are variability from the corresponding author on reasonable request.

Acknowledgments

The authors are grateful for the financial support provided by the National Natural Science Foundation of China (Grant Nos. 71961031, 71362016).

Conflicts of Interest

The authors declare no conflict of interest.

Appendix A

Table A1. Names of the countries in OBOR according to their geographic region.
NumberGeographic RegionName of Country
1South AsiaBangladesh
2 India
3 Pakistan
4 Sri Lanka
5East and Southeast AsiaChina
6 Mongolia
7 Indonesia
8 Malaysia
9 Philippines
10 Singapore
11 Thailand
12 Vietnam
13 Korea, Rep.
14 Russian Federation
15Middle East and North AfricaEgypt, Arab Rep.
16 Iran, Islamic Rep.
17 Iraq
18 Jordan
19 Saudi Arabia
20 Yemen, Rep.
21 Morocco
22 Tunisia
23 Israel
24EuropeArmenia
25 Azerbaijan
26 Belarus
27 Bulgaria
28 Croatia
29 Czech Republic
30 Estonia
31 Georgia
32 Hungary
33 Latvia
34 Lithuania
35 Moldova
36 Poland
37 Romania
38 Slovak Republic
39 Slovenia
40 Ukraine
41Central AsiaKazakhstan
42 Kyrgyz Republic
43 Tajikistan
44 Uzbekistan

References

  1. Chishti, M.Z.; Sinha, A. Do the shocks in technological and financial innovation influence the environmental quality? Evidence from BRICS economies. Technol. Soc. 2021, 68, 101828. [Google Scholar] [CrossRef]
  2. Pachauri, R.K.; Allen, M.R.; Barros, V.R.; Broome, J.; Cramer, W.; Christ, R.; Church, J.A.; Clarke, L.; Dahe, Q.; Dasgupta, P.; et al. Climate Change 2014: Synthesis Report. Contribution of Working Groups I, II and III to the Fifth Assessment Report of the Intergovernmental Panel on Climate Change; IPCC: Geneva, Switzerland, 2014; 151p. [Google Scholar]
  3. Weimin, Z.; Chishti, M.Z.; Rehman, A.; Ahmad, M. A pathway toward future sustainability: Assessing the influence of innovation shocks on CO2 emissions in developing economies. Environ. Dev. Sustain. 2021, 1–24. [Google Scholar] [CrossRef]
  4. Aghion, P.; Howitt, P. A Model of Growth Through Creative Destruction. Econometrica 1992, 60, 323. [Google Scholar] [CrossRef]
  5. Ellabban, O.; Abu-Rub, H.; Blaabjerg, F. Renewable energy resources: Current status, future prospects and their enabling technology. Renew. Sustain. Energy. Rev. 2014, 39, 748–764. [Google Scholar] [CrossRef]
  6. Gerlagh, R. Measuring the value of induced technological change. Energy Policy 2007, 35, 5287–5297. [Google Scholar] [CrossRef]
  7. Weimin, Z.; Chishti, M.Z. Toward Sustainable Development: Assessing the Effects of Commercial Policies on Consumption and Production-Based Carbon Emissions in Developing Economies. SAGE Open 2021, 11, 21582440211061580. [Google Scholar] [CrossRef]
  8. Yang, L.; Li, Z. Technology advance and the carbon dioxide emission in China-Empirical research based on the rebound effect. Energy Policy 2017, 101, 150–161. [Google Scholar] [CrossRef]
  9. Lee, C.C.; Lee, C.C.; Chang, C.P. Globalization, Economic Growth and Institutional Development in China. Glob. Econ. Rev. 2015, 44, 31–63. [Google Scholar] [CrossRef]
  10. Chishti, M.Z.; Ahmad, M.; Rehman, A.; Khan, M.K. Mitigations pathways towards sustainable development: Assessing the influence of fiscal and monetary policies on carbon emissions in BRICS economies. J. Clean. Prod. 2021, 292, 126035. [Google Scholar] [CrossRef]
  11. Chishti, M.Z.; Ullah, S.; Ozturk, I.; Usman, A. Examining the asymmetric effects of globalization and tourism on pollution emissions in South Asia. Environ. Sci. Pollut. Res. 2020, 27, 27721–27737. [Google Scholar] [CrossRef]
  12. Zaidi, S.A.H.; Zafar, M.W.; Shahbaz, M.; Hou, F. Dynamic linkages between globalization, financial development and carbon emissions: Evidence from Asia Pacific Economic Cooperation countries. J. Clean. Prod. 2019, 228, 533–543. [Google Scholar] [CrossRef]
  13. Huang, Y. Understanding China’s Belt Road Initiative: Motivation, framework and assessment. China Econ. Rev. 2016, 40, 314–321. [Google Scholar] [CrossRef]
  14. Luo, H.; Korolev, K.Y. Vision and Action for Jointly Building the Silk Road Economic Belt and the 21st Century Maritime Silk Road; Bo’ao Forum: Hainan, China, 2015. [Google Scholar]
  15. Chin, H.; He, W. The Belt and Road Initiative: 65 Countries and Beyond. Fung Bus Intell Cent 16. 2016. Available online: https://www.fbicgroup.com/sites/default/files/B%26R_Initiative_65_Countries_and_Beyond.pdf (accessed on 25 August 2021).
  16. Krane, J. Krane Shares and CICC to host One Belt One Road Summit at NYSE. 2018. Available online: https://www.prnewswire.com/news-releases/kraneshares-and-cicc-to-host-one-belt-one-road-summit-at-nyse-300579614.html (accessed on 15 August 2021).
  17. Costa, J.; Cancela, D.; Reis, J. Neverland or Tomorrowland? Addressing (In) compatibility among the SDG Pillars in Europe. Int. J. Environ. Res. Public Health 2021, 18, 11858. [Google Scholar] [CrossRef] [PubMed]
  18. Chin, H. The Belt and Road Initiative and Its Business Implications. 2017. Available online: https://www.fbicgroup.com/?q=publication/belt-and-road-initiative-and-its-business-implications (accessed on 27 August 2021).
  19. Fung Business Intelligence. The Belt and Road Initiative: Seeking Deeper and Broader Cooperation; Fung Business Intelligence: Beijing, China, 2017. [Google Scholar]
  20. Westerlund, J. Testing for error correction in panel data. Oxf. Bull. Econ. Stat. 2007, 69, 709–748. [Google Scholar] [CrossRef] [Green Version]
  21. Lantz, V.; Feng, Q. Assessing income, population, and technology impacts on CO2 emissions in Canada: Where’s the EKC? Ecol. Econ. 2006, 57, 229–238. [Google Scholar] [CrossRef]
  22. Sun, Y.; Lu, Y.; Wang, T.; Ma, H.; He, G. Pattern of patent-based environmental technology innovation in China. Technol. Forecast. Soc. Chang. 2008, 75, 1032–1042. [Google Scholar] [CrossRef]
  23. Sohag, K.; Begum, R.A.; Syed Abdullah, S.M.; Jaafar, M. Dynamics of energy use, technological innovation, economic growth and trade openness in Malaysia. Energy 2015, 90, 1497–1507. [Google Scholar] [CrossRef]
  24. Álvarez-Herránz, A.; Balsalobre, D.; Cantos, J.M.; Shahbaz, M. Energy Innovations-GHG Emissions Nexus: Fresh Empirical Evidence from OECD Countries. Energy Policy 2017, 101, 90–100. [Google Scholar] [CrossRef]
  25. Chen, W.; Lei, Y. The impacts of renewable energy and technological innovation on environment-energy-growth nexus: New evidence from a panel quantile regression. Renew. Energy 2018, 123, 1–14. [Google Scholar] [CrossRef]
  26. Chishti, M.Z.; Ahmed, Z.; Murshed, M.; Namkambe, H.H.; Ulucak, R. The asymmetric associations between foreign direct investment inflows, terrorism, CO2 emissions, and economic growth: A tale of two shocks. Environ. Sci. Pollut. Res. 2021, 1–19. [Google Scholar] [CrossRef]
  27. Danish; Ulucak, R. How do environmental technologies affect green growth? Evidence from BRICS economies. Sci. Total Environ. 2020, 712, 136504. [Google Scholar] [CrossRef] [PubMed]
  28. Shahbaz, M.; Khan, S.; Ali, A.; Bhattacharya, M. The Impact of Globalization on CO2 Emissions in China. Singap. Econ. Rev. 2017, 62, 929–957. [Google Scholar] [CrossRef] [Green Version]
  29. Lv, Z.; Xu, T. Is economic globalization good or bad for the environmental quality? New evidence from dynamic heterogeneous panel models. Technol. Forecast. Soc. Chang. 2018, 137, 340–343. [Google Scholar] [CrossRef]
  30. Shujah-ur-Rahman; Chen, S.; Saud, S.; Bano, S.; Haseeb, A. The nexus between financial development, globalization, and environmental degradation: Fresh evidence from Central and Eastern European Countries. Environ. Sci. Pollut. Res. 2019, 26, 24733–24747. [Google Scholar] [CrossRef] [PubMed]
  31. Koengkan, M.; Fuinhas, J.A.; Santiago, R. Asymmetric impacts of globalization on CO2 emissions of countries in Latin America and the Caribbean. Environ. Syst. Decis. 2020, 40, 135–147. [Google Scholar] [CrossRef]
  32. Bilgili, F.; Ulucak, R.; Koçak, E.; İlkay, S.Ç. Does globalization matter for environmental sustainability? Empirical investigation for Turkey by Markov regime switching models. Environ. Sci. Pollut. Res. 2020, 27, 1087–1100. [Google Scholar] [CrossRef] [PubMed]
  33. Kalaycı, C.; Hayaloğlu, P. The impact of economic globalization on CO2 emissions: The case of NAFTA countries. Int. J. Energy Econ. Policy 2019, 9, 356–360. [Google Scholar] [CrossRef]
  34. Khan, D.; Ullah, A. Testing the relationship between globalization and carbon dioxide emissions in Pakistan: Does environmental Kuznets curve exist? Environ. Sci. Pollut. Res. 2019, 26, 15194–15208. [Google Scholar] [CrossRef] [PubMed]
  35. Ullah, S.; Chishti, M.Z.; Majeed, M.T. The asymmetric effects of oil price changes on environmental pollution: Evidence from the top ten carbon emitters. Environ. Sci. Pollut. Res. 2020, 27, 29623–29635. [Google Scholar] [CrossRef]
  36. Saud, S.; Chen, S.; Haseeb, A.; Sumayya. The role of financial development and globalization in the environment: Accounting ecological footprint indicators for selected one-belt-one-road initiative countries. J. Clean. Prod. 2020, 250. [Google Scholar] [CrossRef]
  37. Godil, D.I.; Sharif, A.; Agha, H.; Jermsittiparsert, K. The dynamic nonlinear influence of ICT, financial development, and institutional quality on CO2 emission in Pakistan: New insights from QARDL approach. Environ. Sci. Pollut. Res. 2020, 27, 24190–24200. [Google Scholar] [CrossRef] [PubMed]
  38. Yang, B.; Ali, M.; Hashmi, S.H.; Shabir, M. Income Inequality and CO2 Emissions in Developing Countries: The Moderating Role of Financial Instability. Sustainability 2020, 12, 6810. [Google Scholar] [CrossRef]
  39. Yang, B.; Ali, M.; Nazir, M.R.; Ullah, W.; Qayyum, M. Financial instability and CO2 emissions: Cross-country evidence. Air Qual. Atmos. Health 2020, 13, 459–468. [Google Scholar] [CrossRef]
  40. Shahbaz, M.; Lean, H.H.; Shabbir, M.S. Environmental Kuznets Curve hypothesis in Pakistan: Cointegration and Granger causality. Renew. Sustain. Energy Rev. 2012, 16, 2947–2953. [Google Scholar] [CrossRef] [Green Version]
  41. Cohen, P.; West, S.G.; Aiken, L.S. Applied Multiple Regression/Correlation Analysis for the Behavioral Sciences; Routledge: New York, NY, USA, 2013. [Google Scholar]
  42. Dreher, A. Does globalization affect growth? Evidence from a new index of globalization. Appl. Econ. 2006, 38, 1091–1110. [Google Scholar] [CrossRef] [Green Version]
  43. Pesaran, M.H. General diagnostic tests for cross-sectional dependence in panels. Empir. Econ. 2020, 60, 13–50. [Google Scholar] [CrossRef]
  44. Pesaran, M. A simple panel unit root test in the presence of cross-section dependence. J. Appl. Econ. 2007, 22, 265–312. [Google Scholar] [CrossRef] [Green Version]
  45. Yang, B.; Jahanger, A.; Ali, M. Remittance inflows affect the ecological footprint in BICS countries: Do technological innovation and financial development matter? Environ. Sci. Pollut. Res. 2021, 28, 23482–23500. [Google Scholar] [CrossRef]
  46. Shabir, M.; Ali, M.; Hashmi, S.H.; Bakhsh, S. Heterogeneous effects of economic policy uncertainty and foreign direct investment on environmental quality: Cross-country evidence. Environ. Sci. Pollut. Res. 2021, 1–16. [Google Scholar] [CrossRef]
  47. Mark, N.C.; Ogaki, M.; Sul, D. Dynamic seemingly unrelated cointegrating regressions. Rev. Econ. Stud. 2005, 72, 797–820. [Google Scholar] [CrossRef]
  48. Phillips, P.C.B.; Hansen, B.E. Statistical Inference in Instrumental Variables Regression with I(1) Processes. Rev. Econ. Stud. 1990, 57, 99–125. [Google Scholar] [CrossRef]
  49. Kalmaz, D.B.; Kirikkaleli, D. Modeling CO2 emissions in an emerging market: Empirical finding from ARDL-based bounds and wavelet coherence approaches. Environ. Sci. Pollut. Res. 2019, 26, 5210–5220. [Google Scholar] [CrossRef] [PubMed]
  50. Kirikkaleli, D.; Athari, S.A.; Ertugrul, H.M. The real estate industry in Turkey: A time series analysis. Serv. Ind. J. 2021, 41, 427–439. [Google Scholar] [CrossRef]
  51. Qayyum, M.; Ali, M.; Nizamani, M.M.; Li, S.; Yu, Y.; Jahanger, A.; Arana, G. Nexus between Financial Development, Renewable Energy Consumption, Technological Innovations and CO2 Emissions: The Case of India. Energies 2021, 14, 4505. [Google Scholar] [CrossRef]
  52. Cheng, C.; Ren, X.; Dong, K.; Dong, X.; Wang, Z. How does technological innovation mitigate CO2 emissions in OECD countries? Heterogeneous analysis using panel quantile regression. J. Environ. Manag. 2021, 280, 111818. [Google Scholar] [CrossRef]
  53. Chunling, L.; Memon, J.A.; Thanh, T.L.; Ali, M.; Kirikkaleli, D. The Impact of Public-Private Partnership Investment in Energy and Technological Innovation on Ecological Footprint: The Case of Pakistan. Sustainability 2021, 13, 10085. [Google Scholar] [CrossRef]
  54. Pata, U.K. Linking renewable energy, globalization, agriculture, CO2 emissions and ecological footprint in BRIC countries: A sustainability perspective. Renew. Energy 2021, 173, 197–208. [Google Scholar] [CrossRef]
  55. Saud, S.; Danish; Chen, S. An empirical analysis of financial development and energy demand: Establishing the role of globalization. Environ. Sci. Pollut. Res. 2018, 25, 24326–24337. [Google Scholar] [CrossRef] [PubMed]
  56. Shahbaz, M.; Shahzad, S.J.H.; Ahmad, N.; Alam, S. Financial development and environmental quality: The way forward. Energy Policy 2016, 98, 353–364. [Google Scholar] [CrossRef] [Green Version]
  57. Akadiri, S.S.; Alola, A.A.; Bekun, F.V.; Etokakpan, M.U. Does electricity consumption and globalization increase pollutant emissions? Implications for environmental sustainability target for China. Environ. Sci. Pollut. Res. 2020, 27, 25450–25460. [Google Scholar] [CrossRef]
  58. Salahuddin, M.; Alam, K.; Ozturk, I. The effects of Internet usage and economic growth on CO2 emissions in OECD countries: A panel investigation. Renew. Sustain. Energy Rev. 2016, 62, 1226–1235. [Google Scholar] [CrossRef]
  59. Chien, F.; Anwar, A.; Hsu, C.C.; Sharif, A.; Razzaq, A.; Sinha, A. The role of information and communication technology in encountering environmental degradation: Proposing an SDG framework for the BRICS countries. Technol. Soc. 2021, 65, 101587. [Google Scholar] [CrossRef]
  60. Ali, M.; Kirikkaleli, D. The asymmetric effect of renewable energy and trade on consumption-based CO2 emissions: The case of Italy. Integr. Environ. Assess. Manag. 2021. [Google Scholar] [CrossRef]
  61. He, X.; Adebayo, T.S.; Kirikkaleli, D.; Umar, M. Consumption-based carbon emissions in Mexico: An analysis using the dual adjustment approach. Sustain. Prod. Consum. 2021, 27, 947–957. [Google Scholar] [CrossRef]
  62. Usman, M.; Jahanger, A. Heterogeneous effects of remittances and institutional quality in reducing environmental deficit in the presence of EKC hypothesis: A global study with the application of panel quantile regression. Environ. Sci. Pollut. Res. 2021, 28, 37292–37310. [Google Scholar] [CrossRef] [PubMed]
  63. Yang, B.; Jahanger, A.; Usman, M.; Khan, M.A. The dynamic linkage between globalization, financial development, energy utilization, and environmental sustainability in GCC countries. Environ. Sci. Pollut. Res. 2021, 28, 16568–16588. [Google Scholar] [CrossRef] [PubMed]
  64. Jahanger, A.; Usman, M.; Balsalobre-Lorente, D. Autocracy, democracy, globalization, and environmental pollution in developing world: Fresh evidence from STIRPAT model. J. Public Aff. 2021, e2753. [Google Scholar] [CrossRef]
  65. Yang, B.; Usman, M.; Jahanger, A. Do industrialization, economic growth and globalization processes influence the ecological footprint and healthcare expenditures? Fresh insights based on the STIRPAT model for countries with the highest healthcare expenditures. Sustain. Prod. Consum. 2021, 28, 893–910. [Google Scholar] [CrossRef]
  66. Jahanger, A.; Usman, M.; Ahmed, P. A step towards sustainable path: The effect of globalization on China’s carbon productivity from panel threshold approach. Environ. Sci. Pollut. Res. 2021, 1–16. [Google Scholar] [CrossRef]
  67. Kamal, M.; Usman, M.; Jahanger, A.; Balsalobre-Lorente, D. Revisiting the Role of Fiscal Policy, Financial Development, and Foreign Direct Investment in Reducing Environmental Pollution during Globalization Mode: Evidence from Linear and Nonlinear Panel Data Approaches. Energies 2021, 14, 6968. [Google Scholar] [CrossRef]
  68. Qiang, O.; Tian-Tian, W.; Ying, D.; Zhu-Ping, L.; Jahanger, A. The impact of environmental regulations on export trade at provincial level in China: Evidence from panel quantile regression. Environ. Sci. Pollut. Res. 2021, 1–14. [Google Scholar] [CrossRef] [PubMed]
  69. Jahanger, A. Impact of globalization on CO2 emissions based on EKC hypothesis in developing world: The moderating role of human capital. Environ. Sci. Pollut. Res. 2020, 1–21. [Google Scholar] [CrossRef] [PubMed]
  70. Yang, B.; Jahanger, A.; Khan, M.A. Does the inflow of remittances and energy consumption increase CO 2 emissions in the era of globalization? A global perspective. Air Qual. Atmos. Health 2020, 13, 1313–1328. [Google Scholar] [CrossRef]
Figure 1. Road map of econometric modeling strategy.
Sustainability 14 00236 g001
Table 1. Descriptive statistics.
VaraiblesMeanStd. Dev.MinMax
CO211.03071.68817.539616.3441
TI5.91382.03660.693114.1475
GLOB4.07320.25893.12234.4624
ICT5.88049.39239.048142.7644
GDP8.33421.10935.905110.9865
Observations1276127612761276
Table 2. CD test results.
VariablesCO2TIGlobTI*GlobICTGDP
OBOR
CD-stats10.96 ***11.482 ***25.88 ***18.09 ***15.82 ***6.661 ***
p-value0.0000.0000.0000.0000.0000.000
South Asia
CD-stats6.463 ***10.284 ***11.729 ***9.916 ***7.196 ***12.138 ***
p-value0.0000.0000.0000.0000.0000.000
East and Southeast Asia
CD-stats10.531 ***11.169 ***15.901 ***10.728 ***8.700 ***11.345 ***
p-value0.0000.0000.3560.0000.0000.000
MENA
CD-stats11.914 ***8.464 ***13.895 ***7.173 ***7.799 ***10.709 ***
p-value0.0000.0000.0000.0000.0000.000
Europe
CD-stats10.79 ***9.265 ***7.096 ***23.03 ***13.50 ***13.979 ***
p-value0.0000.0000.0000.0000.0000.000
Central Asia
CD-stats12.829 **10.299 ***6.109 ***12.726 ***10.999 ***10.332 ***
p-value0.0000.0000.0000.0000.0000.000
Note: Null hypothesis: no cross-sectional dependence. *** p < 0.01, ** p < 0.05.
Table 3. Panel unit root statistics.
VariablesCIPS CADF
Level1st Diff.DecisionLevel1st Diff.Decision
OBOR
CO2−0.588−3.719 ***I (1)−0.924−4.201 ***I (1)
TI−1.391−3.308 **I (1)−3.407 *** I (0)
Glob−1.130−3.506 ***I (1)−4.166 *** I (0)
TI*Glob0.426−2.225 ***I (1)1.392−7.673 ***
ICT−0.998−2.621 ***I (1)1.253−9.123 ***
GDP−1.584−3.078 ***I (1)4.124−19.87 ***I (1)
South Asia
CO2−1.536−3.868 ***I (1)0.386−4.980 ***I (1)
TI−2.396 *** I (0)−0.637−12.18 ***I (1)
Glob−1.681−3.594 ***I (1)−0.440−8.457 ***I (1)
TI*Glob0.499−2.304 *I (1)0.704−3.297 *I (1)
ICT−0.108−2.858 ***I (1)1.443−3.682 **I (1)
GDP0.403−2.912 ***I (1)0.1803.094 *I (1)
East and South east Asia
CO2−1.589−4.810 ***I (1)−3.092 *** I (0)
TI−1.447−3.574 ***I (1)−2.859 ** I (0)
Glob−2.811 * I (0)−2.695 ** I (0)
TI*Glob0.140−2.611 **I (1)1.560−4.159 ***I (1)
ICT−1.125−2.844 **I (1)1.573−5.920 ***I (1)
GDP−2.531 ** I (0)−4.445 *** I (0)
MENA
CO2−0.005−3.910 ***I (1)0.231−16.77 ***I (1)
TI−1.206−3.360 ***I (1)1.628−10.85 ***I (1)
Glob−0.485−3.126 ***I (1)0.031−7.604 ***I (1)
TI*Glob−0.433−2.738 ***I (1)1.502−3.654 ***I (1)
ICT−0.986−2.563 ***I (1)1.770−3.424 ***I (1)
GDP−2.497 *** I (0)−4.604 *** I (0)
Europe
CO2−1.832−3.916 ***I (1)−1.115−21.04 ***I (1)
TI−1.739−4.752 ***I (0)−4.142 *** I (0)
Glob−1.683−2.714 **I (1)−3.992 *** I (0)
TI*Glob−0.619−3.754 ***I (1)1.447−3.121 ***I (1)
ICT−1.097−5.101 ***I (1)1.063−5.096 ***I (1)
GDP−2.747 ** I (0)−7.013 *** 1 (0)
Central Asia
CO2−1.703−3.718 ***I (1)0.130−9.047 ***I (1)
TI−1.897−3.462 ***I (1)−1.751−4.772 ***I (1)
Glob−2.692 *** I (0)−0.932−9.642 ***I (1)
TI*Glob1.715−2.280 **I (1)3.425−4.658 ***I (1)
ICT−1.179−3.346 ***I (1)4.336−3.571 ***1 (1)
GDP−3.017 *** I (0)−4.533 *** 1 (0)
Note: *** p < 0.01, ** p < 0.05, * p < 0.10.
Table 4. Results of the Westerlund cointegration test.
GtGaPtPa
OBOR−3.475 ***−1.349−24.62 ***−10.58
South Asia−4.89 ***−3.094−17.03 ***−1.484
East and South East Asia−5.42 **−4.094−14.12 ***−4.723
MENA−4.773 ***−2.408−9.452 ***−7.672
Europe−3.727 ***−1.084−13.30 **−7.118
Central Asia−4.523 ***−1.981−6.164 ***−6.578 **
Note: Null hypothesis: no cointegration. *** p < 0.01 and ** p < 0.05.
Table 5. Results of DSUR (overall and region-wise).
VariablesOBORSouth AsiaEast and Southeast AsiaMENAEuropeCentral Asia
TI−0.092 ***−0.088 ***−0.079 ***0.003−0.064 ***−0.001−0.061 ***−0.005−0.011 **−0.038 ***−0.001−0.051 ***
(0.001)(0.001)(0.000)(0.299)(0.000)(0.519)(0.000)(0.176)(0.039)(0.005)(0.290)(0.001)
GLOB0.221 **0.418 **0.081 ***0.022 ***−0.072 ***0.027 ***−0.074 ***−0.035 ***−0.089 ***−0.012 **−0.063 ***0.046 ***
(0.025)(0.031)(0.000)(0.000)(0.000)(0.000)(0.000)(0.001)(0.000)(0.020)(0.005)(0.000)
TI*GLOB −0.077 ** −0.001 −0.091 *** 0.041 *** 0.076 ***…….−0.059 ***
(0.021) (0.821) (0.000) (0.000) (0.000) (0.000)
ICT0.031 **0.214 *0.004−0.01−0.099 ***−0.051 ***−0.078 ***0.055 ***0.041 ***0.0010.075 ***0.083 ***
(0.033)(0.071)(0.191)(0.319)(0.007)(0.001)(0.004)(0.000)(0.001)(0.271)(0.001)(0.000)
GDP0.045 ***0.067 ***0.033 ***0.0930.072 ***0.281 *0.086 ***0.069 ***0.015 **0.062 ***0.087 ***0.059 ***
(0.000)(0.00)(0.002)(0.029)(0.003)(0.061)(0000)(0.000)(0.041)(0.000)(0.002)(0.008)
Note:p-values are in parentheses. *** p < 0.01, ** p < 0.05, * p < 0.1.
Table 6. Results of robustness checks (FMOLS and DOLS).
VariablesFMOLSDOLS
TI−0.1162 ***
(0.0009)
−0.1591 ***
(0.0001)
−0.1510 ***
(0.0011)
−0.1912 ***
(0.0001)
GLOB0.1501 ***
(0.0000)
0.0891 **
(0.0411)
0.1712 ***
(0.0000)
0.1191 ***
(0.0001)
TI*GLOB-−0.1392 ***
(0.0000)
-−0.1711 ***
(0.0000)
ICT0.1454 ***
(0.0000)
0.0625 **
(0.0392)
0.1629 ***
(0.0021)
0.1414 ***
(0.0036)
GDP0.0939 **
(0.0210)
0.1377 ***
(0.0001)
0.1281 ***
(0.0017)
0.1822 ***
(0.0041)
Constant−3.2871 ***
(0.0000)
−4.1915 ***
(0.0000)
−3.1250 ***
(0.0000)
−3.9271 ***
(0.0001)
Note:p-values are in parentheses. *** p < 0.01, ** p < 0.05.
Publisher’s Note: MDPI stays neutral with regard to jurisdictional claims in published maps and institutional affiliations.

