
Feasibility Assessment of Hybrid Solar Photovoltaic-Biogas Generator Based Charging Station: A Case of Easy Bike and Auto Rickshaw Scenario in a Developing Nation

 ,
,  ,
,  , ,
, , 

Abstract
:1. Introduction
- provides biogas and solar-PV-based efficient energy solution for EV charging purposes;
- determines the most financially viable hybrid EV charging system for the selected area regarding various financial and technical parameters;
- investigates the designed system’s performance due to the uncertain variation of the input key variables by sensitivity analysis;
- analyzes the environmental benefits in comparison to the existing system in terms of emission of GHGs (CO2, CO, SO2, and NOX); and
- discusses the policy aspects of the proposed standalone hybrid charging system to highlight its significance towards reducing the stress of the national grid.
2. Favorable Policies
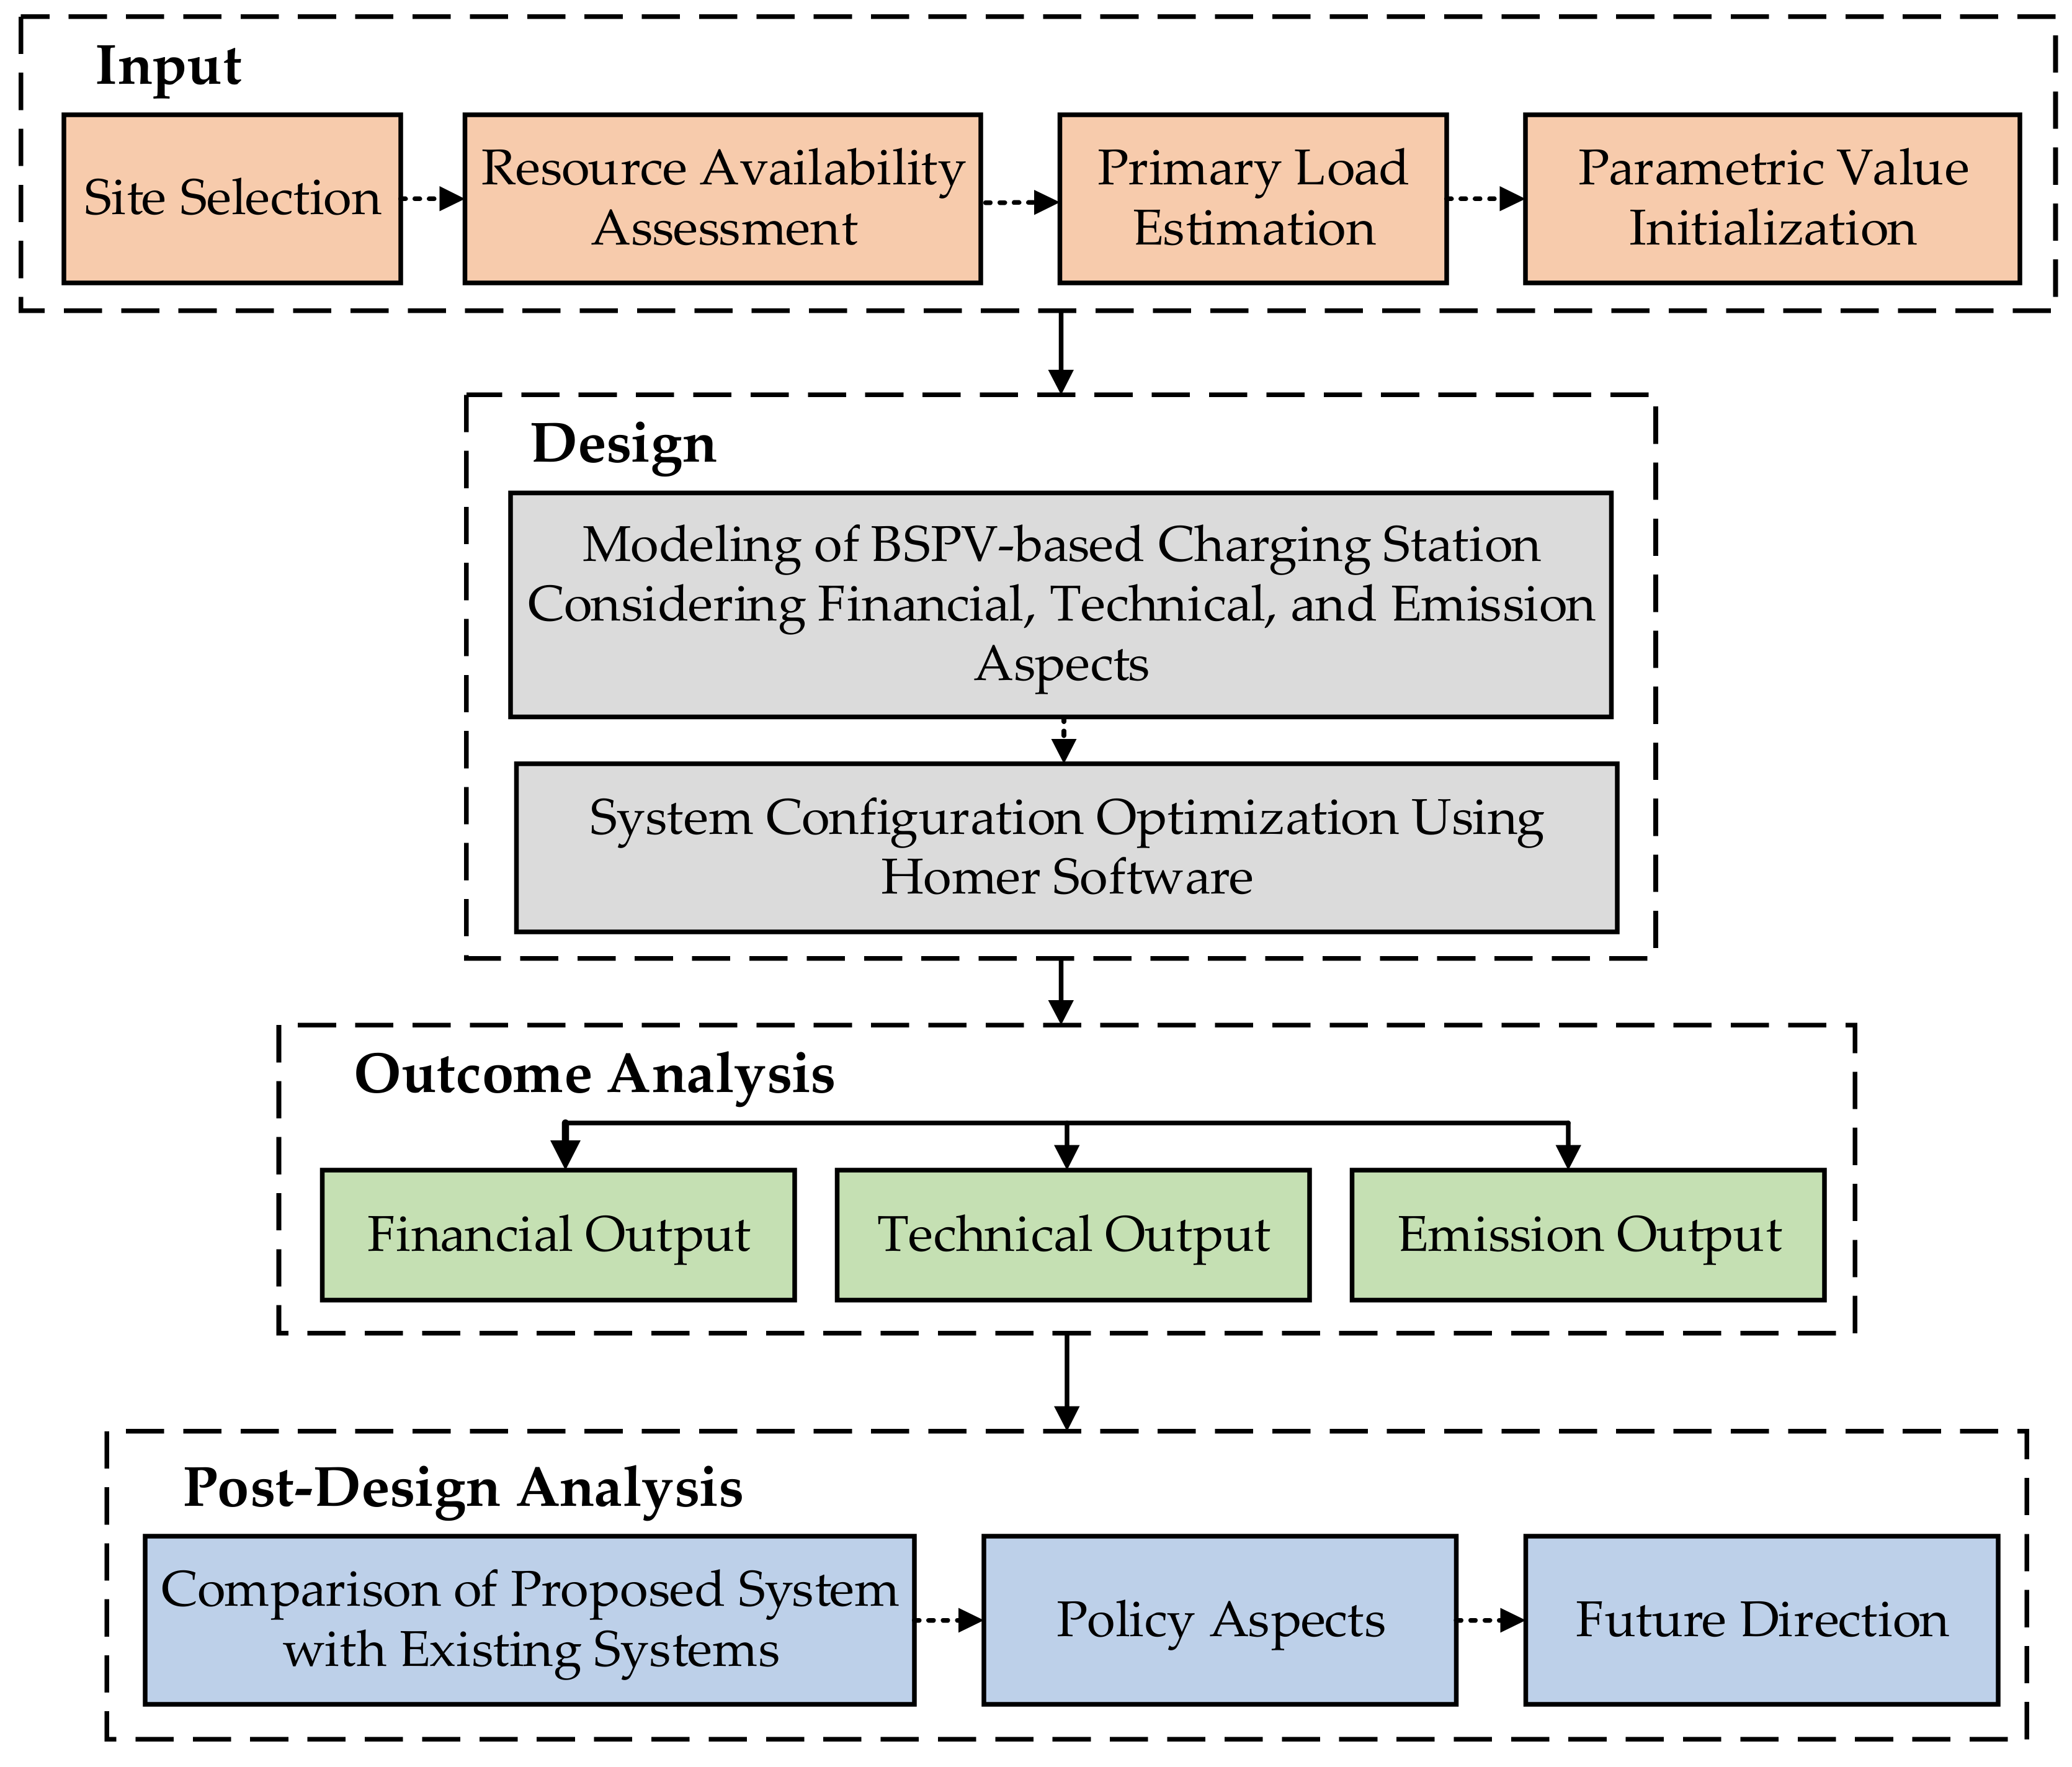
3. Materials and Methods
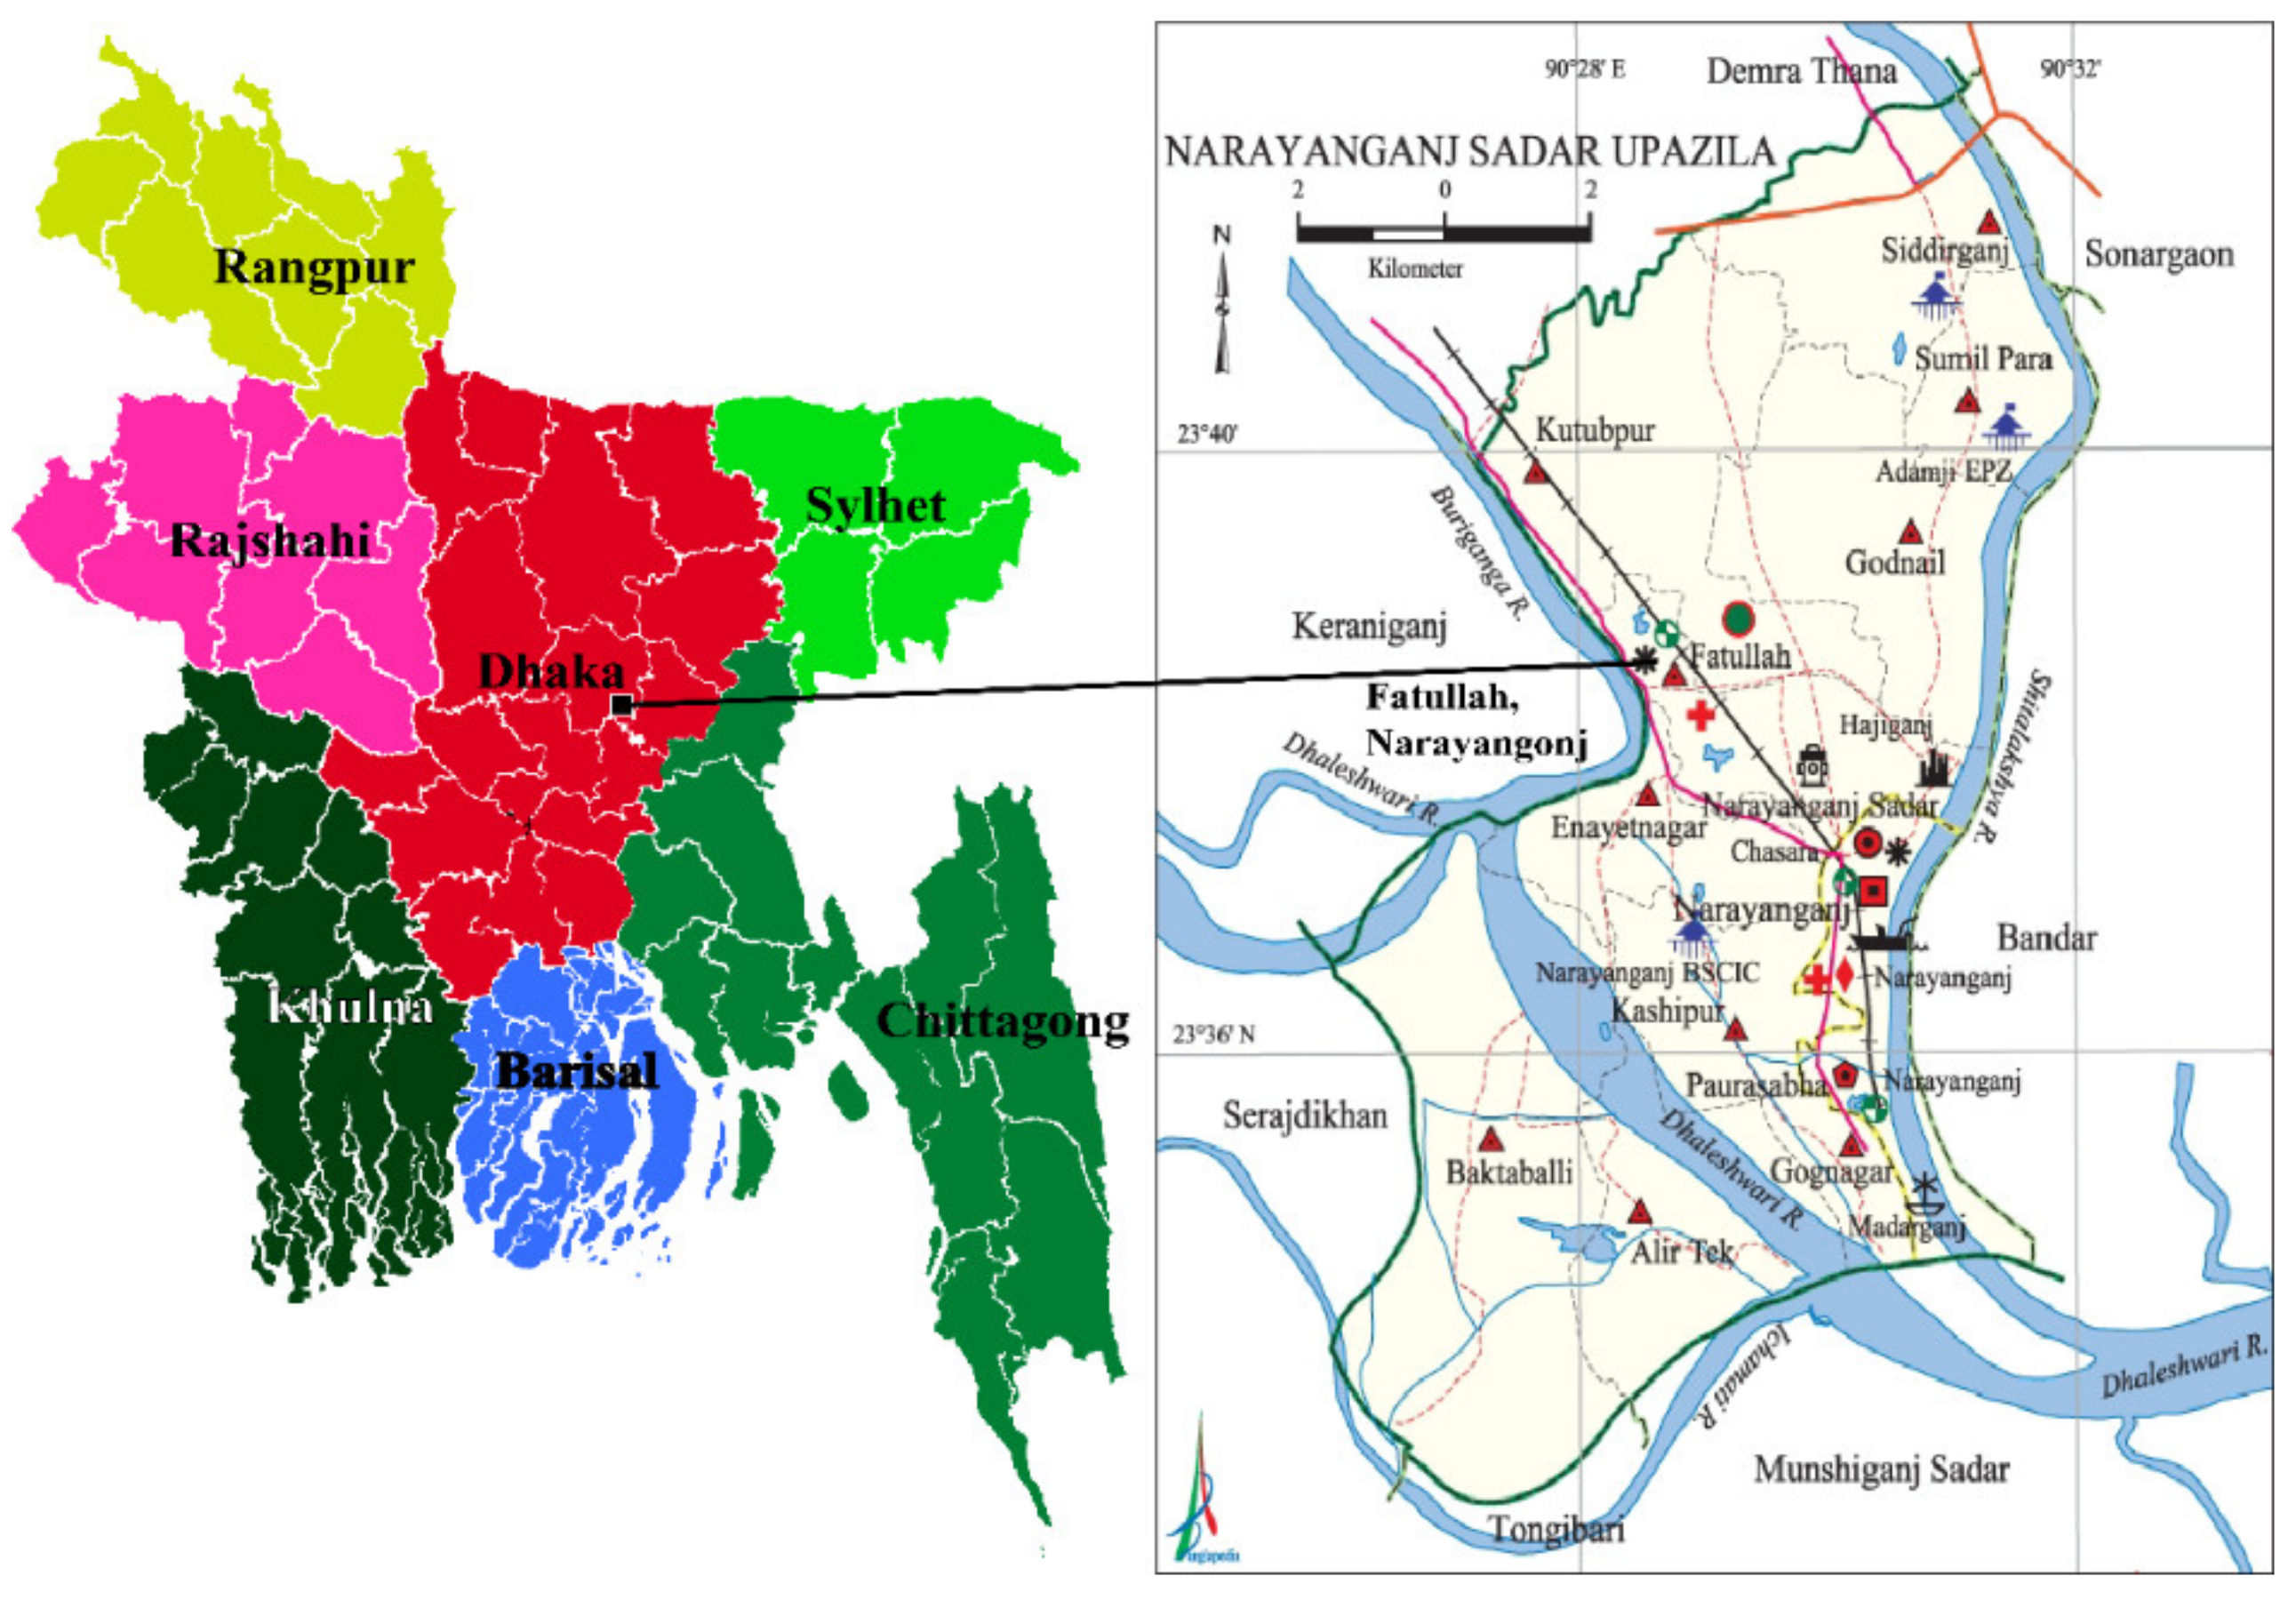
3.1. Study Region
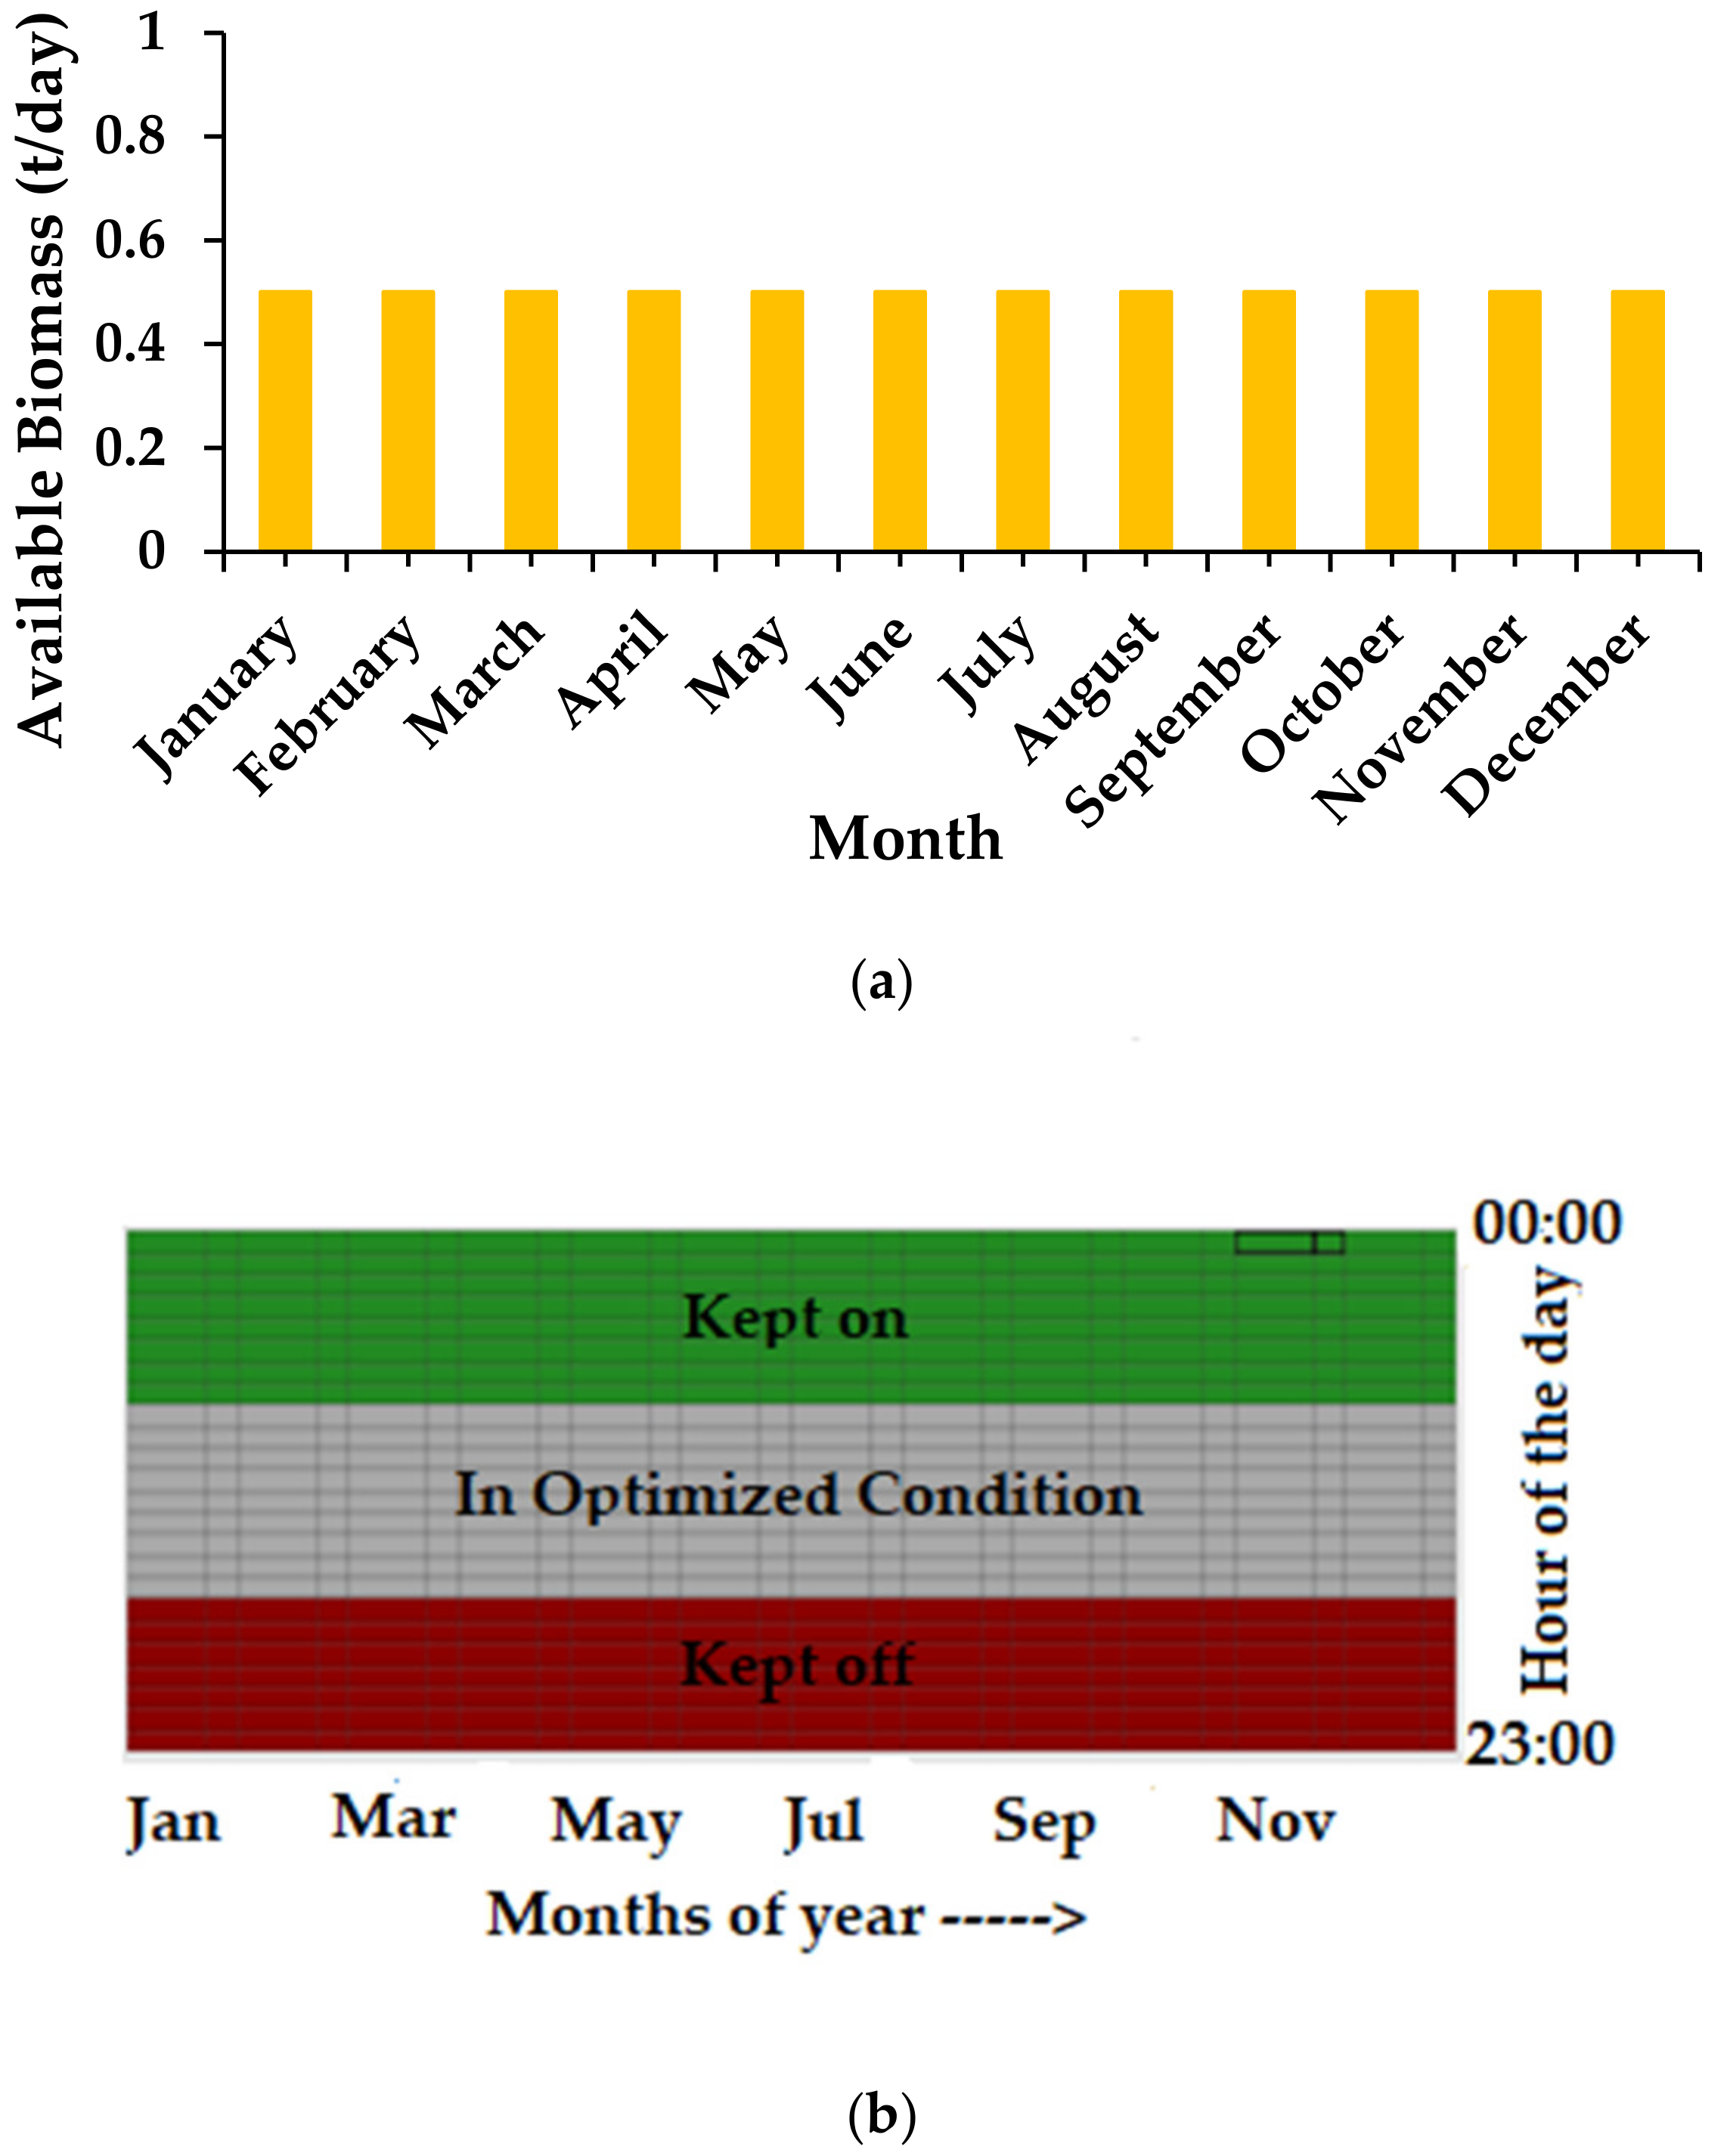
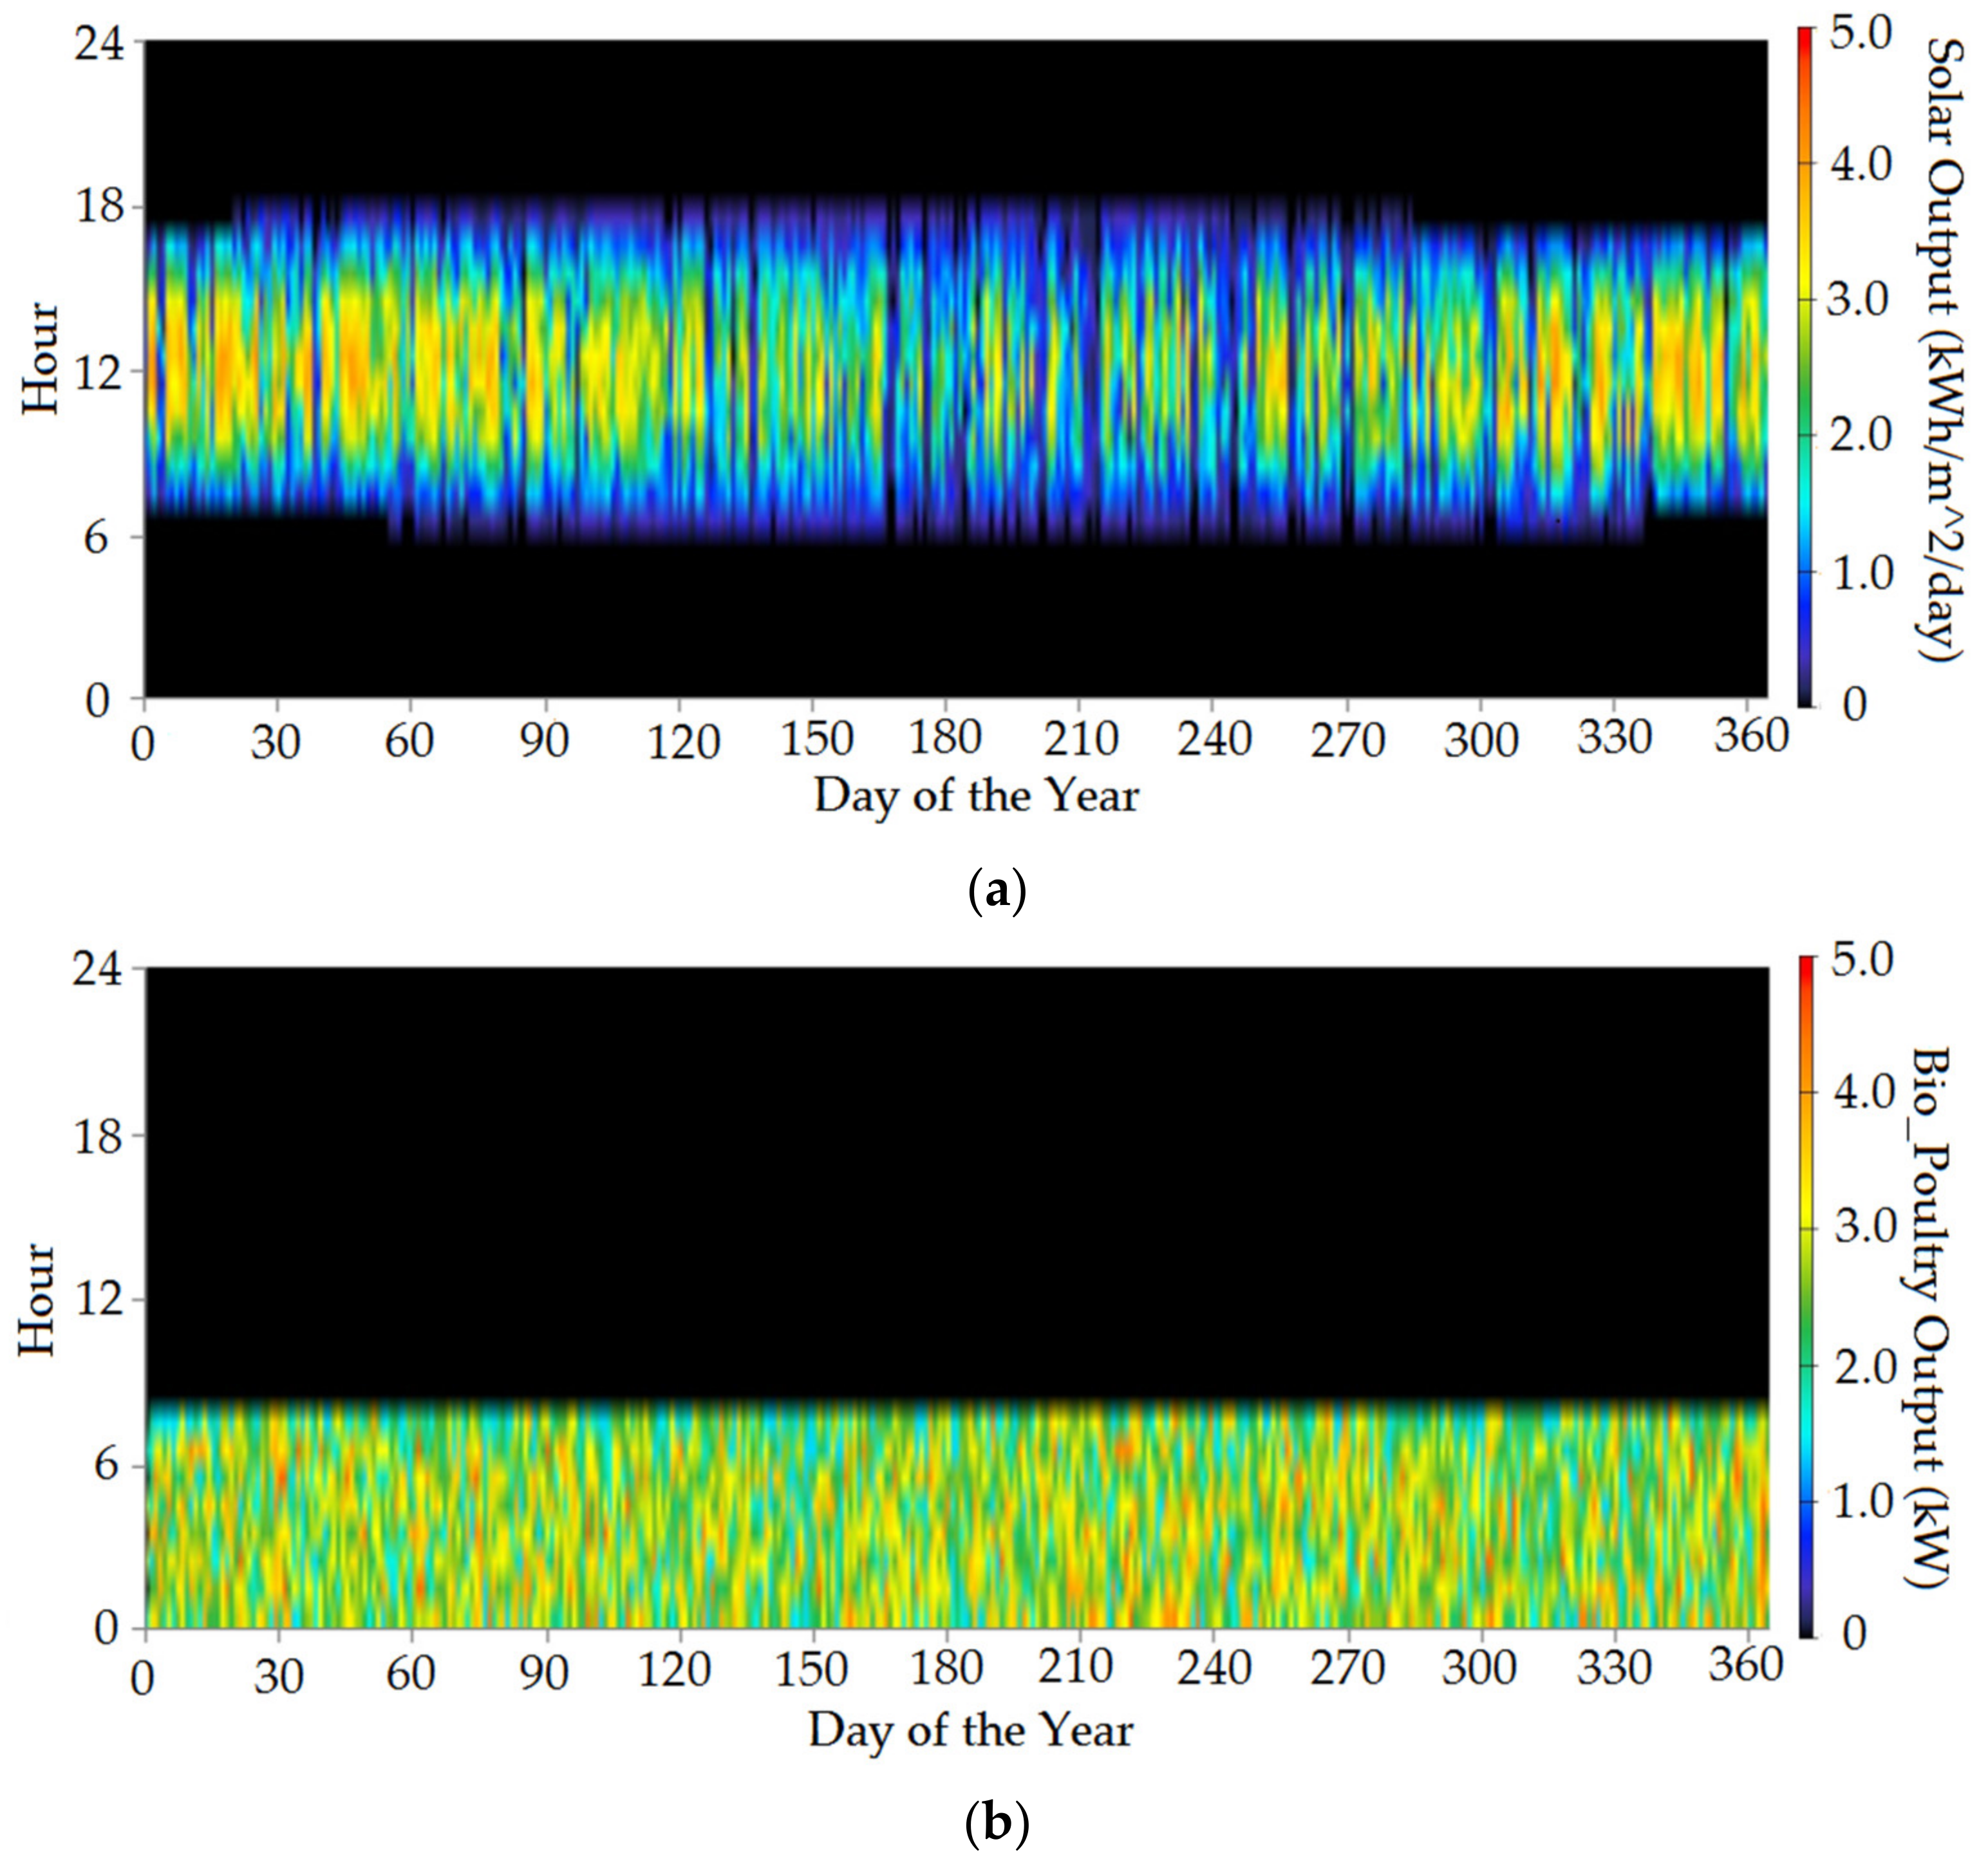
3.2. Resources Assessment
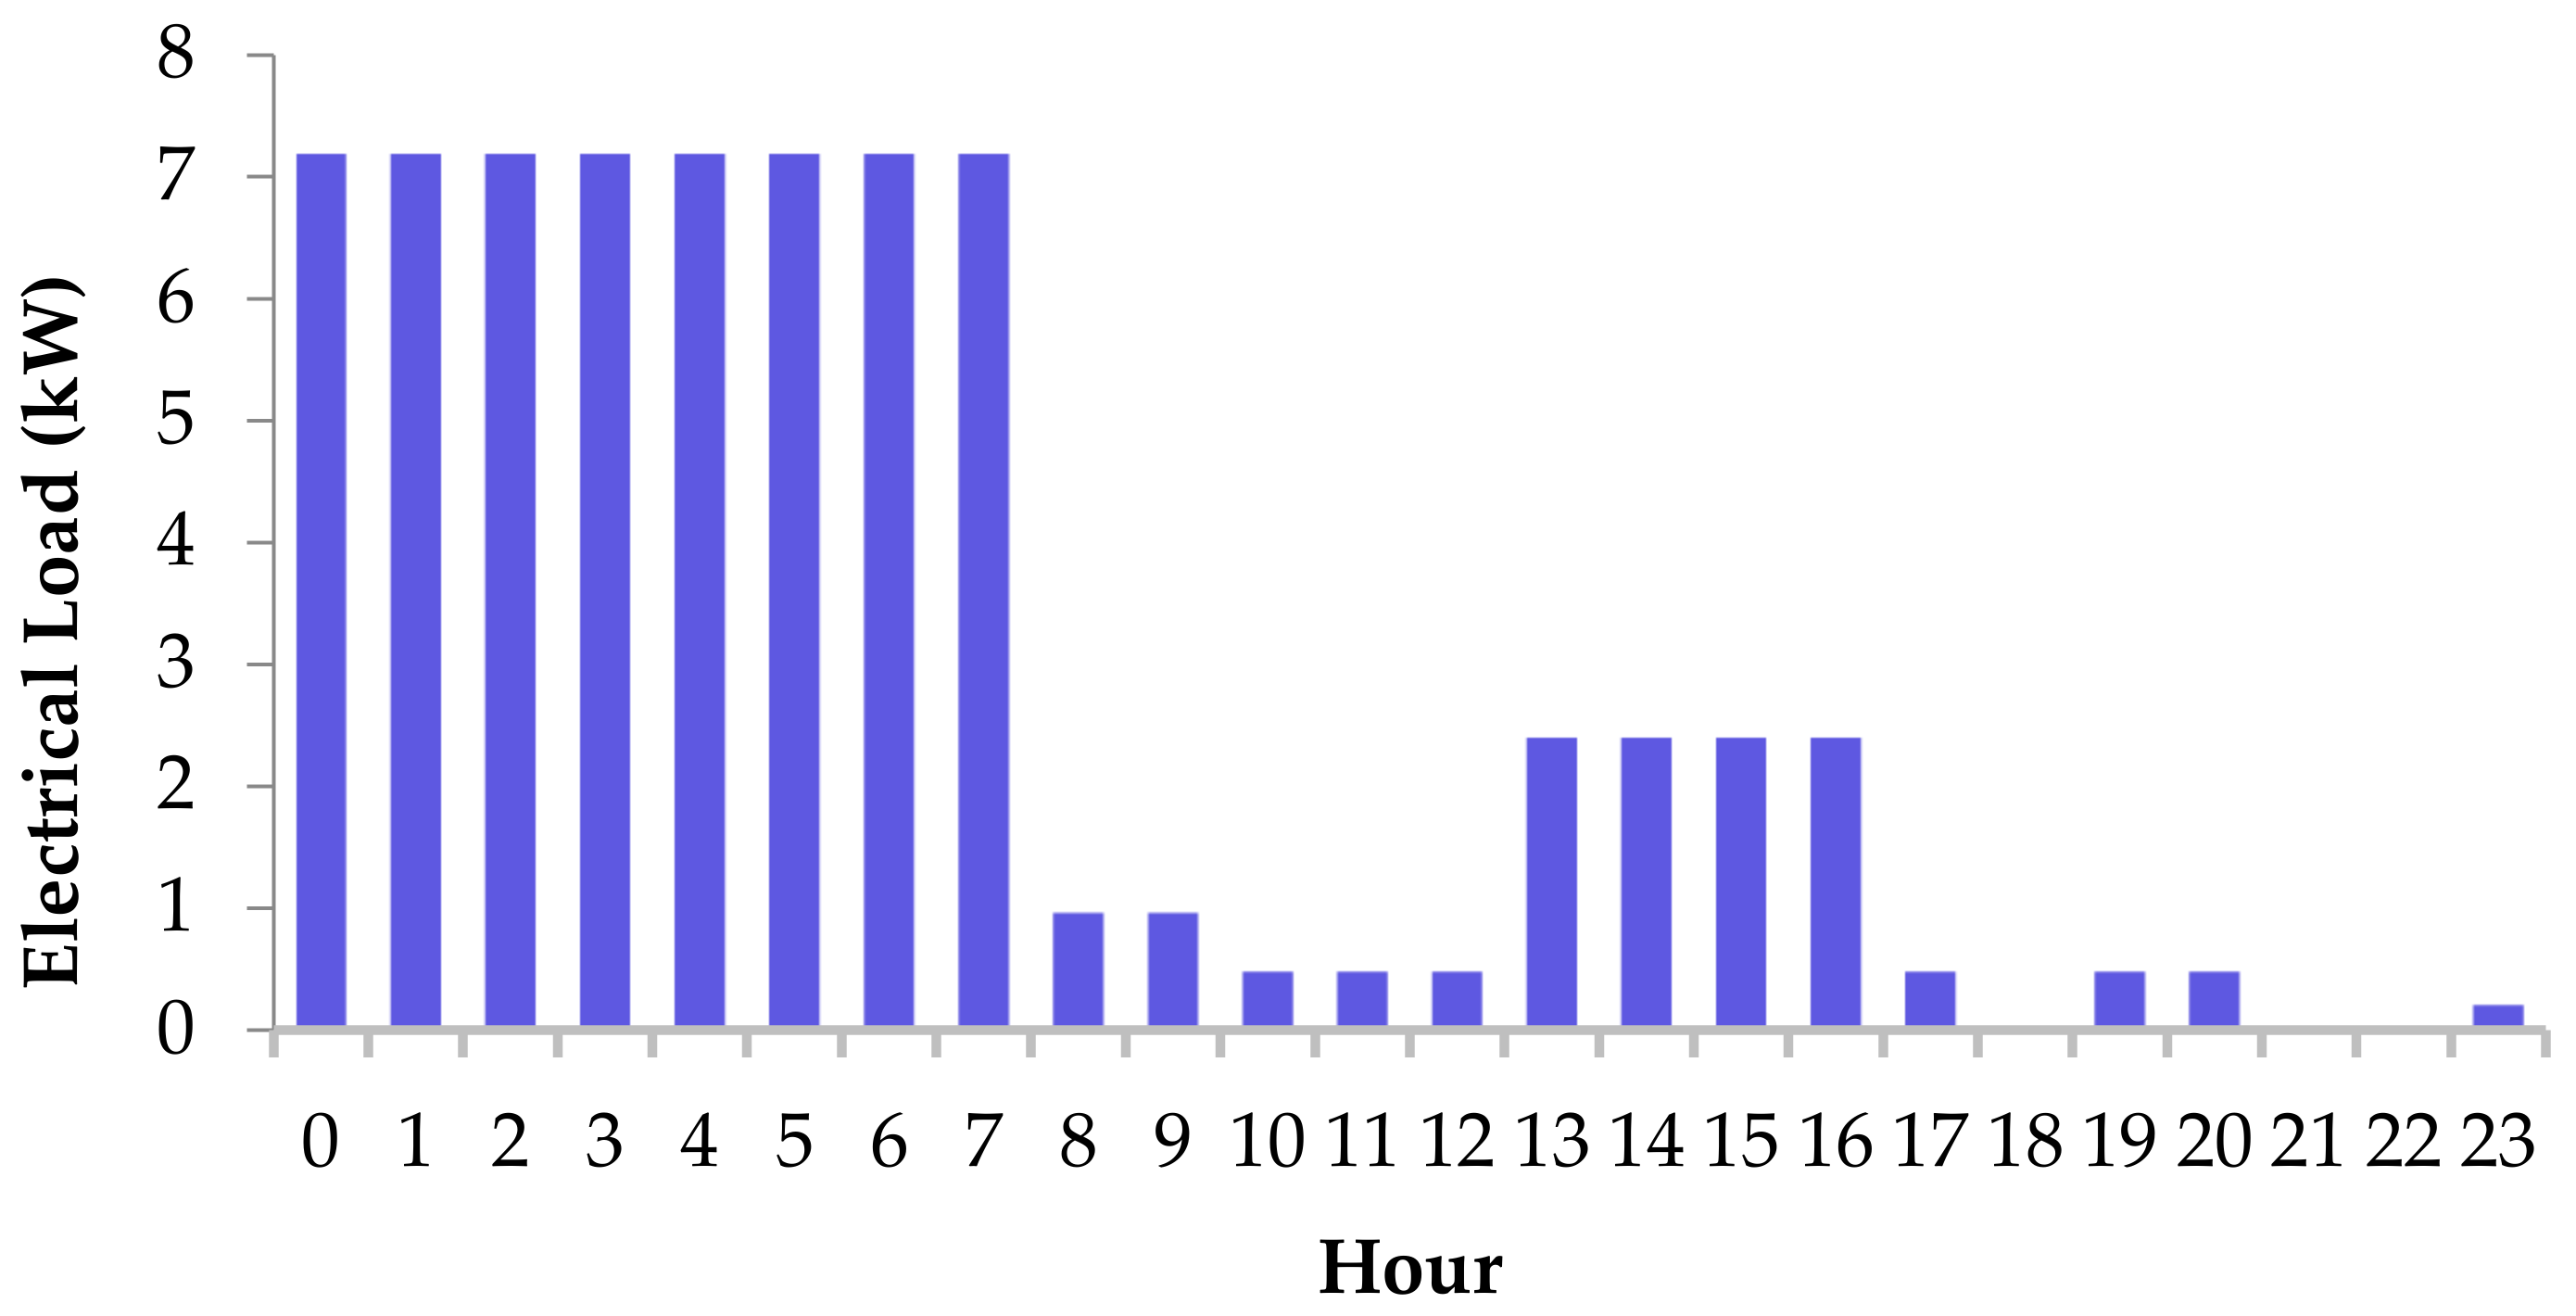
3.3. Load Assessment
3.4. Simulation Procedure
4. Data Collection and Mathematical Modelling
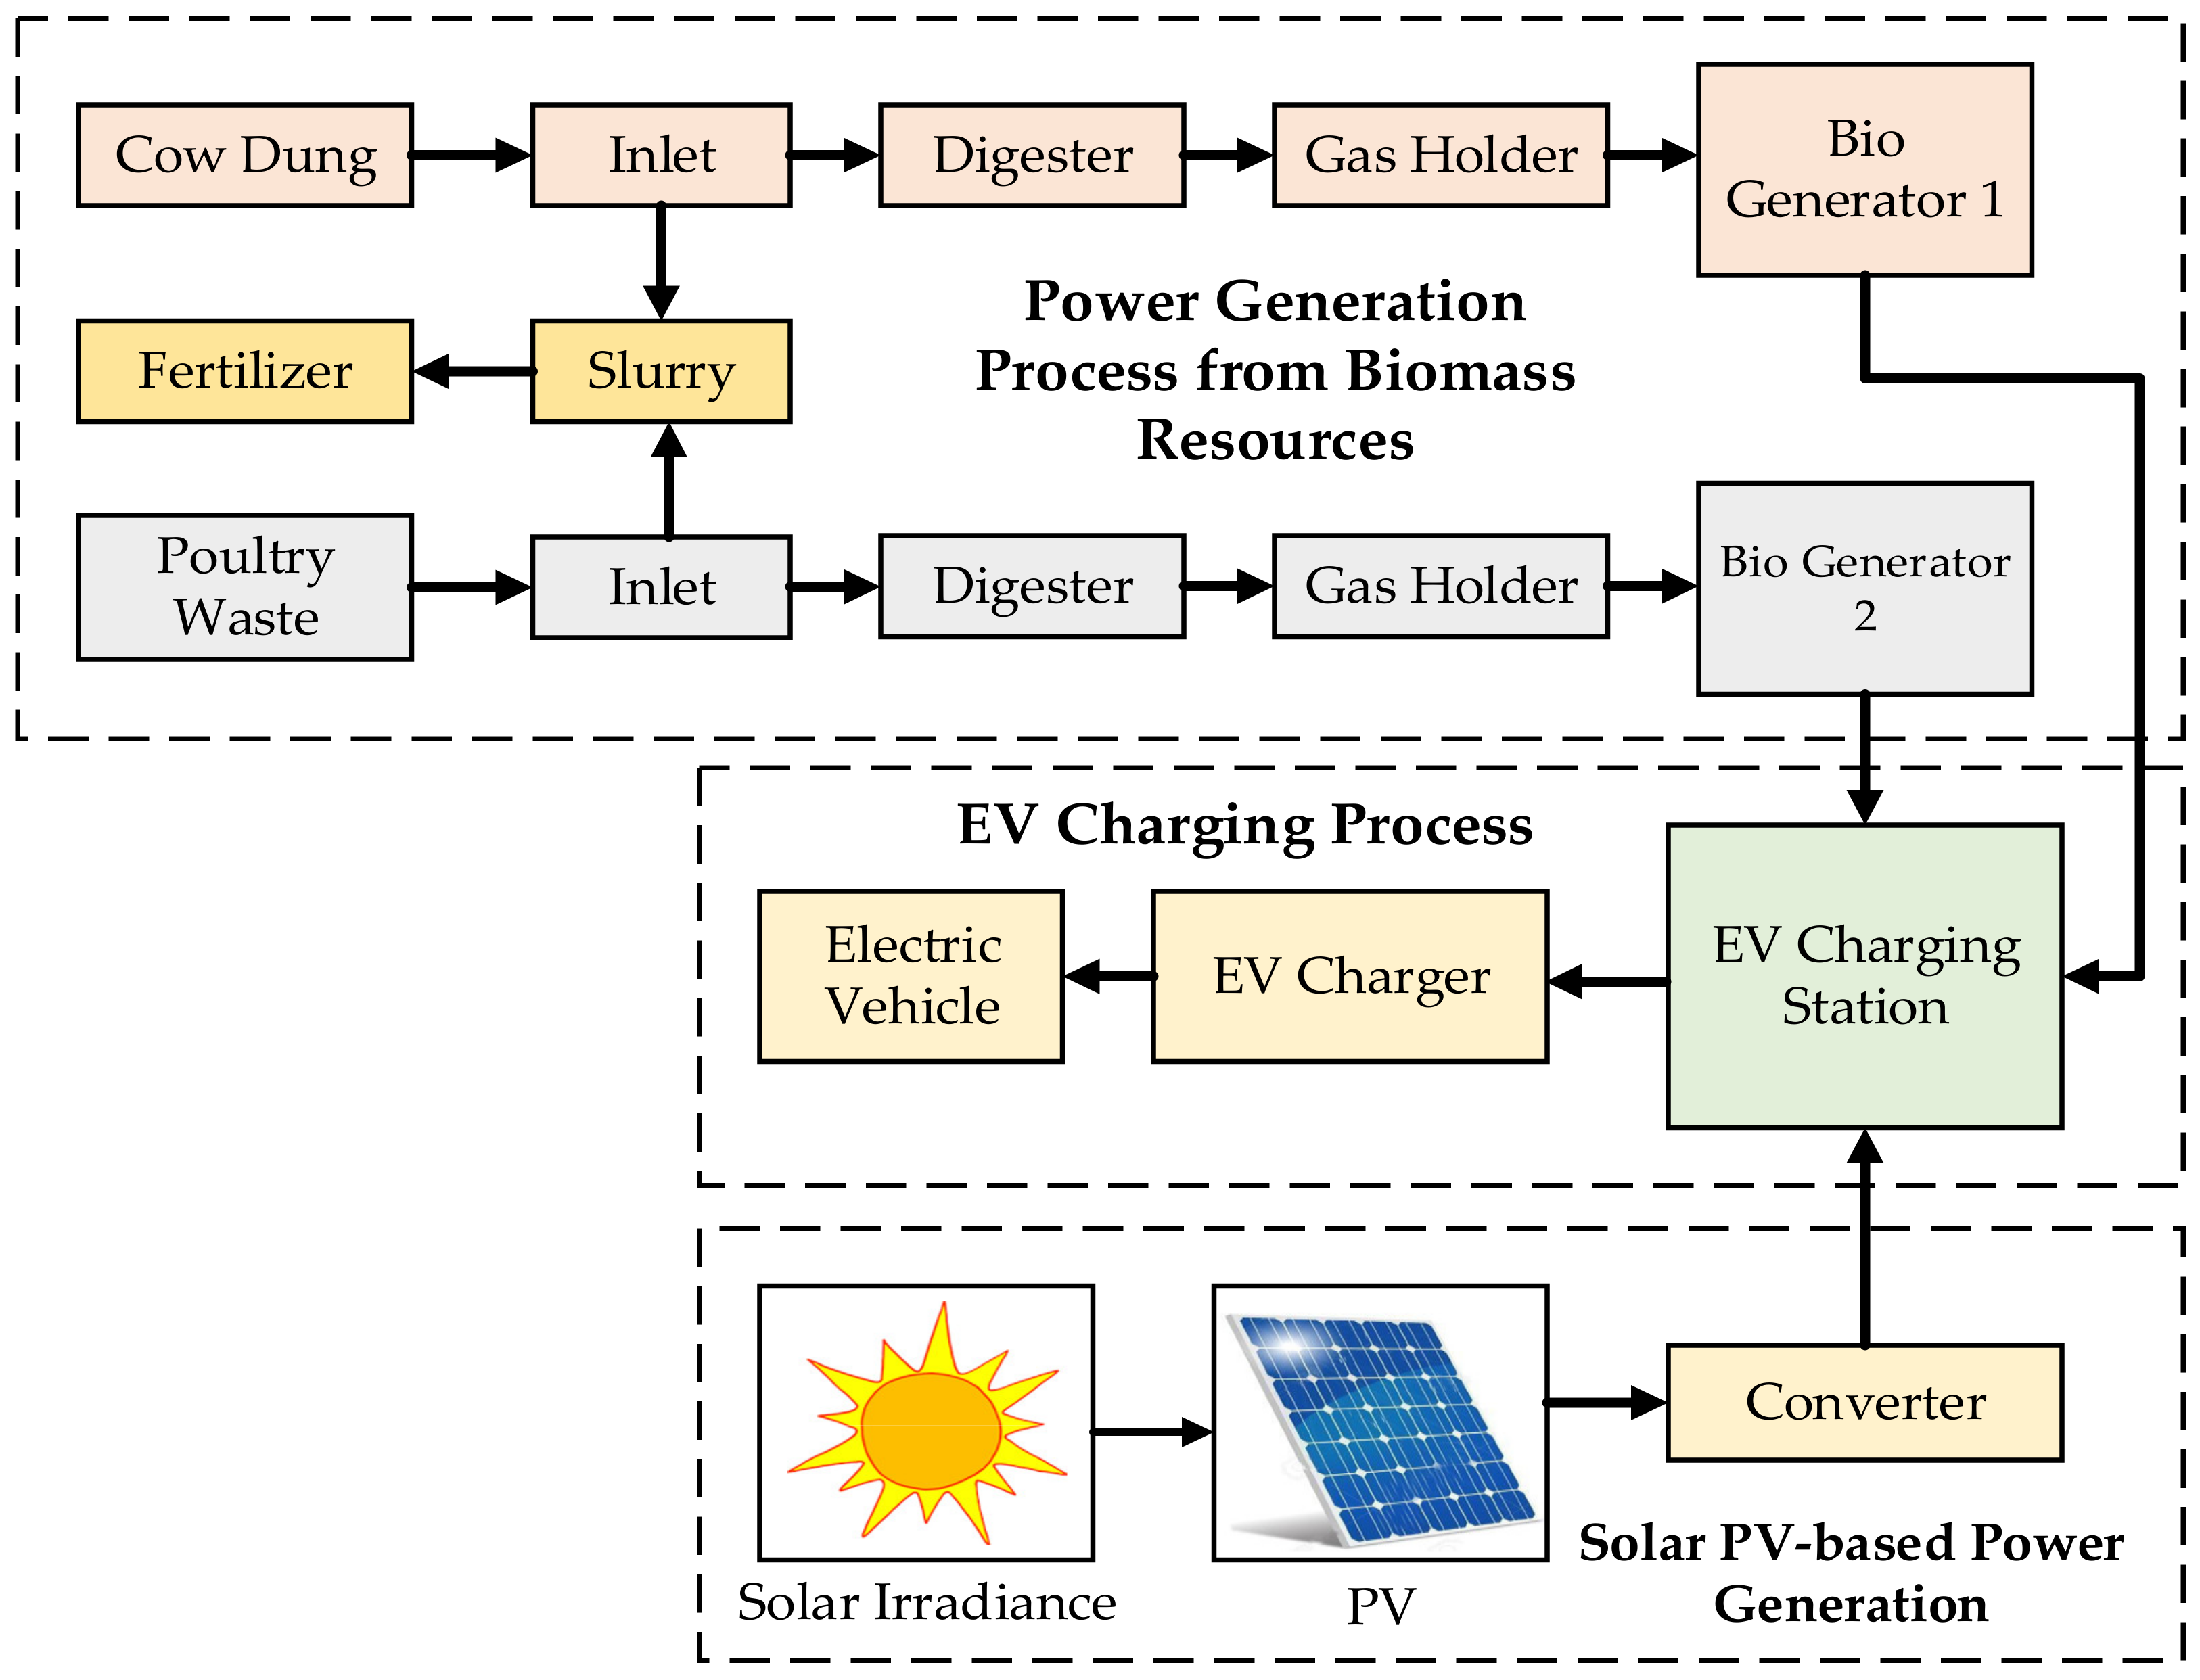
4.1. Charging Station’s Distributed Energy Components Modelling
4.1.1. Solar Energy Conversion System

| Parameters | Value | Parameters | Value |
|---|---|---|---|
| Cell Type | Monocrystalline 6 inch | Max. System Voltage | 1500 (IEC) or 1000 V (UL) |
| Cell Arrangement | 60 (6 × 10) | Max. Series Fuse Rating | 15 A |
| Nominal Max Power ) | 285 W | Temperature coefficient ) | −0.41%/K |
| Operating Voltage ) | 31.7 V | Temperature coefficient ) | −0.12 V/K |
| Operating Current ) | 8.98 A | Temperature coefficient ) | −0.053%/K |
| Open Circuit Voltage ) | 38.6 V | Operating Cell Temperature | 45 |
| Short Circuit Current ) | 9.51 A | Module Efficiency | 17.22% |
| Parallel String | 11 | Series Connected Modules | 2 |
4.1.2. Biogas Generator
| Parameters | Specifications |
|---|---|
| Model | ELEMAX SH5300EX Generator |
| Rated Power | 6.3 kW @ 3600 rpm |
| Generator AC Output | 4.7 KVA@ 220 V, 50 HZ |
| Ignition System | Transistor |
| Continuous Operating Hours (h) | 12 h |
| Fuel Tank Capacity | 28 L |
4.1.3. Digester
4.1.4. Converter
4.1.5. Battery Bank System
4.2. Economic Modelling
4.2.1. NPC
4.2.2. COE
4.2.3. PP
4.2.4. Annual Real Interest Rate
4.2.5. Salvage Cost
4.3. Emission Modelling
5. Results and Discussion
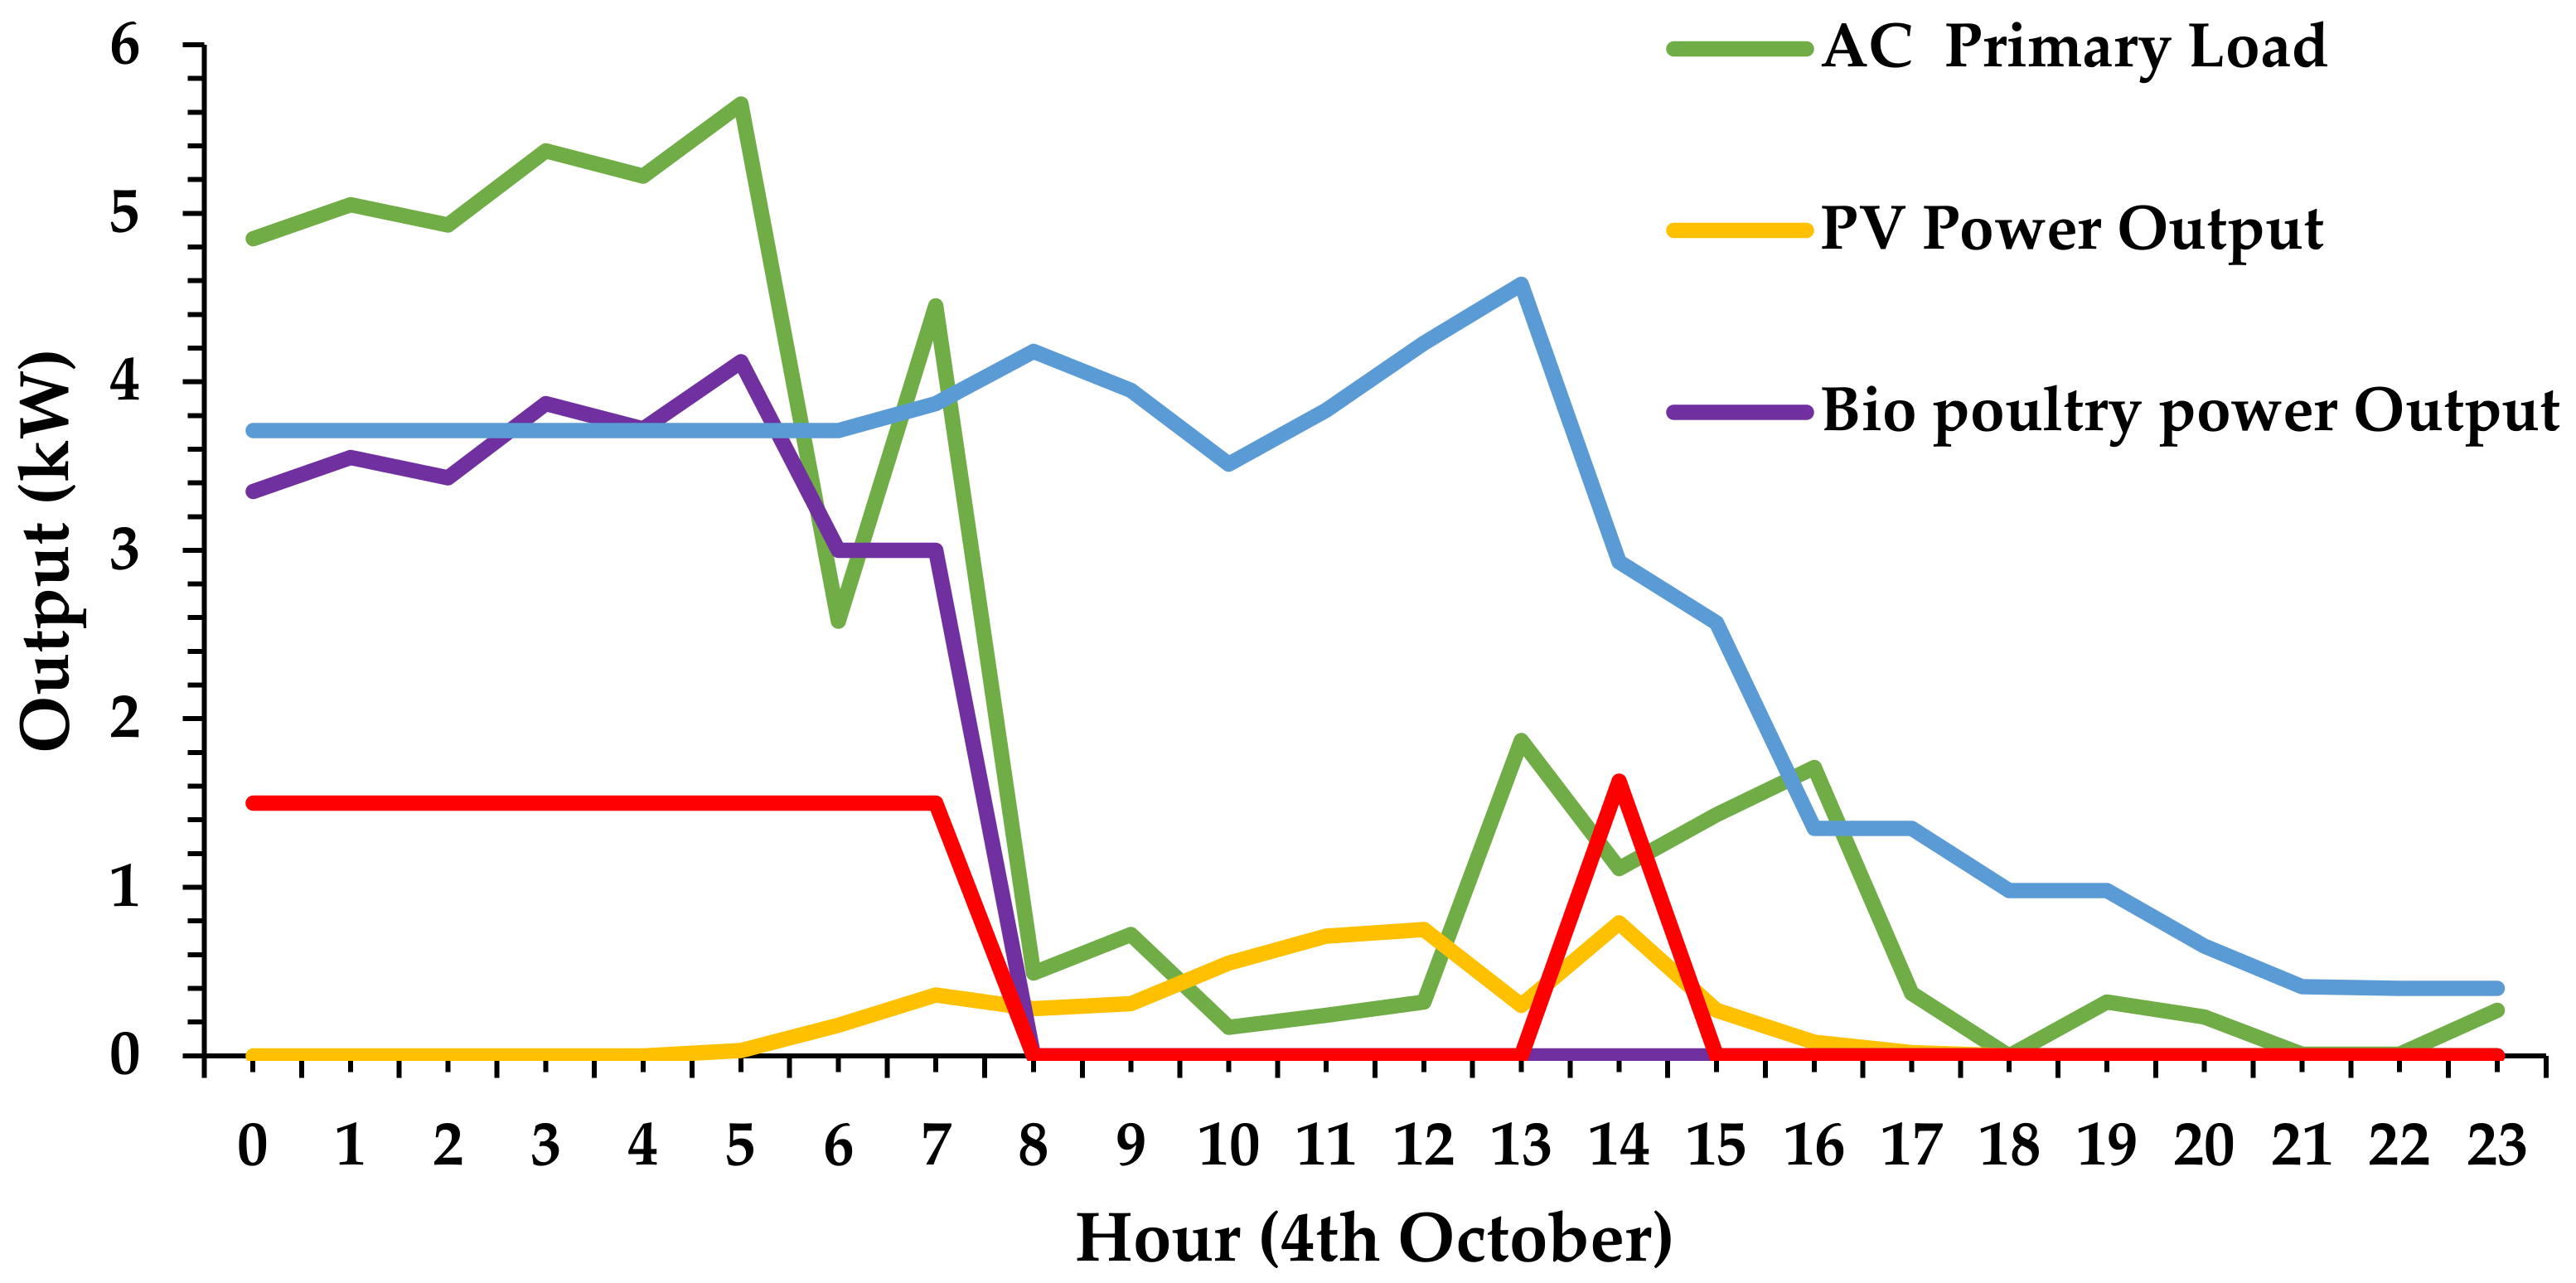
5.1. Energy Analysis
5.2. Economic Analysis
5.3. Emission Analysis
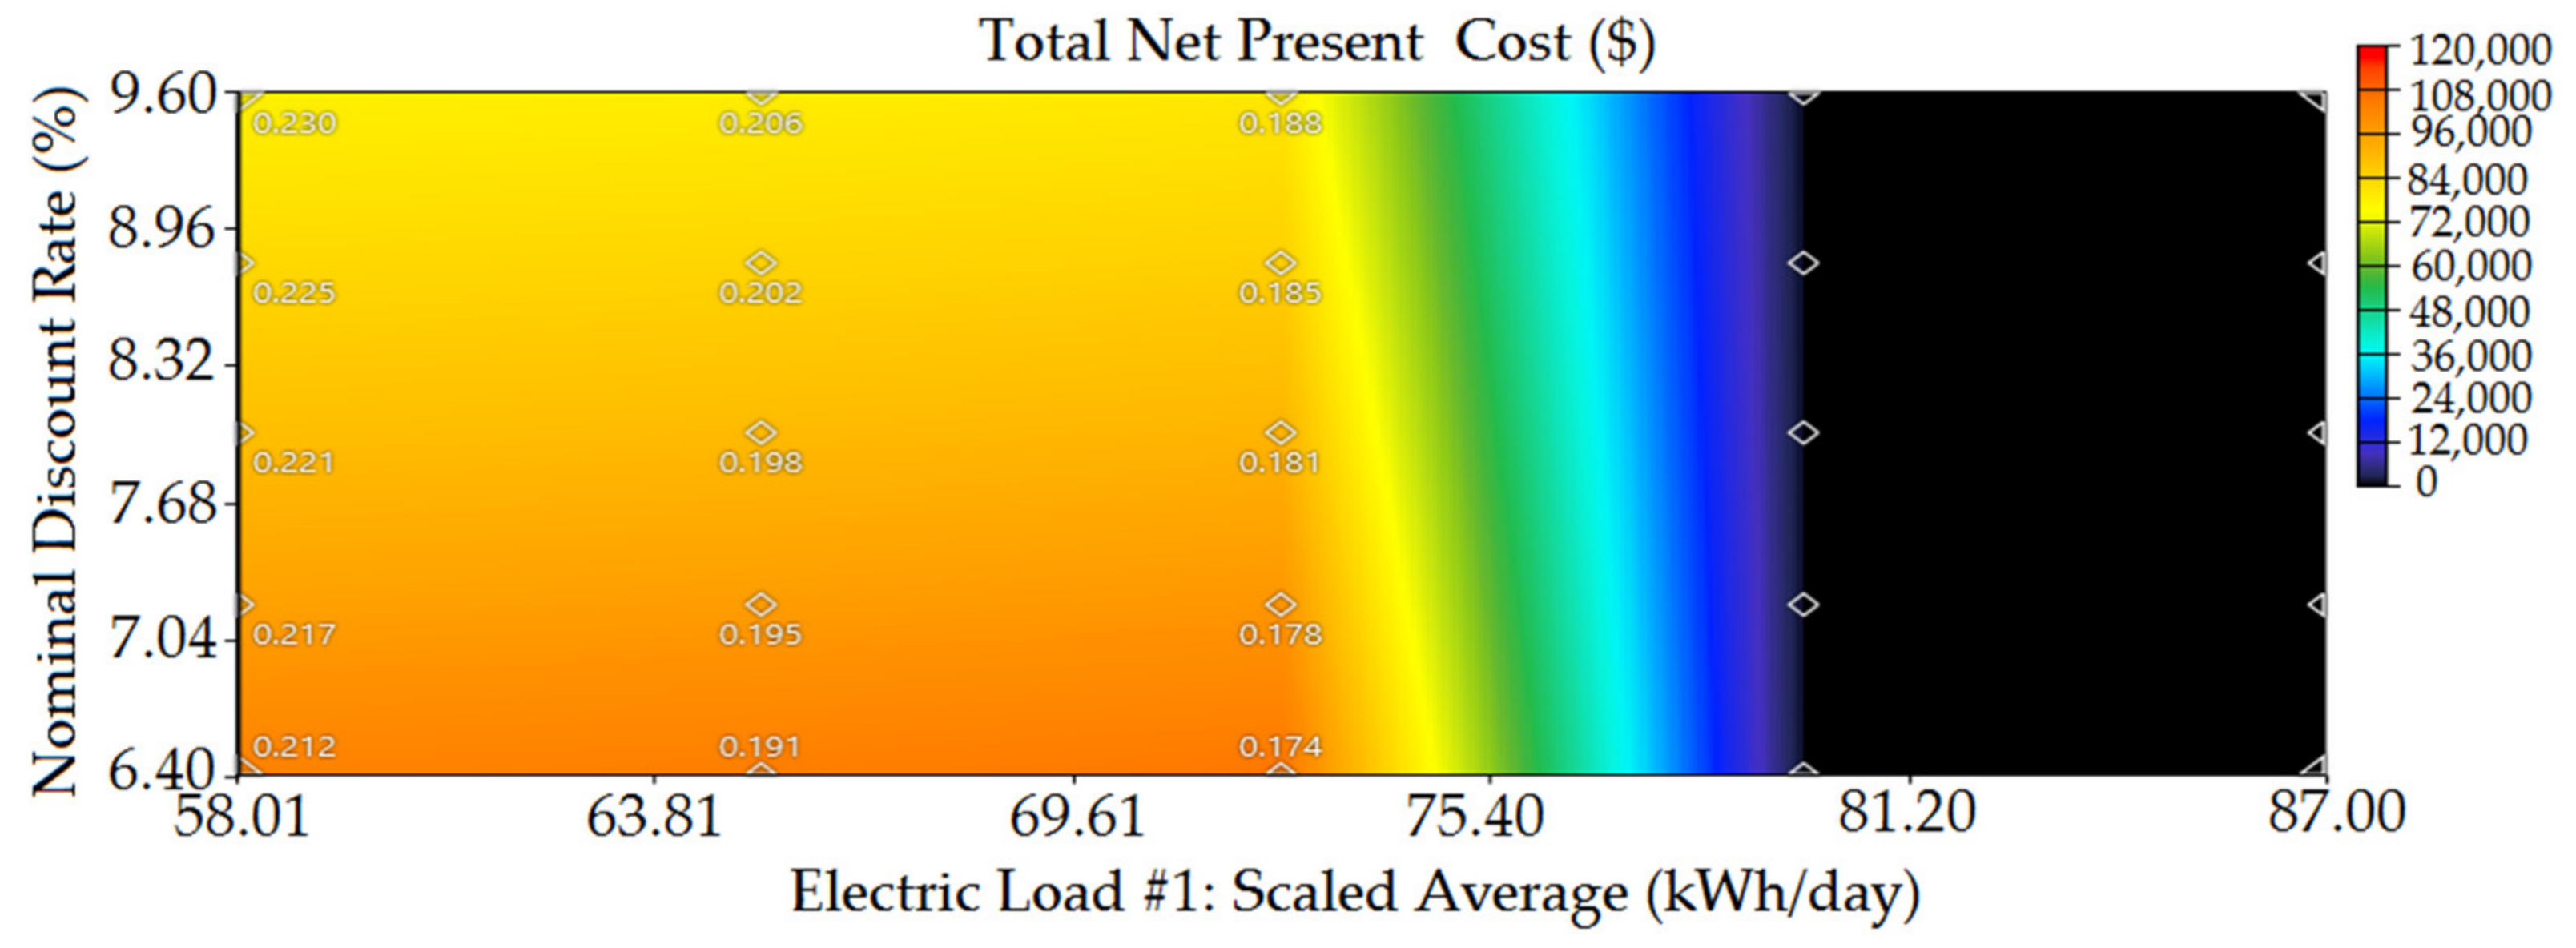
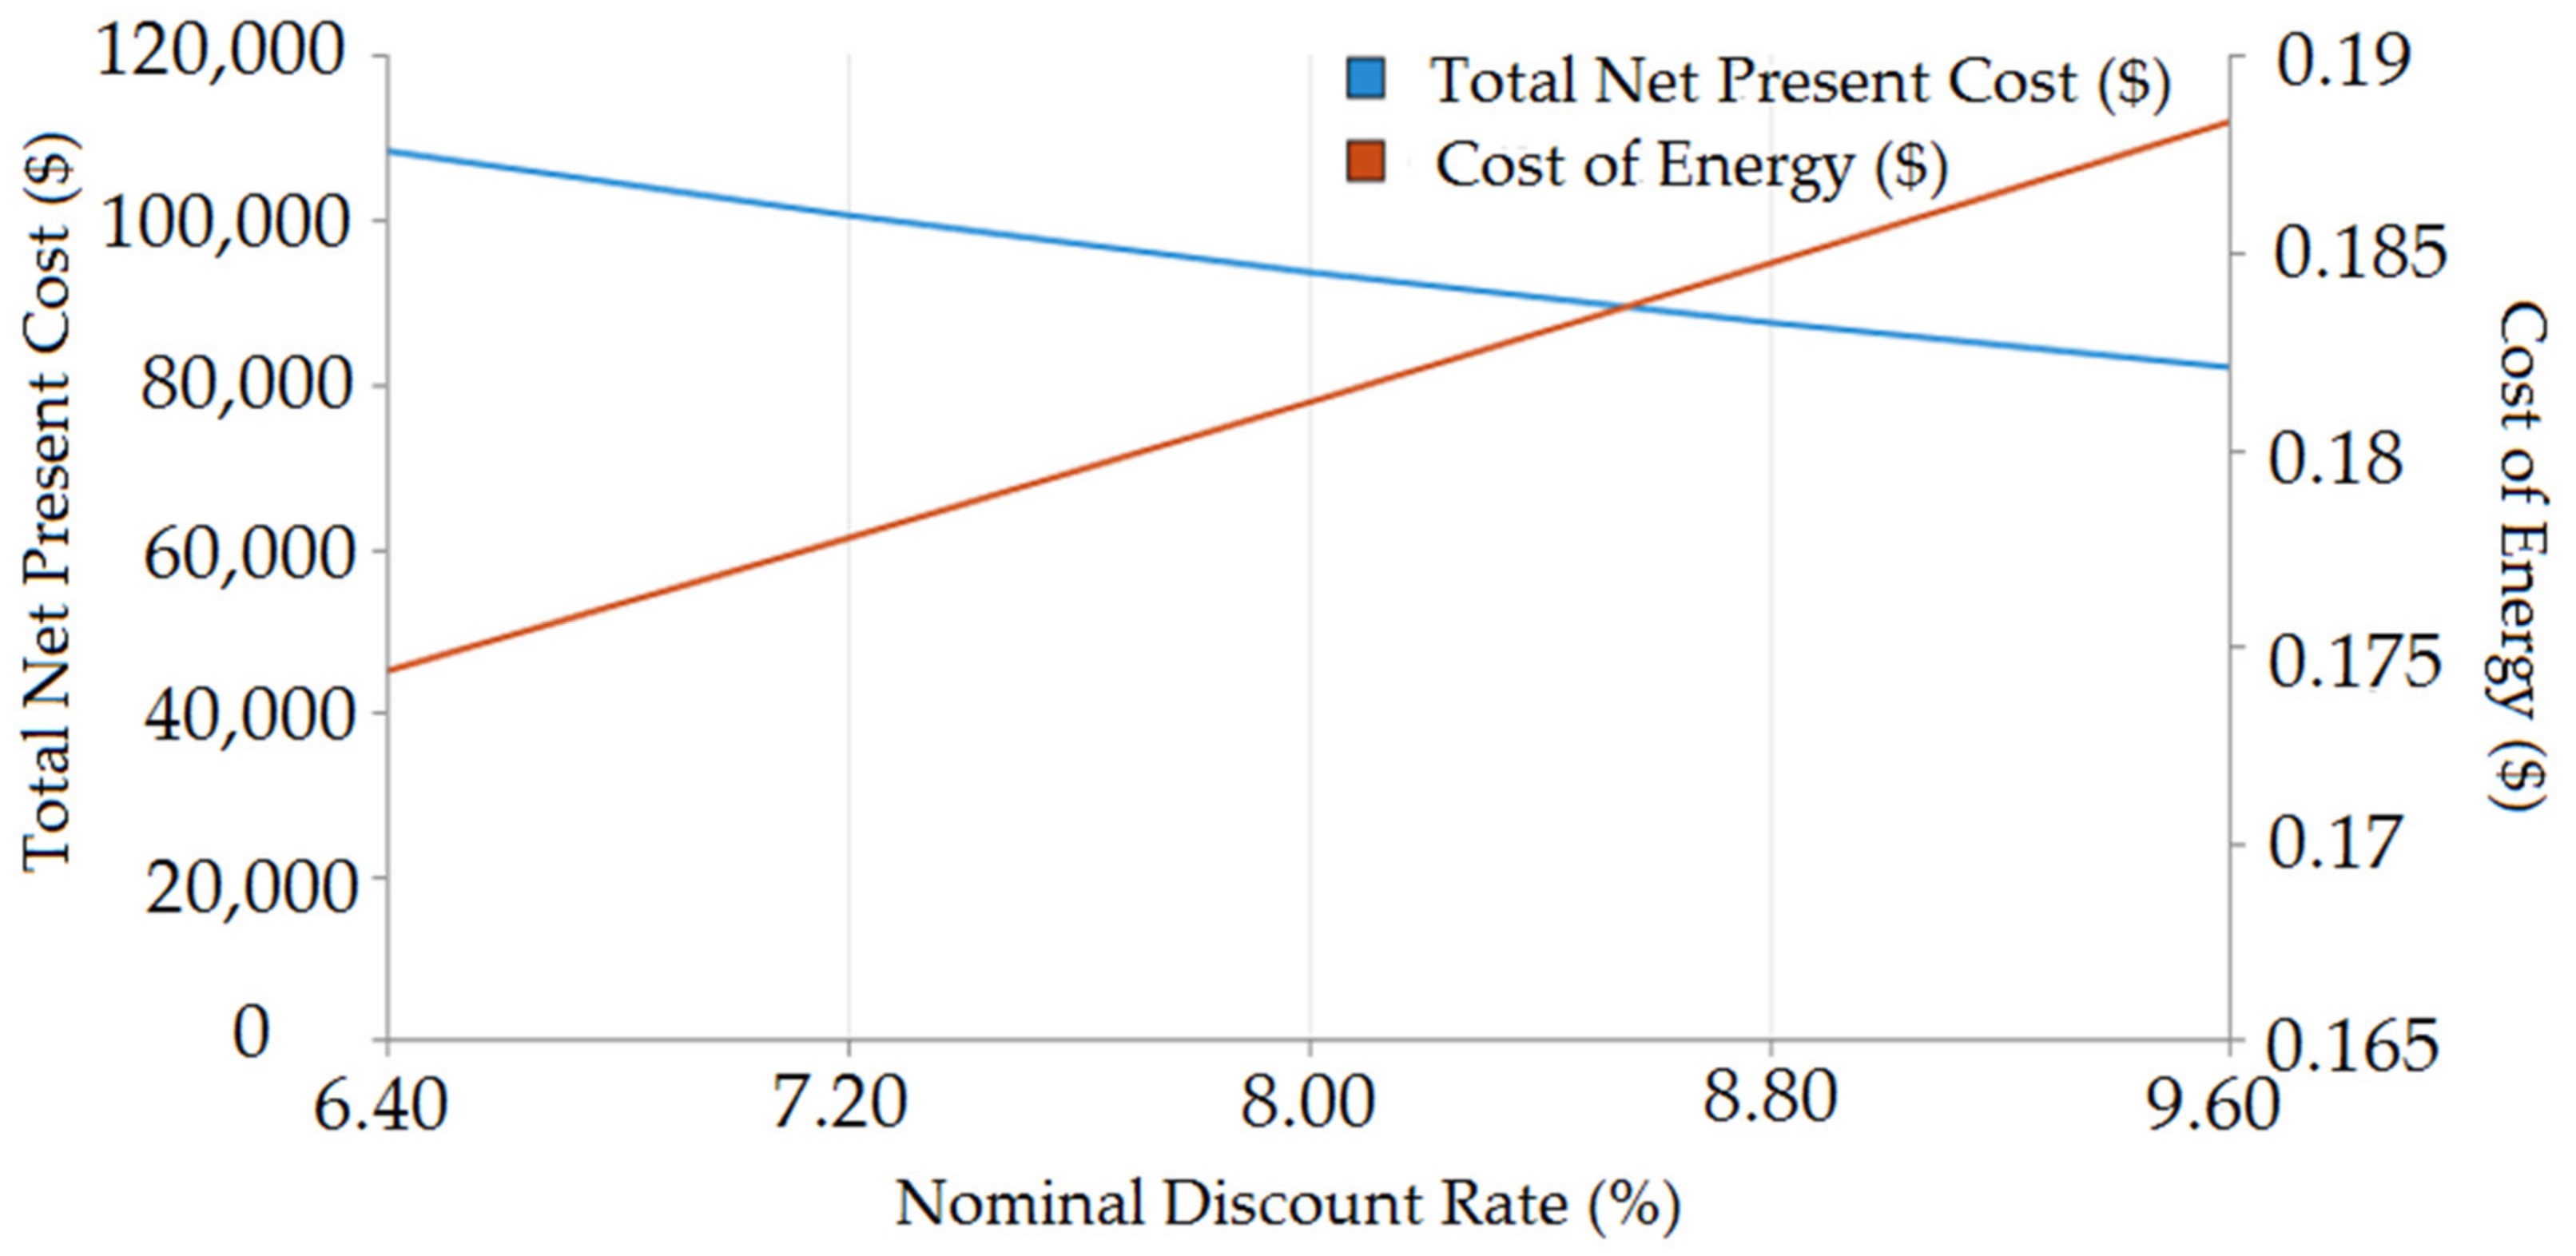
5.4. Sensitivity Analysis
5.5. Validation with Existing Literature
6. Conclusions and Future Works
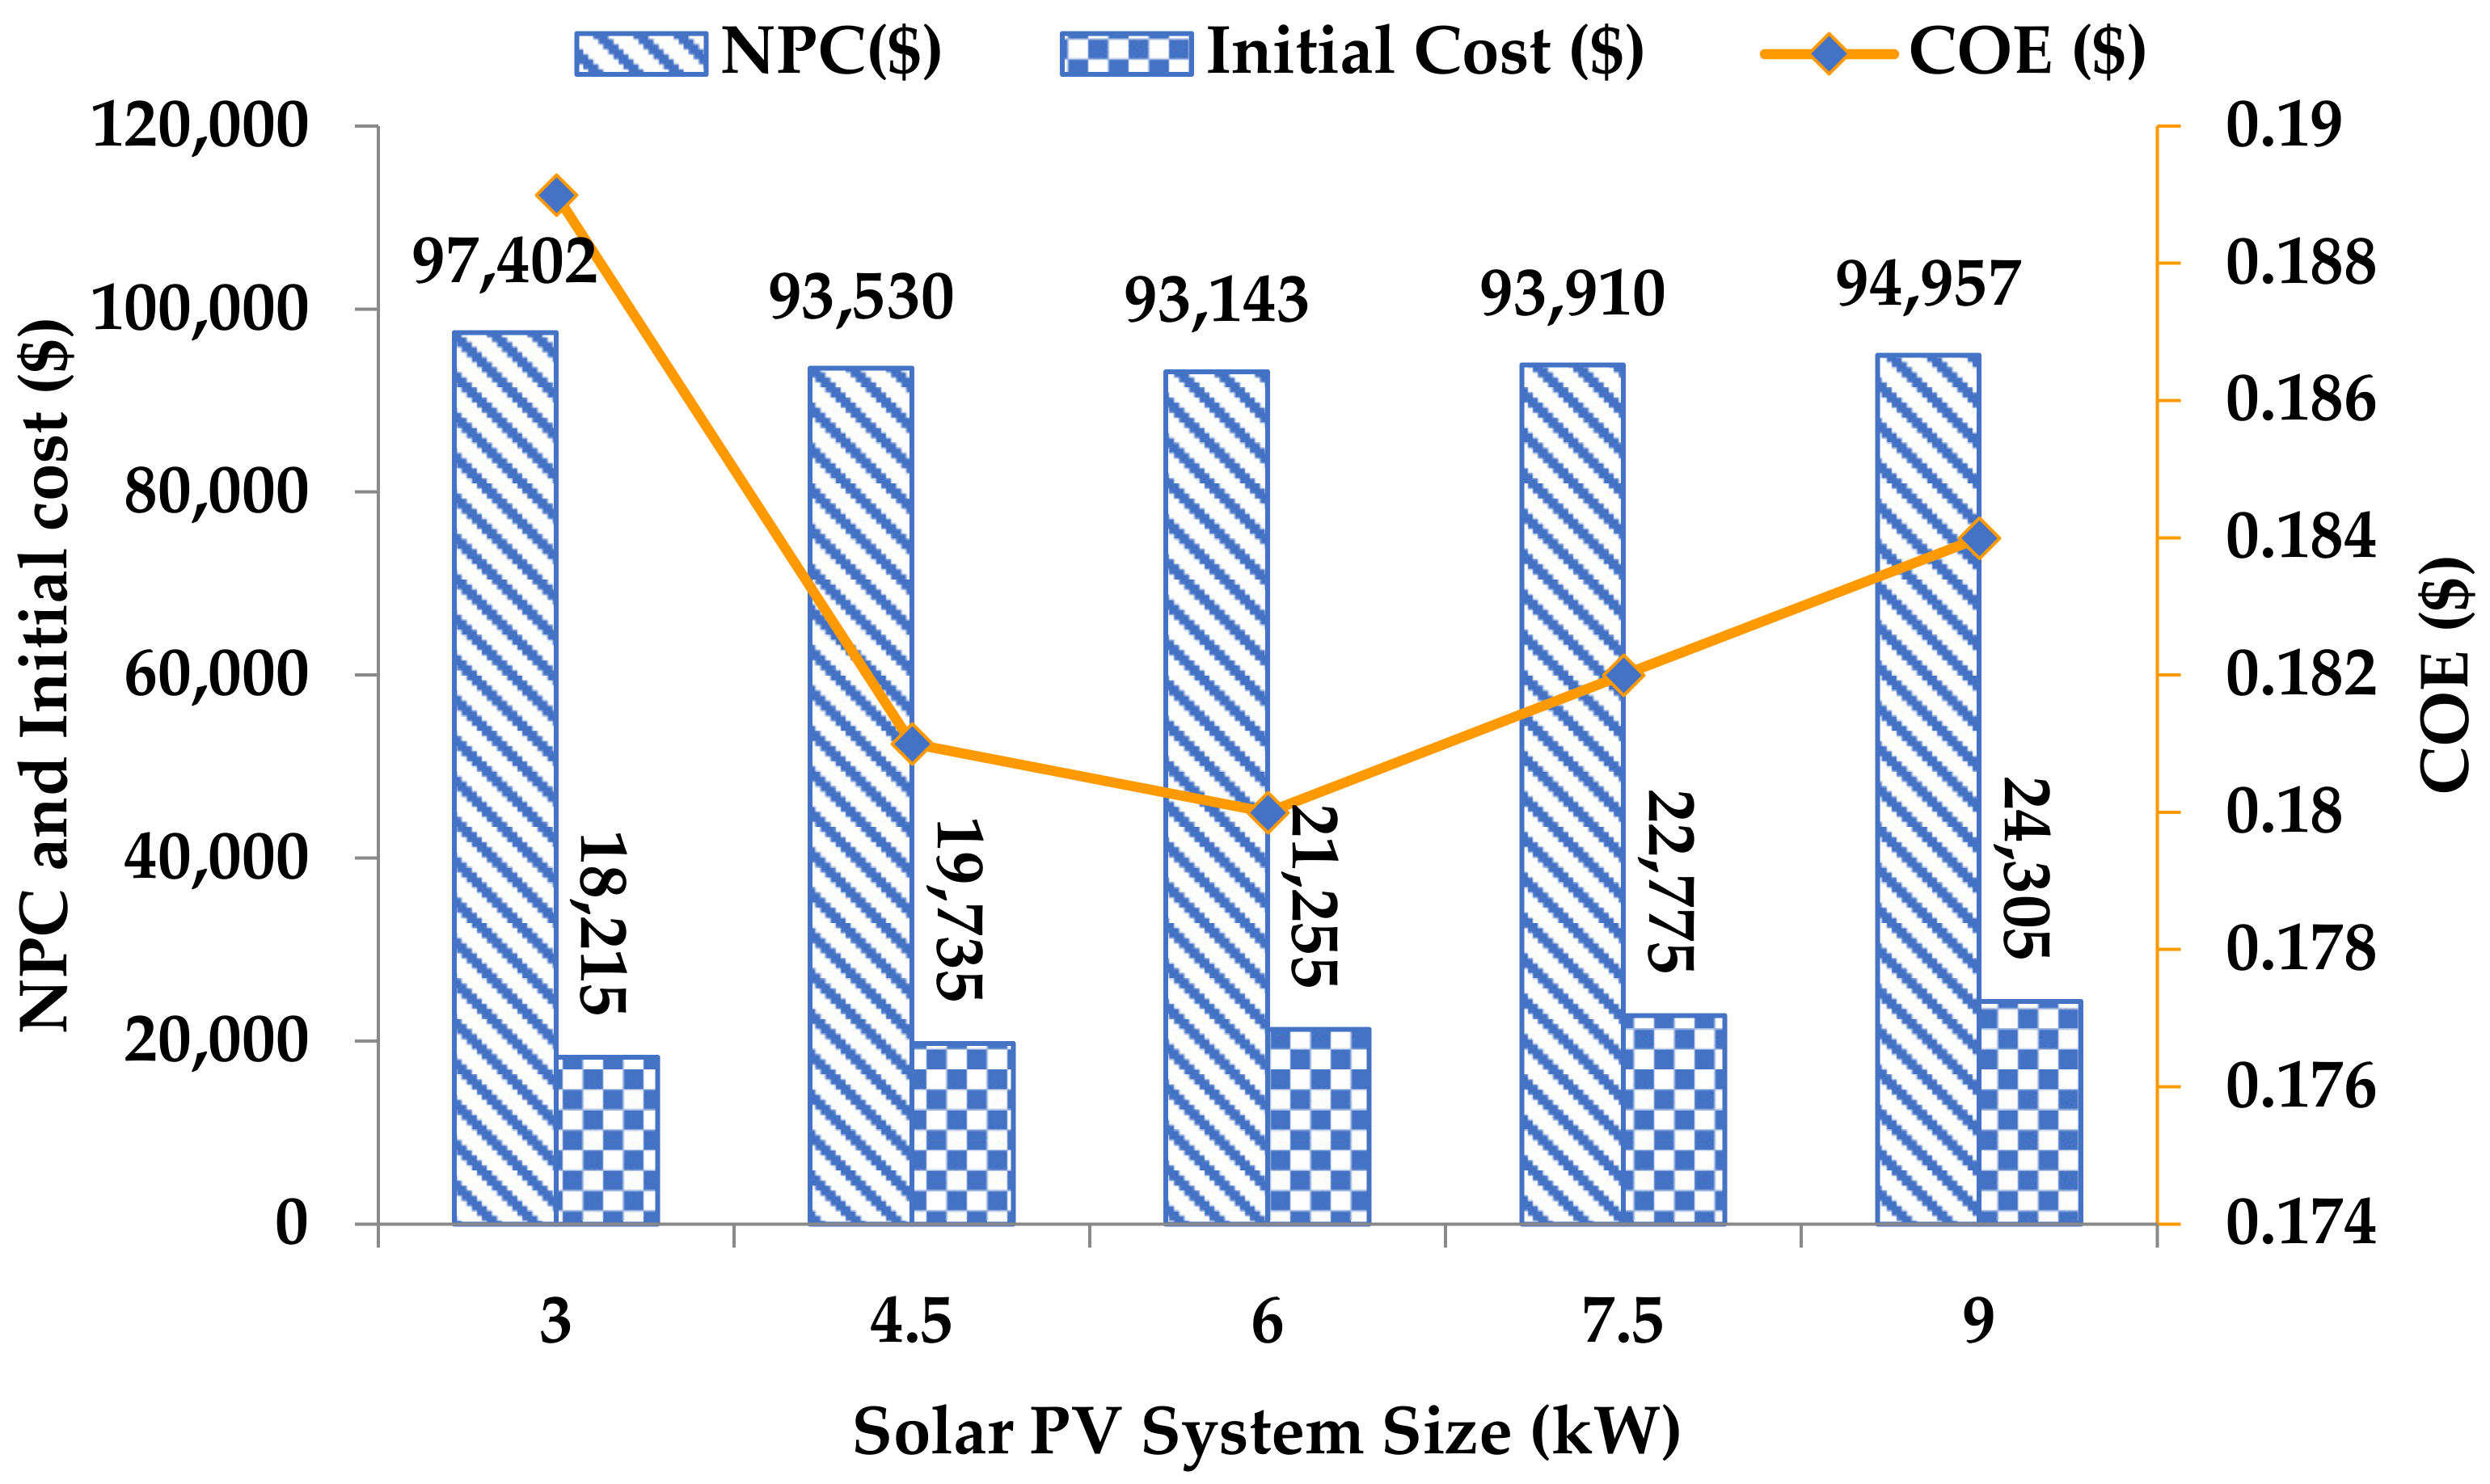
- The variations in NPC, initial cost, and COE are evaluated for different PV system configurations (3 kW, 4.5 kW, 6 kW, and 9 kW), which identify the 4.5 kW PV system as feasible due to its reasonable NPC (USD 93,530), initial cost (USD 19,735), and COE (USD 0.181).
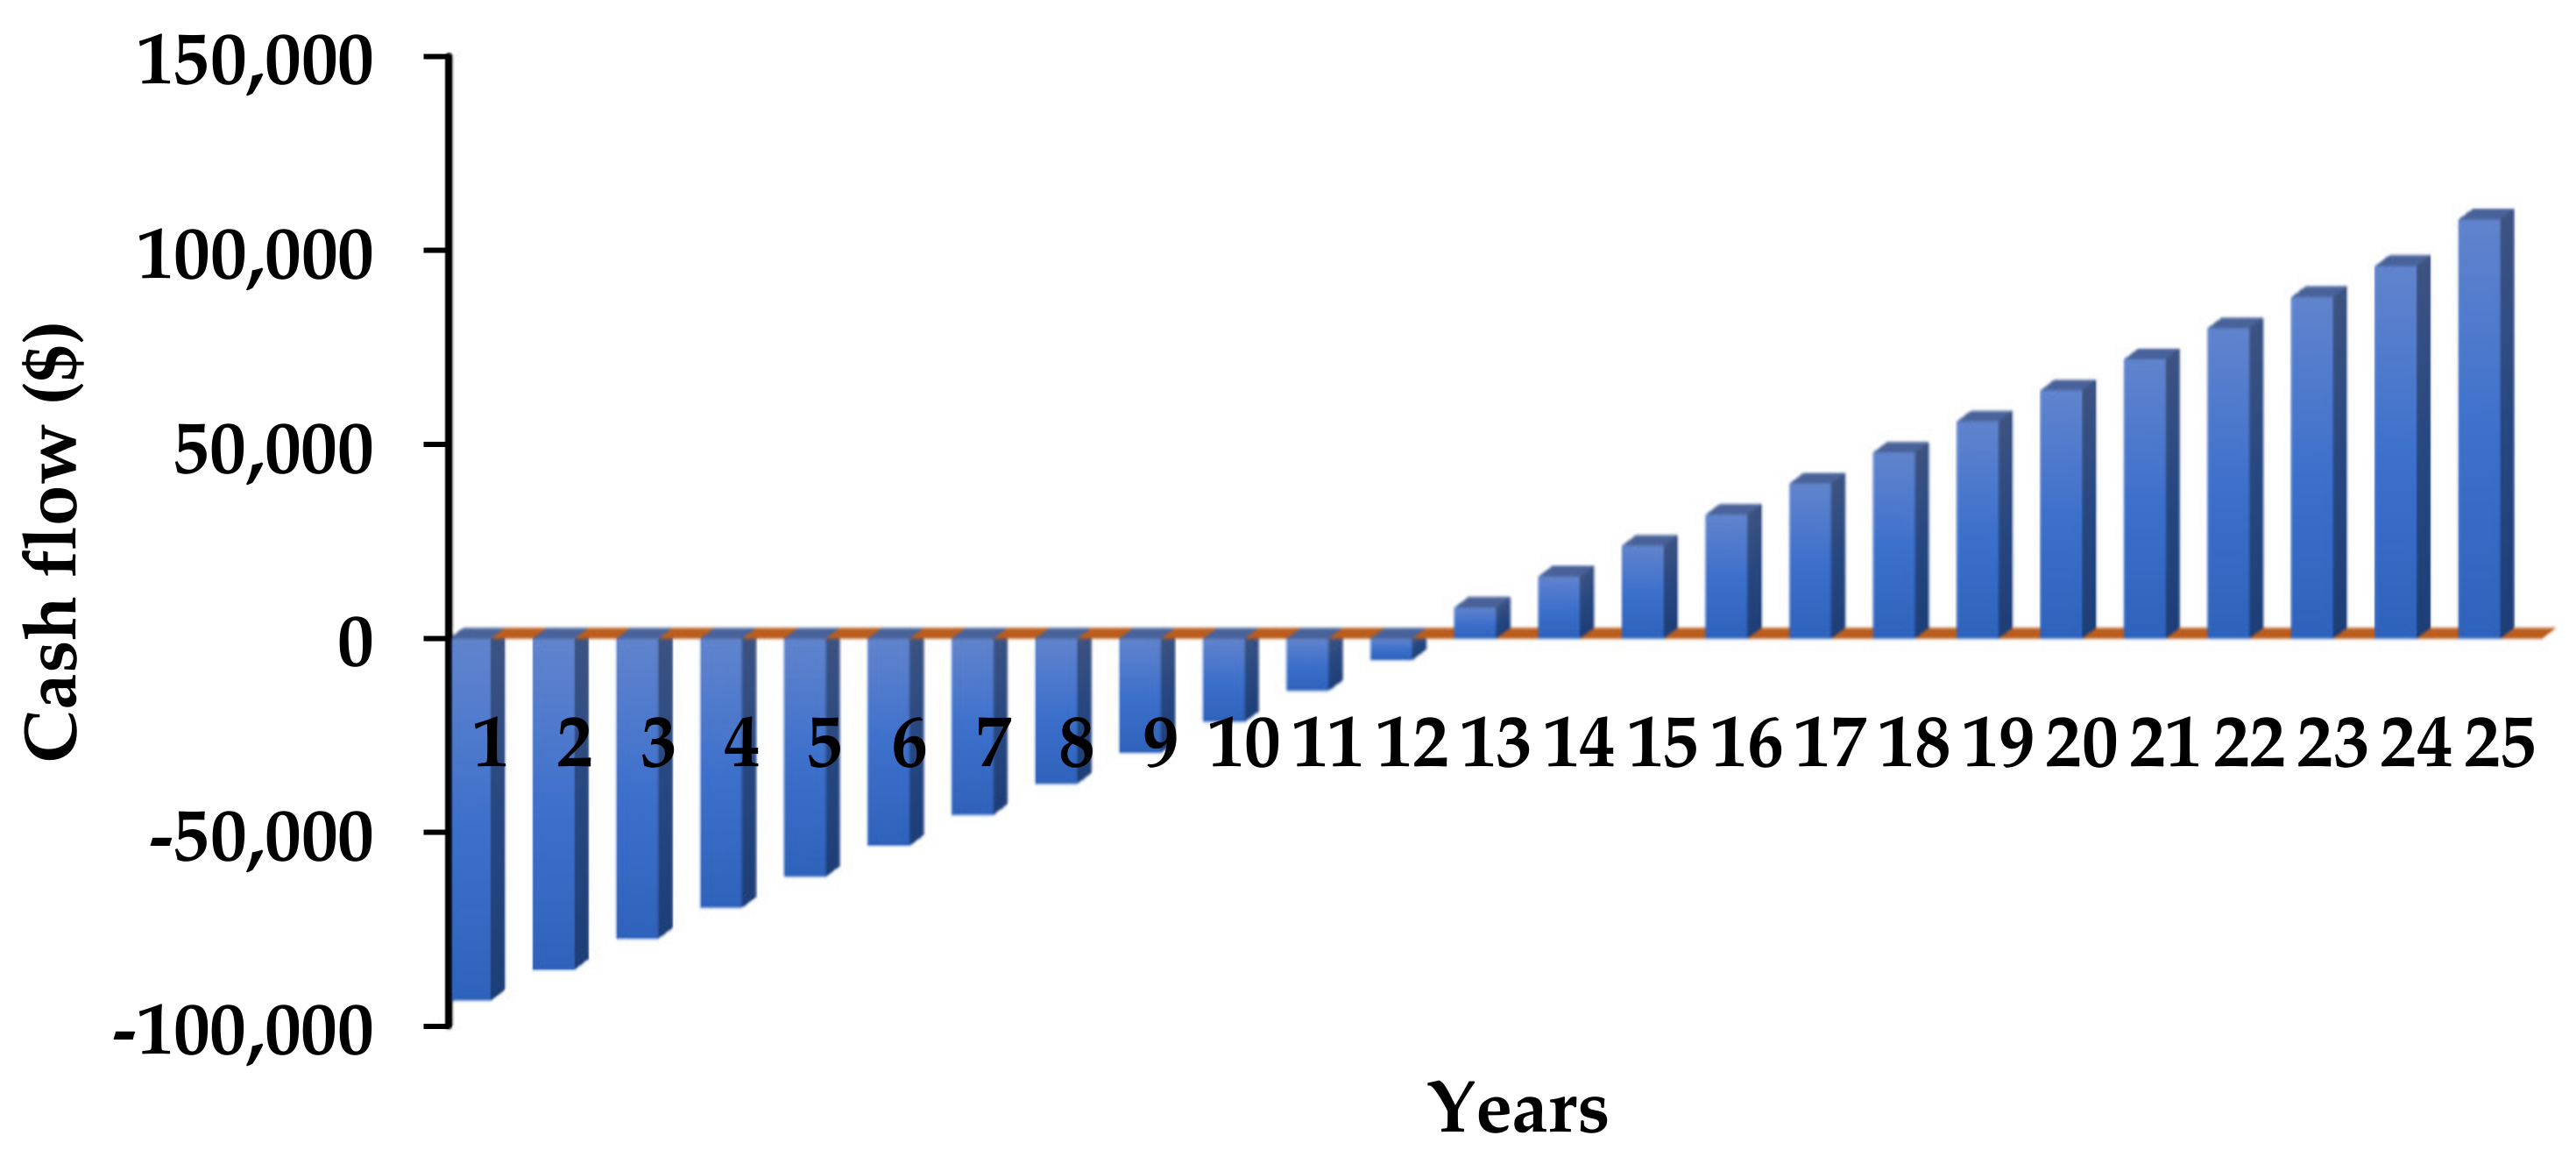
- The lifetime of the system is 25 years. The cost summary claims that 12 years is required to overcome the system cost, and the rest of the 13 years will provide the financial benefits.
- The sensitivity analysis for the variation of biomass resources and NDR demonstrates that the system is stable for biomass of 0.50 ton/day, a COE of USD 0.181, and a stable NPC (USD 84,000 to USD 96,000).
- The sensitivity analysis for the variation of solar irradiance claims that the system is efficient with a COE of USD 0.181 and NDR of 8% when solar irradiance is 4.84 kWh//day.
- The sensitivity analysis for the load changes illustrates that the system is stable and fully functional with optimized values of NPC, the initial cost, and COE when the load changes are 72.5 kW/day.
- The environmental analysis demonstrates that the emission of CO2 is much lower (6.93 kg/h) than the existing grid-only system (16,727 kg/h).
Author Contributions
Funding
Institutional Review Board Statement
Informed Consent Statement
Data Availability Statement
Acknowledgments
Conflicts of Interest
References
- Podder, A.; Islam, S.; Kumar, N.; Chand, A.; Rao, P.; Prasad, K.; Logeswaran, T.; Mamun, K. Systematic categorization of optimization strategies for virtual power plants. Energies 2020, 13, 6251. [Google Scholar] [CrossRef]
- US EPA. Sources of Greenhouse Gas Emissions. 2021. Available online: https://www.epa.gov/ghgemissions/sources-greenhouse-gas-emissions (accessed on 18 May 2021).
- Podder, A.K.; Habibullah, M.; Roy, N.K.; Pota, H.R. A chronological review of prospects of solar photovoltaic systems in Bangladesh: Feasibility study analysis, policies, barriers, and recommendations. IET Renew. Power Gener. 2021, 15, 2109–2132. [Google Scholar] [CrossRef]
- Podder, A.K.; Habibullah, M.; Tariquzzaman, M.; Hossain, E.; Padmanaban, S. Power loss analysis of solar photovoltaic integrated model predictive control based on-grid inverter. Energies 2020, 13, 4669. [Google Scholar] [CrossRef]
- Leard, B.; McConnell, V. Progress and Potential for Electric Vehicles to Reduce Carbon Emissions, Resources for the Future, Report No 20–24. 2020. Available online: https://www.rff.org/publications/reports/potential-role-and-impact-evs-us-decarbonization-strategies/ (accessed on 18 May 2021).
- Podder, A.K.; Chakraborty, O.; Islam, S.; Kumar, N.M.; Alhelou, H.H. Control strategies of different hybrid energy storage systems for electric vehicles applications. IEEE Access 2021, 9, 51865–51895. [Google Scholar] [CrossRef]
- Global Electric Vehicle Sales Up to 160% in H1 2021. Available online: https://www.canalys.com/newsroom/global-electric-vehicle-sales-up-160-in-h1-2021-despite-supply-constraints (accessed on 15 May 2021).
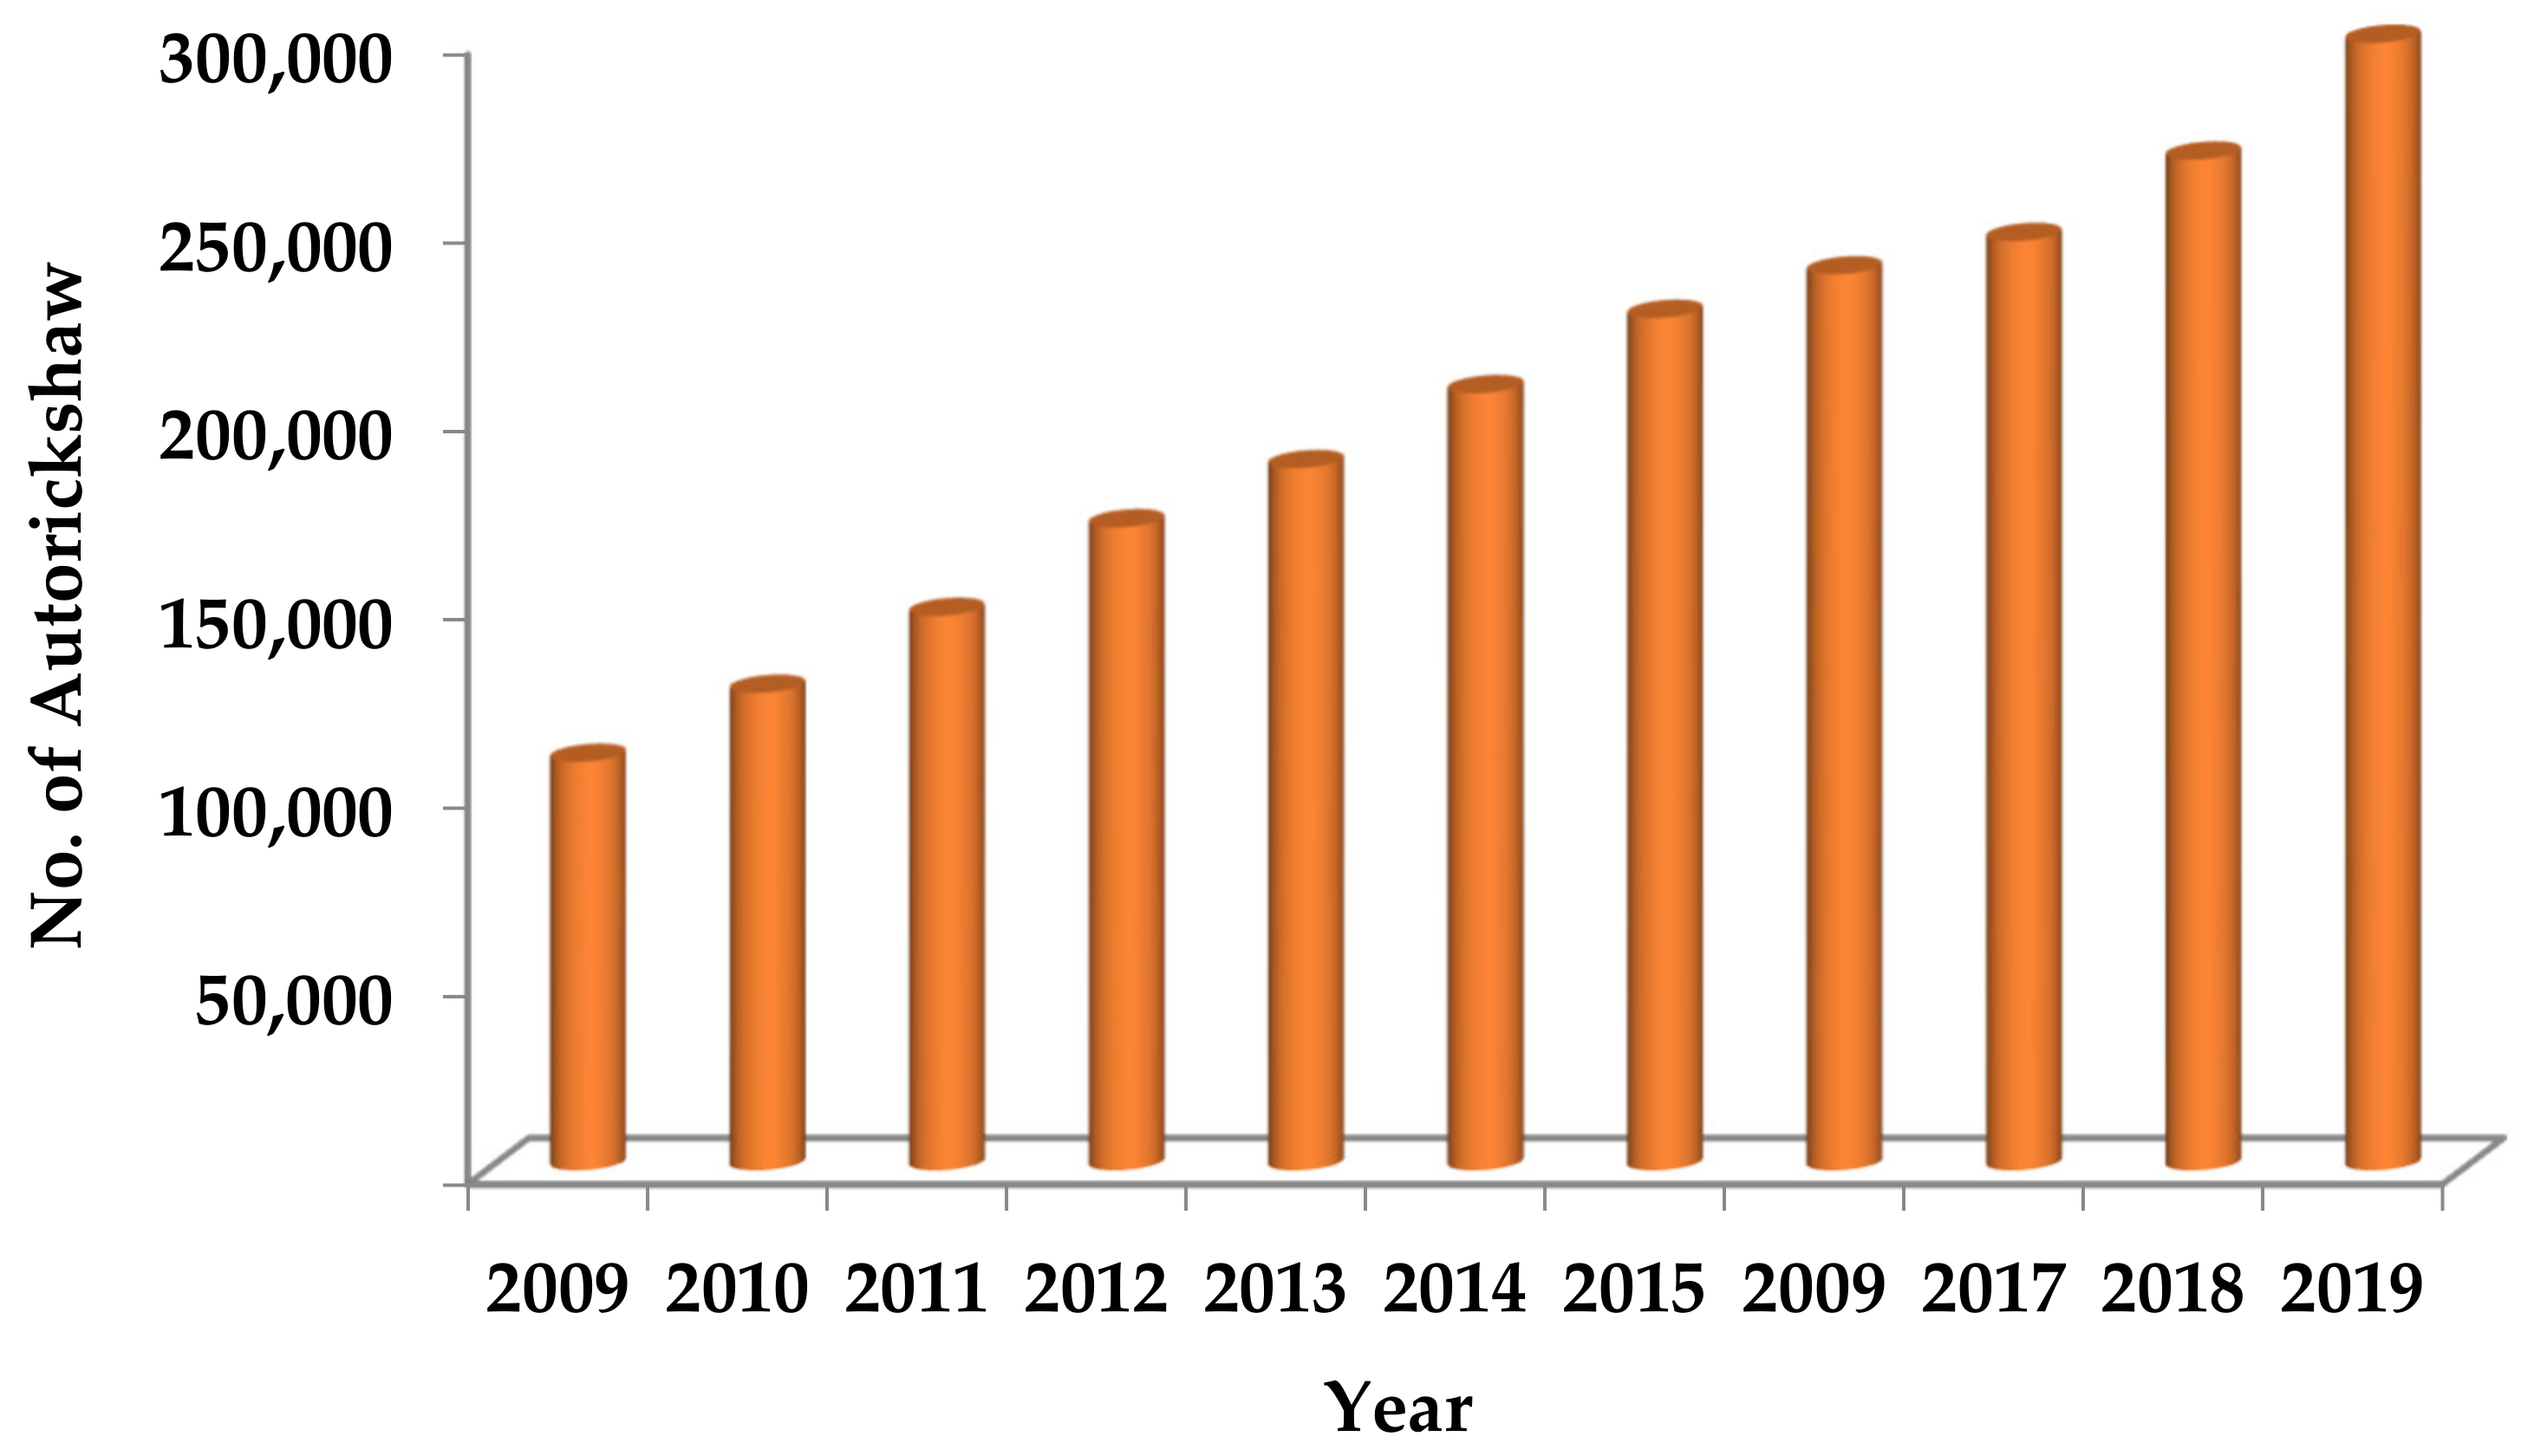
- The Number of Auto-Rickshaws in Bangladesh. Available online: https://brta.portal.gov.bd/sites/default/files/files/brta.portal.gov.bd/page/6d849ccb_09aa_4fbe_aef2_3d254a2a0cd1/2020-07-02-23-21-fba1ebaa3c6a7299fed0d5c2ab8f32fa.pdf (accessed on 21 May 2021).
- Karmaker, A.K. Optimization of Hybrid Renewable Energy Based Electric Vehicle Charging Station. Master’s Thesis, Dhaka University of Engineering & Technology, Gazipur, Bangladesh, 2019. Available online: https://www.researchgate.net/publication/337888557_OPTIMIZATION_OF_HYBRID_RENEWABLE_ENERGY_BASED_ELECTRIC_VEHICLE_CHARGING_STATION (accessed on 25 June 2021).
- Solar, E. Technology by IDCOL. Available online: https://idcol.org/home/dbiogas (accessed on 25 June 2021).
- Solar Power Is Changing Lives in Bangladesh-World Economic Forum. 2020. Available online: https://www.weforum.org/agenda/2020/01/bangladesh-solar-power-energy-grid-rural-life (accessed on 18 May 2021).
- Food Agriculture Organ United Nations 2018. Live Animal Data of FAOSTAT. Available online: https://www.fao.org/faostat/en/#home (accessed on 20 October 2021).
- Osório, G.J.; Shafie-Khah, M.; Coimbra, P.D.L.; Lotfi, M.; Catalão, J.P.S. Distribution system operation with electric vehicle charging schedules and renewable energy resources. Energies 2018, 11, 3117. [Google Scholar] [CrossRef] [Green Version]
- Rezaeimozafar, M.; Moradi, M.H.; Amini, M.H. A simultaneous approach for optimal allocation of renewable energy sources and electric vehicle charging stations in smart grids based on improved GA-PSO algorithm. Sustain. Cities Soc. 2017, 32, 627–637. [Google Scholar]
- Jin, C.; Sheng, X.; Ghosh, P. Optimized electric vehicle charging with intermittent renewable energy sources. IEEE J. Sel. Top. Signal Process. 2014, 8, 1063–1072. [Google Scholar] [CrossRef]
- Fathabadi, H. Novel solar powered electric vehicle charging station with the capability of vehicle-to-grid. Sol. Energy 2017, 142, 136–143. [Google Scholar] [CrossRef]
- Biya, T.S.; Sindhu, M.R. Design and Power Management of Solar Powered Electric Vehicle Charging Station with Energy Storage System. In Proceedings of the 3rd International conference on Electronics, Communication and Aerospace Technology (ICECA), Coimbatore, India, 12–14 June 2019; pp. 815–820. [Google Scholar]
- Singh, B.; Verma, A.; Chandra, A.; Al-Haddad, K. Implementation of solar PV-battery and diesel generator based electric vehicle charging station. IEEE Trans. Ind. Appl. 2020, 56, 4007–4016. [Google Scholar] [CrossRef]
- Raghavan, A.K. PV Enabled Net Zero EV Charging Station: System Design and Simulation Study. Master’s Thesis, University of Waterloo, Waterloo, ON, Canada, 2018. Available online: https://uwspace.uwaterloo.ca/handle/10012/13893 (accessed on 20 April 2021).
- Islam, R.; Hossain, S.; Showrav, A.A.; Ayon, A.A. Solar Battery Charging Station with Automated Switching System. Under. Graduate Thesis, BRAC University, Dhaka, Bangladesh, 2014. Available online: http://dspace.bracu.ac.bd/xmlui/handle/10361/3665 (accessed on 18 May 2021).
- Power System Master Plan 2016, Ministry of Power, Energy and Mineral Resources. Available online: https://powerdivision.gov.bd/site/page/f68eb32d-cc0b-483e-b047-13eb81da6820/Power-System-Master-Plan-2016 (accessed on 5 May 2021).
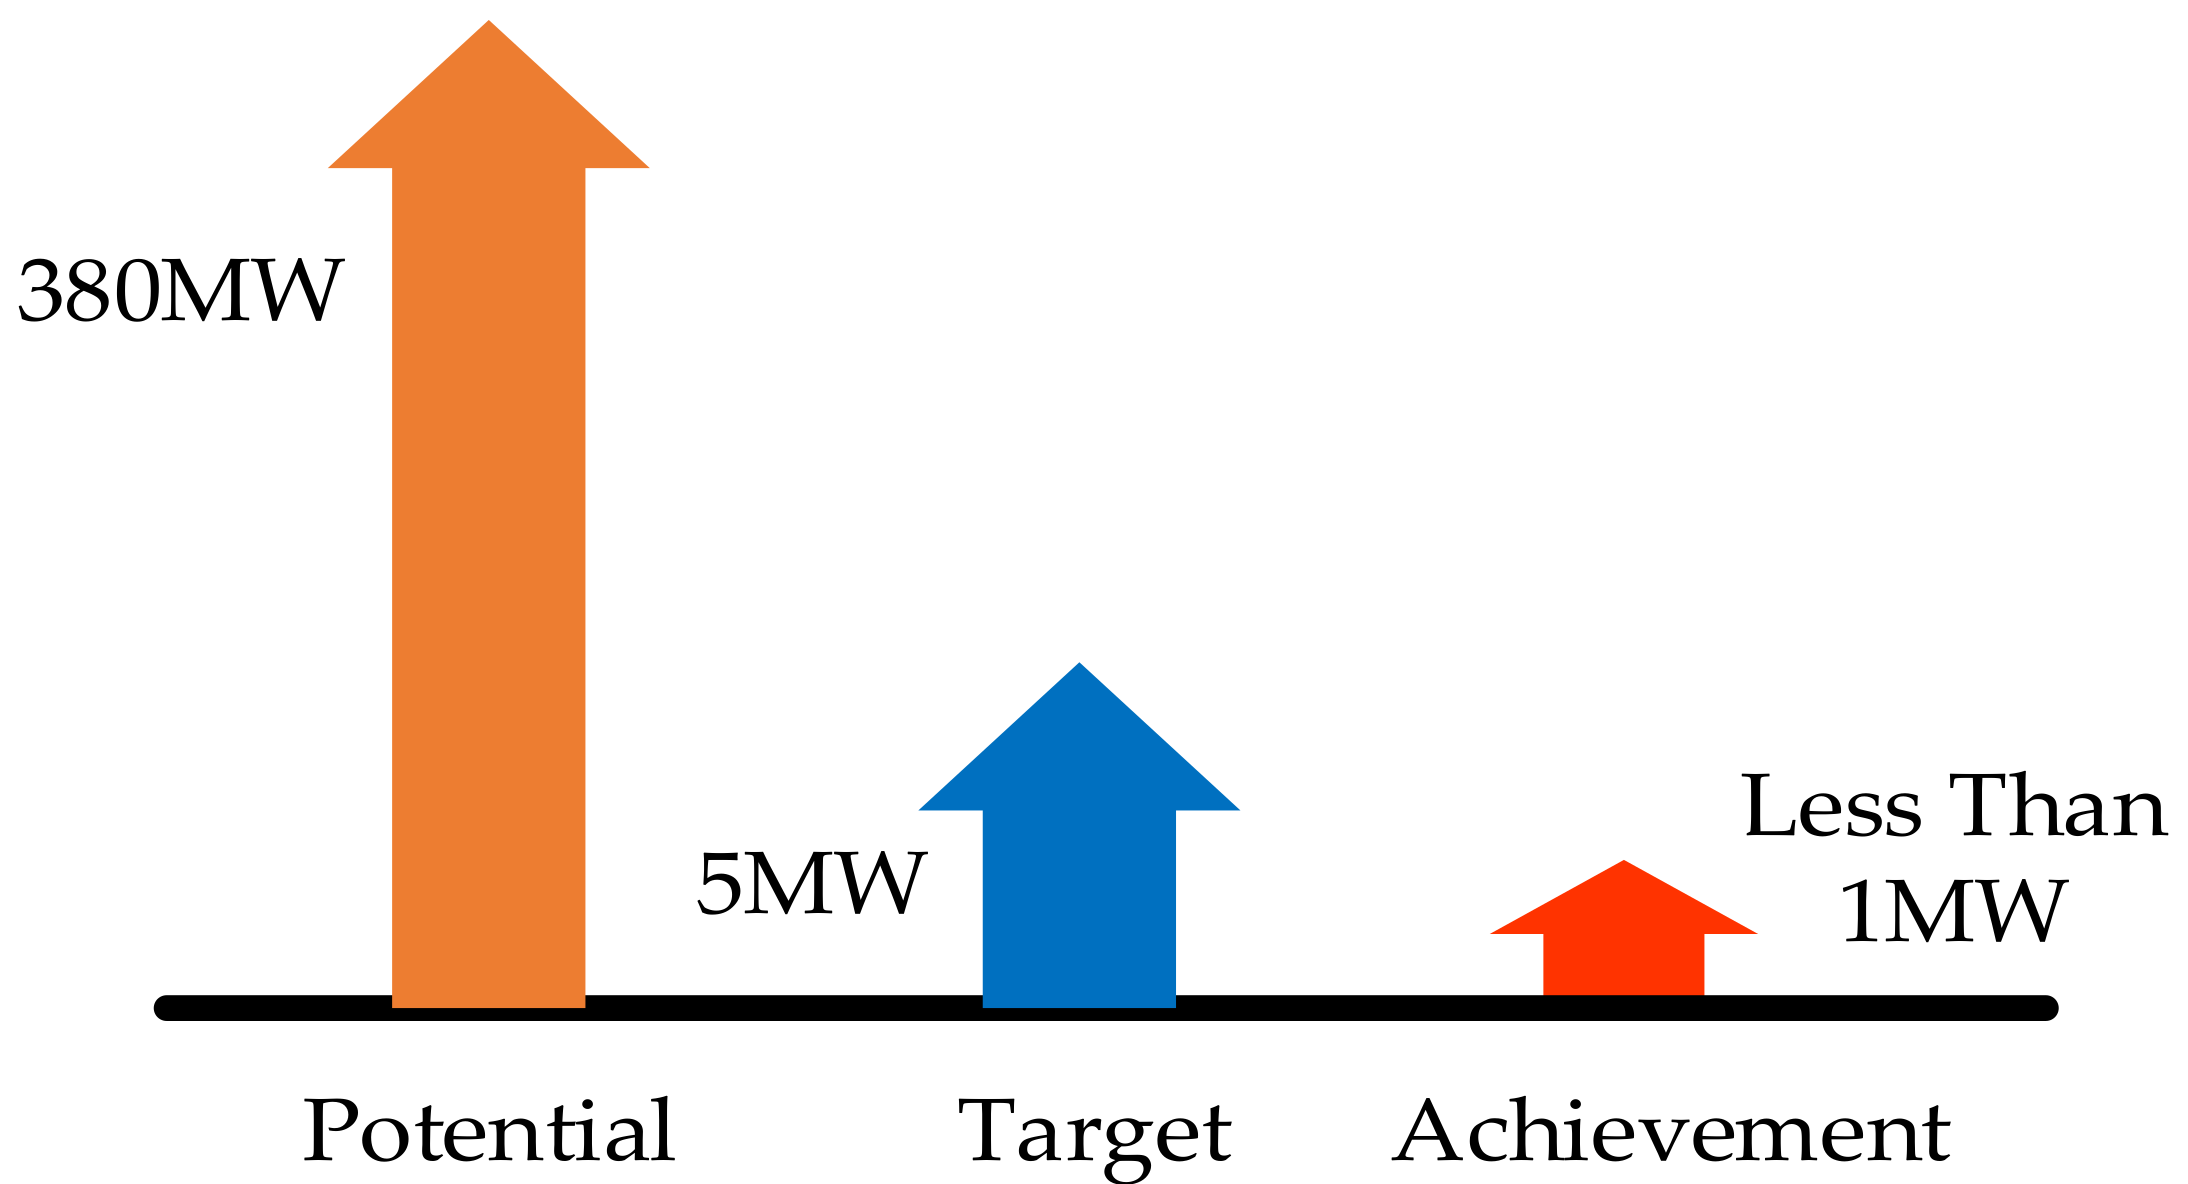
- Sustainable & Renewable Energy Development Authority (SREDA). Available online: http://www.renewableenergy.gov.bd/index.php?id=1&i=8 (accessed on 17 July 2021).
- Khan, E.U.; Mainali, B.; Martin, A.; Silveira, S. Techno-economic analysis of small scale biogas based polygeneration systems: Bangladesh case study. Sustain. Energy Technol. Assess. 2014, 7, 68–78. [Google Scholar] [CrossRef]
- Bangladesh Power Development Board. Bangladesh Power Development Board. 2020. Available online: https://www.bpdb.gov.bd/bpdb_new/index.php/site/area_wise_demand (accessed on 14 May 2021).
- Hasan, A.S.M.M.; Kabir, A.; Hoq, T.; Johansson, M.T.; Thollander, P. Drivers and barriers to the implementation of biogas technologies in Bangladesh. Biofuels 2020, 1841362. [Google Scholar] [CrossRef]
- Narayangonj Sadar Upazila, Banglapedia. Available online: https://en.banglapedia.org/index.php/Narayanganj_Sadar_Upazila (accessed on 17 July 2021).
- Bangladesh Vector Map. Available online: https://www.vectorstock.com/royalty-free-vector/bangladesh-map-vector-1608043 (accessed on 25 May 2021).
- Fatullah, Narayangonj Vector Map. Available online: https://www.thebangladesh.net/dhaka-division/narayanganj-district/narayanganj-sadar-upazila-narayanganj.html (accessed on 25 May 2021).
- The Variation of Solar Irradiation and Clearness Index. Available online: https://www.homerenergy.com/products/pro/docs/latest/finding_data_to_run_homer.html (accessed on 21 May 2021).
- Turkdogan, S. Design and optimization of a solely renewable based hybrid energy system for residential electrical load and fuel cell electric vehicle. Eng. Sci. Technol. Int. J. 2021, 24, 397–404. [Google Scholar] [CrossRef]
- Sanni, S.O.; Ibrahim, M.; Mahmud, I.; Oyewole, T.O.; Olusuyi, K.O. Potential of Off-grid Solar PV/Biogas Power Generation System: Case Study of Ado Ekiti Slaughterhouse. Int. J. Renew. Energy Res. (IJRER) 2019, 9, 1309–1318. [Google Scholar]
- The Specifications of the Utilized Solar PV Module (Canadian solar Dymond CS6K-285M). Available online: http://www.solardesigntool.com/components/module-panel-solar/Canadian-Solar/3453/CS6K-285M-FG/specification-data-sheet.html (accessed on 22 May 2021).
- MNahian, R.; Islam, M.N. Prospects and potential of biogas technology in Bangladesh. In Proceedings of the International Conference on Innovations in Science, Engineering and Technology (ICISET), Dhaka, Bangladesh, 28–29 October 2016; pp. 1–4. [Google Scholar]
- Mudgal, V.; Reddy, K.S.; Mallick, T.K. Techno-economic analysis of standalone solar photovoltaic-wind-biogas hybrid renewable energy system for community energy requirement. Future Cities Environ. 2019, 5. [Google Scholar] [CrossRef] [Green Version]
- The Specifications of the Utilized Bio-Generator (ELEMAX SH5300EX Generator). Available online: http://www.robinme.ae/en/products/view/elemax-generator-sh5300-ex.html (accessed on 22 May 2021).
- Karmaker, A.K.; Hossain, M.; Manoj Kumar, N.; Jagadeesan, V.; Jayakumar, A.; Ray, B. Analysis of Utilizing Bio-gas Resources for Electric Vehicle Charging in Bangladesh: A Techno-economic-environmental Perspective. Sustainability 2020, 12, 2579. [Google Scholar] [CrossRef] [Green Version]
- Liu, J.; Jian, L.; Wang, W.; Qiu, Z.; Zhang, J.; Dastbaz, P. The role of energy storage systems in resilience enhancement of health care centers with critical loads. J. Energy Storage 2021, 33, 102086. [Google Scholar] [CrossRef]
- Podder, A.K.; Das, A.K.; Hossain, E.; Kumar, N.M.; Roy, N.K.; Alhelou, H.H.; Karthick, A.; Al-Hinai, A. Integrated modeling and feasibility analysis of a rooftop photovoltaic systems for an academic building in Bangladesh. Int. J. Low-Carbon Technol. 2021, 16, 1317–1327. [Google Scholar] [CrossRef]
- Capital Recovery Factor. Available online: https://www.homerenergy.com/products/pro/docs/latest/capital_recovery_factor.html (accessed on 25 May 2021).
- Podder, A.K.; Hasan, R.; Roy, N.K.; Komol, M.R. Economic analysis of a grid connected pv systems: A case study in khulna. Eur. J. Eng. Res. Sci. 2018, 3, 16–21. [Google Scholar] [CrossRef]
- Kumar, N.M.; Sudhakar, K.; Samykano, M. Techno-economic analysis of 1 MWp grid connected solar PV plant in Malaysia. Int. J. Ambient. Energy 2017, 40, 434–443. [Google Scholar] [CrossRef]
- Nurunnabi, M.; Roy, N.K.; Hossain, E.; Pota, H.R. Size optimization and sensitivity analysis of hybrid wind/PV micro-grids- a case study for Bangladesh. IEEE Access 2019, 7, 150120–150140. [Google Scholar] [CrossRef]
- Nurunnabi, M.; Roy, N.K.; Pota, H. Optimal sizing of grid-tied hybrid renewable energy systems considering inverter to PV ratio—A case study. J. Renew. Sustain. Energy 2019, 11, 013505. [Google Scholar] [CrossRef]
- Minh, P.; Le Quang, S.; Pham, M.-H. Technical economic analysis of photovoltaic-powered electric vehicle charging stations under different solar irradiation conditions in Vietnam. Sustainability 2021, 13, 3528. [Google Scholar] [CrossRef]
- Schetinger, A.M.; Dias, D.H.N.; Borba, B.S.M.C.; Da Silva, G.D.P. Techno-economic feasibility study on electric vehicle and renewable energy integration: A case study. Energy Storage 2020, 2, 197. [Google Scholar] [CrossRef]
- Ye, B.; Jiang, J.; Miao, L.; Yang, P.; Li, J.; Shen, B. Feasibility study of a solar-powered electric vehicle charging station model. Energies 2015, 8, 13265–13283. [Google Scholar] [CrossRef] [Green Version]
- Ilieva, L.M.; Iliev, S.P. Feasibility assessment of a solar-powered charging station for electric vehicles in the North Central region of Bulgaria. Renew. Energy Environ. Sustain. 2016, 1, 12. [Google Scholar] [CrossRef]
- Dai, Q.; Liu, J.; Wei, Q. Optimal photovoltaic/battery energy storage/electric vehicle charging station design based on multi-agent particle swarm optimization algorithm. Sustainability 2019, 11, 1973. [Google Scholar] [CrossRef] [Green Version]


| Parameters | Easy Bike | Auto Rickshaw |
|---|---|---|
| Battery Number | 5 | 4 |
| Battery Specification | 12 V/80 Ah | 12 V/80 Ah |
| Voltage | 60 V | 48 V |
| Power | 800 W (Approximate) | 500 W (Approximate) |
| Power Consumption | 8–11 kWh | 3.0–4.5 kWh |
| Load Bearing Capacity | 300–400 kg | 150–250 kg |
| Charging Time | 7–8 h | 6–8 h |
| Continued Trip Mileage | 80–100 km | 50–60 km |
| Maximum Speed | 35 km/h | 25 km/h |
| Component Name | Size | Lifetime | Capital Cost ($) | Operations & Maintenance (O&M) Cost ($) | Replacement Cost ($) |
|---|---|---|---|---|---|
| PV Module | 1 kW | 25 years | 1000 | 0 | 1000 |
| Bio Generator -1 | 5 kW | 20,000 h | 1500 | 0.3 | 1500 |
| Bio Generator -2 | 5 kW | 20,000 h | 1500 | 0.3 | 1500 |
| Converter | 1 kW | 20 years | 650 | 0 | 650 |
| Battery | 321 Ah | 10 years | 98.45 | 22 | 98.45 |
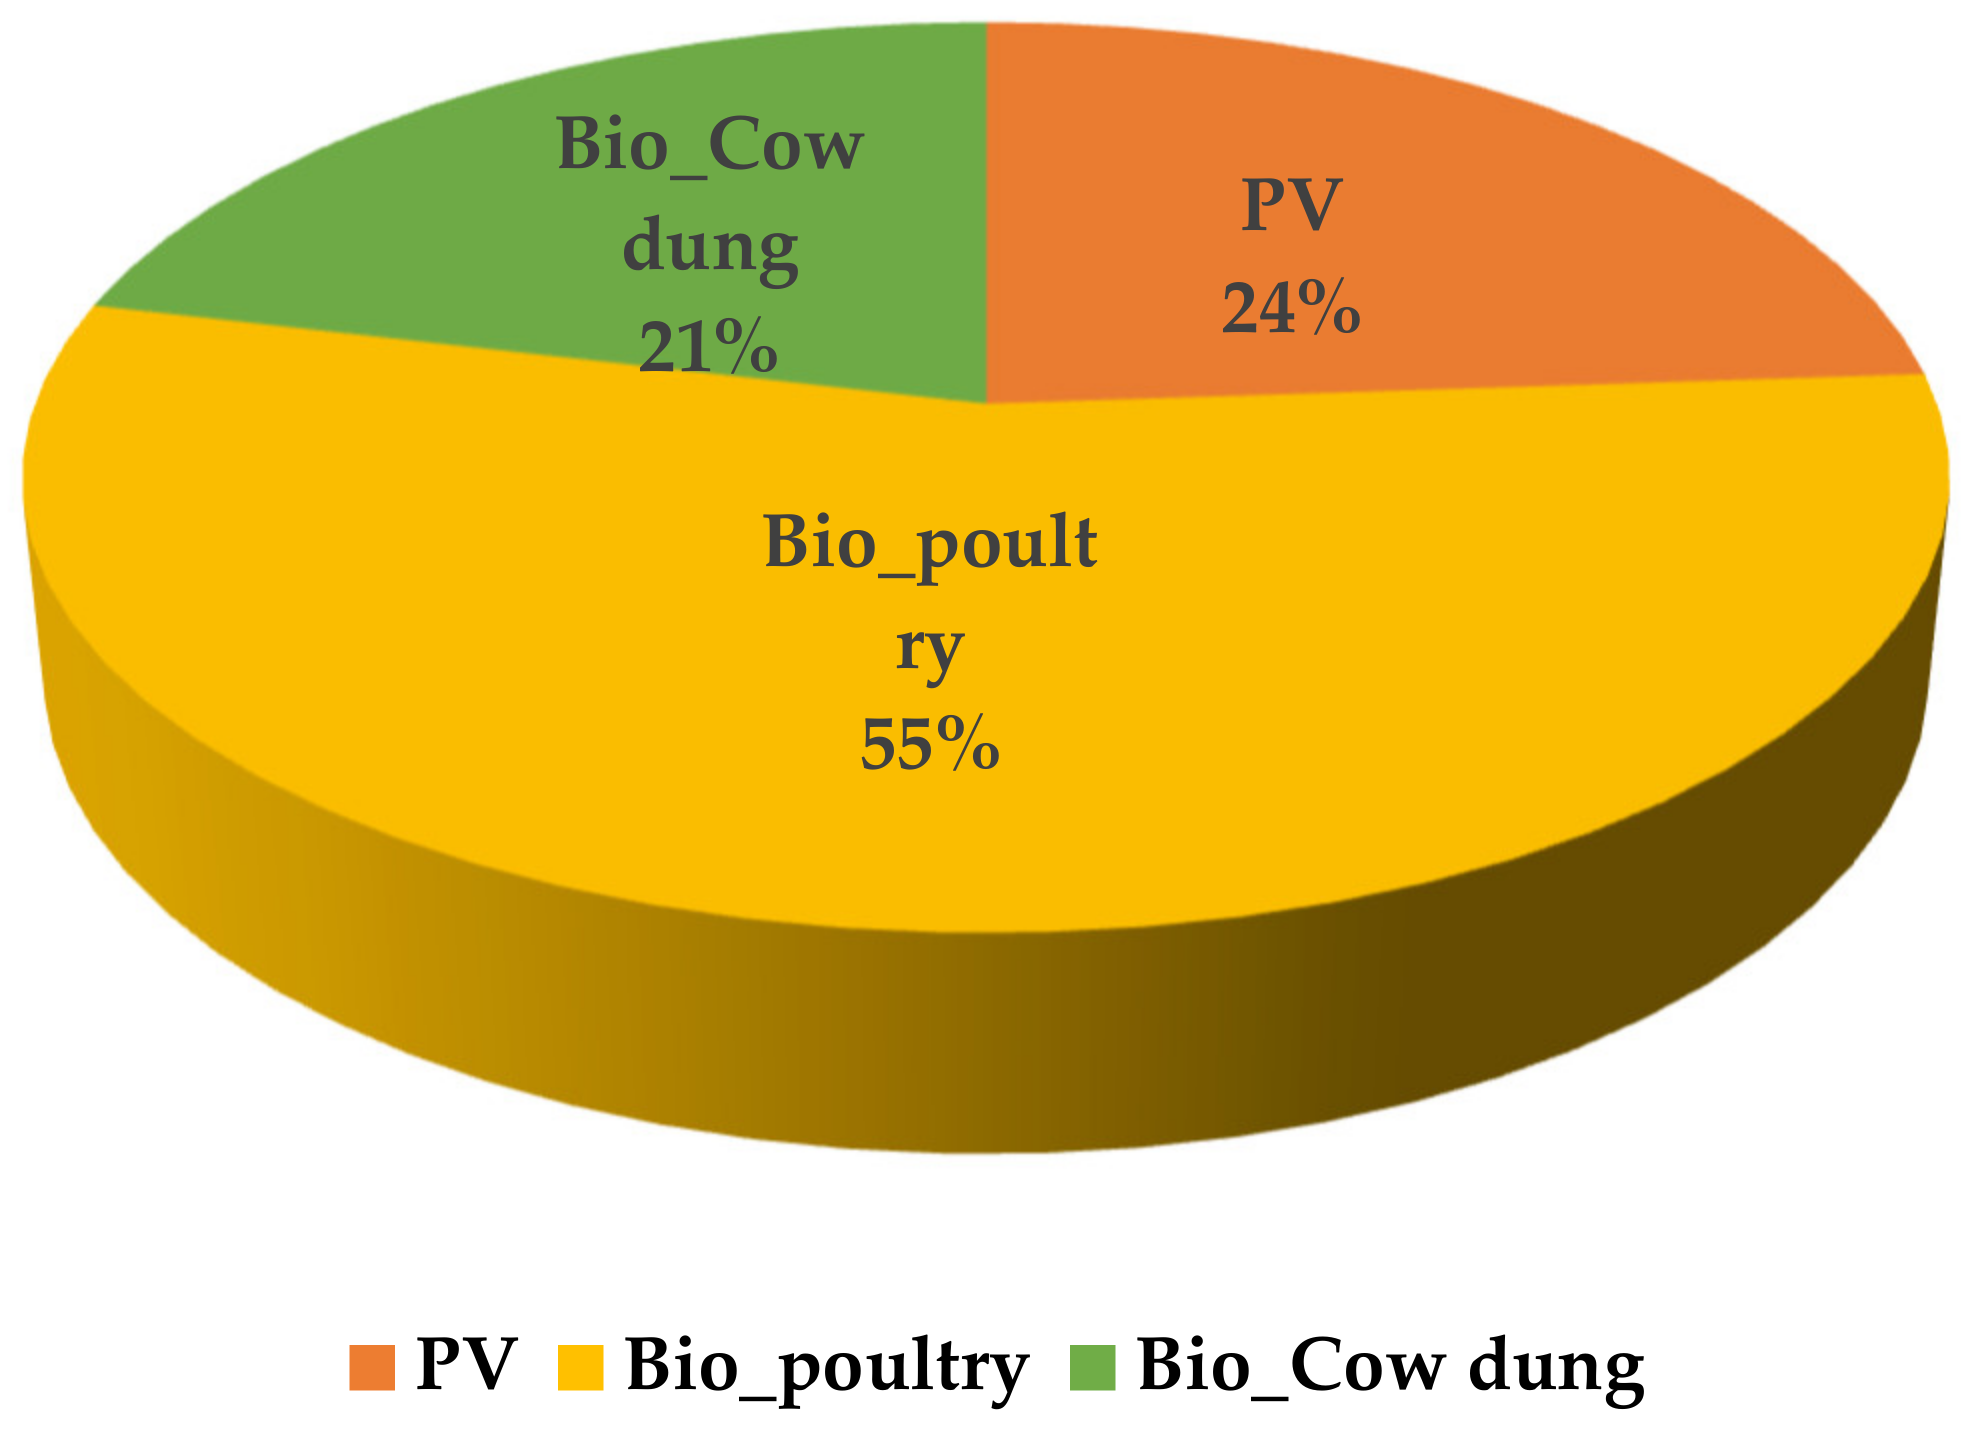
| System | Electricity (kWh/yr) |
|---|---|
| PV | 5455 |
| Bio_Poultry | 12,488 |
| Bio_Cow_dung | 4860 |
| Total | 22,803 |
| Various Configuration | COE ($) | NPC ($) | Operating Cost ($) | Initial Cost ($) | Emission (kg/h) |
|---|---|---|---|---|---|
| Grid | 0.15 | 77,486 | 3970 | 0 | 16,727 |
| Biogas/Grid | 0.0488 | 53,719 | 2522 | 4500 | 7274 |
| Biogas/Battery/Grid | 0.0656 | 72,256 | 2924 | 15,175 | 7272 |
| PV/Biogas/Battery | 0.181 | 93,530 | 3781 | 19,735 | 6.93 |
| PV/Biogas/Battery/Grid | 0.0601 | 71,384 | 2646 | 19,735 | 6359 |
| PV/Biogas/Grid | 0.112 | 84,415 | 2823 | 18,160 | 1114 |
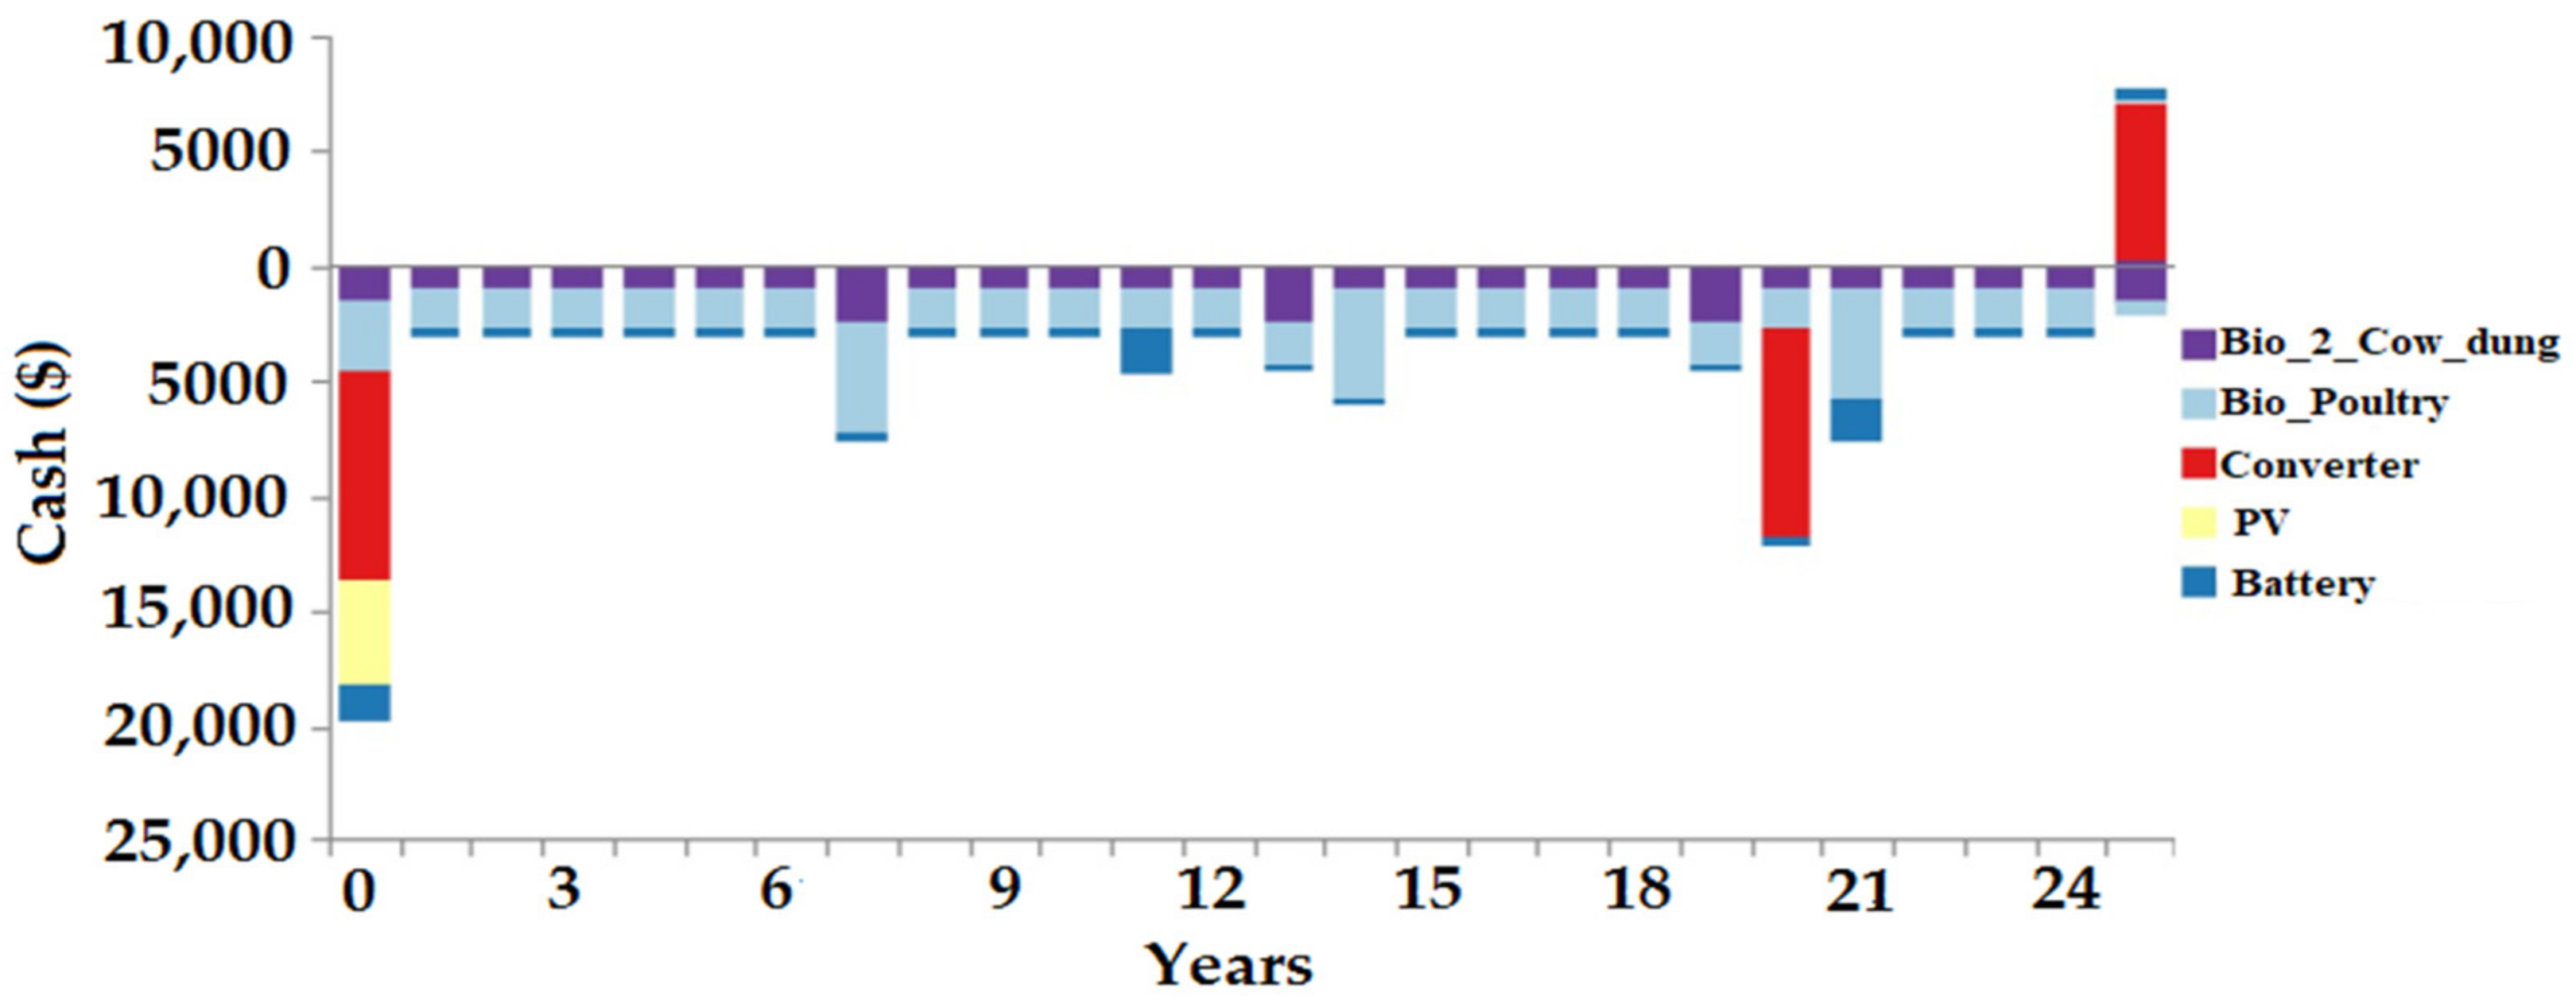
| Component | Capital ($) | Replacement ($) | O&M ($) | Fuel ($) | Salvage ($) | Total ($) |
|---|---|---|---|---|---|---|
| Bio_Cow_Dung | $1500.00 | $4233.77 | $22,512.04 | $0.00 | $4.98 | $28,240.83 |
| Bio_Poulty | $3000.00 | $8417.44 | $41,010.36 | $0.00 | $955.50 | $51,472.29 |
| Converter | $9100.00 | $8250.64 | $0.00 | $0.00 | $6038.24 | $11,312.40 |
| PV | $4560.00 | $0.00 | $0.00 | $0.00 | $0.00 | $4560.00 |
| Battery (Trojan SAGM 06 220) | $1575.20 | $2885.48 | $8262.16 | $0.00 | $1280.33 | $11,442.50 |
| System | $19,735.20 | $23,787.32 | $71,784.56 | $0.00 | $8279.05 | $107,028.03 |
| Emission (kg/h) | Existing System | Proposed System |
|---|---|---|
| 16,727 | 6.93 | |
| 0 | 0.726 | |
| 72.5 | 0 | |
| 35.5 | 6.48 |
| Ref. | Location | Year | Simulation | System Configuration | Energy Production (kWh/Year) | Life Cycle | Financial Cost | GHG Emission (kg/Year) | ||||
|---|---|---|---|---|---|---|---|---|---|---|---|---|
| Capital/Initial Cost | NPC | COE | O&M | |||||||||
| [9] | Gazipur, Bangladesh | 2019 | HOMER + MATLAB | PV + Biogas | 40,170 | 10.10 Y for PV | Not Mentioned | $56,202 | $0.1302 | $2720 | 8837.40 | |
| [30] | Ayvalik, Turkey | 2020 | HOMER | PV + Wind + Battery + Fuel Cell | 27,385 | 25 Years | $43,776 | $69,221 | $0.685 | Not Mentioned | Zero | |
| [36] | Gazipur, Bangladesh | 2020 | HOMER | Biogas + Battery | 31,680 | 4.99 Year | Not Mentioned | BDT. 1,725,000 | BDT. 5.56 | BDT. 178,000 | 6653 | |
| [44] | Vietnam | Hanoi | 2021 | HOMER | PV + Utility Grid + Battery | 100,255 | 25 Years | $62,550 | $113,462 | $0.0992 | $4396 |
Minimum |
| Da Nang | 2021 | HOMER | PV + Utility Grid + Battery | 105,290 | 25 Years | $62,550 | $100,748 | $0.0841 | $3299 | |||
| Ho Chi Minh | 2021 | HOMER | PV + Utility Grid + Battery | 106,872 | 25 Years | $62,550 | $97,227 | $0.0800 | $2995 | |||
| [45] | City of Niteroi, Rio de Janeiro Brazil | Scenario1 (S1) | 2020 | HOMER | Only Grid | Not Mentioned | 25 Years | $0.00 | $7,505,534.25 | 0.14 $/KWh | $300,221.37 /Year | Not Considered |
| Scenario2 (S2) | 2020 | HOMER | Grid + Solar PV + Wind | 525,477 | 25 Years | $504,221.37 /Year | $8,616,347.95 | 0.16 $/KWh | $324,489.59 /Year | |||
| Scenario3 (S3) | 2020 | HOMER | Grid + Solar PV + Wind | 2,428,072 | 25 Years | $897,232.88 /Year | $6,958,162.19 | 0.12 $/KWh | $242,437.26 /Year | |||
| [46] | Shenzhen City, China | 2015 | HOMER | PV + Grid + Battery | 2,627,953 | Not Mentioned | $180,907 | $3,579,236 | $0.098/ kWh | $23,687 | 461,206 1266 619 | |
| [47] | North Central Region, Bulgaria | 2016 | Not Mentioned | PV + Battery | Not Mentioned | 20 Years | 1300,22 EUR/KW | EUR 18,949.32 | Not Mentioned | 1180 EUR/kWh | Not Considered | |
| [48] | Shanghai, China | 2019 | MAPSO algorithm | PV + Battery + Utility Grid | Not Mentioned | 25 Years | 10,000 Yuan/unit | Not Mentioned | 0.623 Yuan/kWh | 15 Yuan/year | Not Considered | |
| Proposed | Fattullah, Bangladesh | 2021 | HOMER | PV + Biogas + Battery | 22,803 | 25 Years | 19,735.20 | $93,530 | $0.181 | $71,784.56 | 6.93 = 0.726 6.48 | |
Publisher’s Note: MDPI stays neutral with regard to jurisdictional claims in published maps and institutional affiliations. |
© 2021 by the authors. Licensee MDPI, Basel, Switzerland. This article is an open access article distributed under the terms and conditions of the Creative Commons Attribution (CC BY) license (https://creativecommons.org/licenses/by/4.0/).
Share and Cite
Podder, A.K.; Supti, S.A.; Islam, S.; Malvoni, M.; Jayakumar, A.; Deb, S.; Kumar, N.M. Feasibility Assessment of Hybrid Solar Photovoltaic-Biogas Generator Based Charging Station: A Case of Easy Bike and Auto Rickshaw Scenario in a Developing Nation. Sustainability 2022, 14, 166. https://doi.org/10.3390/su14010166
Podder AK, Supti SA, Islam S, Malvoni M, Jayakumar A, Deb S, Kumar NM. Feasibility Assessment of Hybrid Solar Photovoltaic-Biogas Generator Based Charging Station: A Case of Easy Bike and Auto Rickshaw Scenario in a Developing Nation. Sustainability. 2022; 14(1):166. https://doi.org/10.3390/su14010166
Chicago/Turabian StylePodder, Amit Kumer, Sayma Afroza Supti, Sayemul Islam, Maria Malvoni, Arunkumar Jayakumar, Sanchari Deb, and Nallapaneni Manoj Kumar. 2022. "Feasibility Assessment of Hybrid Solar Photovoltaic-Biogas Generator Based Charging Station: A Case of Easy Bike and Auto Rickshaw Scenario in a Developing Nation" Sustainability 14, no. 1: 166. https://doi.org/10.3390/su14010166
APA StylePodder, A. K., Supti, S. A., Islam, S., Malvoni, M., Jayakumar, A., Deb, S., & Kumar, N. M. (2022). Feasibility Assessment of Hybrid Solar Photovoltaic-Biogas Generator Based Charging Station: A Case of Easy Bike and Auto Rickshaw Scenario in a Developing Nation. Sustainability, 14(1), 166. https://doi.org/10.3390/su14010166