1. Introduction
Energy and climate issues have become increasingly important in recent years, both for containing energy costs and for achieving sustainable growth. For this reason, European Laws have become increasingly severe. The main targets for 2030 are a reduction of 40% in greenhouse gases, an increase in renewable energy of 27%, and energy efficiency of 27%. For 2050, the targets are higher, with a prospective reduction in emissions of around 90% in Europe, and increases in energy from renewables to 75% and energy efficiency to 41%.
Geothermal energy is a renewable energy source, similarly to solar and wind energy. Nevertheless, in Italy, the use of geothermal energy is not widespread in heating–cooling applications, and it is mainly restricted to electrical production power plants, located in the Tuscany region. Thanks to heat pump technology, an increase in the use of geothermal energy is forecast in the heating–cooling sector and similar technological applications.
The European Union is a world leader in wine production, with Italy, France, and Spain together producing 52% of the wine in the world (respectively 18.9%, 17.9%, and 15.7%). The European production of wine was about 260 million hectoliters in 2020. The quantity of production has been decreasing in recent years, a little bit under the average. The quality of the produced wine in Europe and the exports are increasing, with 2020, due to the pandemic crisis, having a contraction of exports [
1].
In Italy the revenue of the wine industry is about 11,500 million euros per year (2020); the importance of the sector in the country is clear. The wine production sector requires a high quantity of energy; about 1750 million kWh per year in Europe. Following the size of the production facility, the electricity consumption comprises between 4 kWh/hl (large winery) and 16 kWh/hl (small winery) [
2].
The production processes can be different, depending on the characteristics of the final product, but some of them are common.
Figure 1 shows a simple schematic of the processes in winemaking.
The grapes arriving at the winery are received and separated from the stems before being crushed. In the crushing process, the grape skin is broken, releasing the pulp and juice, and becoming a grape must. The woody part is removed to avoid unpleasant flavors. The process proceeds differently for red and white wines. For red wines, the must is directly sent to the fermentation stage and after to a pressing stage, to separate the skins, seeds, and pulp. For white wines, the first stage is the pressing, followed by the fermentation stage. This is required to avoid any color in the wine.
The must is transferred to tanks or vats to be fermented. Fermentation is an extremely important step in the winemaking process, determining the product quality. In the fermentation stage, yeasts convert the sugars to alcohol and carbon dioxide. The reaction is exothermic, and the process takes place at a controlled temperature, for quality purposes. If the temperature increases too much (greater than 25–20 °C), the yeasts begin to die and the fermentation process is stopped. This requires the cooling of the stainless steel tanks, and this is one of the major energy uses in a winery.
After this first fermentation stage, the product is pressed, if required, and passed into tanks for malolactic fermentation for a few days, to be transformed into wine. Similarly, in this stage, the temperature must be controlled. Above 30 °C the bacteria die, and below 15 °C the process is too slow to be end in a reasonable period.
After the malolactic fermentation stage, the wine is clarified and stabilized. The most common techniques to clarify wine are racking, cold stabilization, fining, and filtering. After this, the last stage is ageing, storage, and bottling.
In Italy the energy consumption of the wine sector is 500 million kWh per year (as for France), in Spain it is 400 million kWh per year, and in Portugal about 75 million kWh per year. The main energy need (more than 90%) is electricity in the wine cellar, whereas the thermal requirement is less than 10%, fed by fossil fuels. Some wineries use only electricity. It is noteworthy that 45% of the energy is consumed by the fermentation processes, especially by the cooling systems for the vinification process (
Figure 1).
In a winery, the average electricity consumption is typically about 11 kWh/hl, and the alcoholic fermentation process constitutes 50% [
3]. This implies that the energy consumption is highly focused on a short period during the year, the winemaking time (September and October) [
2].
From a recent work on an Italian winery, the energy performance index is between 5.8 and 7.2 kWh/hl [
4]. The energy consumption has the same distribution between the different processes, with 53% given to the fermentation stage.
From the analysis of the energy use in English wine production, it appears difficult to find a significant average value of energy needed per unit of product. However, in their analysis, the heating/cooling requirements appear to be prevalent (44%). They also remark that the size of the winery influences energy consumption. Small wineries expend 0.352 kWh/L, medium wineries 0.975 kWh/L, and the large wineries have a value of 0.510 kWh/L, influenced by economies of scale [
5].
This analysis highlights a high energy requirement, in terms of electrical energy and its concentration in a very short time during the year. There is a need to provide sustainability in this sector by introducing renewable energy, as is proposed in general in the agricultural sector [
6]. A lot of different projects and works have been undertaken in recent years. Due to the electricity consumption, a lot of them are characterized by the use of photovoltaic panels [
2,
4,
7]. Solar energy is also used for thermal uses, based on solar thermal collectors. A breakdown of wineries using solar energy in Europe shows Germany leading, with 45%, followed by Italy (25%) and France (11%) [
8]. Few cases have adopted a shallow geothermal plant. The industrial application of shallow geothermal plants is mainly in the agriculture sector. A large part of the applications are in greenhouses [
9,
10,
11,
12], as well as in the winery sector [
13,
14,
15].
Since 2009, the Salcheto winery, located in Montepulciano (Italy), has undertaken a process of containment of primary energy consumption and the implementation of green energy technologies, to achieve increasing environmental sustainability and to become off-grid, as much as possible. Thanks to some bio-architecture solutions, the winery has reduced its energy consumption by 54% (solar illumination, adiabatic cooling, natural ventilation, and CO2 recovery from the fermentation of the grape must). A mix of photovoltaic, wood biomass, and geothermal energy sources supplies the rest of the energy. The target of this analysis was to investigate some technical issues concerning the geothermal plant based on a horizontal ground source heat exchanger (GSHE), with the target of controlling the vinification temperature and increasing the efficiency of the system. The estimation of the renovated site indicated that the energy share will be 54% by energy savings, 29% by wood biomass, 15% by geothermal energy, and 2% using a photovoltaic plant
This work is based on a previous analysis of data collected by SED (Soluzioni per Energia & Diagnostica S.r.l) during the wine production process. Two monitoring wells have been realized, and a thermal response test was carried out to calibrate the modeling. Using the collected data, the hydraulic efficiency of the system was evaluated, and the heat and cooling efficiency of the GSHE plant was calculated using the IGSHPA method [
16]. The results indicated the low performance of the plant; therefore, in the second step, some modifications to the plant were proposed and analyzed.
2. Materials and Methods
The Salcheto winery is known around the world for its high-quality wines, produced by local grapes of the “Vino Nobile di Montepulciano” district. The cultivation of the vineyards follows biological standards, and all phases of wine production and marketing are realized within the company.
During the winemaking process, in the alcoholic fermentation process, the enzymes of yeast convert the sugar contained in the grape juice into ethylic alcohol, as well as carbon dioxide, glycerol, and other sub-products. This transformation is an exothermic process, and it causes an increase of the temperature up to 35–40 °C inside the vats. The enzymes are active with temperatures lower than 30 °C, so it is necessary to cool down the vats to avoid the fermentation stopping. The optimum range temperature is 22–30 °C.
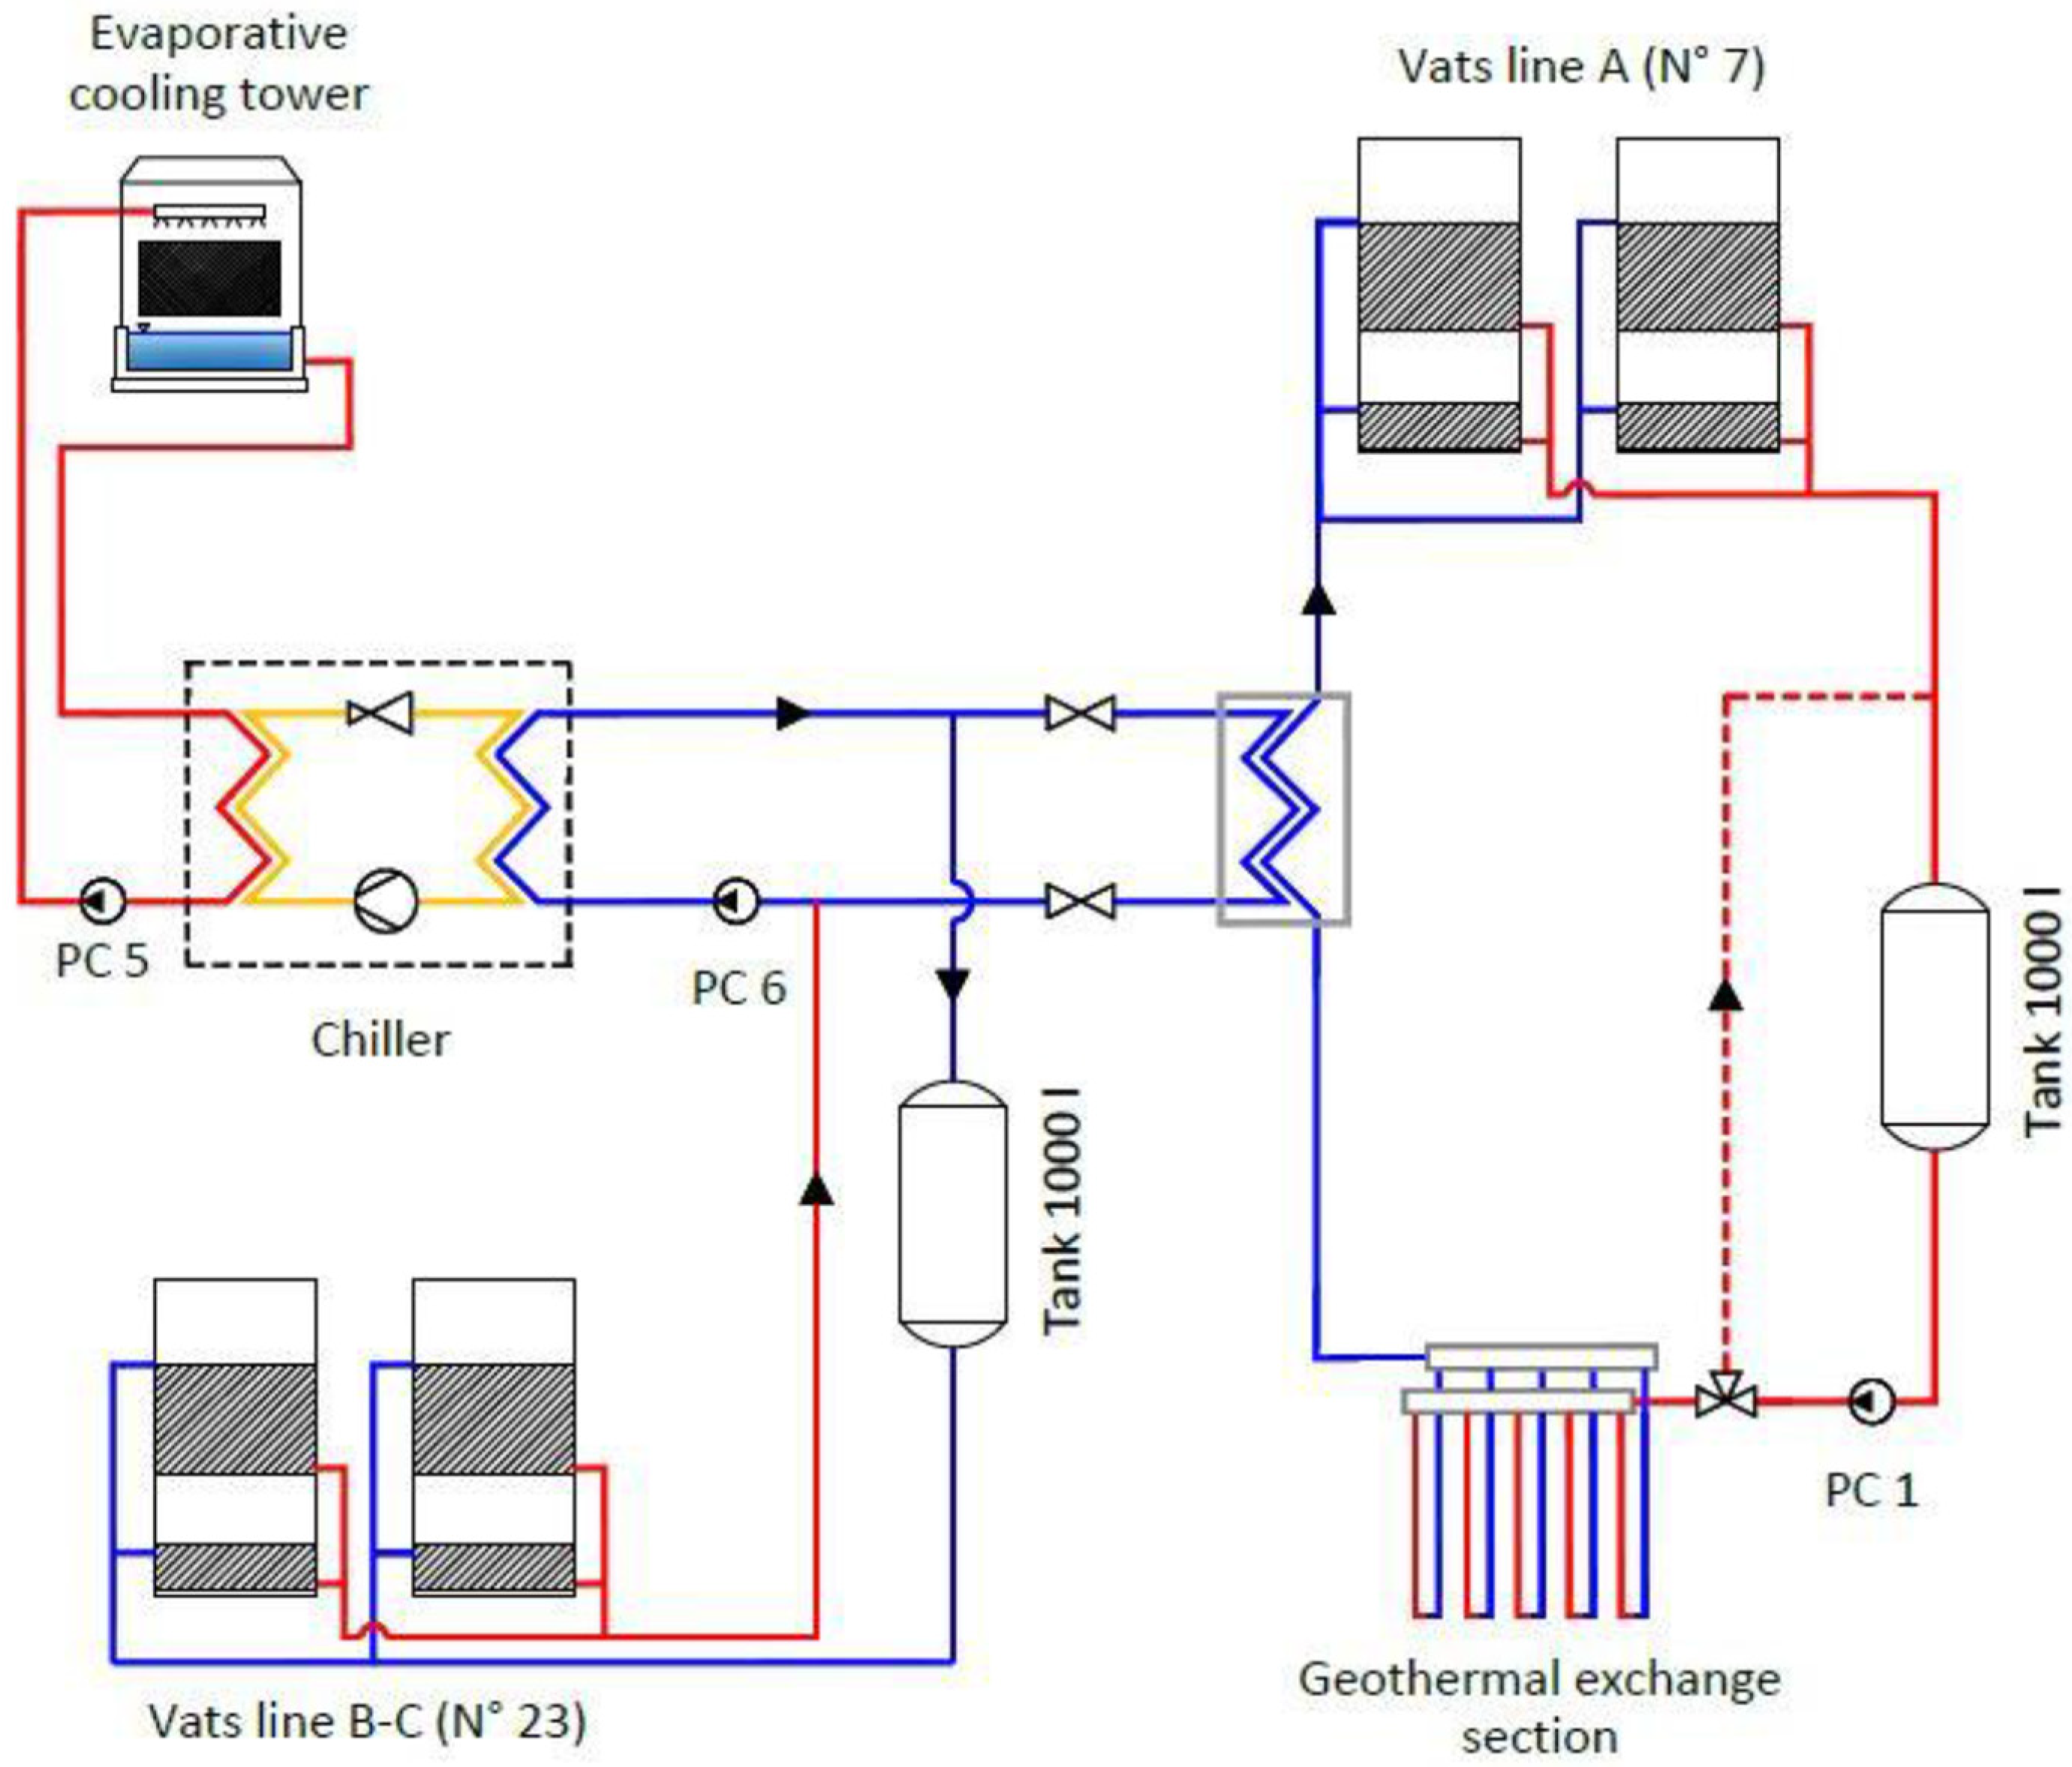
The configuration of the cooling plant serving the vat lines is in
Figure 2. It is formed by two lines of vat cooling. Line A, formed by seven vats with a volume of 11,000 liters each, is served by the GSHE plant and the chiller can feed line A, in case of necessity. The other line is the B-C, formed by 23 vats and served by the chiller.
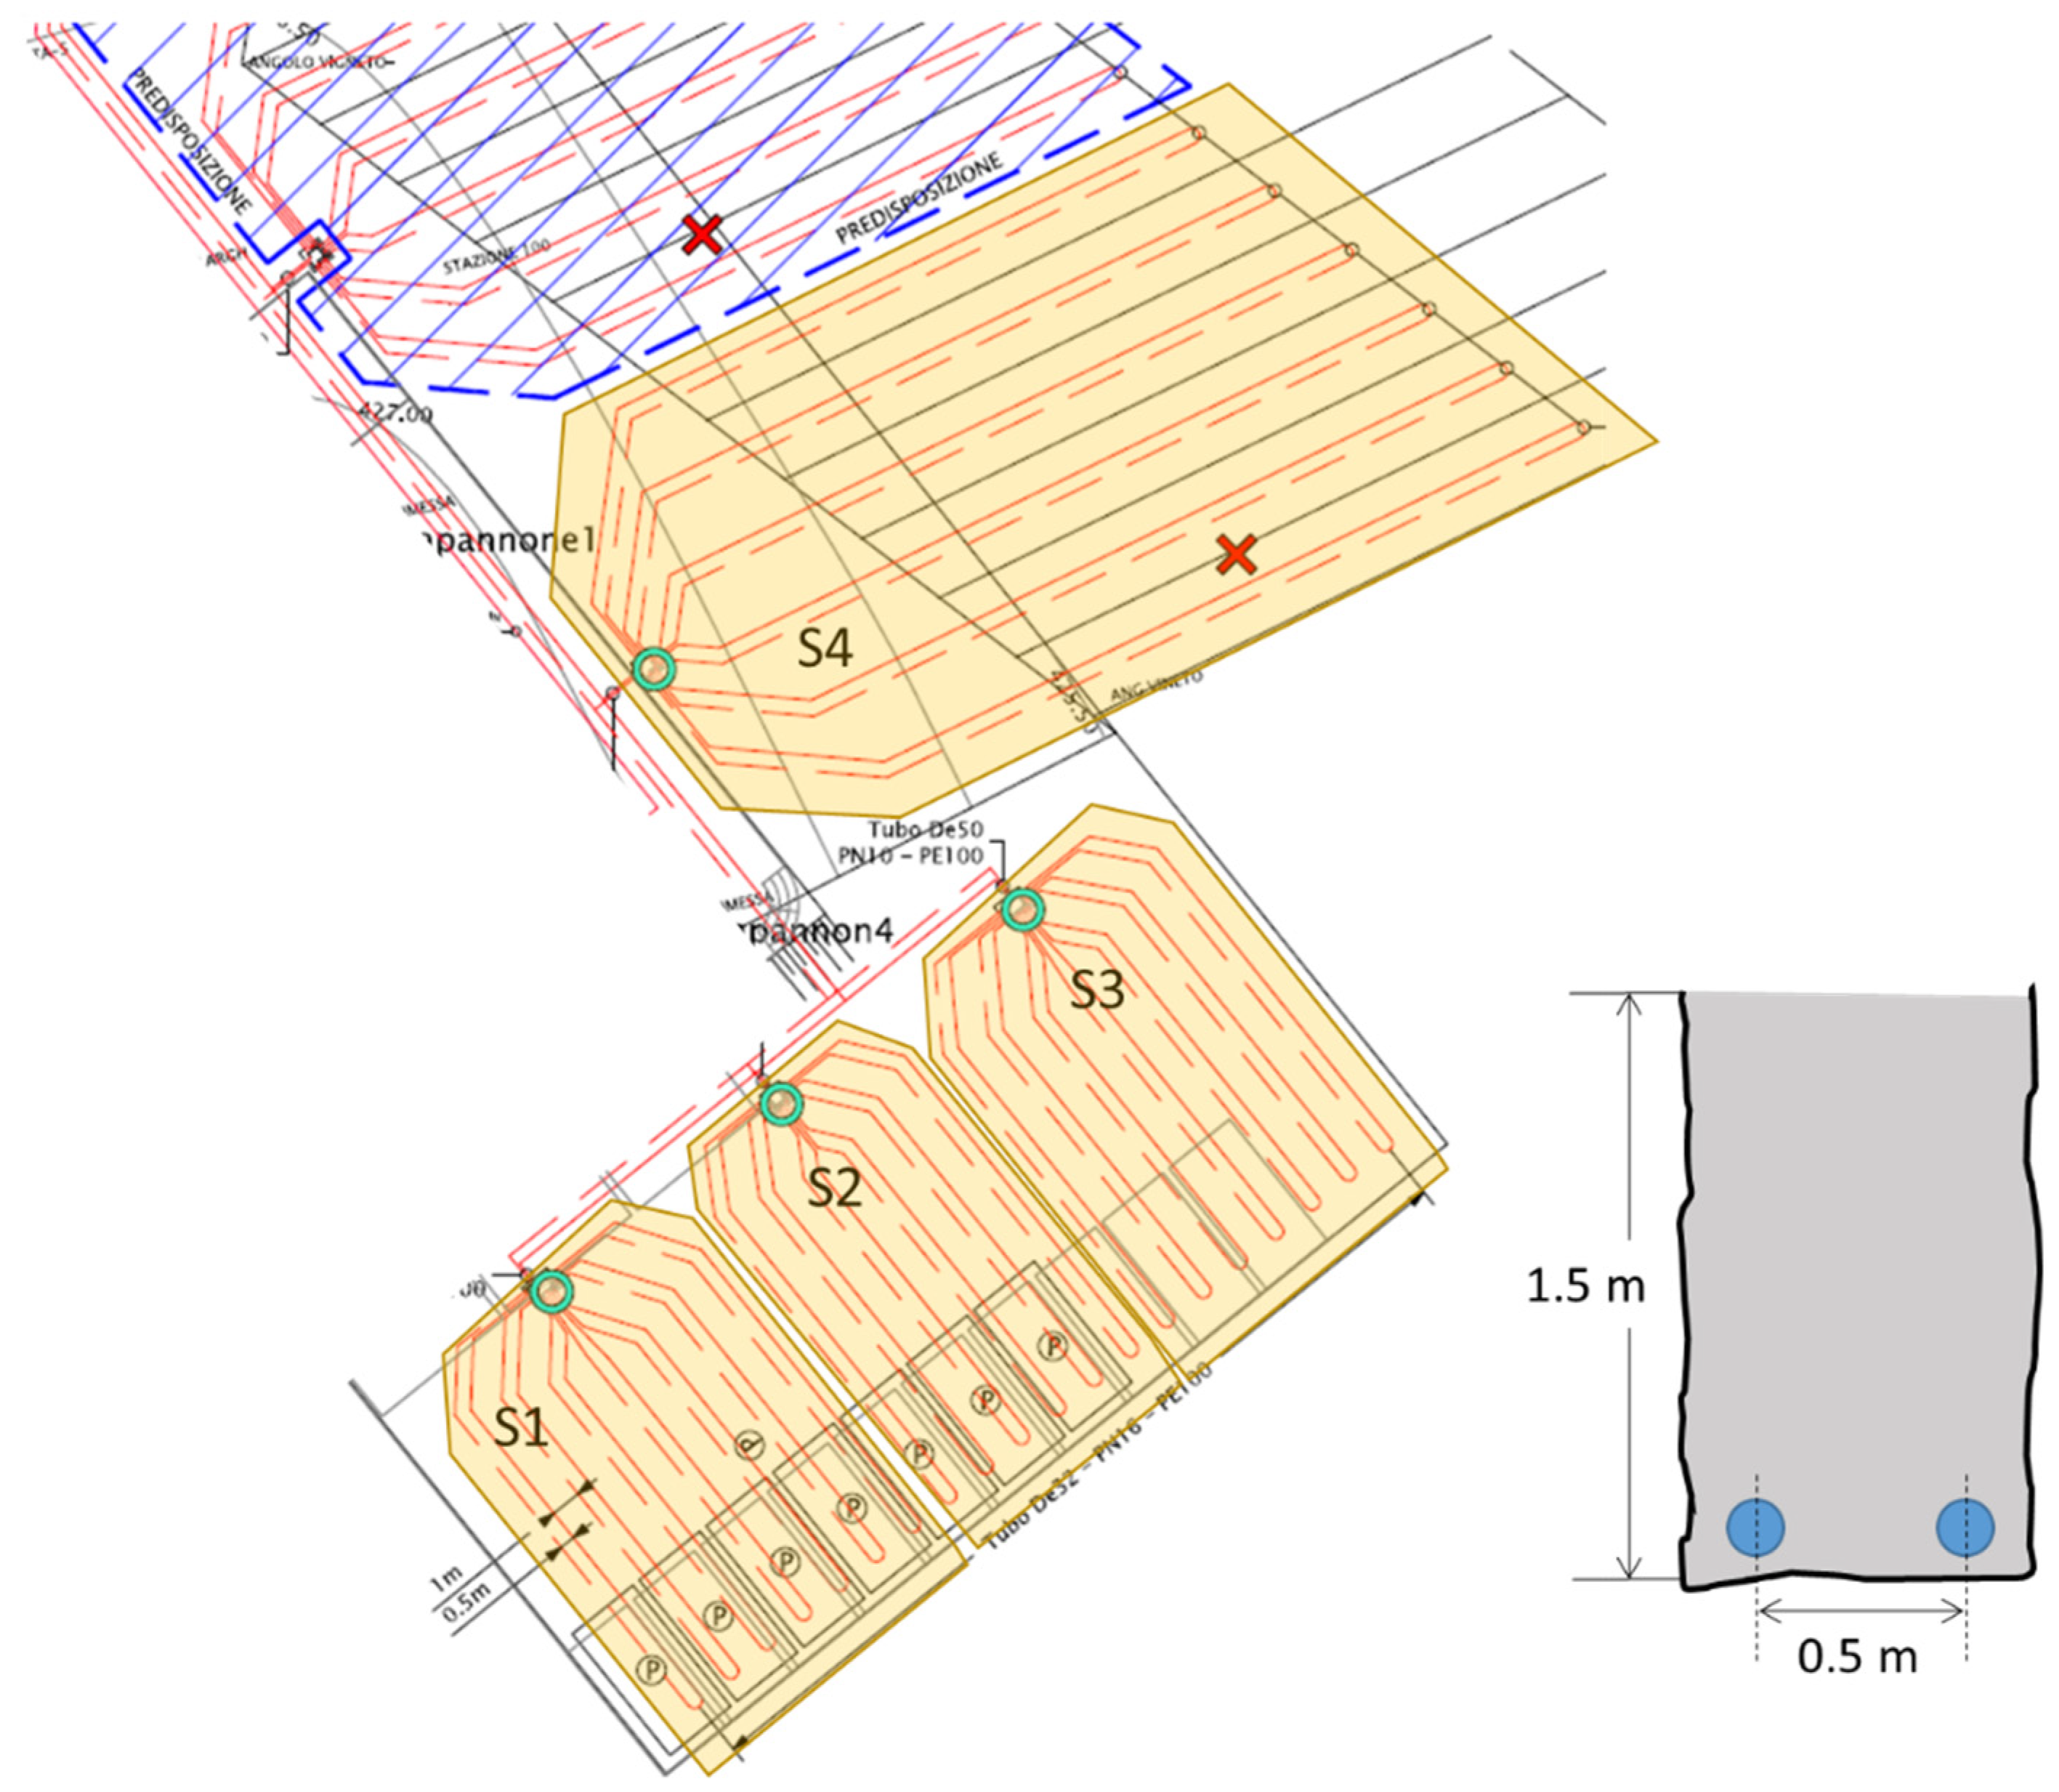
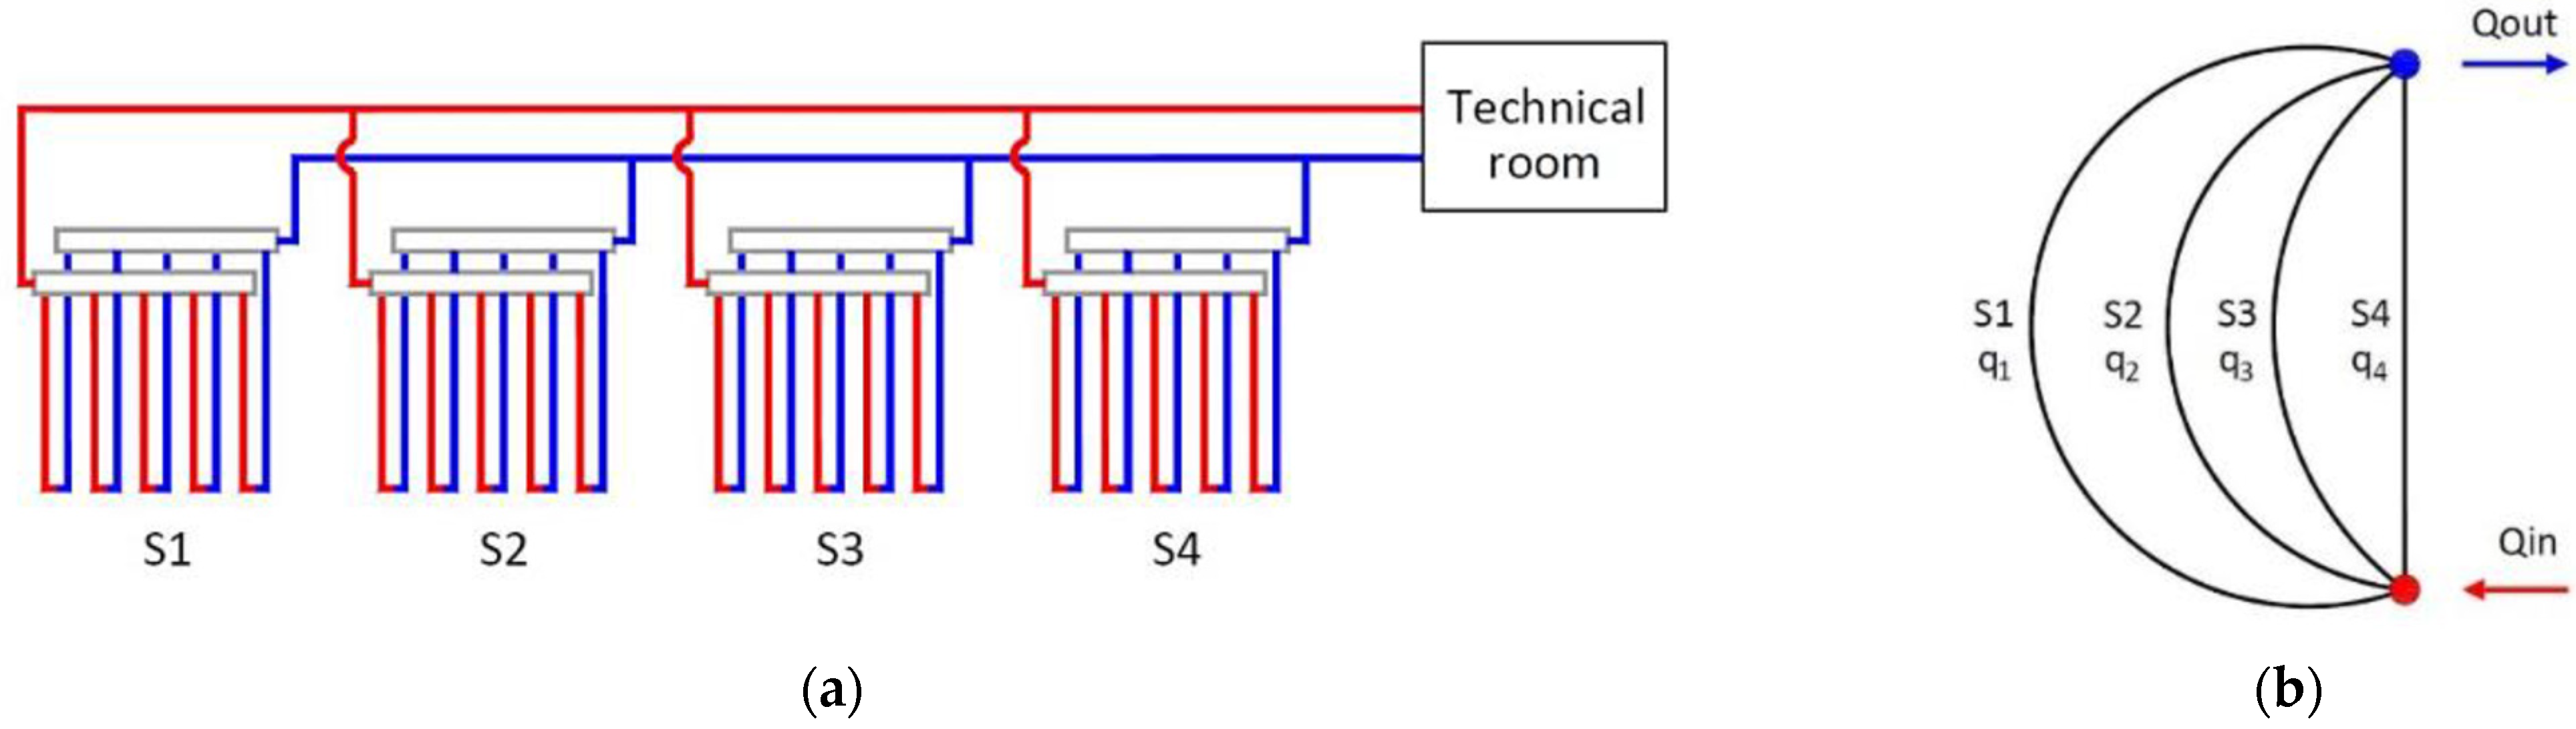
The GSHE plant is a horizontal closed-loop plant composed of four heat exchanger areas (
Figure 3). One of them (S4) has the probes located in trenches located between each line of the vineyard. The other three (S1, S2, and S3) are under a parking area of the farm. The depth of the trenches is about 1.5 m; the original soil was used as a filling material to cover the plant after the installation of the tube lines. The main delivery pipe (DN75, PN10, PE100) supplies four inlet manifolds (DN50, PN10, PE100) connected with the four inlet branches of single-U probes (DN32, PN16, PE100). The outlet branches of the probes are jointed to the outlet manifolds, which take the cooled water back to the vats via the return delivery pipe.
The inlet and outlet manifolds are equipped with a valve for air bleeding and ball valves to isolate the sectors. In addition, the branches connected to the manifolds are equipped with a single ball valve. The heat carrier fluid, water, is circulated by the pump PC1 (rated power 4 kW), and a bypass is present to control the flow rate. The analysis of the pump datasheet highlighted that this is not the best solution for the plant. If the geothermal probes do not dissipate enough heat, pump PC6 (rated power 1.5 kW) is activated and it connects the probes to a chiller through a plate heat exchanger. The chiller (Clivet WRH 362, rated power 47 kW) normally cools lines B and C and is served by an evaporative tower and circulation pump PC5 (1.5 kW).
Table 1 reports the length of each probe in the different sectors; the total length of the four sections is 957.7 m. The distance between the trenches is 1 m. The delivery line from the cellar to the GSHE is 355 m long, with the same length for the return line.
To know the flow rate in the GSHE an ultrasonic flowmeter has been installed. The flow in the single branches of the plant is obtained by a simple hydraulic model. Conservation of the mass flow rate was used in the nodes:
The flow rate in the j-sector was calculated as follows:
where the coefficients a, b, and d are given by the pipe material. The being piping made of HDPE, the experimental parameters of Datei and Marzolo for ‘super-smooth’ tubes were used [
17] (a = 1.8, b = 0.000944, and d = 4.8). The pressure loss coefficients were calculated for each sector, knowing the probe diameter and the flow direction, and supposing that the flow rate in the main nodes is equal to the total flow rate (7.5 m
3/h). Only the friction losses were considered. It was assumed that the hydraulic losses are equal in each section, and the grid is verified when the total inlet flow rate (node N
in) is equal to the total outlet flow rate (node N
out).
3. Results
The results were divided into the preliminary analysis needed to determine the basic parameters for the model calculation, and the analysis of the plant.
3.1. Survey and Analysis of the Geothermal System
3.1.1. Ground Temperature
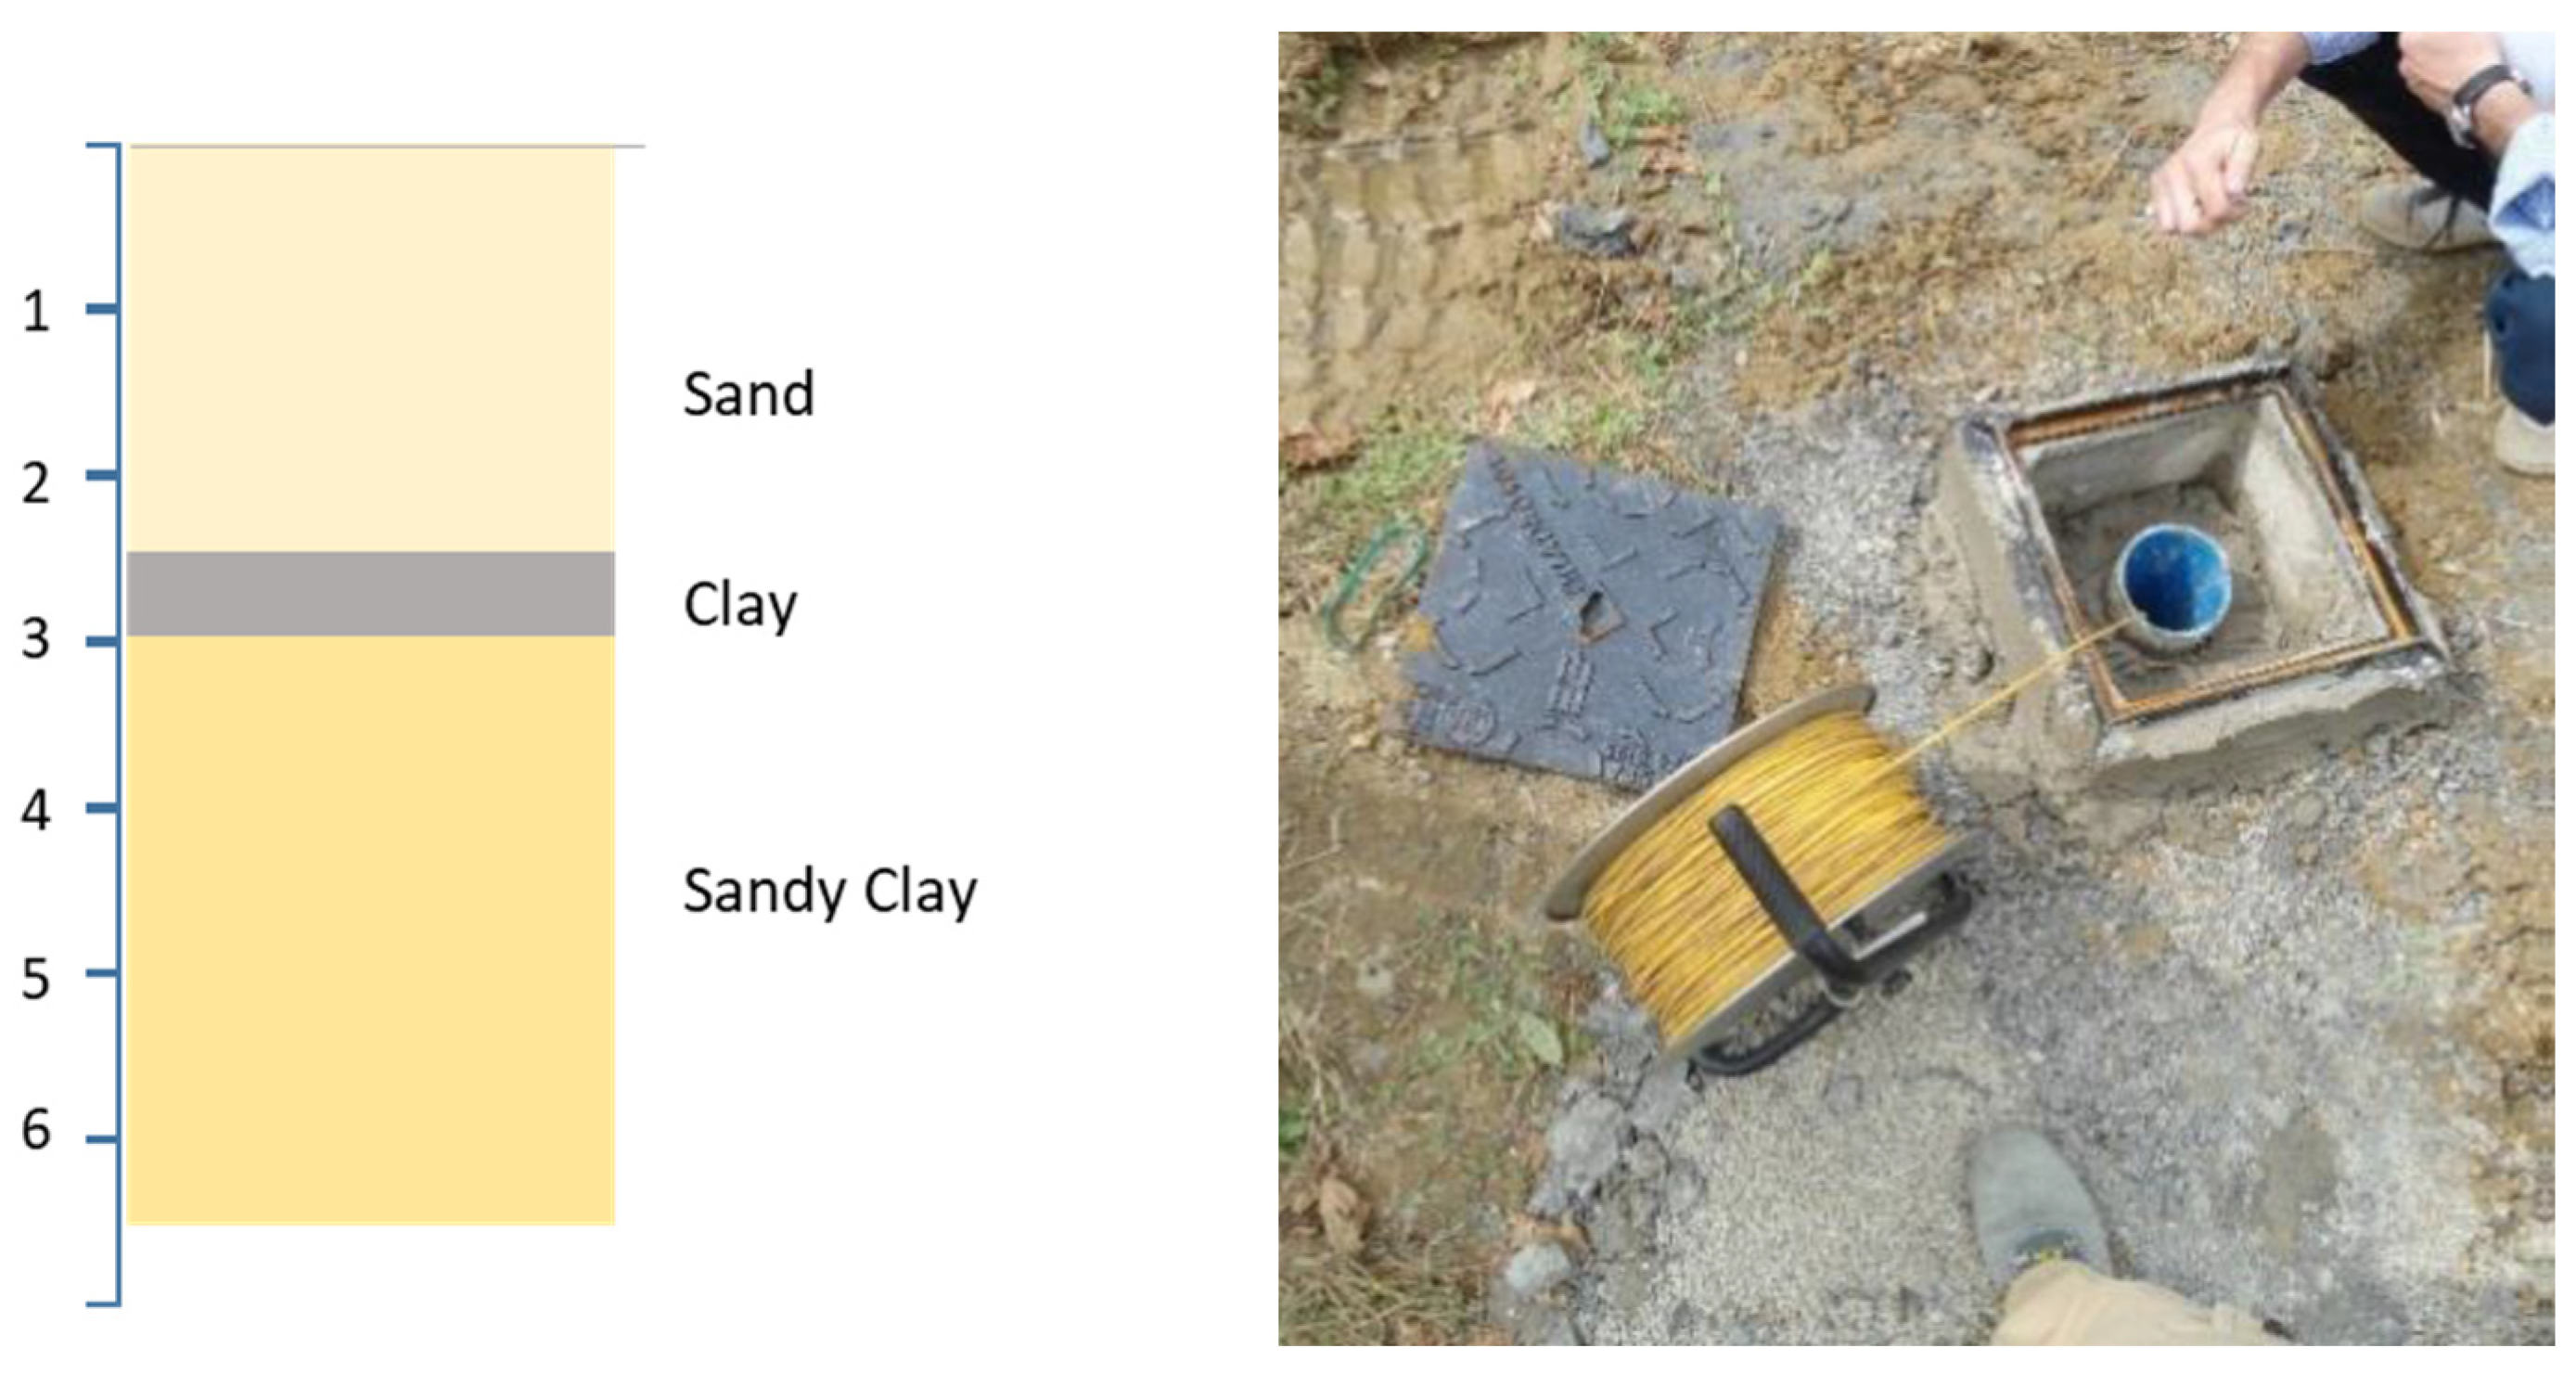
To have a reference in ground temperature, two wells with a depth of 5 m and a diameter of 180 mm were constructed. The stratigraphy of the ground was reconstructed, and temperature profiles were evaluated in two different seasons, July and September. Both of the wells are dry. The first 2.5 m of the ground is formed by sand, with a very low silty fraction. This is followed by a clay layer of 0.5 m, and below a dark sandy clay down to the bottom of the well (
Figure 4).
The reference ground temperature for the GSHE model was fixed under the hypothesis of a project temperature equal to the average ground temperature during the entire winemaking process (22 days starting from the end of September). The selected value was 16.5 °C, which is the ground temperature measured in September and October (15–18 °C).
Table 2 reports the measurements of the ground temperature in the two surveys.
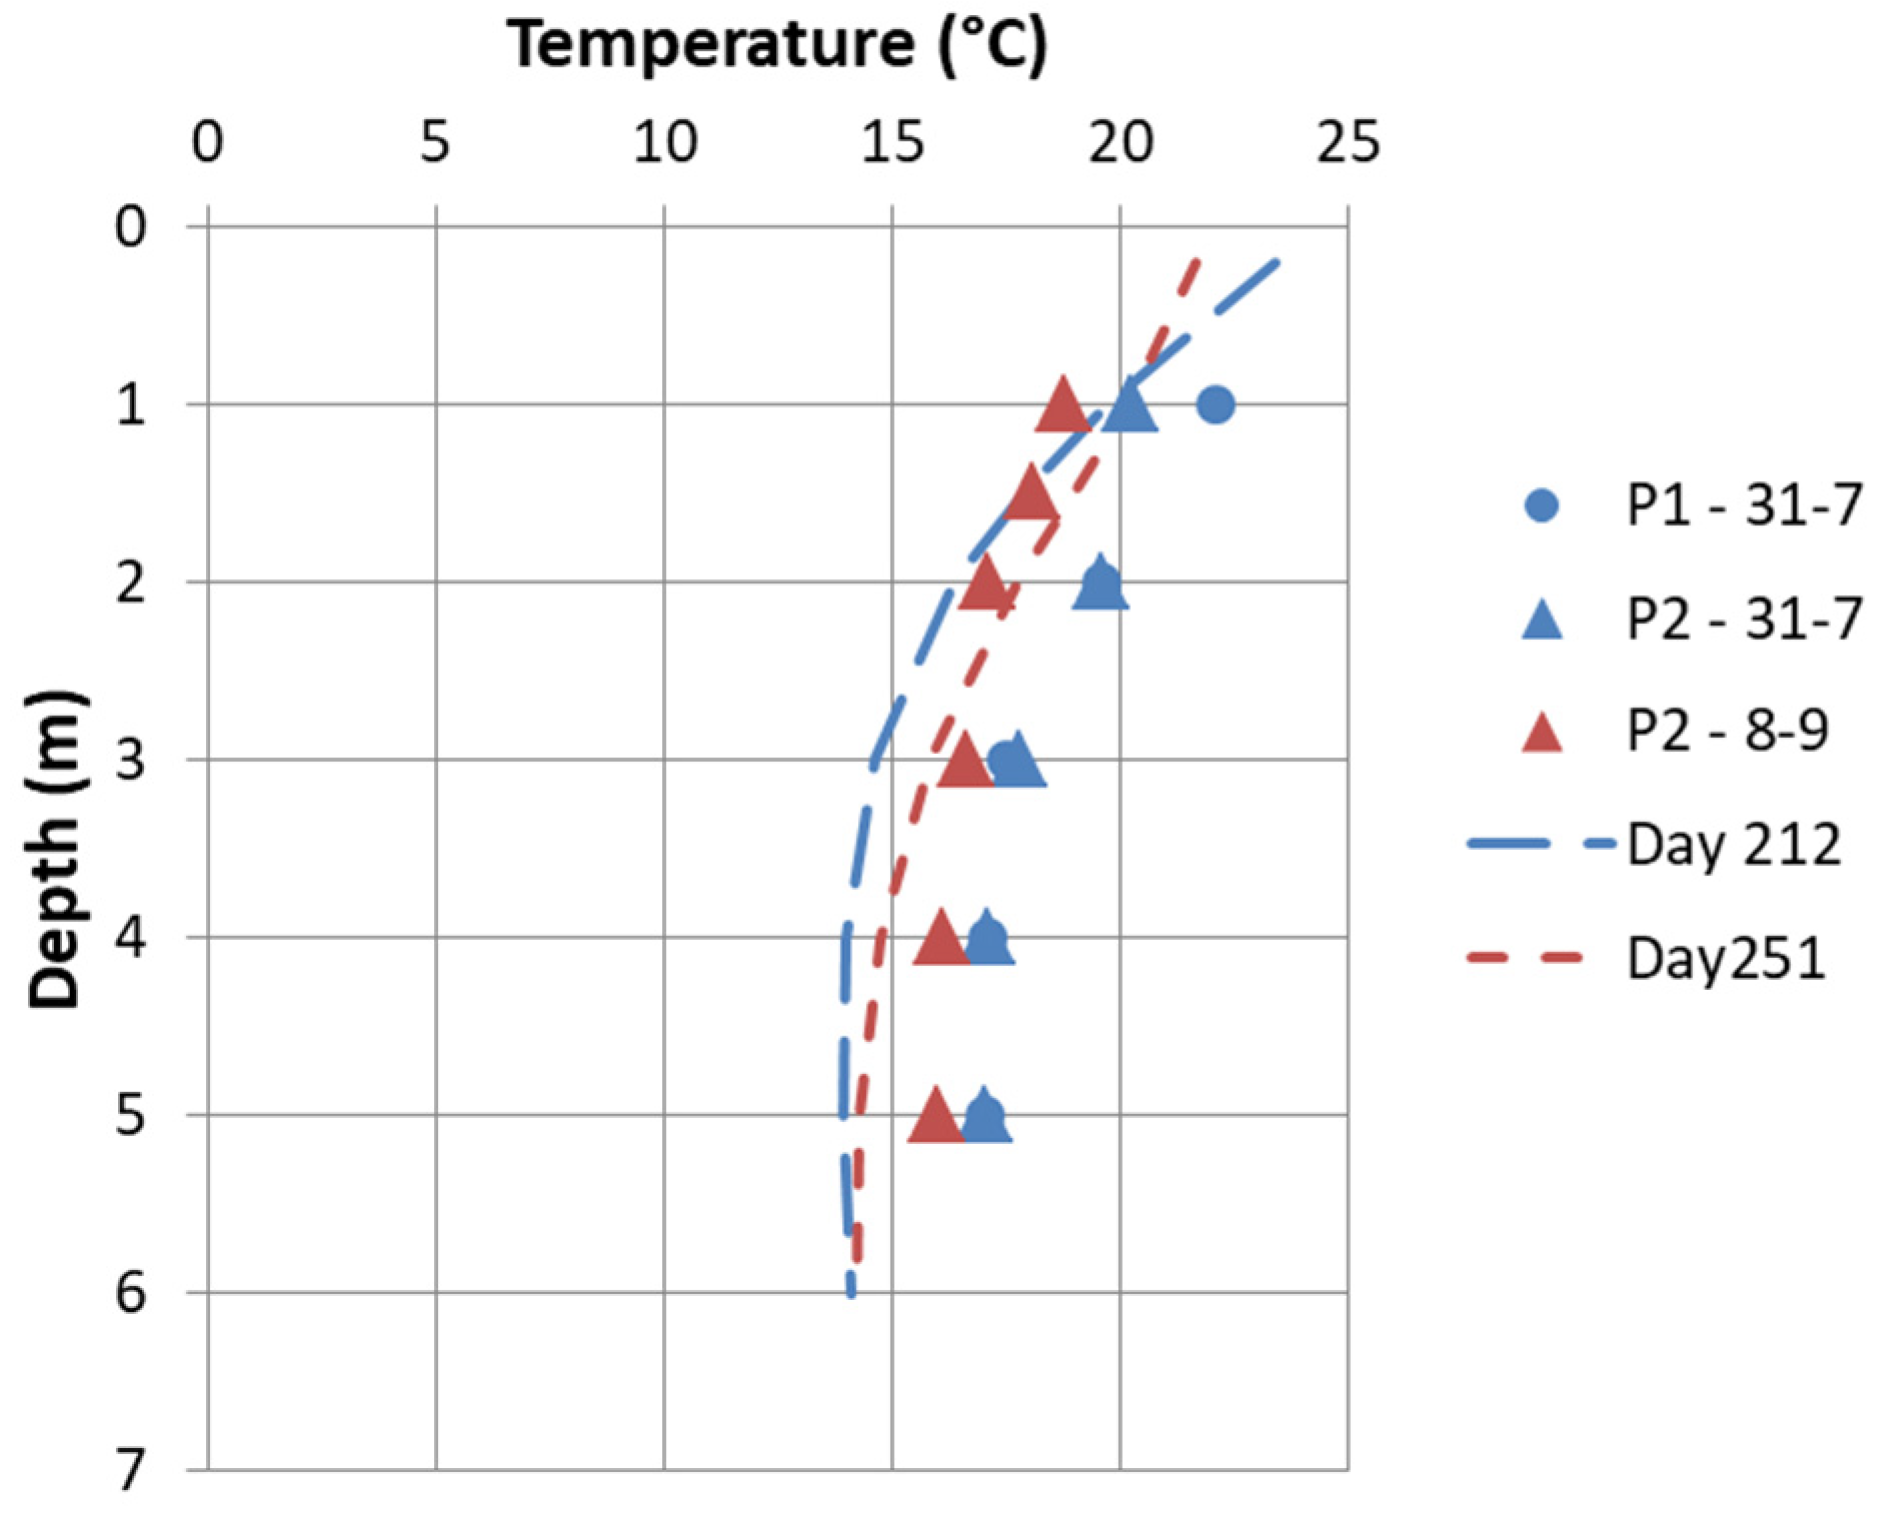
A first evaluation was made comparing the measured temperatures with the profile obtained, using the underground temperature equation [
18]:
From daily values (Montepulciano weather station), the annual average external temperature was 14.5 °C, the temperature wave amplitude was 8.2 °C, and the day of minimum temperature was the 29th.
Figure 5 shows the calculated profiles, using the thermal diffusivity estimated with the TRT, with the measured data. From the comparison, it is clear that measurements were affected by the external temperature, especially in July, when the temperature was high.
3.1.2. Thermal Response Test (TRT)
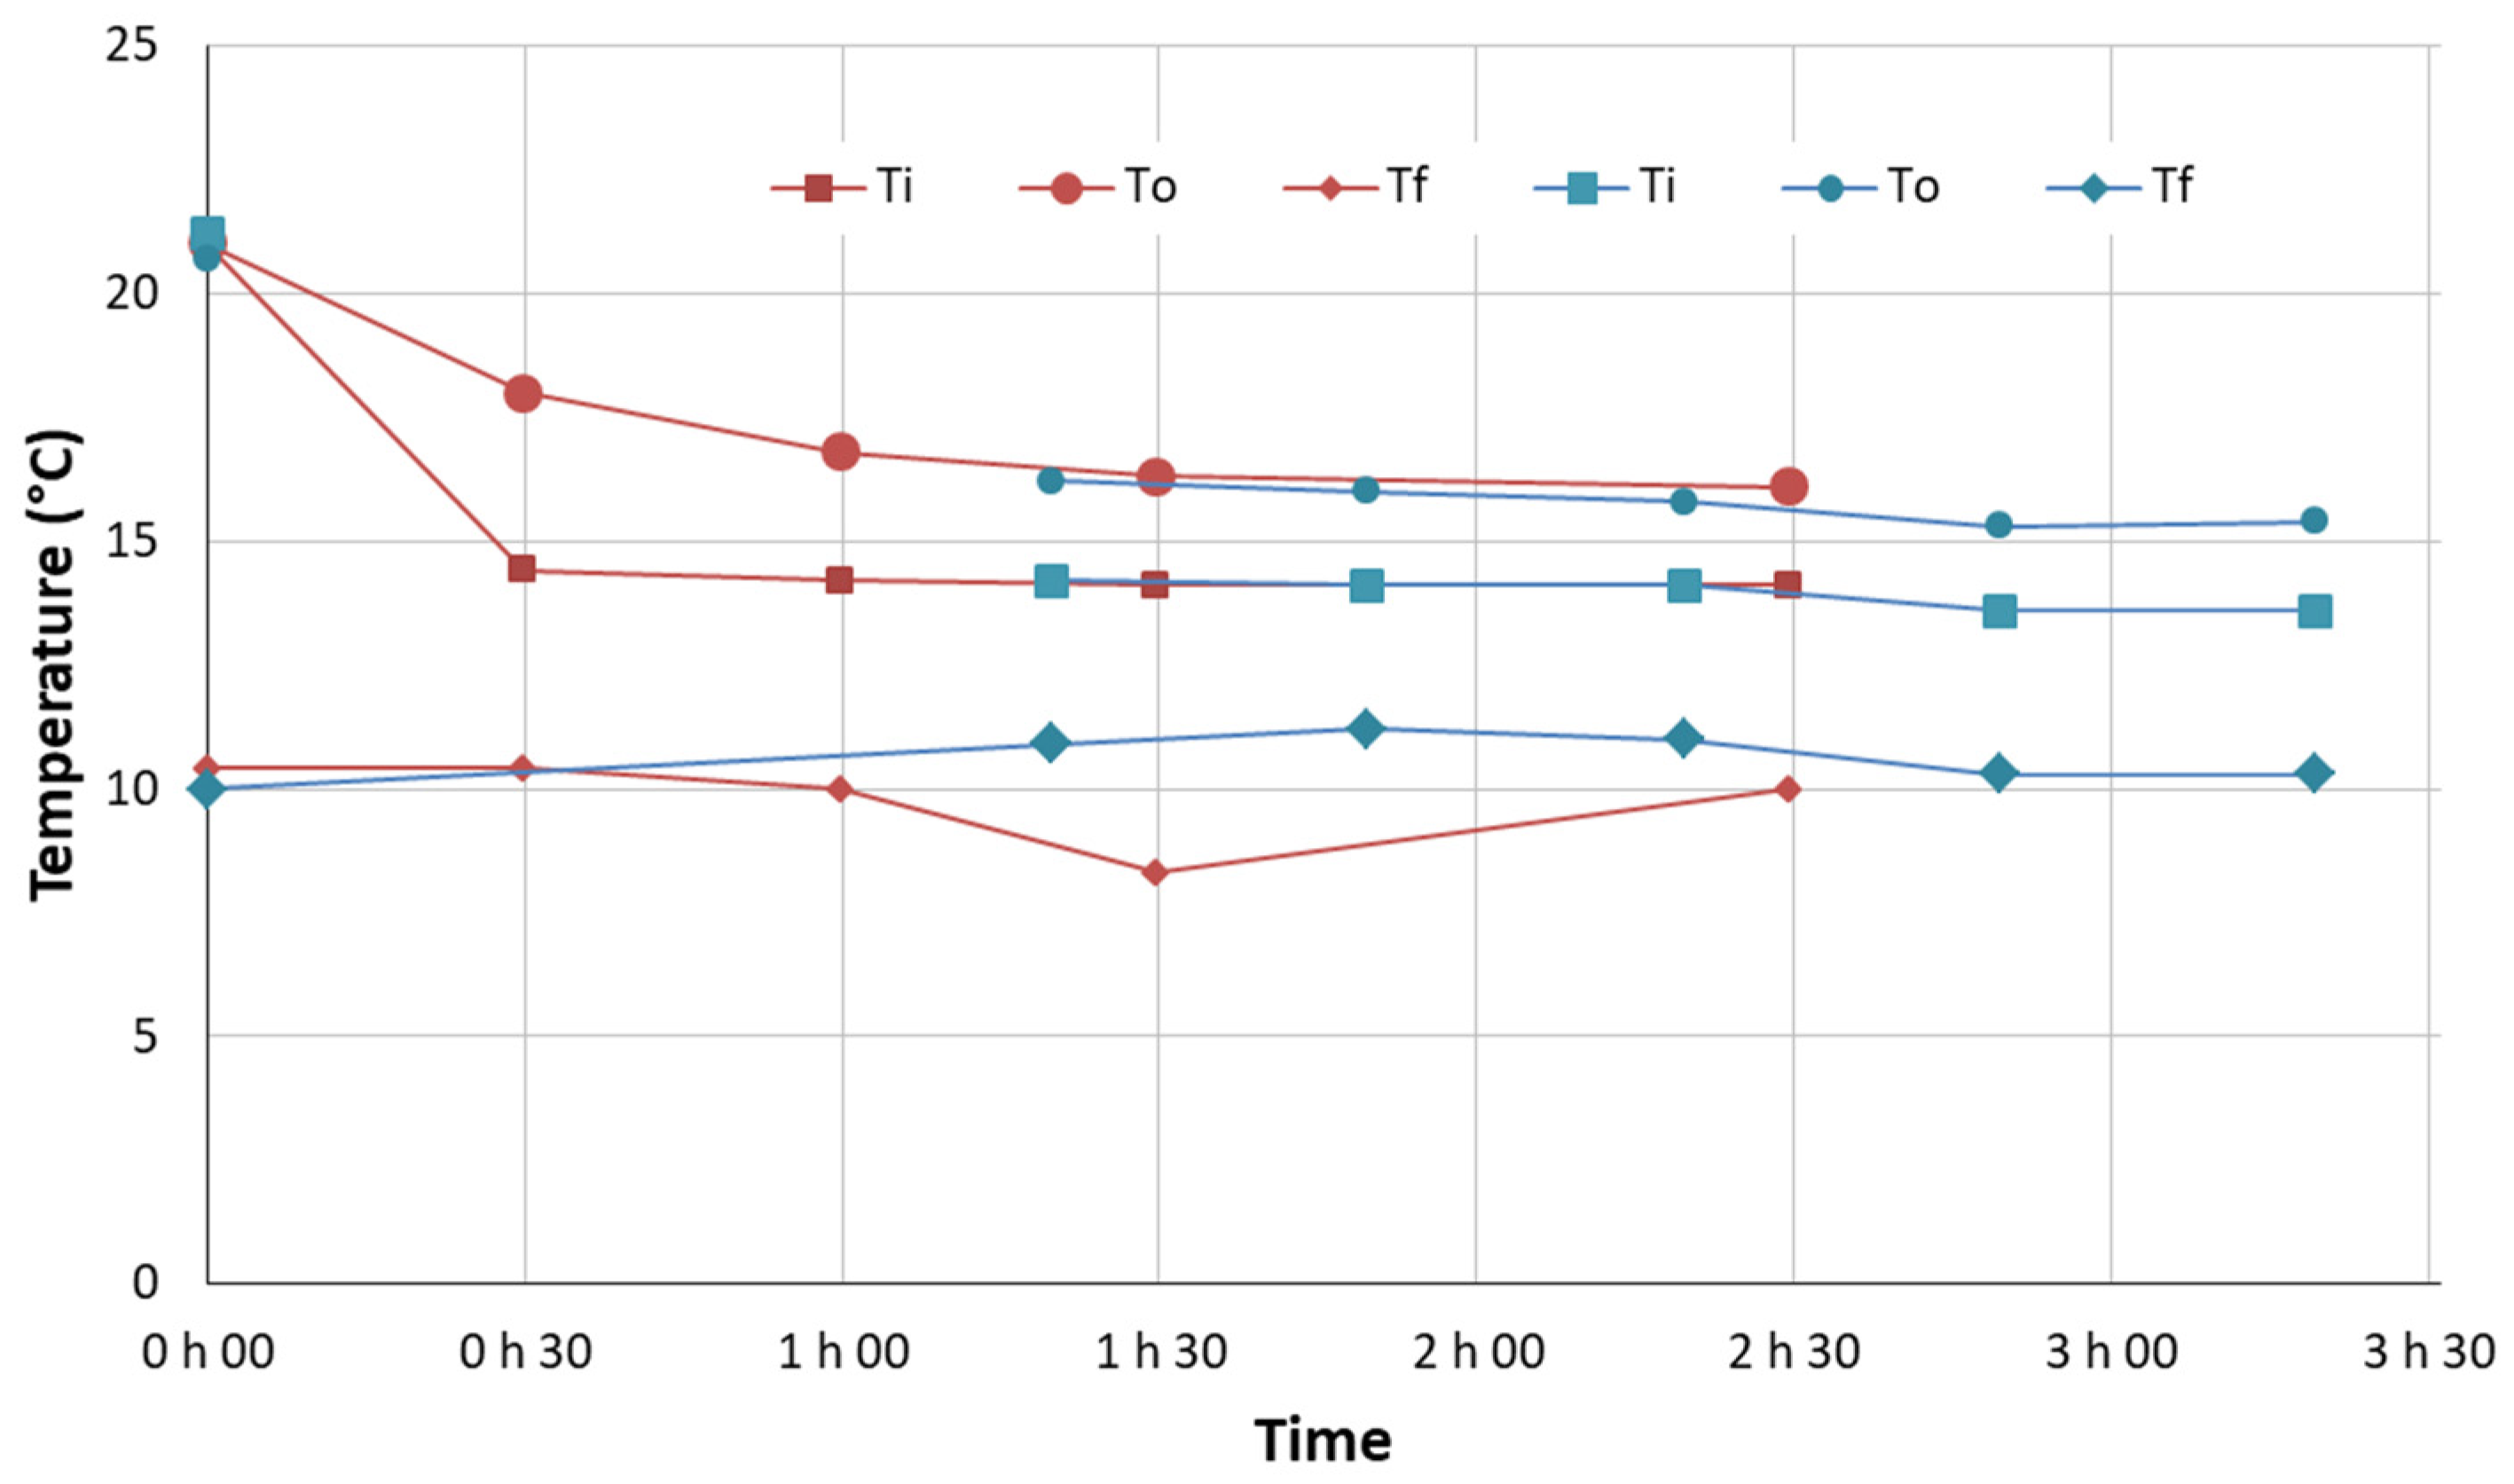
To evaluate the potential of the plant in heating mode, two thermal response tests were carried out, measuring the temperature of the cooling line Tf, the inlet, and the outlet temperature of the geothermal plant (Ti, To).
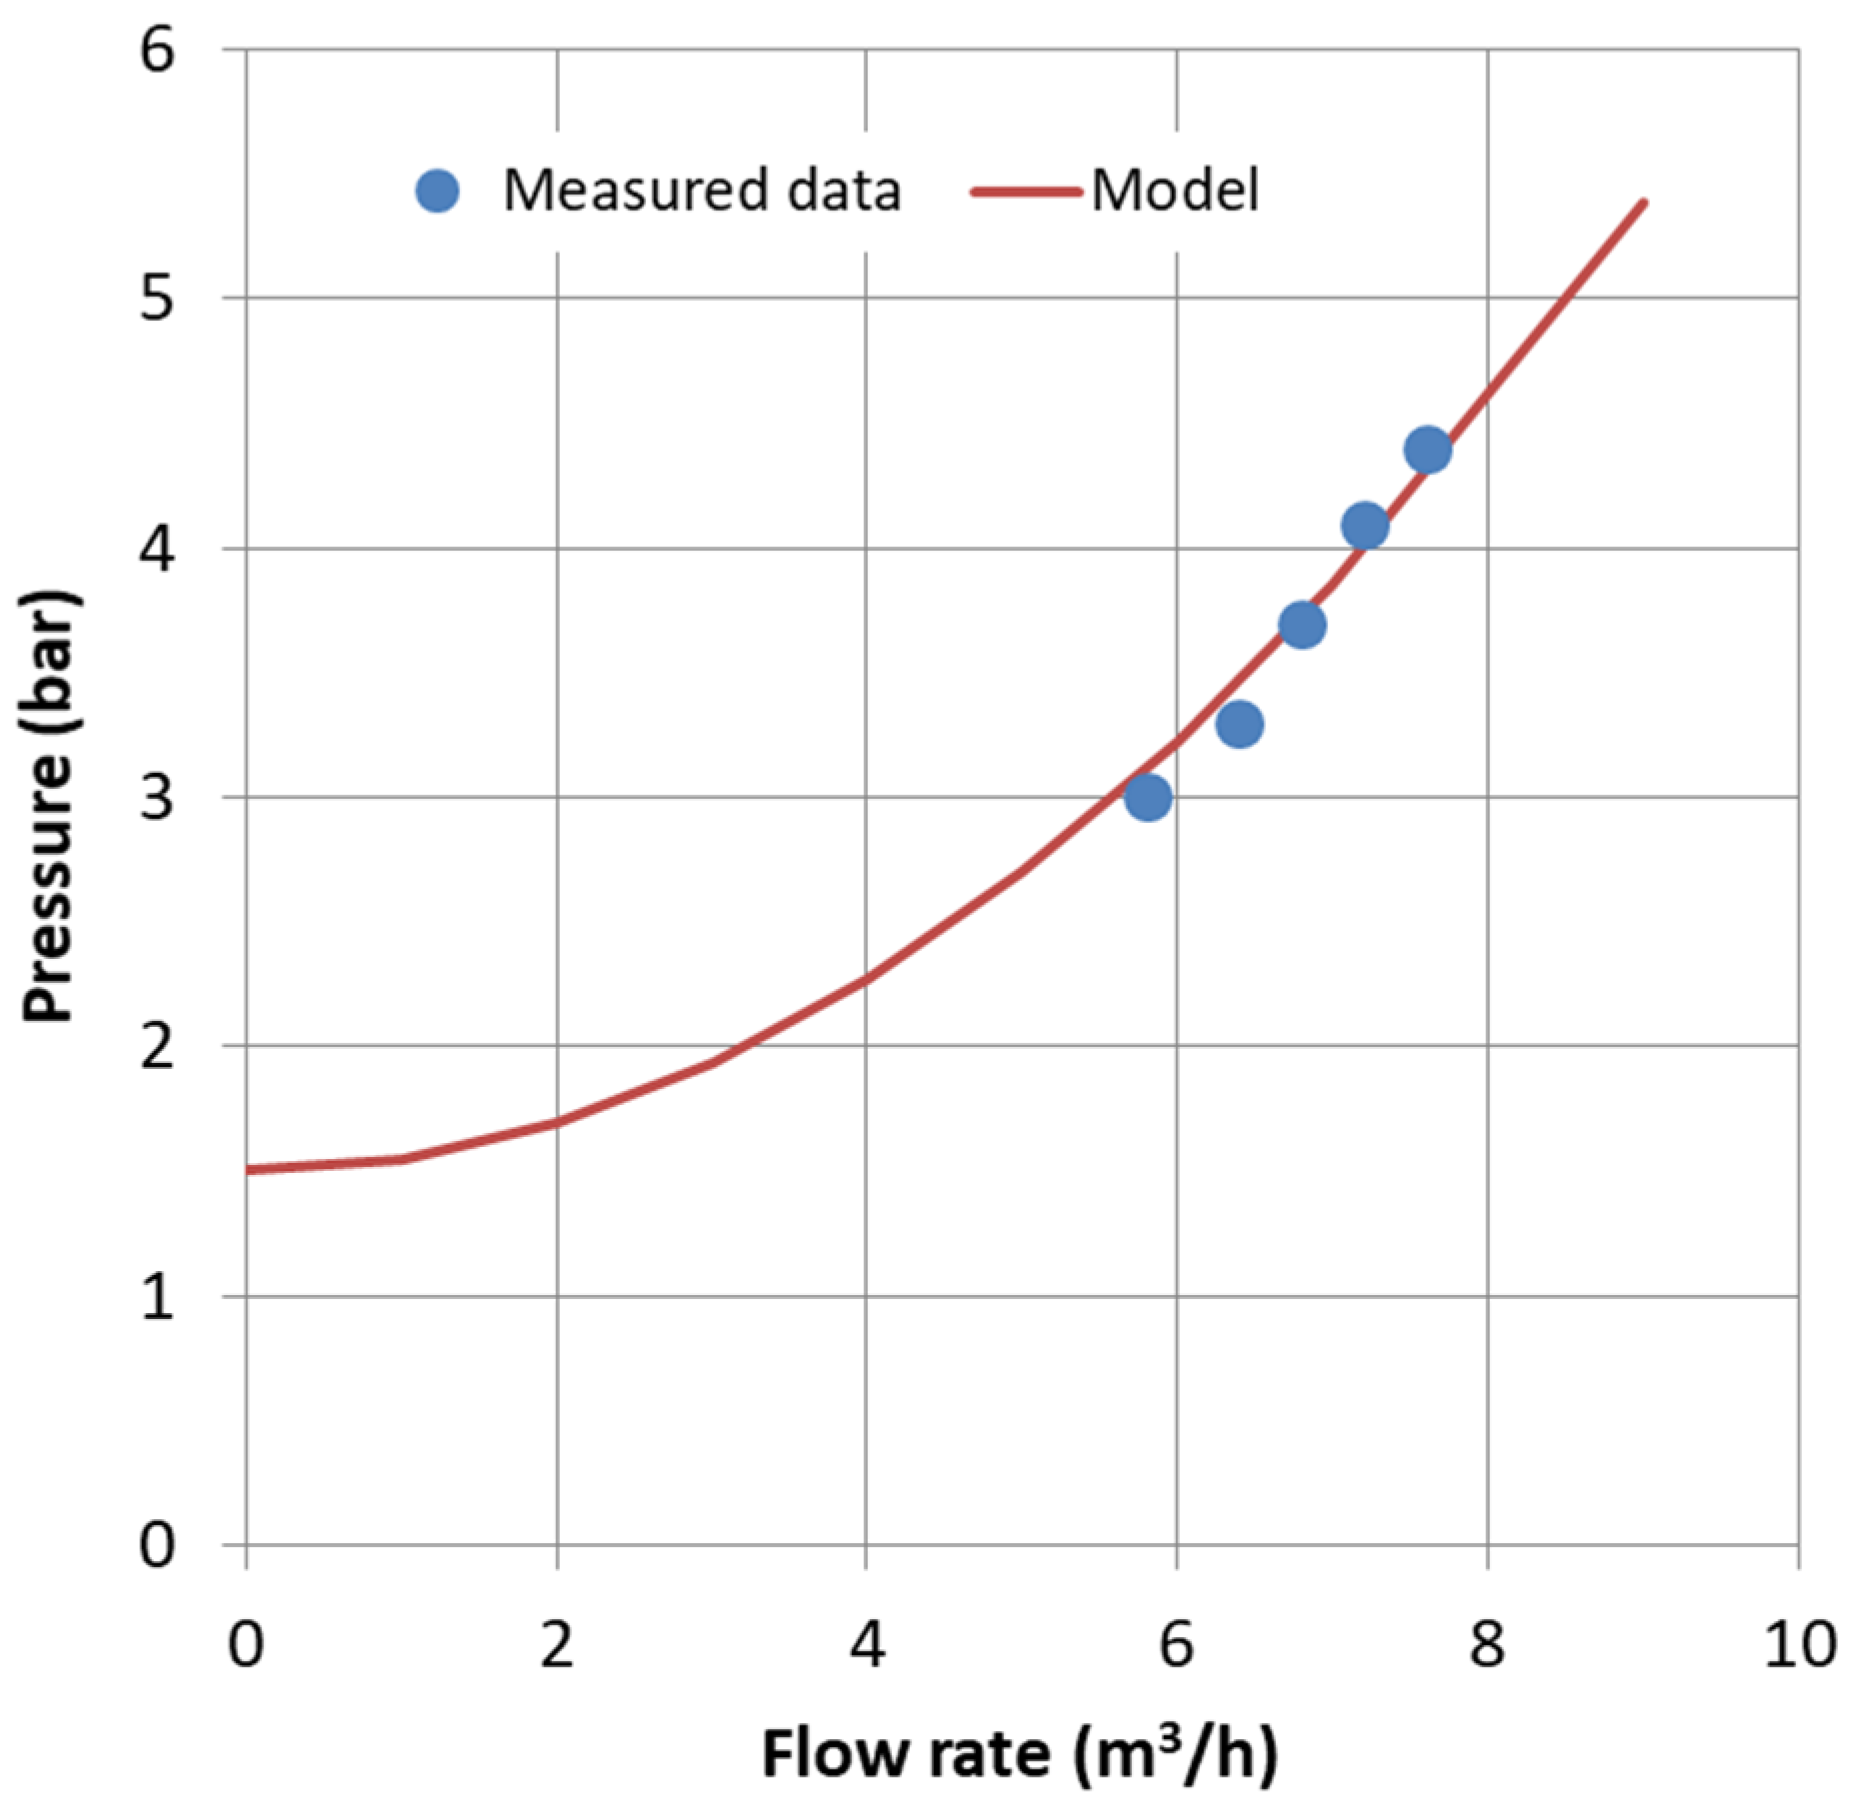
Before starting the TRT, a verification of the flow rate of the pump was carried out. Simultaneous measurements of pressure and flow rate allowed obtaining the plant curve and to fit the model (
Figure 6).
The flow rate was set at 7.5 m
3/h, and the inlet pressure was 4 bar. The pressure measured on the inlet branch was 3.6 bar. The temperature values obtained during the two tests are reported in
Figure 7, the values were very similar in the two tests. The test was performed in the cooling mode, using the chiller that feeds the heat exchanger at 10 °C. The working fluid leaving the technical room had a temperature, slightly decreasing over time, around 14 °C. After the GSHE, the temperature of the working fluid was higher, with a clear attenuation over time, and reaching a quasi-constant temperature of 15.5 °C after about two hours. The heat power exchanged in the steady condition was about 17 kW, with a specific power of 11.7 W/m.
The temperature in the manifolds was measured at the end of the test, to verify the inlet and outlet temperature for every branch of the plant (
Table 3 and
Table 4). The measurements confirmed the inlet and outlet temperatures and highlighted the contribution to the heat exchange of the main delivery pipes.
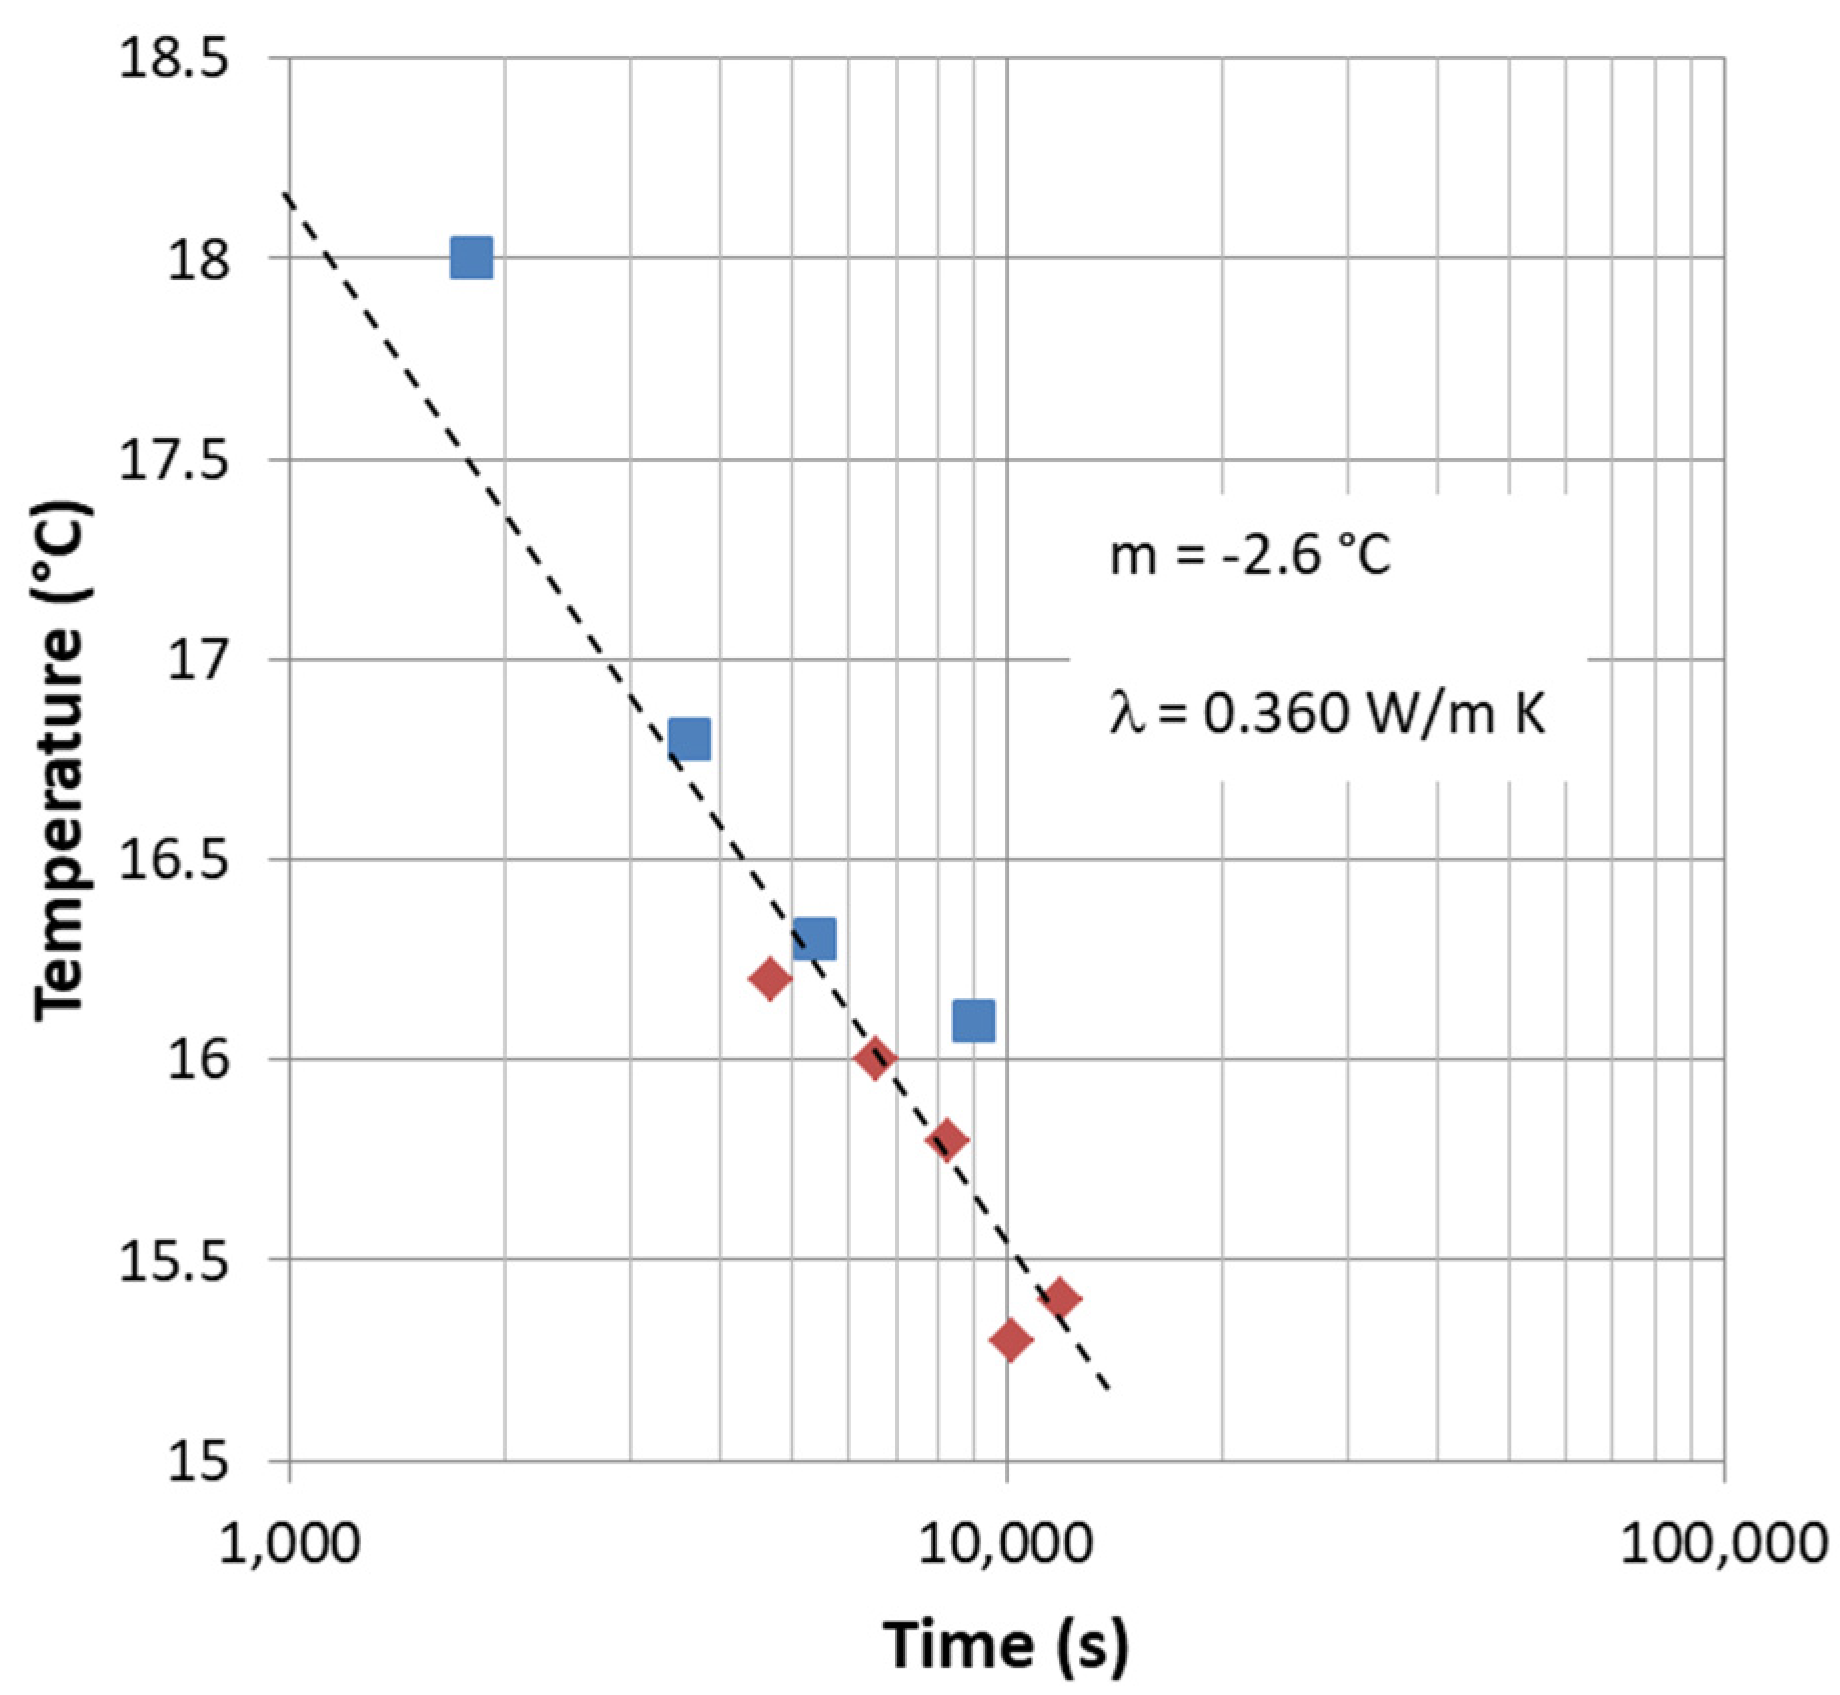
An analysis of the measured data was also conducted to obtain an evaluation of the thermal conductivity. From the analysis of the data reported in the semilog plot of temperatures vs. time, the slope of the interpolation line was −2.6 °C and the thermal conductivity was 0.360 W/m K (
Figure 8). Using this value in the model of temperature attenuation, the curves reported in
Figure 5 were calculated and compared to the measured values.
3.1.3. Monitoring during the Vinification Process
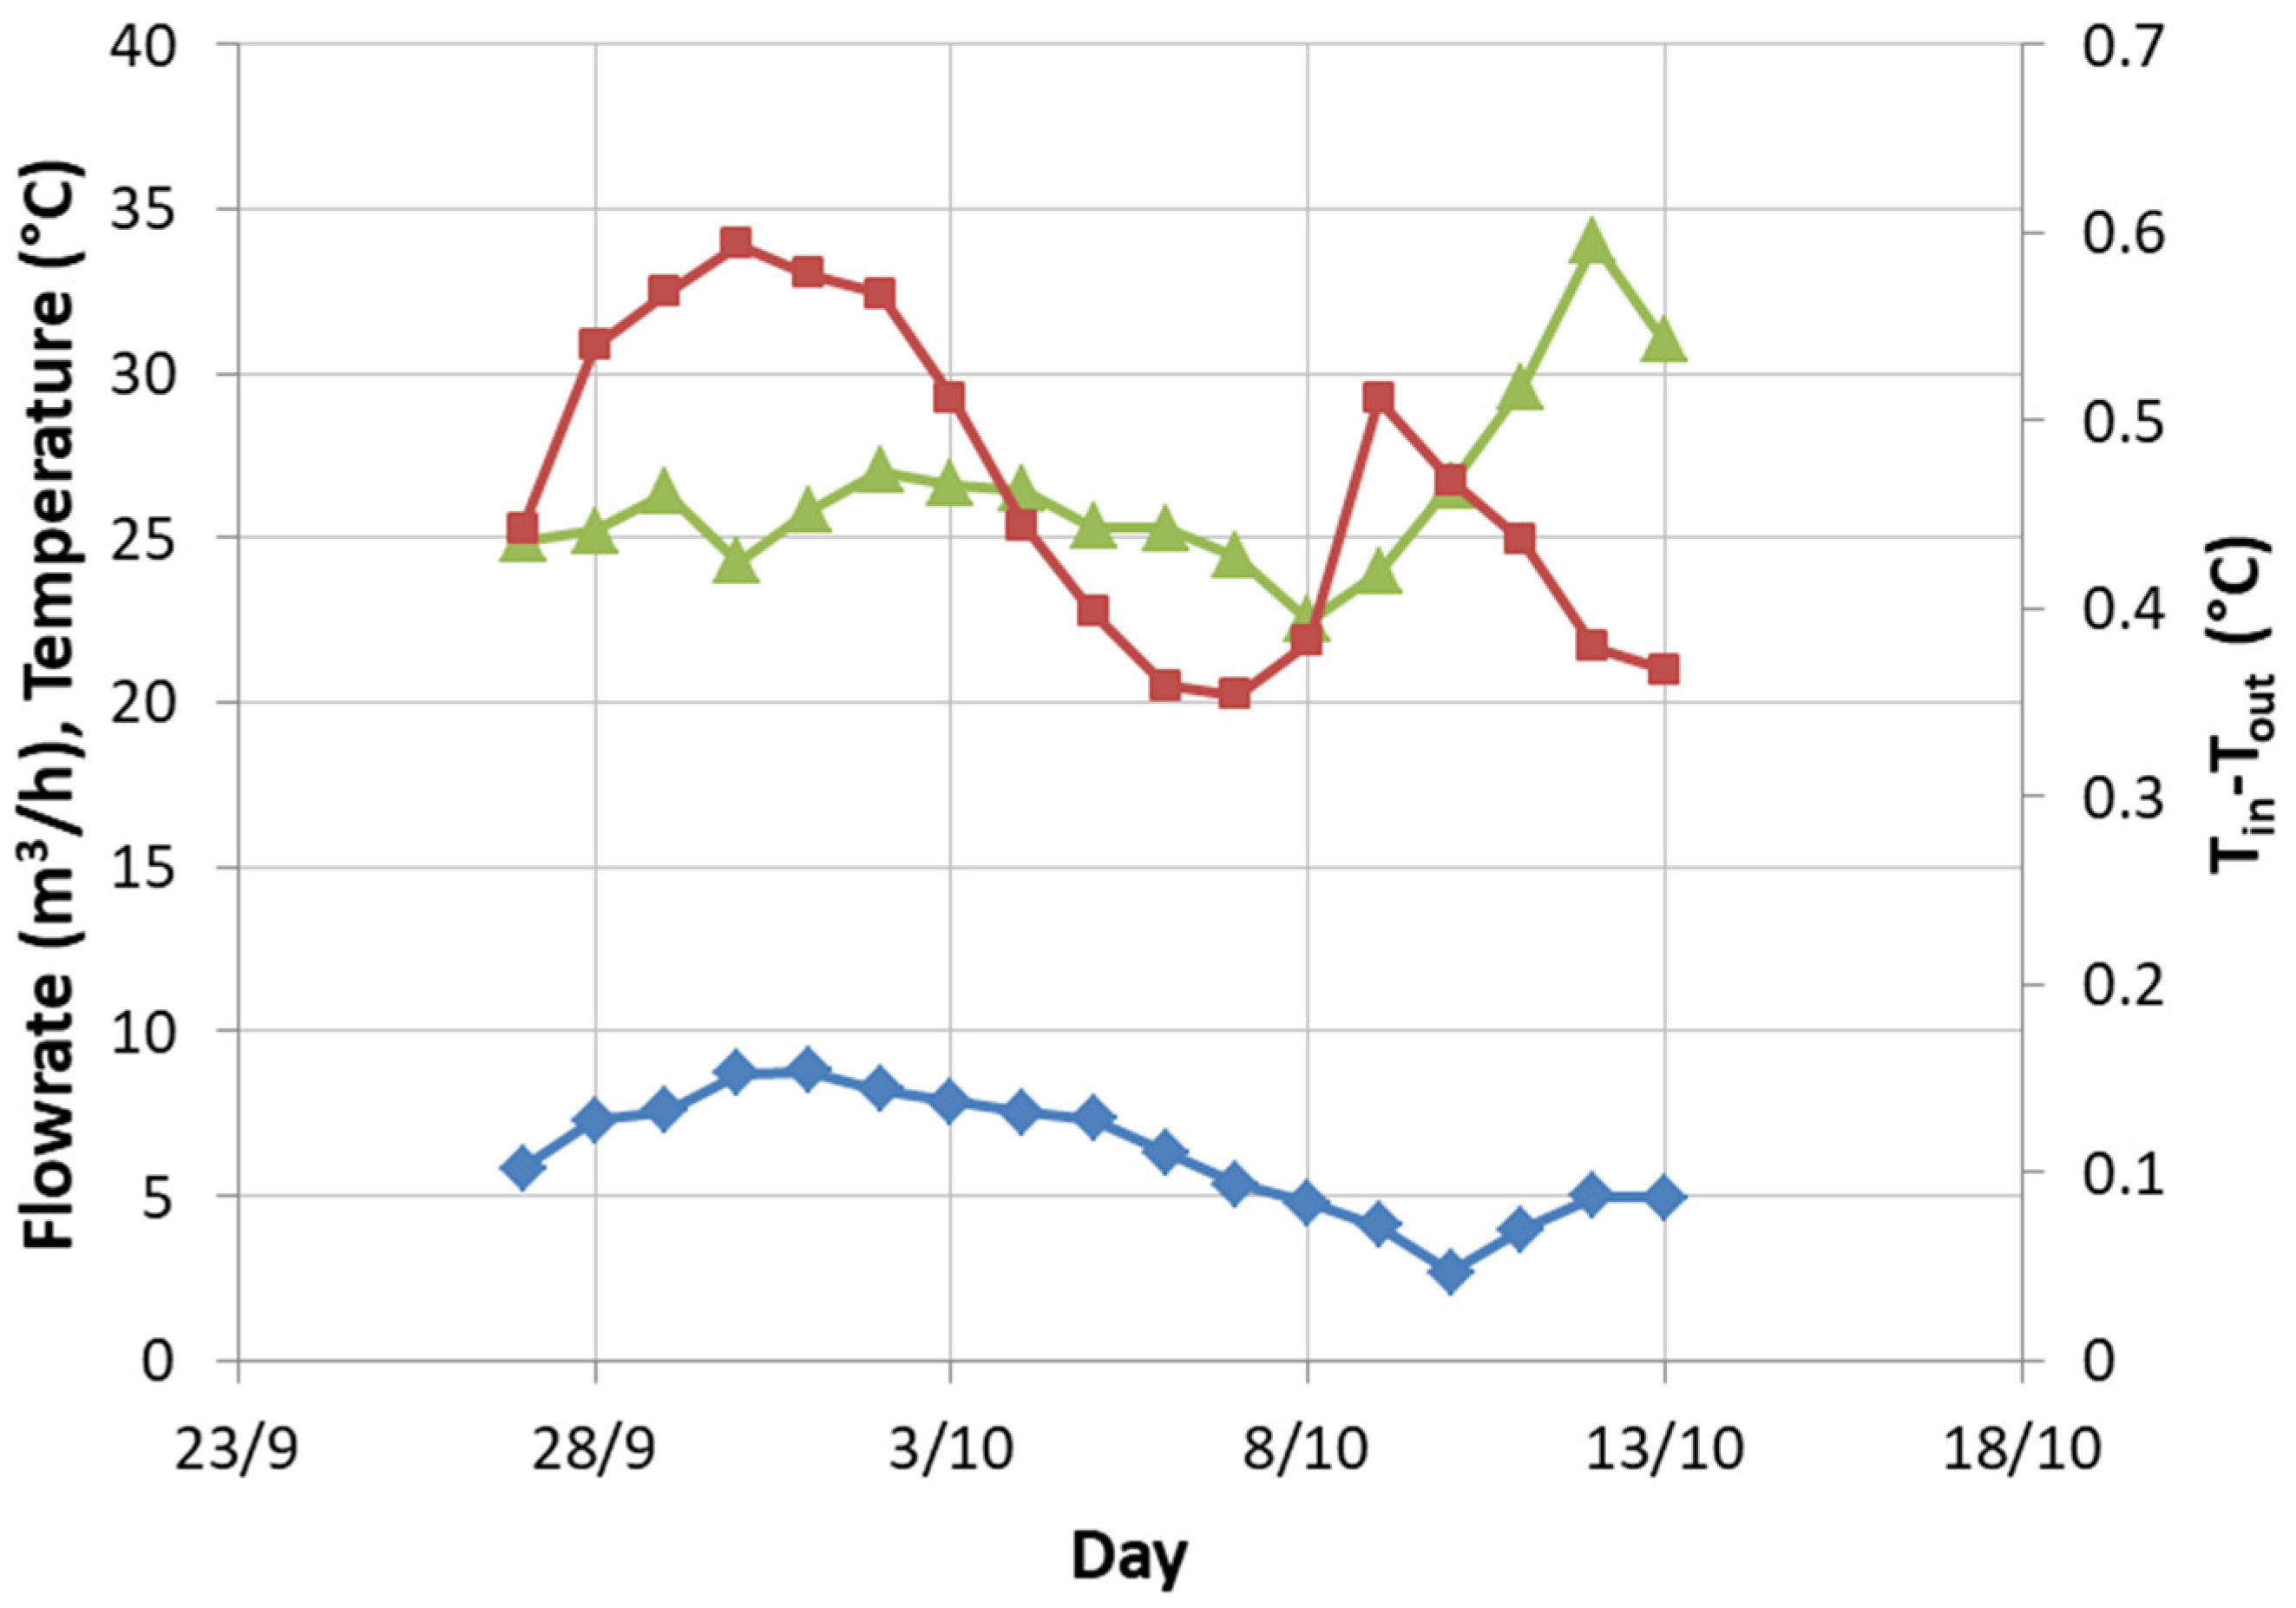
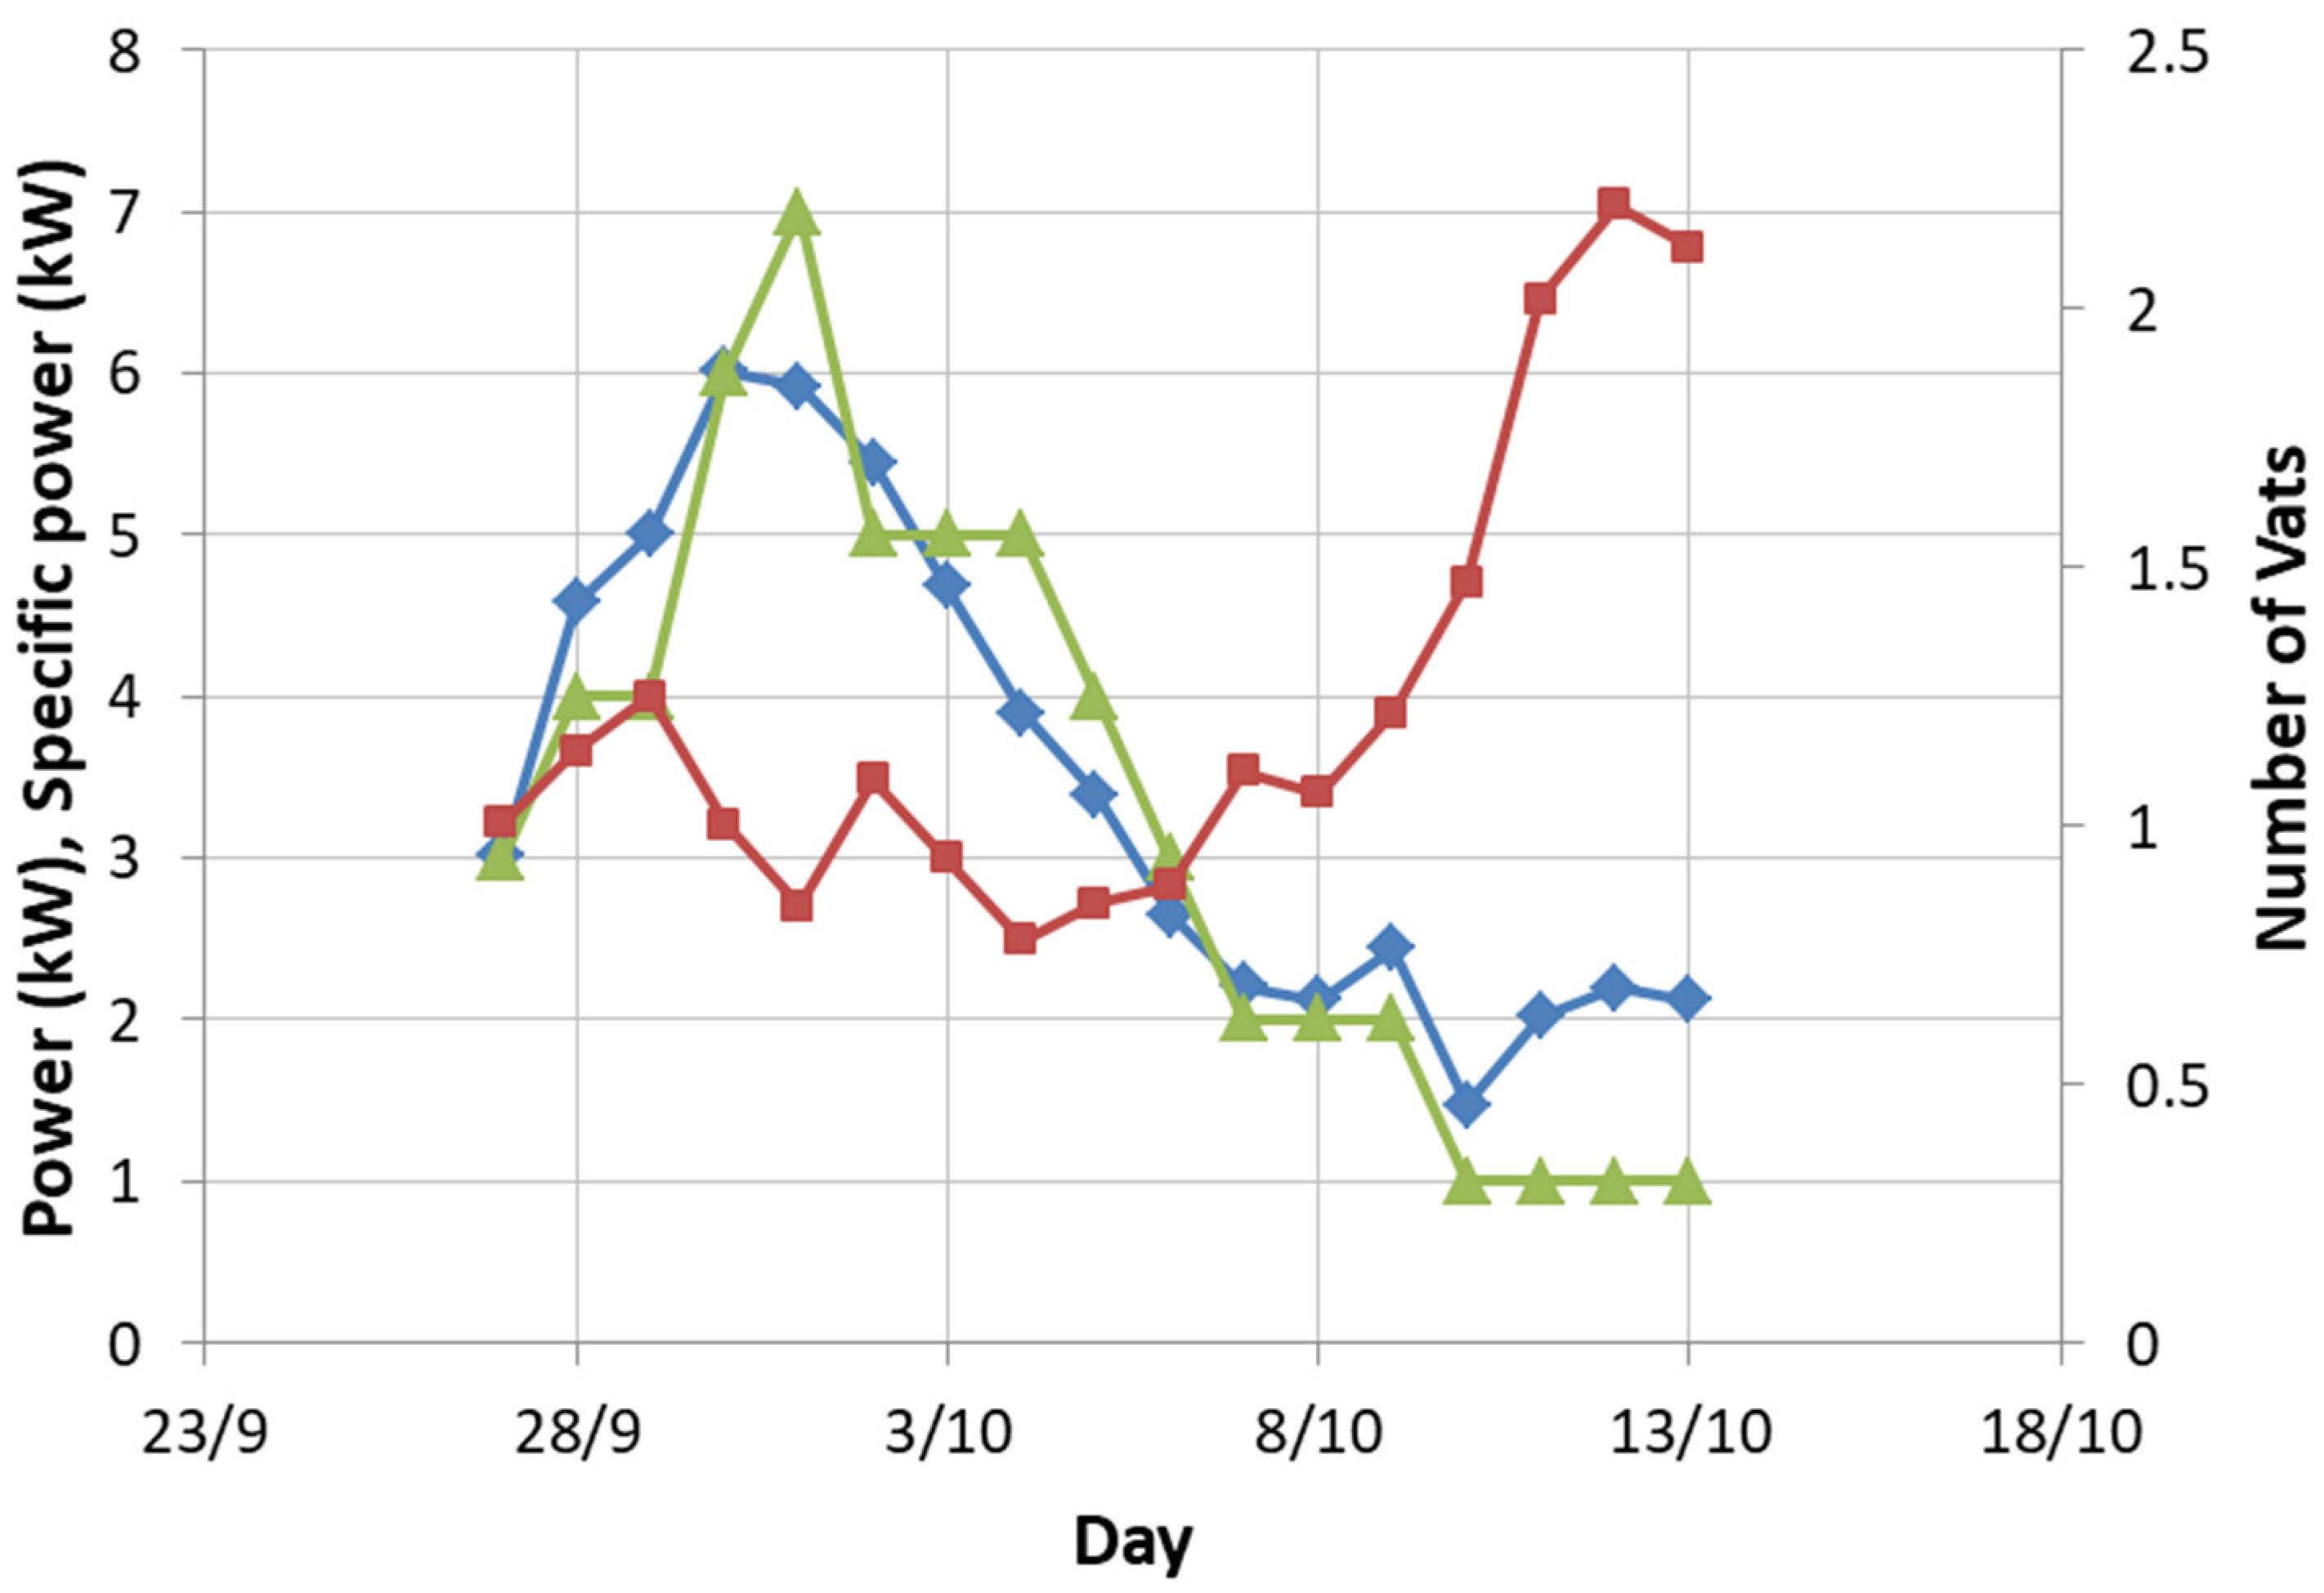
During the vinification period, when the vats are full of fermenting grape must, a lot of parameters were measured (
Figure 9 and
Figure 10). The delivery water temperature to the GSHE probes (comparable to the outlet temperature of line A), the outlet temperature from the GSHE probes (before the chiller), and the flow rate of water circulating in the plant were registered. The data were acquired every 10 s, and the presented values are the daily average values.
The analysis of the data highlighted that, with a temperature difference of 0.46 °C between the inlet and outlet water to the GSHE, the dispersed power was about 1 kW per vat, and the temperature of the vats was around 26 °C. In the last part of the process, the dispersed thermal power was 2 kW and a higher temperature (34 °C) was observed. The peak thermal power was 6 kW. The final phase, with a single vat and 2 kW dispersed, was outside of the production process.
3.2. Hydraulic Model Results
The hydraulic model of a system, knowing the geometry and the inlet conditions, was produced by fixing the total flow rate and calculating the flow rates in each section and the piezometric head in the nodes. The target was to verify that the calculated parameters were compliant with the requested condition.
The first step was the schematic diagram of the plant (
Figure 11): each section is connected to the inlet line and outlet one via manifolds. The Tichelman connection scheme was not adopted. From the real plant, the adopted scheme can be simplified as in
Figure 12b, where each section is connected to a unique inlet and outlet node.
The results obtained by applying the hydraulic model are in
Table 5. The main flow is split, following the total resistance of the single section. Section S1, S2, and S3 are equivalent and shorter than S4. This explains the similar flow rate for the first three sections and the lesser flow rate for the fourth.
3.3. Calibration of the GSHE Plant Model
The GSHE plant model was verified using the International Ground Source Heat Pump Association (IGSHPA) method for the design of horizontal geothermal plants [
16]. The methodology was adopted in the Italian UNI 11466:2012 regulation.
There are two basic equations to obtain the total heat exchanger length: one for the heating season, and a second for the cooling season.
Thermal fluxes and energy requirements are considered positive in the heating regime and negative in the cooling one.
In the evaluation of the Salcheto plant, the length of the probes was known, while the ground parameters, the temperatures, and the system parameters were measured. The results were the thermal power in heating and cooling mode, and the thermal power dissipated through the delivery lines.
The results obtained with the IGSHPA method were compared with those obtained by the hydraulic model using the fundamental equation of calorimetry:
The values of thermal power dissipated by the GSHE probes in the cooling mode were similar for the two methods (
Table 6). The contribution of the main delivery lines calculated with the IGSHPA method was not negligible (2 kW, about 31.57%).
The calculation in the heating mode included the thermal power in the manifold for the hydraulic model. The results indicated that the plant has a greater thermal power than the measured one, but a defective balance of the circulating flow rates causes a loss of 1.5 kW, which is a loss of efficiency of 26%.
It should be noted that the calculations of the IGSHPA method were carried using a model calibrated on ground moisture values close to zero, which is the most unfavorable situation, but close to a realistic value.
4. Discussion
After the analysis of the plant, and during the survey, some technical issues were raised. One of the main issues observed during the operation of the plant was the corrosion of the heat exchanger of the chiller, on the hot side. In some cases, the level of corrosion had caused long stoppages of the plant, in order to replace the heat exchanger. Another issue concerns the parallel configuration of the probes. This design guarantees low-pressure losses and the possibility of isolating a section in case of failure, but a continuous balance of the flow rate in each branch is necessary to maximize efficiency. To prevent this, using the Tichelmann scheme is suggested. Moreover, the circulation pump was oversized. Therefore, it was working in a low-efficiency field, with overheating hazards and possible failure of the device. Last, the depth of the probes was 1.5 m, whereas the IGSHPA guidelines indicate at least 2 m.
The results of the analysis of the GSHE plant highlighted that the cooling request of line A cannot be fully satisfied. Furthermore, line A was designed for seven vats, and two more experimental vats have been added to the line. The new peak request is 9 kW and this could increase in the case of other implementations in the winery.
To solve these issues, two different actions have been envisaged. In the following, these are discussed, to identify the most promising solution.
One of the possible actions is the installation of new probes (named ‘line A’), orthogonally to the existing manifold line, increasing the total length by 650 m. Considering an installation depth of 1.5 m, the thermal power would be increased up to 8.8 kW. On the other hand, by placing the probes at the depth of 2.5 m, according to the IGSHPA guidelines, the average ground temperature being equal to 16.5 °C, an increase up to 9.45 kW of the thermal power could be obtained.
To avoid any possible difficulties related to the installation of new probes, an alternative action modifying the existing plant has been proposed (named ‘line A, B, C’). The basic idea is to change the task of the GSHE, from cooling a single line, to cooling the chiller condenser (
Figure 12).
The three vat lines will be connected directly to the chiller, to control their temperature. The chiller condenser is directly connected to the existing GSHE plant to release the heat to the ground, to cool the working fluid. The evaporative tower will operate in series with the geothermal plant and is active only when the GSHE is not sufficient to guarantee the requested temperature at the chiller inlet.
This layout satisfies, not only the temperature control of all vat lines, but also the need to avoid the stopping of the plant due to the corrosion induced by the evaporative tower. Nevertheless, a greater electrical consumption is needed, due to the continuous operation of the chiller. Therefore an evaluation of the efficiency of the proposed layout was carried out.
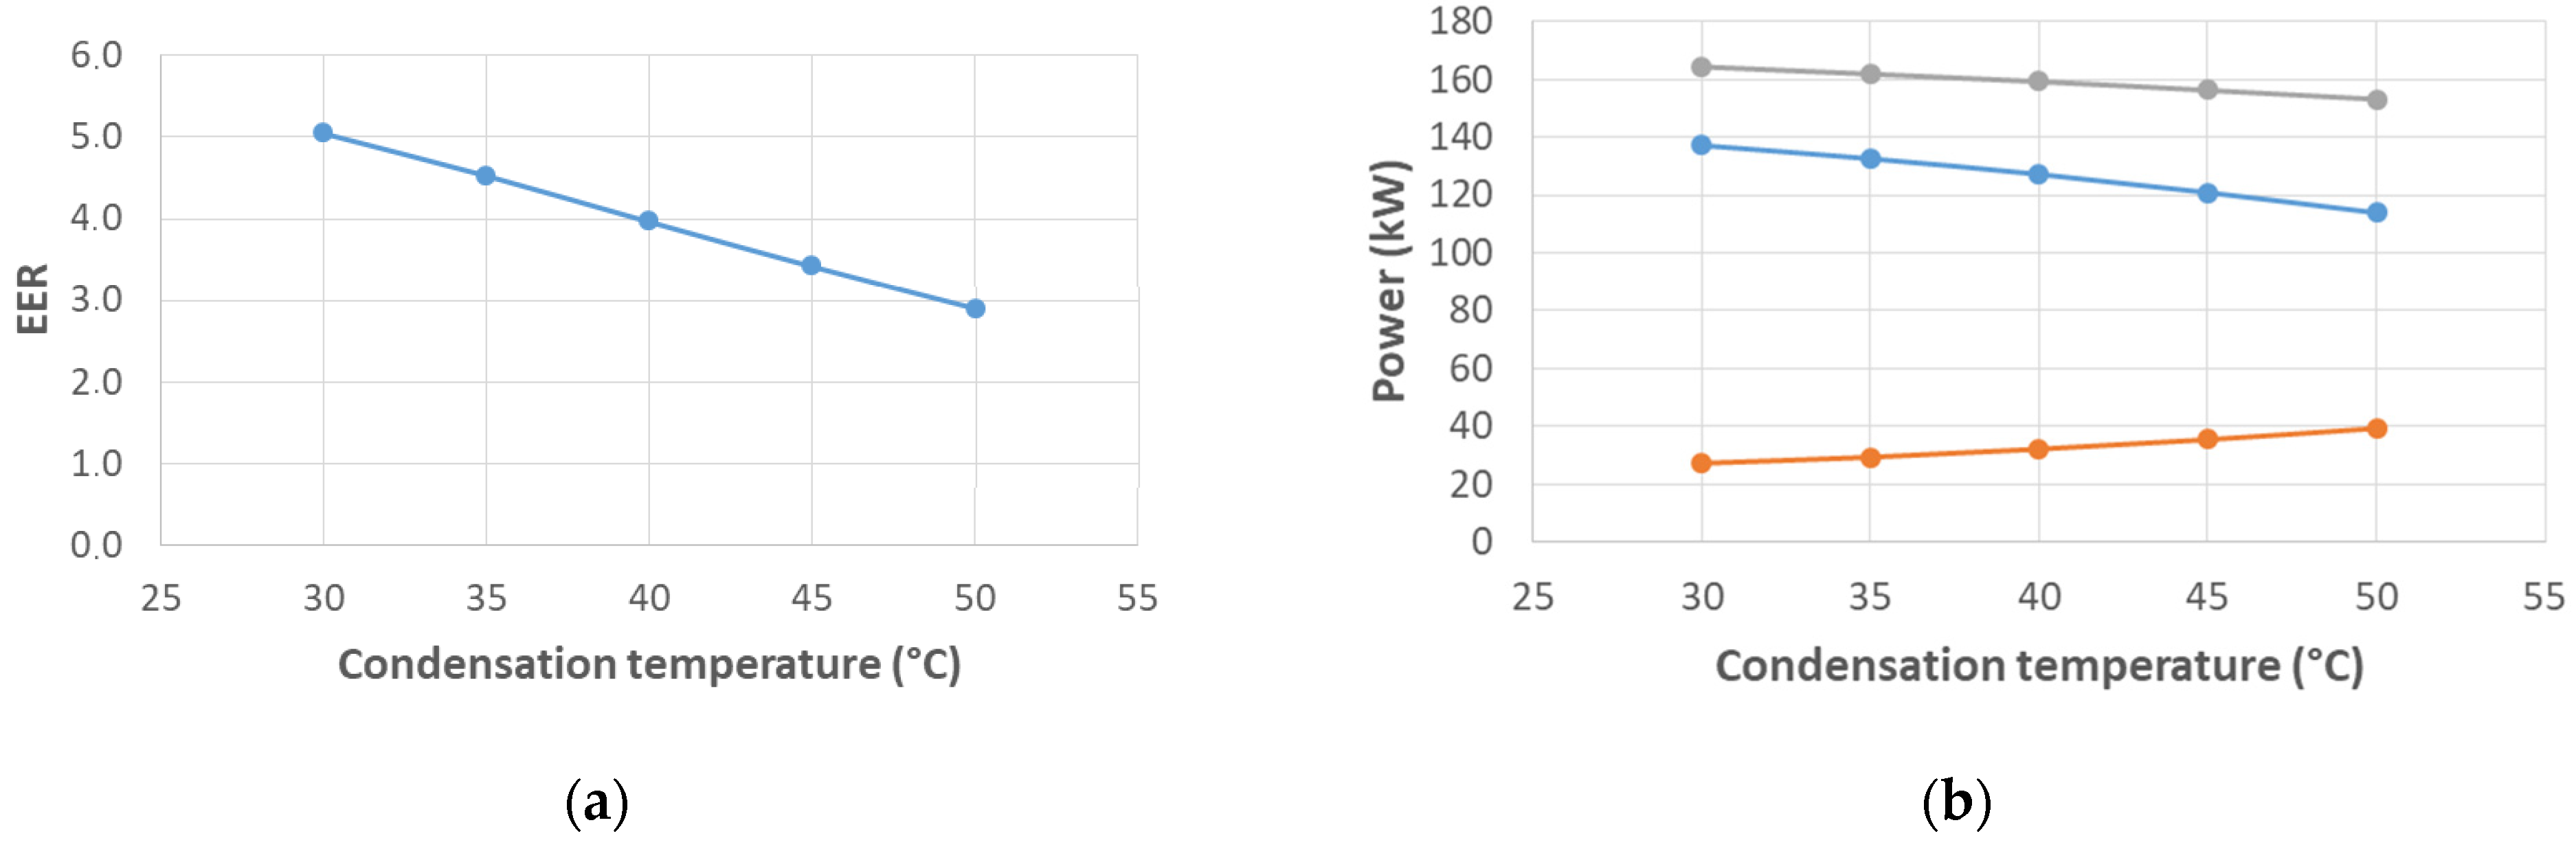
The chiller can supply a cooling power between 114 and 137 kW, with a constant evaporative temperature of 10 °C and a condensation temperature that varies between 30 and 50 °C. The minimization of the thermal gradient between the condensation and evaporation temperature produces a reduction of energy consumption of 3–4% for each unit of temperature. In addition, the decrease of the condensation temperature, depending on external temperature, produces an increase of the cooling power and a decrease of the compressor work, increasing the energy efficiency ratio (EER) (
Figure 13b). When the condensation temperature is 35 °C, the EER reaches the remarkable value of 4.53 (
Figure 13a).
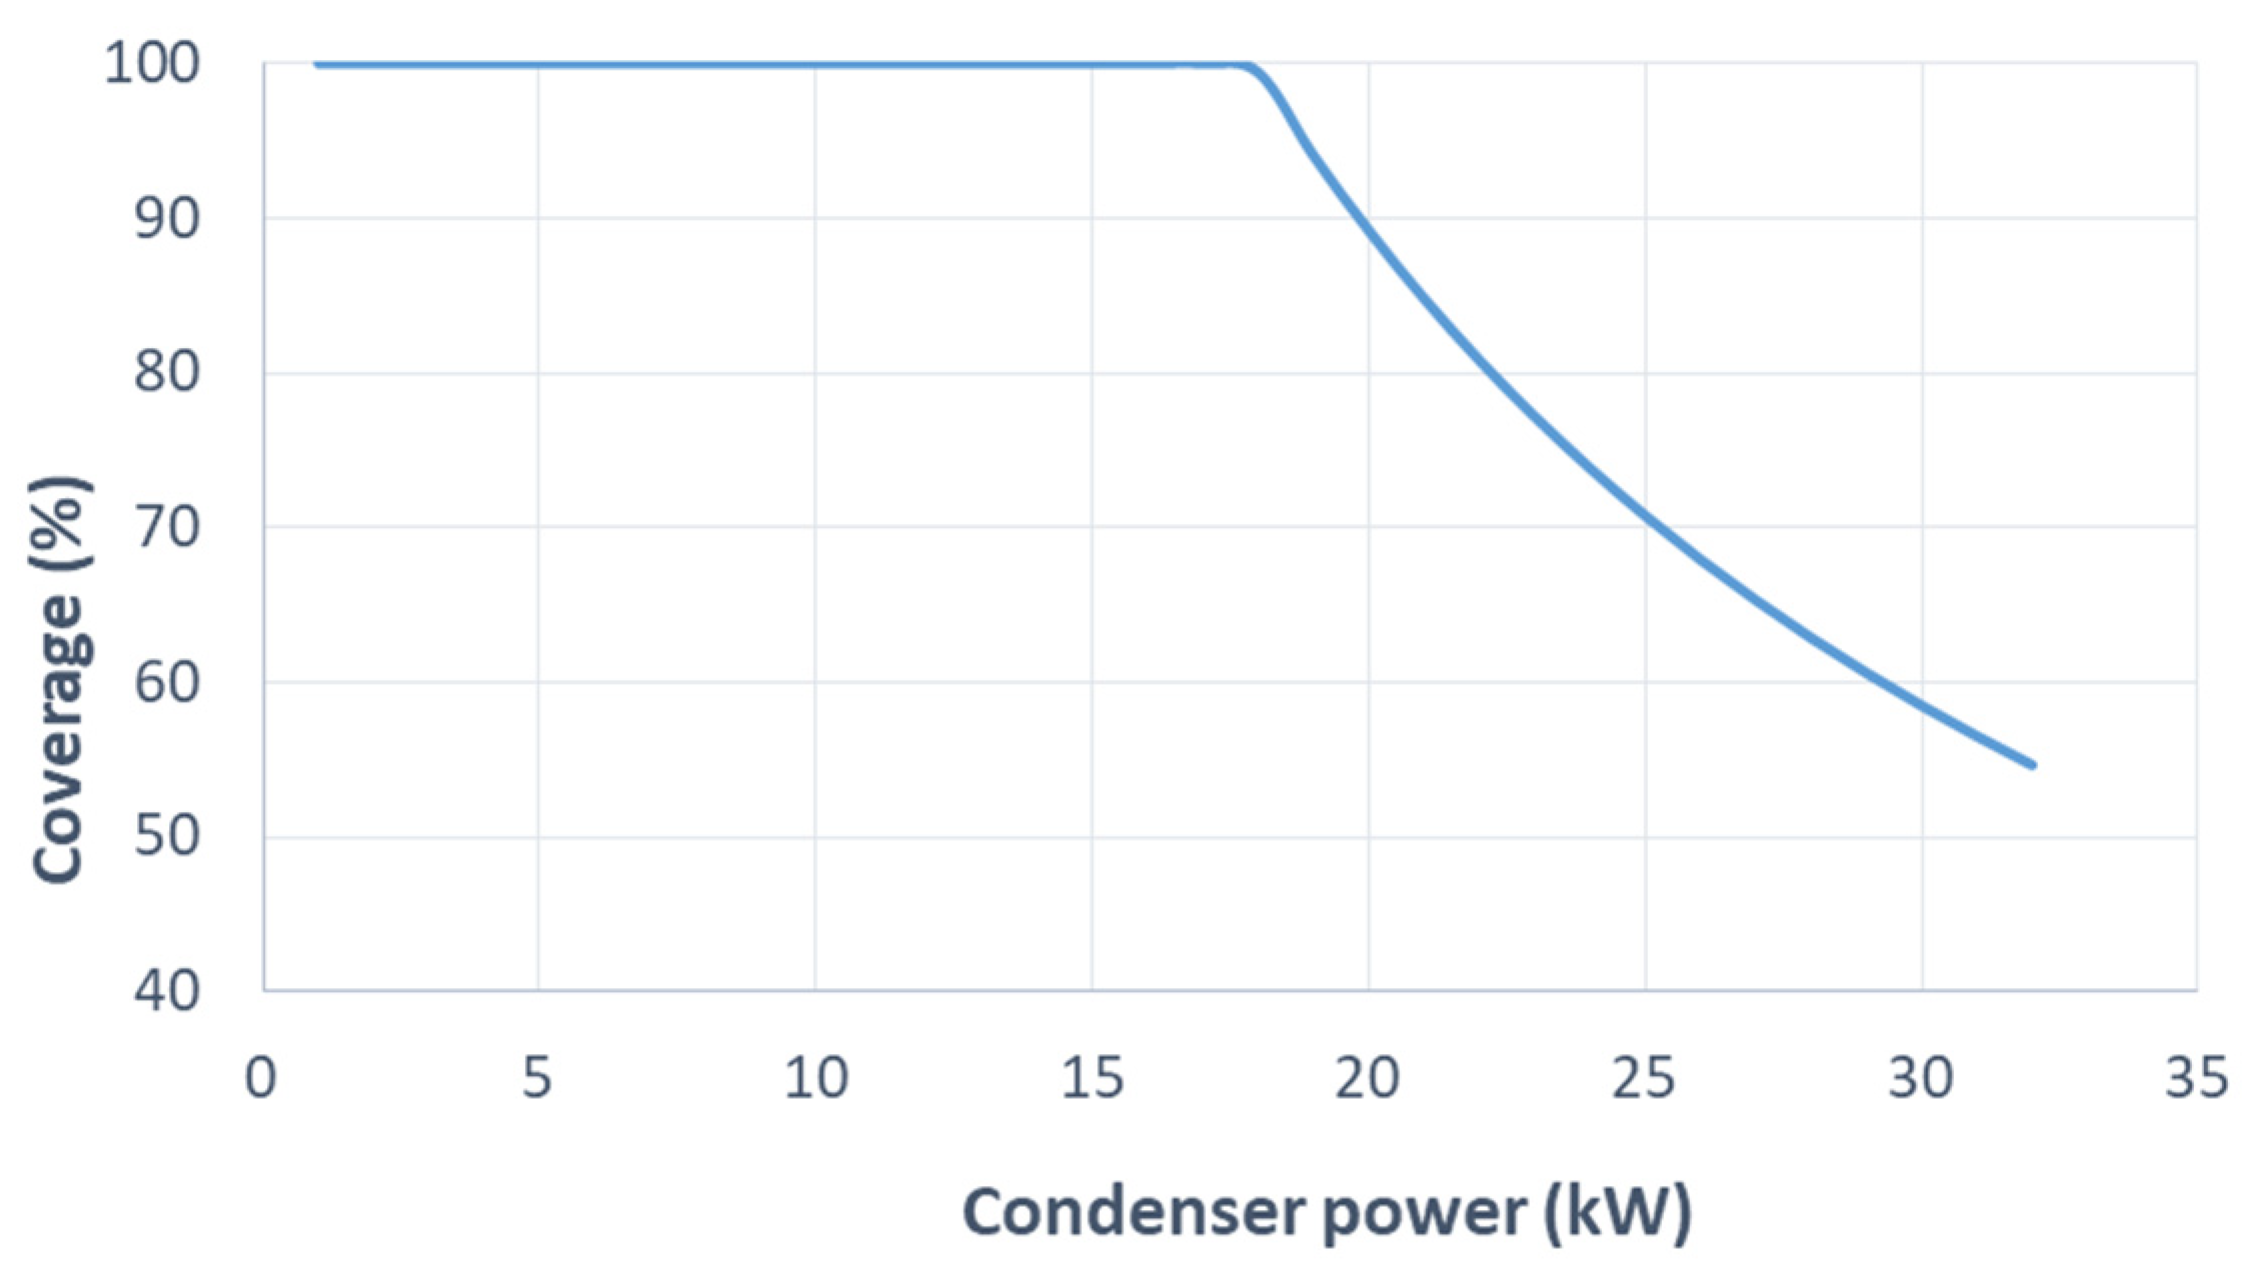
When the operating temperature of the plant is fixed, the percentage of coverage of the thermal power that can be dissipated with the GSHE plant has to be evaluated. Fixing the flow rate (15 m3/h) and knowing the pipe diameter and the inlet temperature of the GSHE plant Twi, it is possible to calculate the temperature difference, depending on the required power and then the outlet temperature of the GSHE plant Two. The power of the plant depends on the difference between the inlet and outlet temperature of the fluid, and it was evaluated with the IGSHPA method.
Figure 14 illustrates the coverage of required power by the geothermal plant. When the power is less than 18 kW, the new layout can cover 100% of the requirement; from 18 kW up to the peak of thermal power of the condenser (32 kW), the fulfilment is reduced to 55%. The evaporative tower will supply the remaining 45%.
Another critical parameter for the sizing of geothermal probes is the temperature of the working fluid. The lower the condensation temperature, the smaller the difference between the probe outlet temperature and the soil temperature. The consequence is a decrease in power. Conversely, the greater the difference between the temperature of the working fluid and the temperature of the soil, the greater the power of the system. In this approach, the consequences are the influence of the surrounding soil temperature and the increased energy consumption of the plant.
The correct balancing of the various parameters was obtained by considering the difference between the temperature of the working fluid at the outlet and the temperature of the ground in the range 11–17 °C. The flow rate in the probes was calculated as a function of the thermal gradient of the fluid in the probes, and to guarantee both the flow in turbulent conditions (Re > 2300) and reduced pressure losses in the pipes by limiting the energy consumption of the pump. Considering a uniform distribution in the sections, the flow rate obtained is 0.625 m
3/h for each section. The maximum flow rate of 15 m
3/h is satisfied. The peak power for the selected parameters is observed when the temperature difference between the working fluid and the ground is 17.5 °C, and the difference between the inlet and outlet temperature is 1.8 °C.
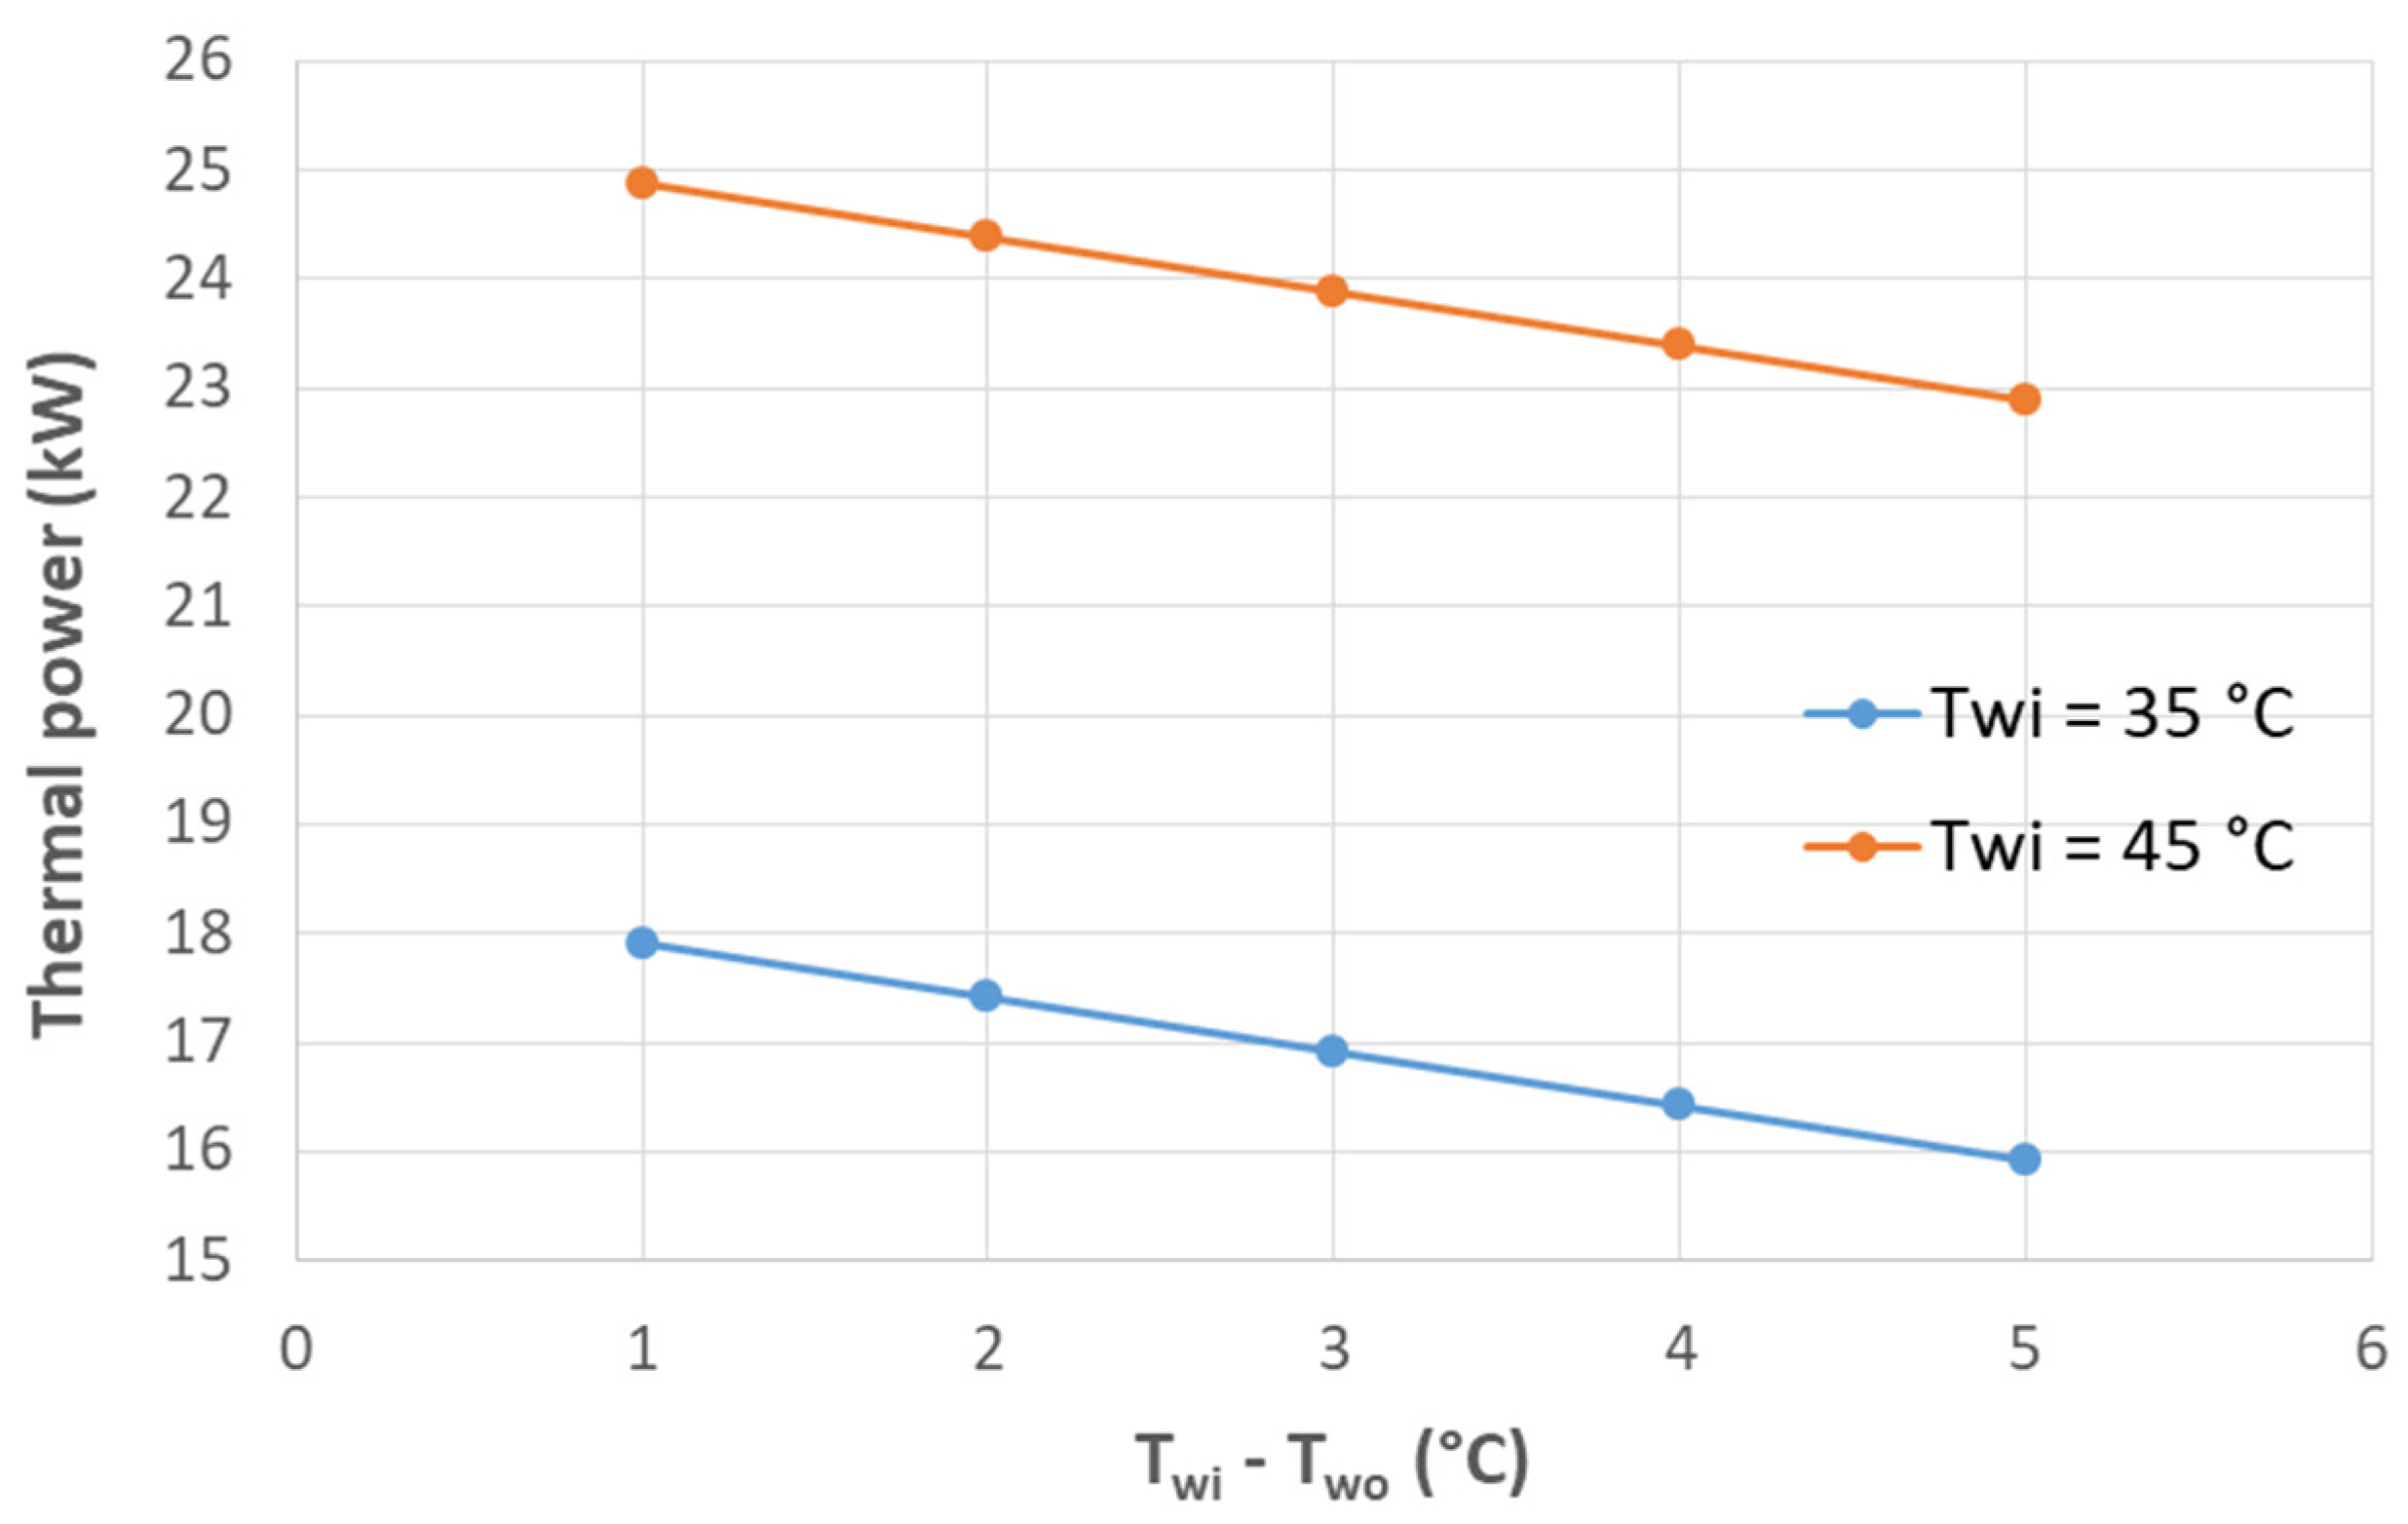
Figure 15 illustrates that the higher the condensation temperature, the higher the dissipated thermal power, even if the EER is lower.
To compare the two actions ‘line A’ and ‘line A, B, C’, an economic analysis was carried out. The target was to cover the greater part of the cooling requirement with the GSHE plant. The energy costs related to the use of free cooling and the chiller in the two solutions were evaluated, considering the vinification period (22 days), as in the previous sections (
Table 7).
‘Line A’ produces a greater saving, but to reach the cooling power of 8 kW, the installation of other 650 m of probes is necessary, which would require an investment cost of about EUR 6000.
Table 8 reports the economical evaluation of the installation of another 650 m of probes to guarantee up to 80% of the required cooling power. The investment has too a high payback time (30 years).
Therefore, ‘line A, B, C’, which uses the GSHE plant to serve the condenser of the chiller, is the best economical solution. This layout covers about half of the peak requirement (18 kW, 55% of cover), but it also solves the corrosion problems and does not require any investment costs. The cost of the evaporative tower could be reduced by installing a new photovoltaic plant, which is a renewable and sustainable energy source, with very low CO2 emissions, and in accordance to the policy of the Salcheto company (Montepulciano, Italy).
5. Conclusions
A diagnostic analysis of the cooling plant, based on an existing horizontal GSHE of Salcheto winery, was conducted. A preliminary survey was conducted, monitoring the temperature in wells and executing a thermal response test. The collected data were used to model the GSHE plant, build the hydraulic model of the system, and apply the IGSHPA method. The hydraulic efficiency was evaluated, and the heating and cooling power of the plant was calculated.
This analysis highlighted all the technical issues of the plant: the corrosion of the heat exchanger of the chiller, the oversizing of the circulation pump, and the low performance of the plant itself. Two different solutions were proposed and evaluated considering the technical and economic features. The ‘line A’ action consists of an update of the original plant, without any layout modifications, but requiring investments. The ‘line A, B, C’ action does not require any updating of the GSHE and related investment costs, but needs a modification of the layout itself. This second option was chosen as the most cost-effective.
This work presents an original approach for the evaluation of the performance of an existing GSHE. Some limitations are related to the reduced time in conducting measurements, due to limited access to the structure. Nevertheless, the results support the accuracy of the method. This approach can be used in many other situations in wineries, where plants exist; and evidence of some troubles in using a GSHE plant is a clear indication to avoid some design solutions and to take the right decision to use this kind of plant. The possibility of finding a solution for this specific issue was not possible without the preliminary survey, which allowed evaluating the capabilities of the plant.
Finally, the obtained results highlight the possibility of using a horizontal GSHE in wineries, to serve the cooling needs during the harvest. The installation between the rows of vines is helpful for disposing of the need for a very large space to host the GSHE piping. When approaching this solution, it is important to evaluate possible interactions with the roots of the vines and the opportunities offered in controlling the ground temperature. It was also demonstrated that this kind of plant can satisfy a direct use for vat cooling, if correctly sized. Otherwise, they can serve other components of the plant, ensuring energy savings.


