Abstract
In general, the stone pagoda structures with discontinuous surfaces are vulnerable to lateral forces and are severely damaged by earthquakes. After the Gyeongju earthquake in 2016 and the Pohang earthquake in 2017, numerous stone pagoda structures were damaged due to slippage, rotation, and the separation of stacked stone. To evaluate seismic resistance of masonry stone pagoda structures, we analyzed the seismic behavior of stone pagoda structures using the shaking table test. Shaking frequency, permanent displacement, maximum acceleration, rocking, and sliding were assessed. Responses to simulations of the Bingol, Gyeongju, and Pohang earthquakes based on the Korean seismic design standard (KDS 41 17 00) were analyzed for return periods of 1000 and 2400 years. We found that the type of stylobate affected the seismic resistance of the stone pagoda structure. When the stylobates were stiff, seismic energy was transferred from lower to upper regions of the stone pagoda, which mainly resulted in deformation of the upper region. When the stylobates were weak, earthquake energy was absorbed in the lower regions, which was associated with large stylobate deformations. The lower part of the tower body was mainly affected by rocking, because the structural members were slender. The higher part of the stone pagoda was mainly affected by sliding, because the load and contact area decreased with height.
1. Introduction
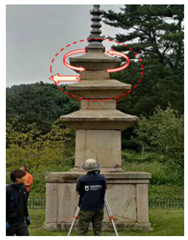
Many cultural heritage structures were damaged by the Gyeongju earthquake in 2016 ( and the Pohang earthquake in 2017 (). Therefore, the preservation and maintenance of heritage structures in Korea became a major concern. The earthquakes damaged over 130 heritage structures due to slippage, rotation, and the separation of stacked stone. Among the damaged structures, the stone pagoda structures were heavily damaged. Because the stone pagoda structures with masonry construction types were built a long time ago, they are more vulnerable to lateral forces, such as earthquakes, due to reduced durability and friction by weathering. For the sustainable preservation and maintenance of stone pagoda structures, it is necessary to understand the seismic behavior of the structure by the experiment of the shaking table test.
Gabriele Guerrini et al. (2019) [1], Sergio Ruggieri et al. (2020) [2], Gianfranco De Matteis and Mattia Zizi (2019) [3], and Nicola Ruggieri (2021) [4] discussed earthquake damages on masonry churches after the earthquakes. The damage mechanisms of masonry churches were identified by analyzing the geometric characteristics, boundary conditions, earthquake intensity, and ground acceleration. However, these studies analyzed the damages after earthquakes without performing experiments or structural analysis, so it is difficult to describe exactly the behavior of masonry structures in time domain during earthquakes. In terms of studies on seismic behavior of masonry structures, Fujita et al. (2006) [5], L. Krestevska et al. (2008) [6], and Junlong Lu et al. (2020) [7] conducted shaking table tests and structural analyses on the structure (temple, tower, pagoda, etc.). These studies mainly analyzed displacement, acceleration, and frequency of the structures. From these results, the appropriateness of the experimental methods was verified. In addition, P. Gavrilovic et al. (1995, 2005) [8,9], Kim et al. (2011) [10], and Lidija Krstevska et al. (2020) [11] compared and analyzed the behavior of unreinforced and reinforced structures for masonry structures (church, unreinforced masonry building, stone bridge, stone masonry structure, etc.). These studies verified the appropriateness of the seismic reinforcement method or suggested a new seismic reinforcement method. However, it is not easy to understand the seismic behavior of a three-story stone pagoda structure in Korea from these results because the construction types between masonry structures are different. In Korea, Kim et al. [12,13] performed shaking table tests on the stone pagoda structures. From these results, the earthquake level, which occurred in the past, was estimated through the experimental results and the effectiveness of seismic reinforcement method was verified. However, these studies do not provide the adequate results to derive the vulnerable parts of general stone pagoda structures for various earthquake levels and to establish the maintenance countermeasures. As mentioned above, many experimental studies have been conducted on various types of masonry structures. However, it is not enough to analyze exactly the seismic behavior of stone pagoda structures in Korea from the above-mentioned experimental results. In addition, the existing experimental studies did not suggest reliable data for future structural analysis and did not provide sustainable countermeasures for the preservation and maintenance of stone pagoda structures.
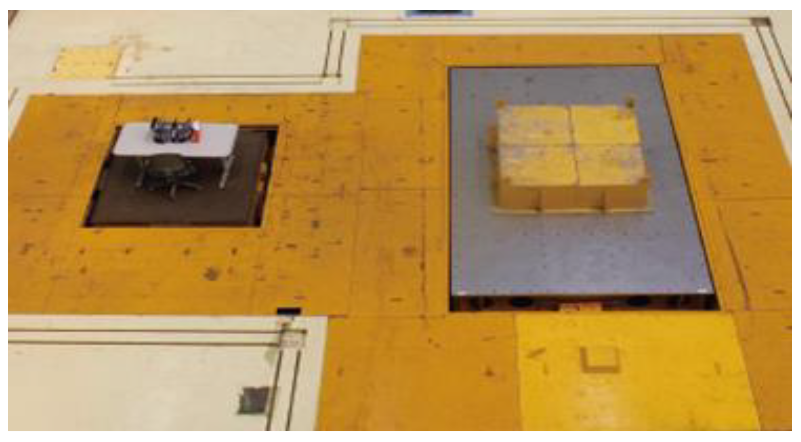
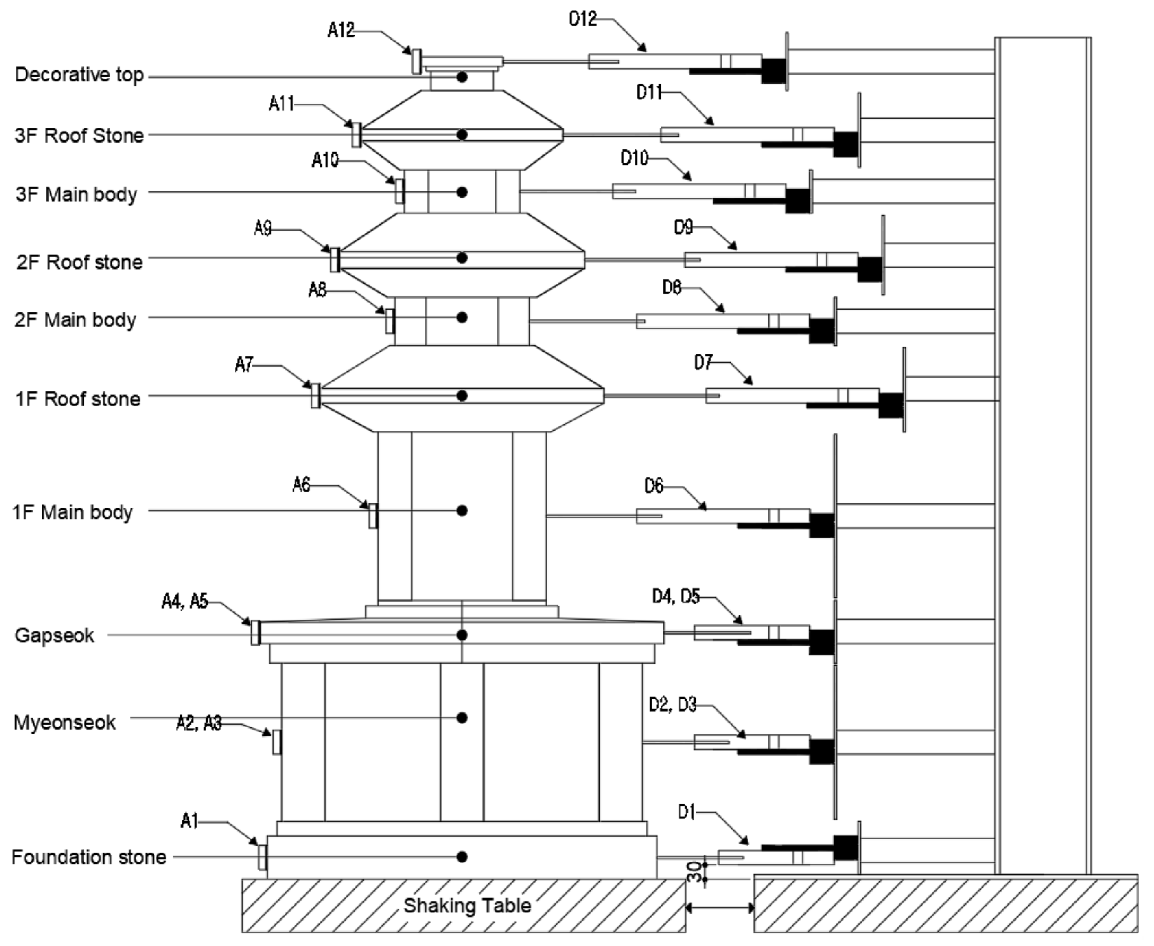
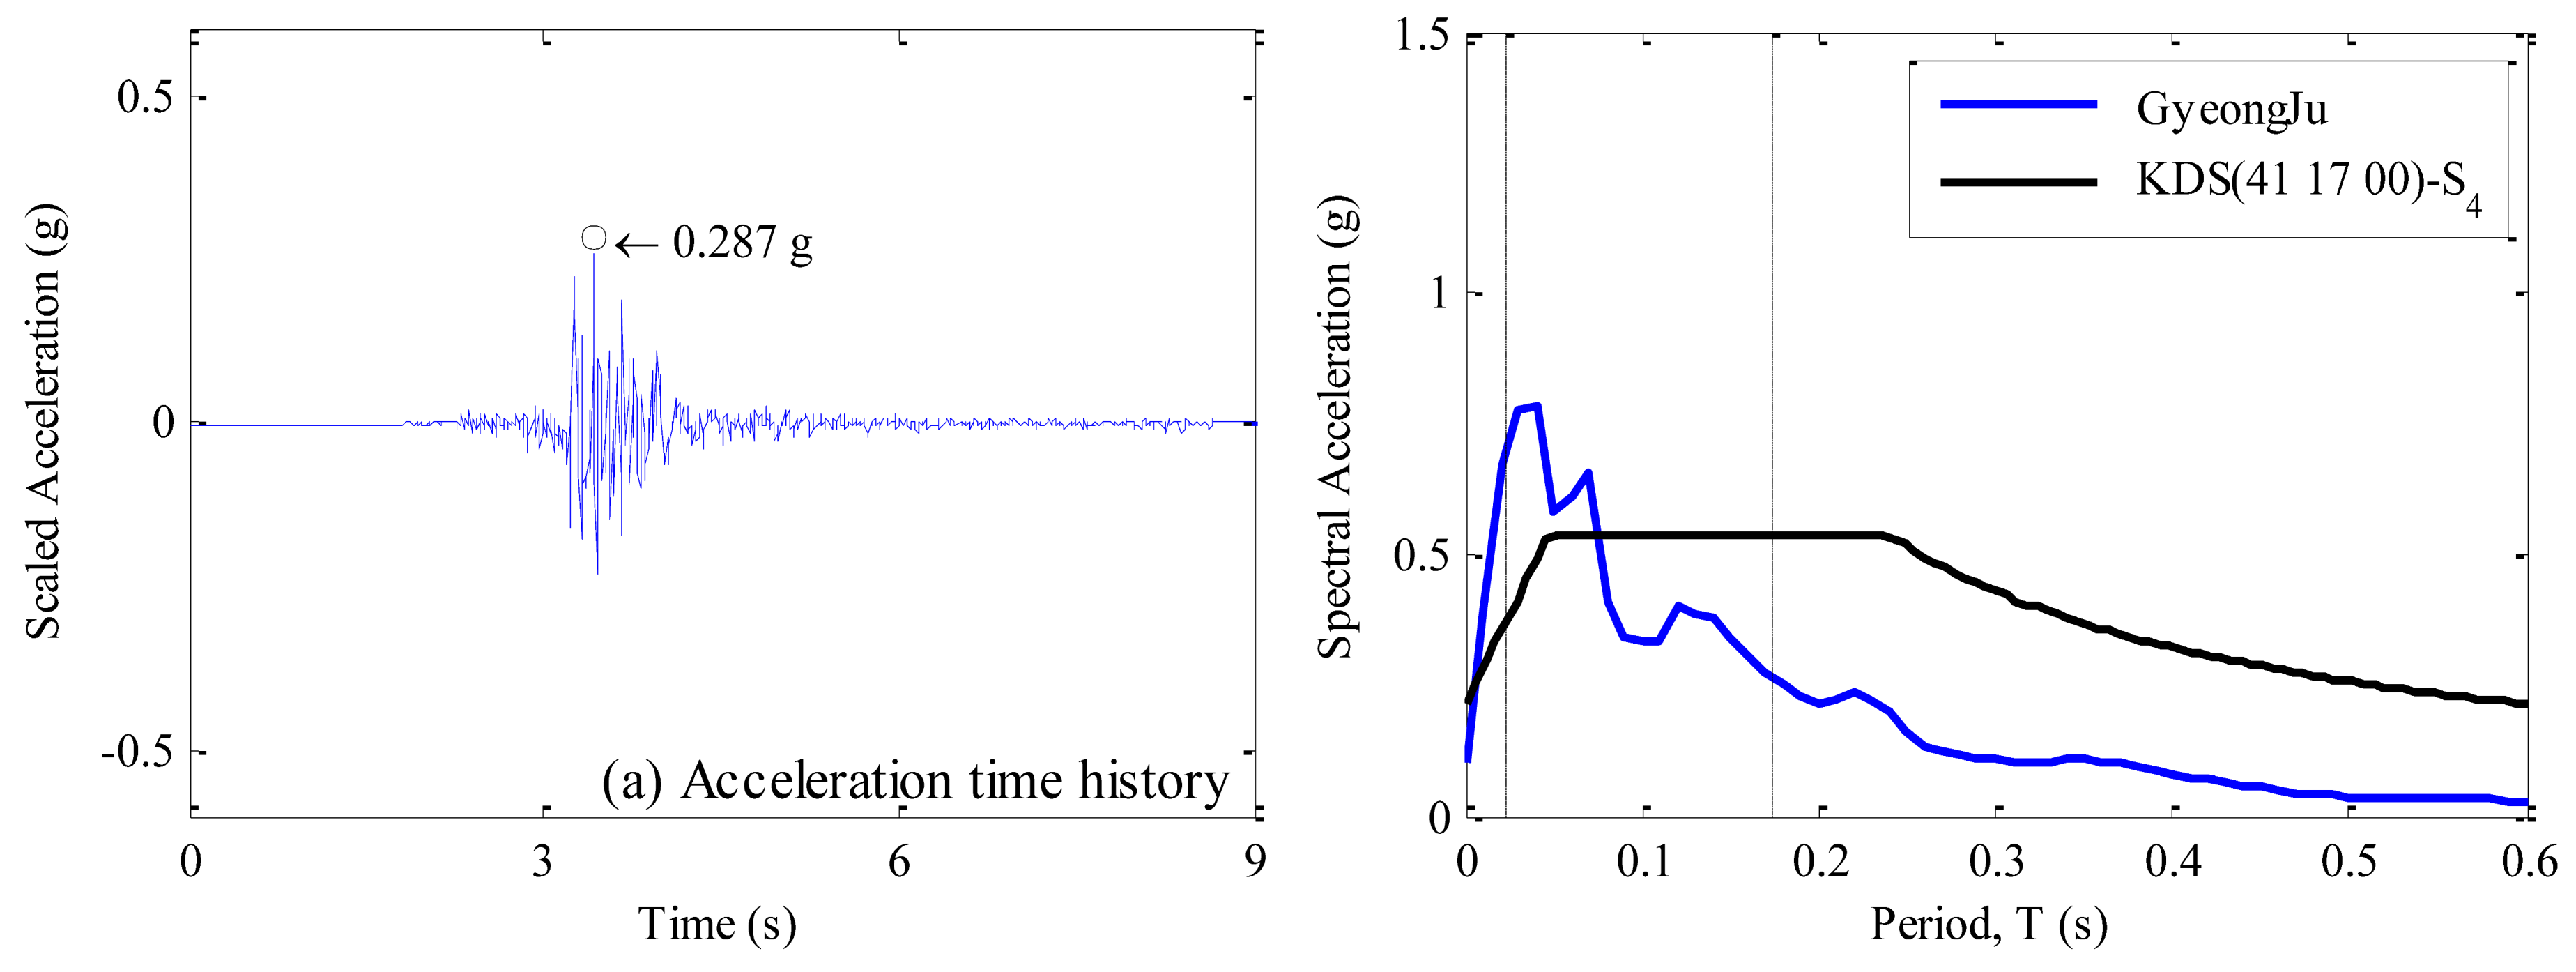
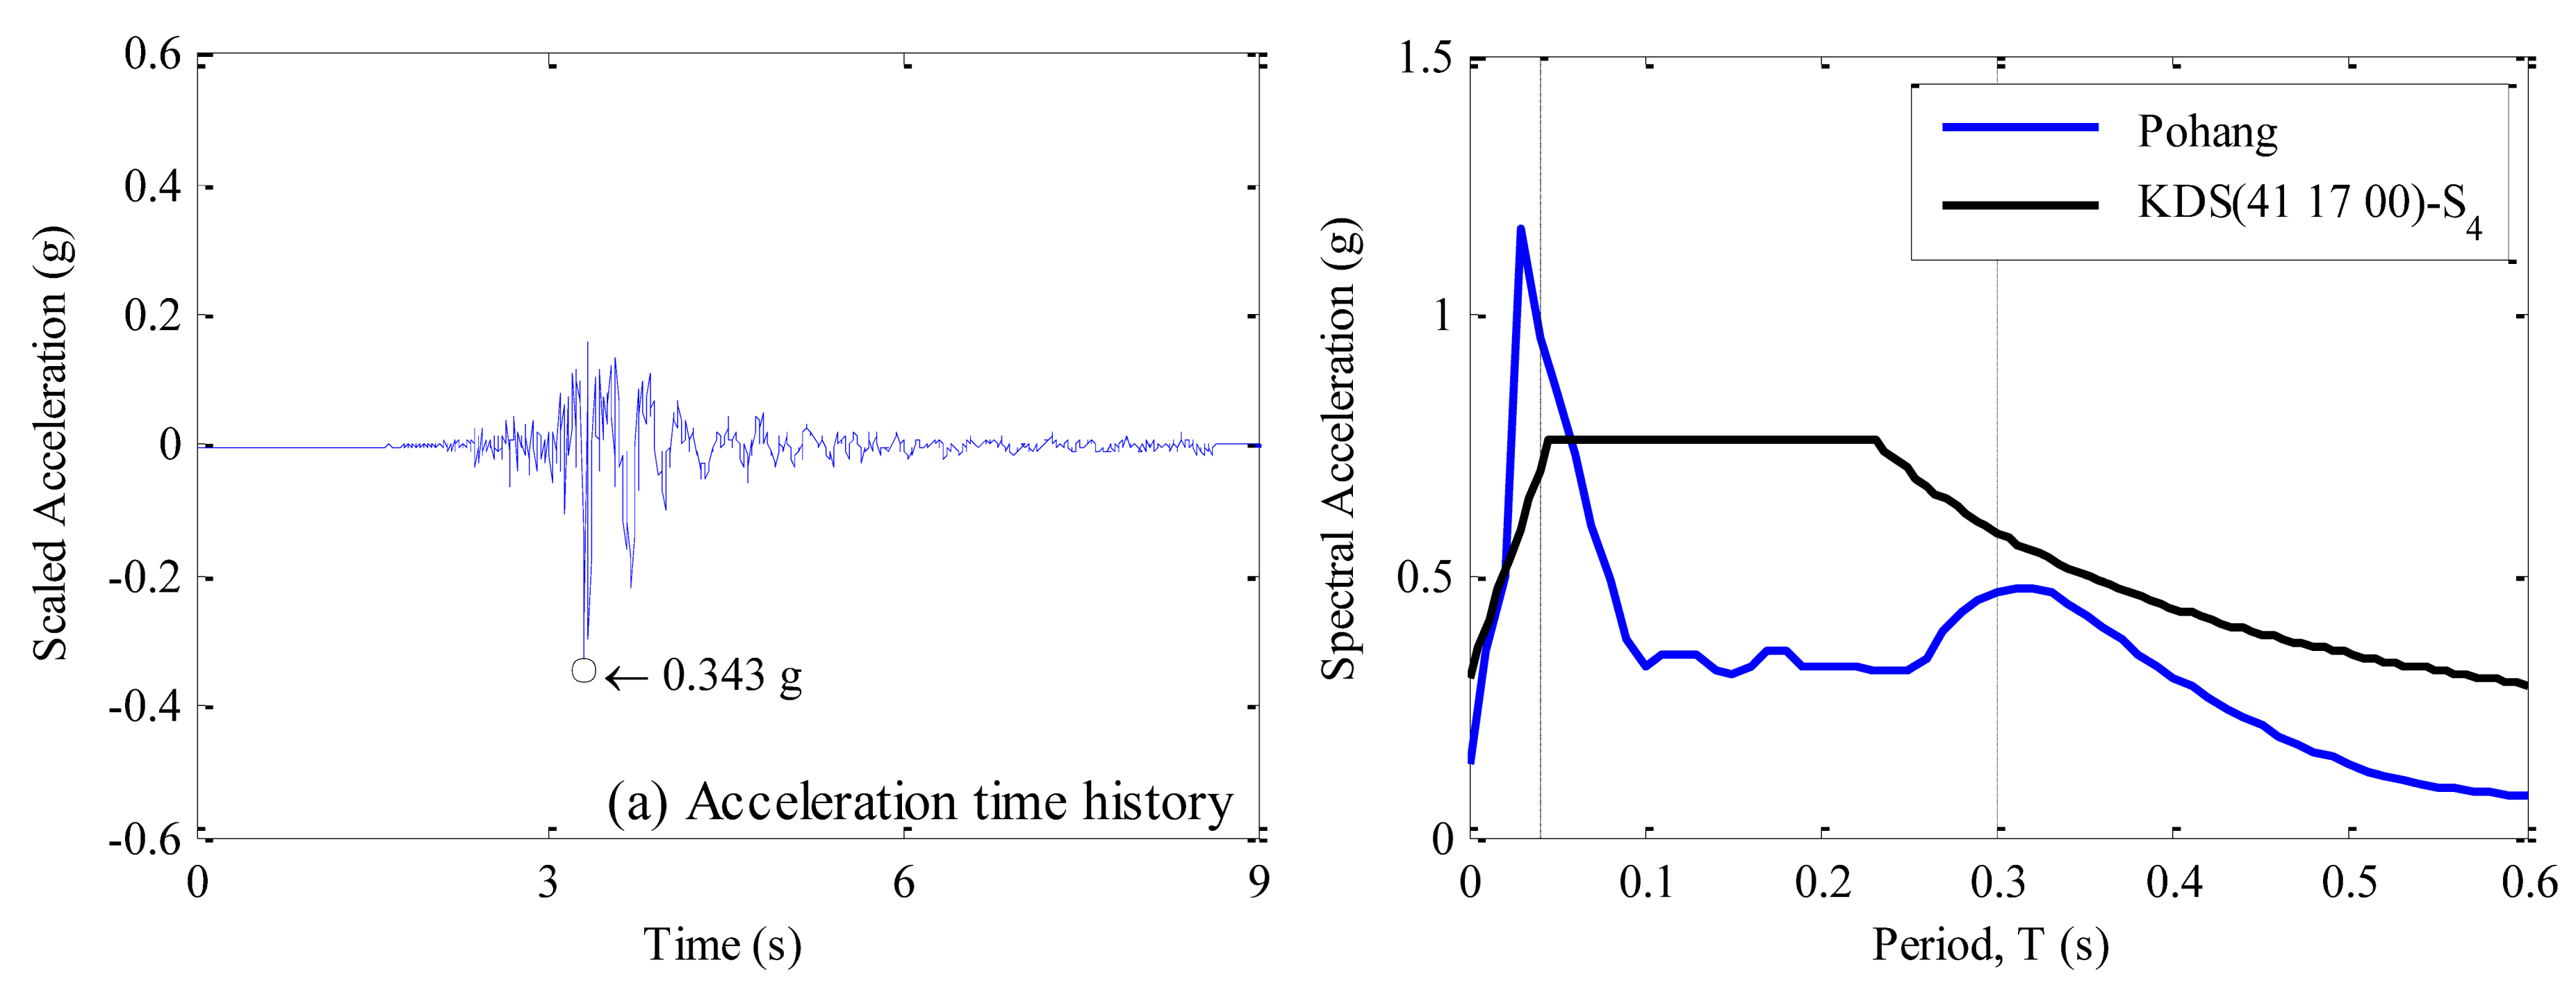
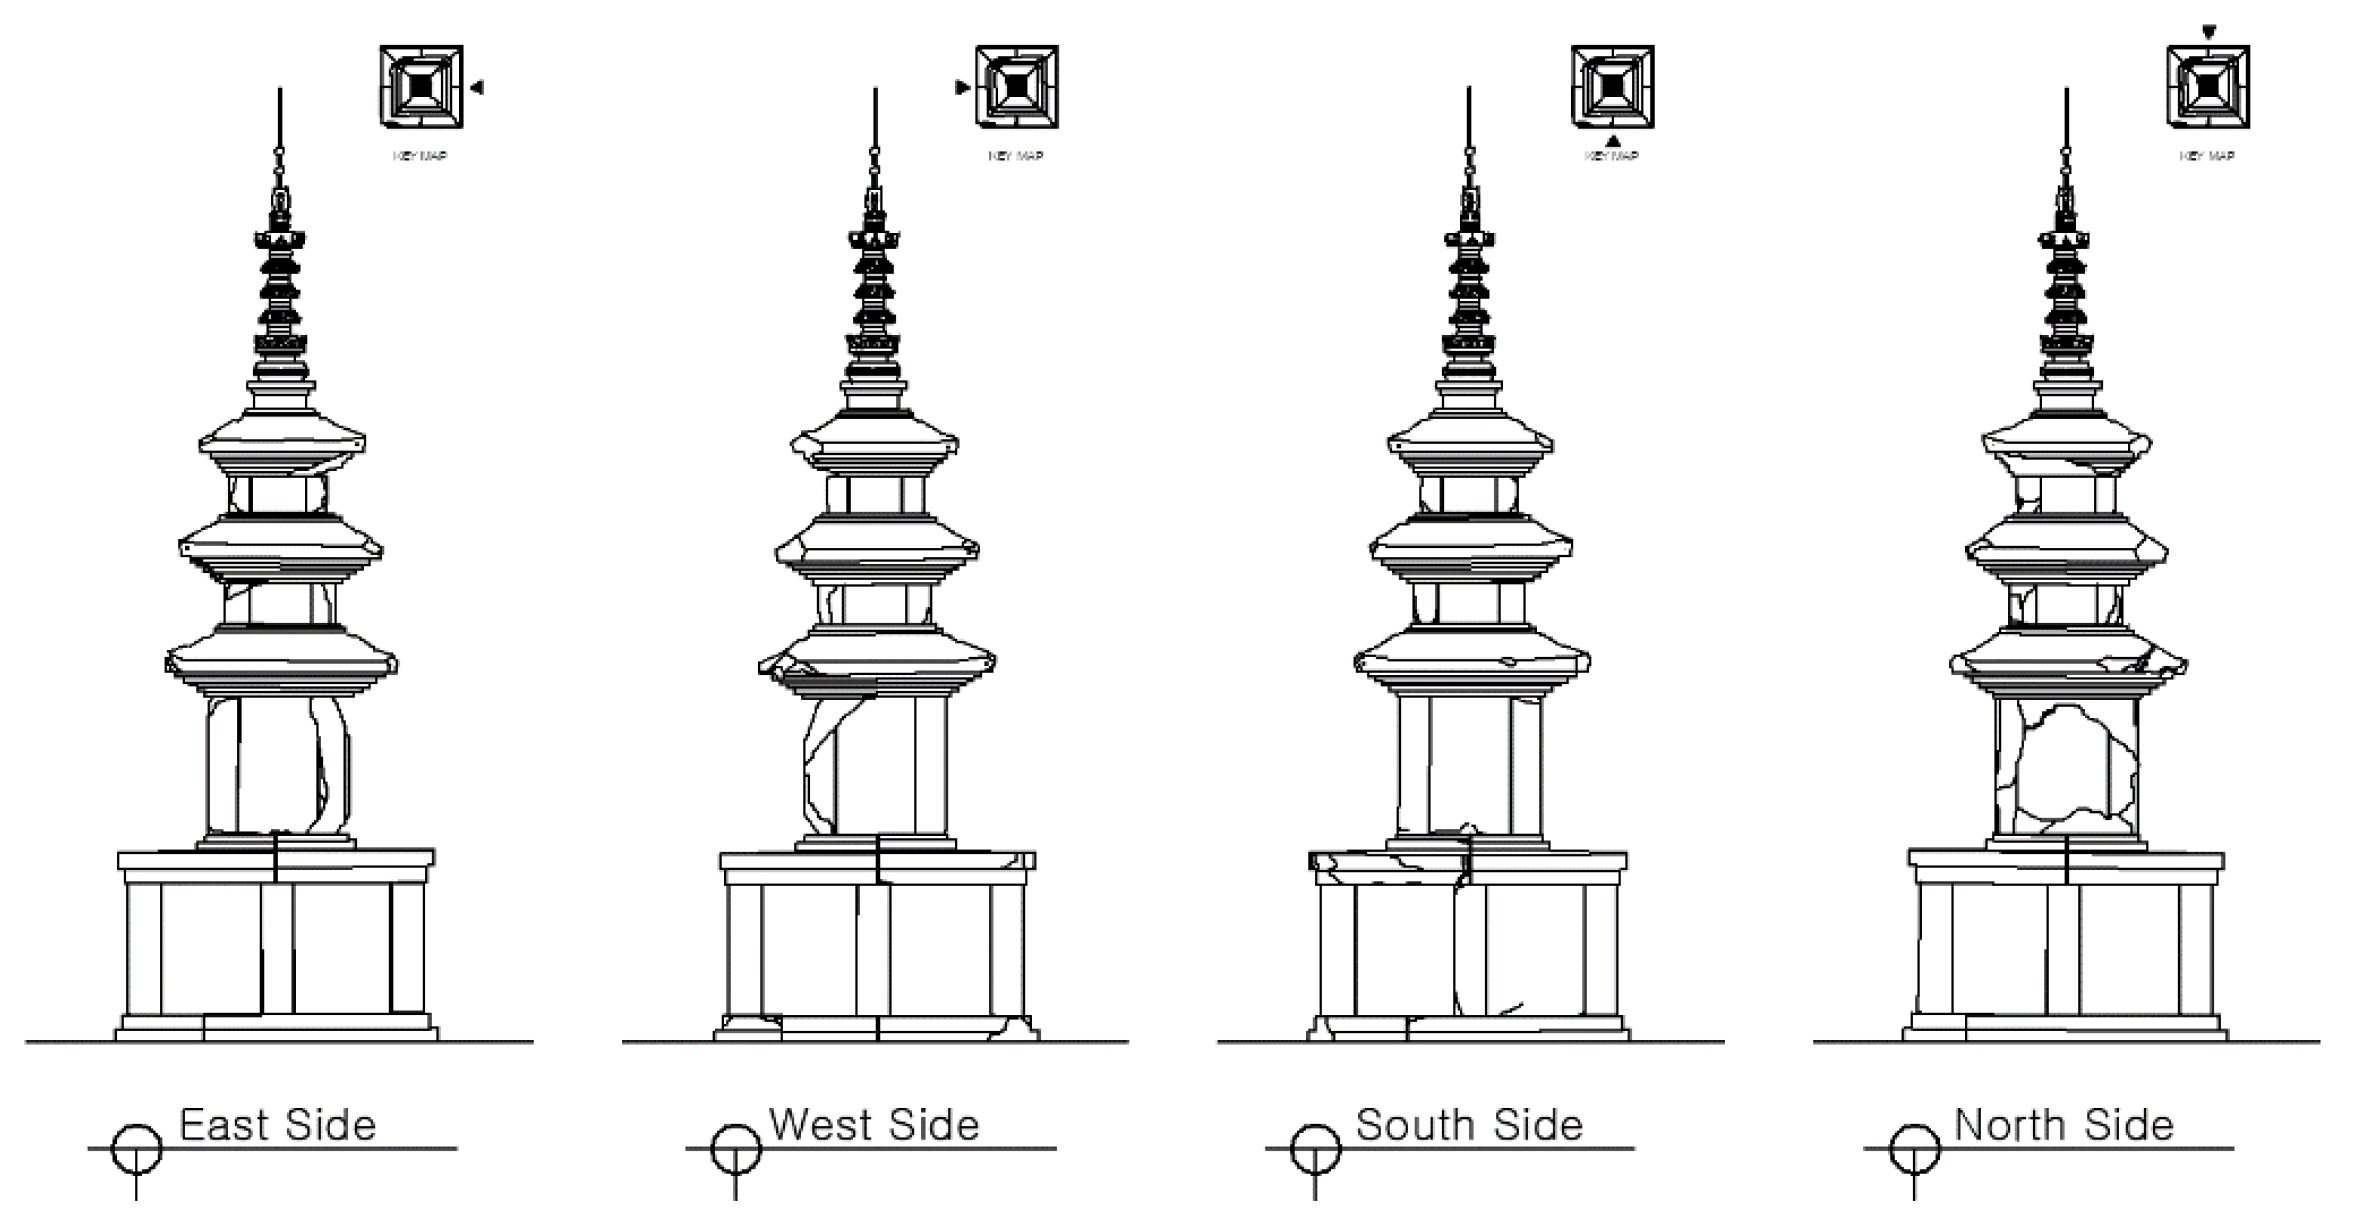
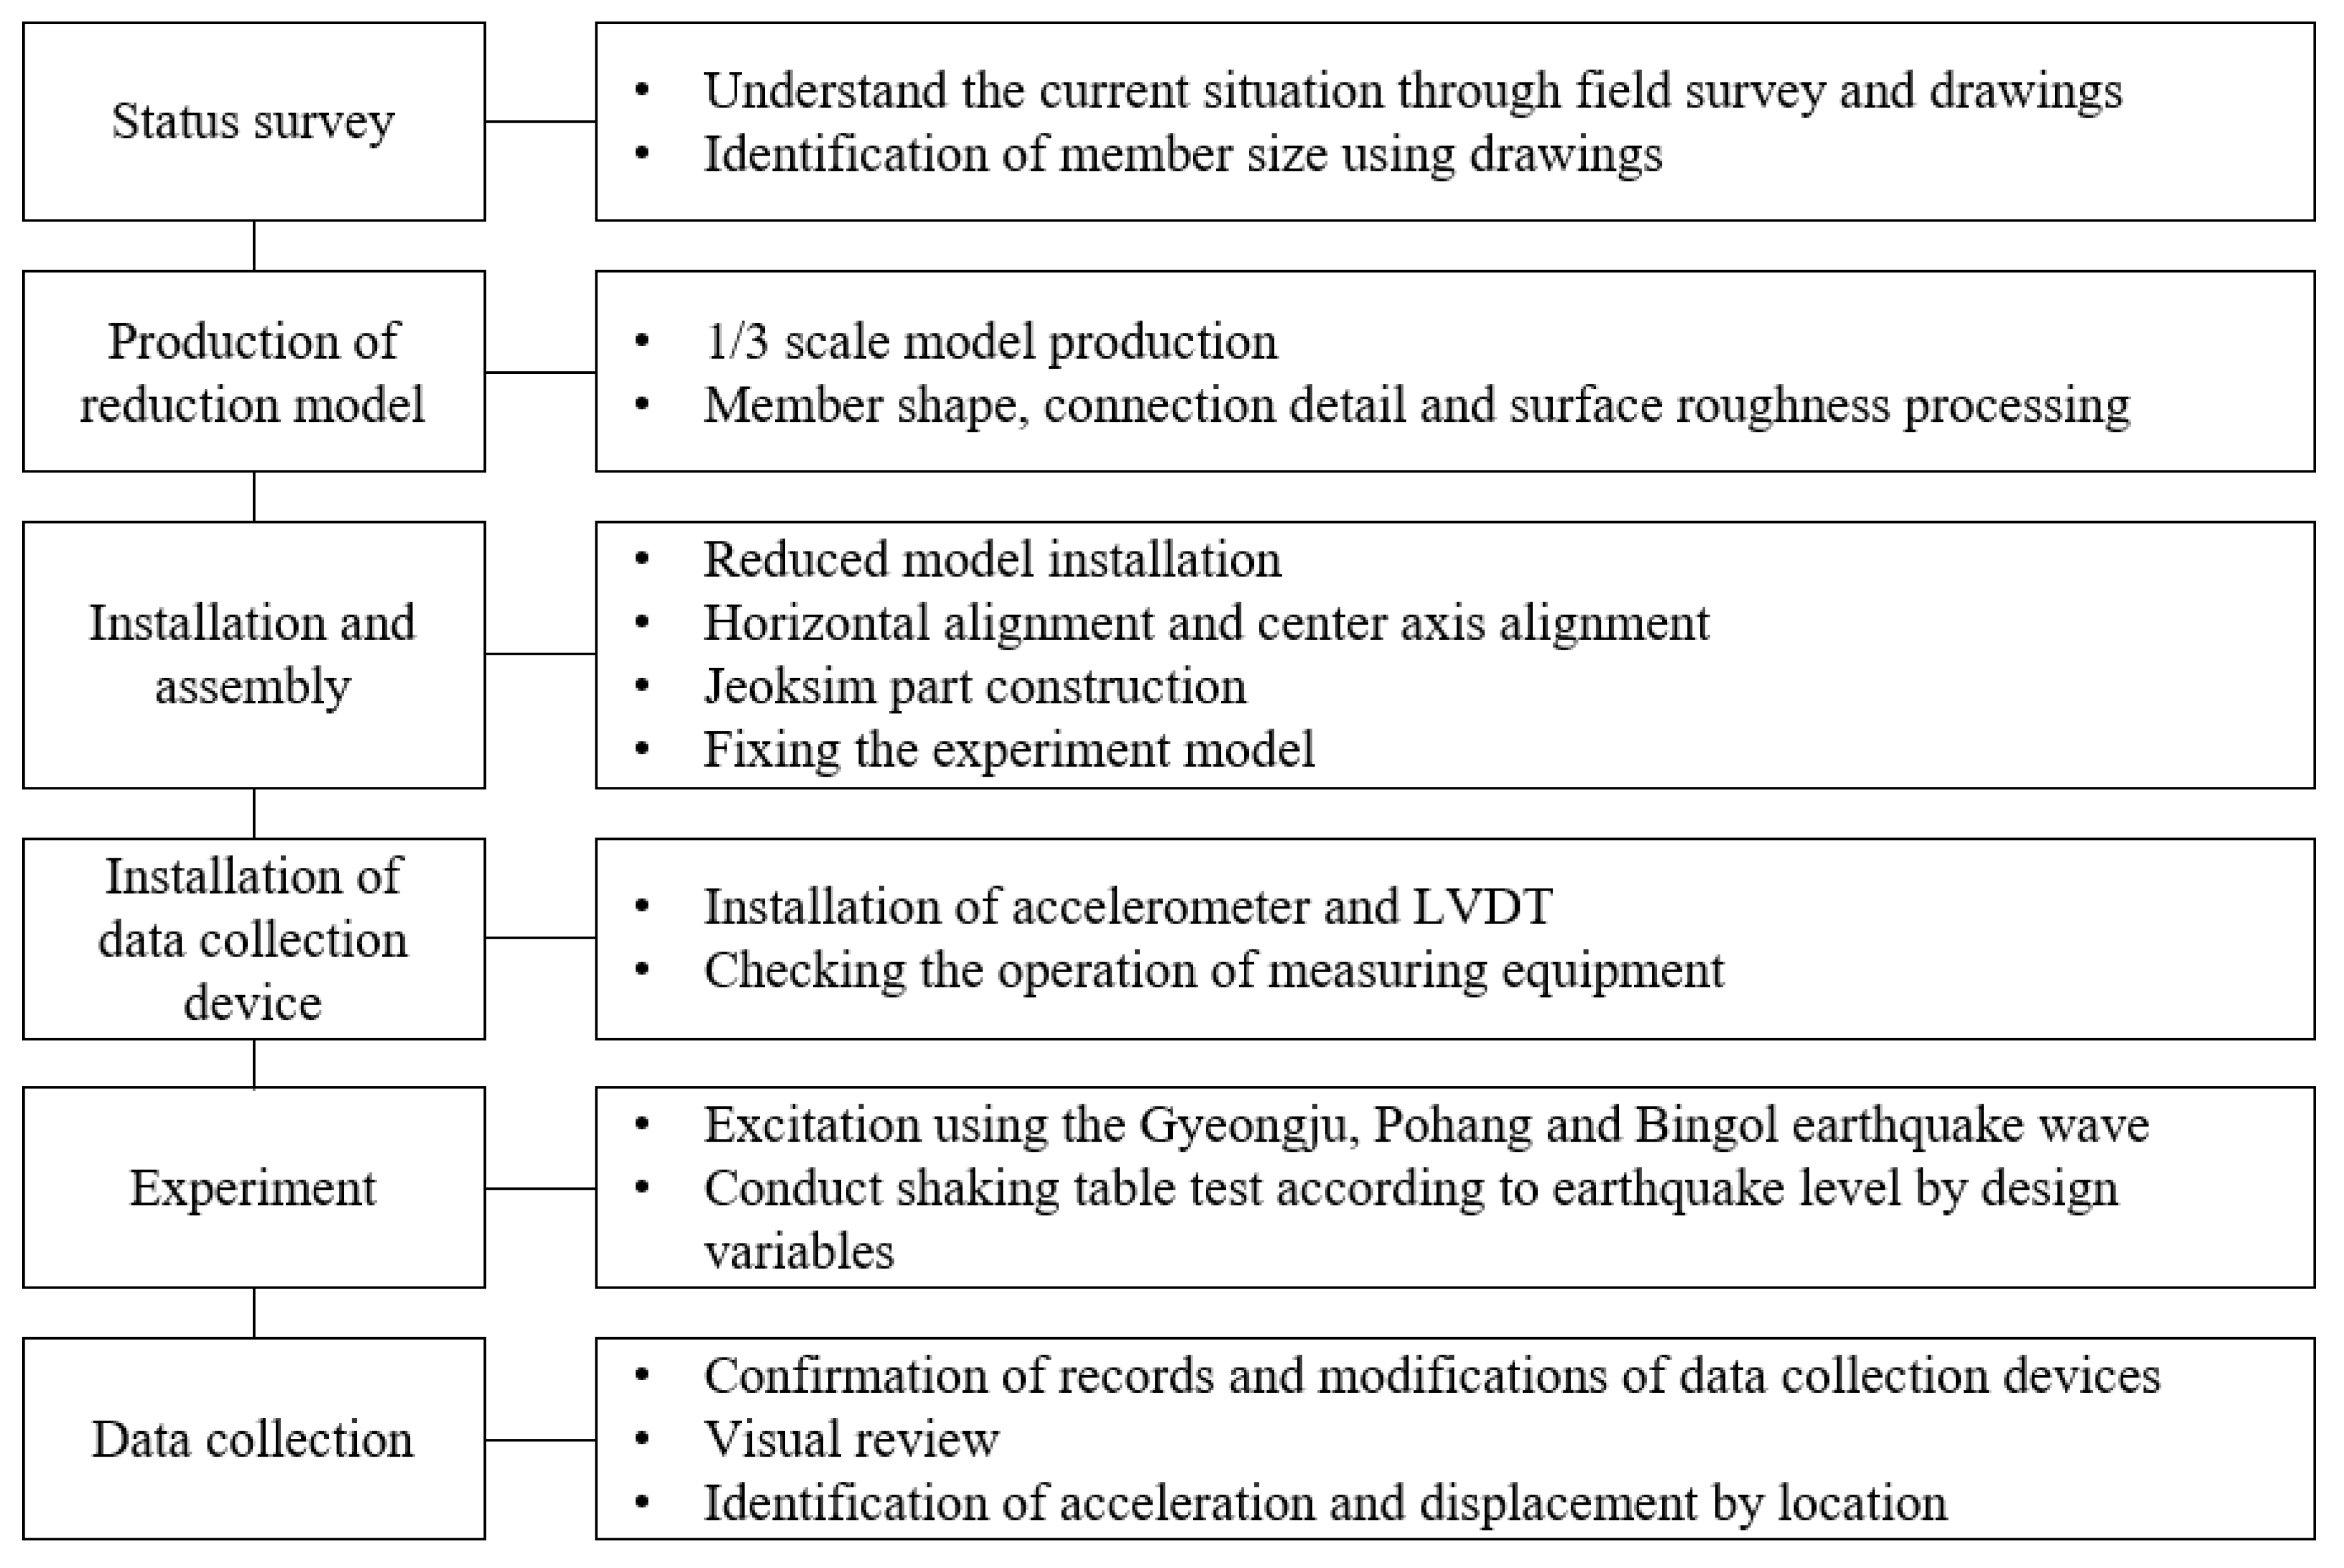
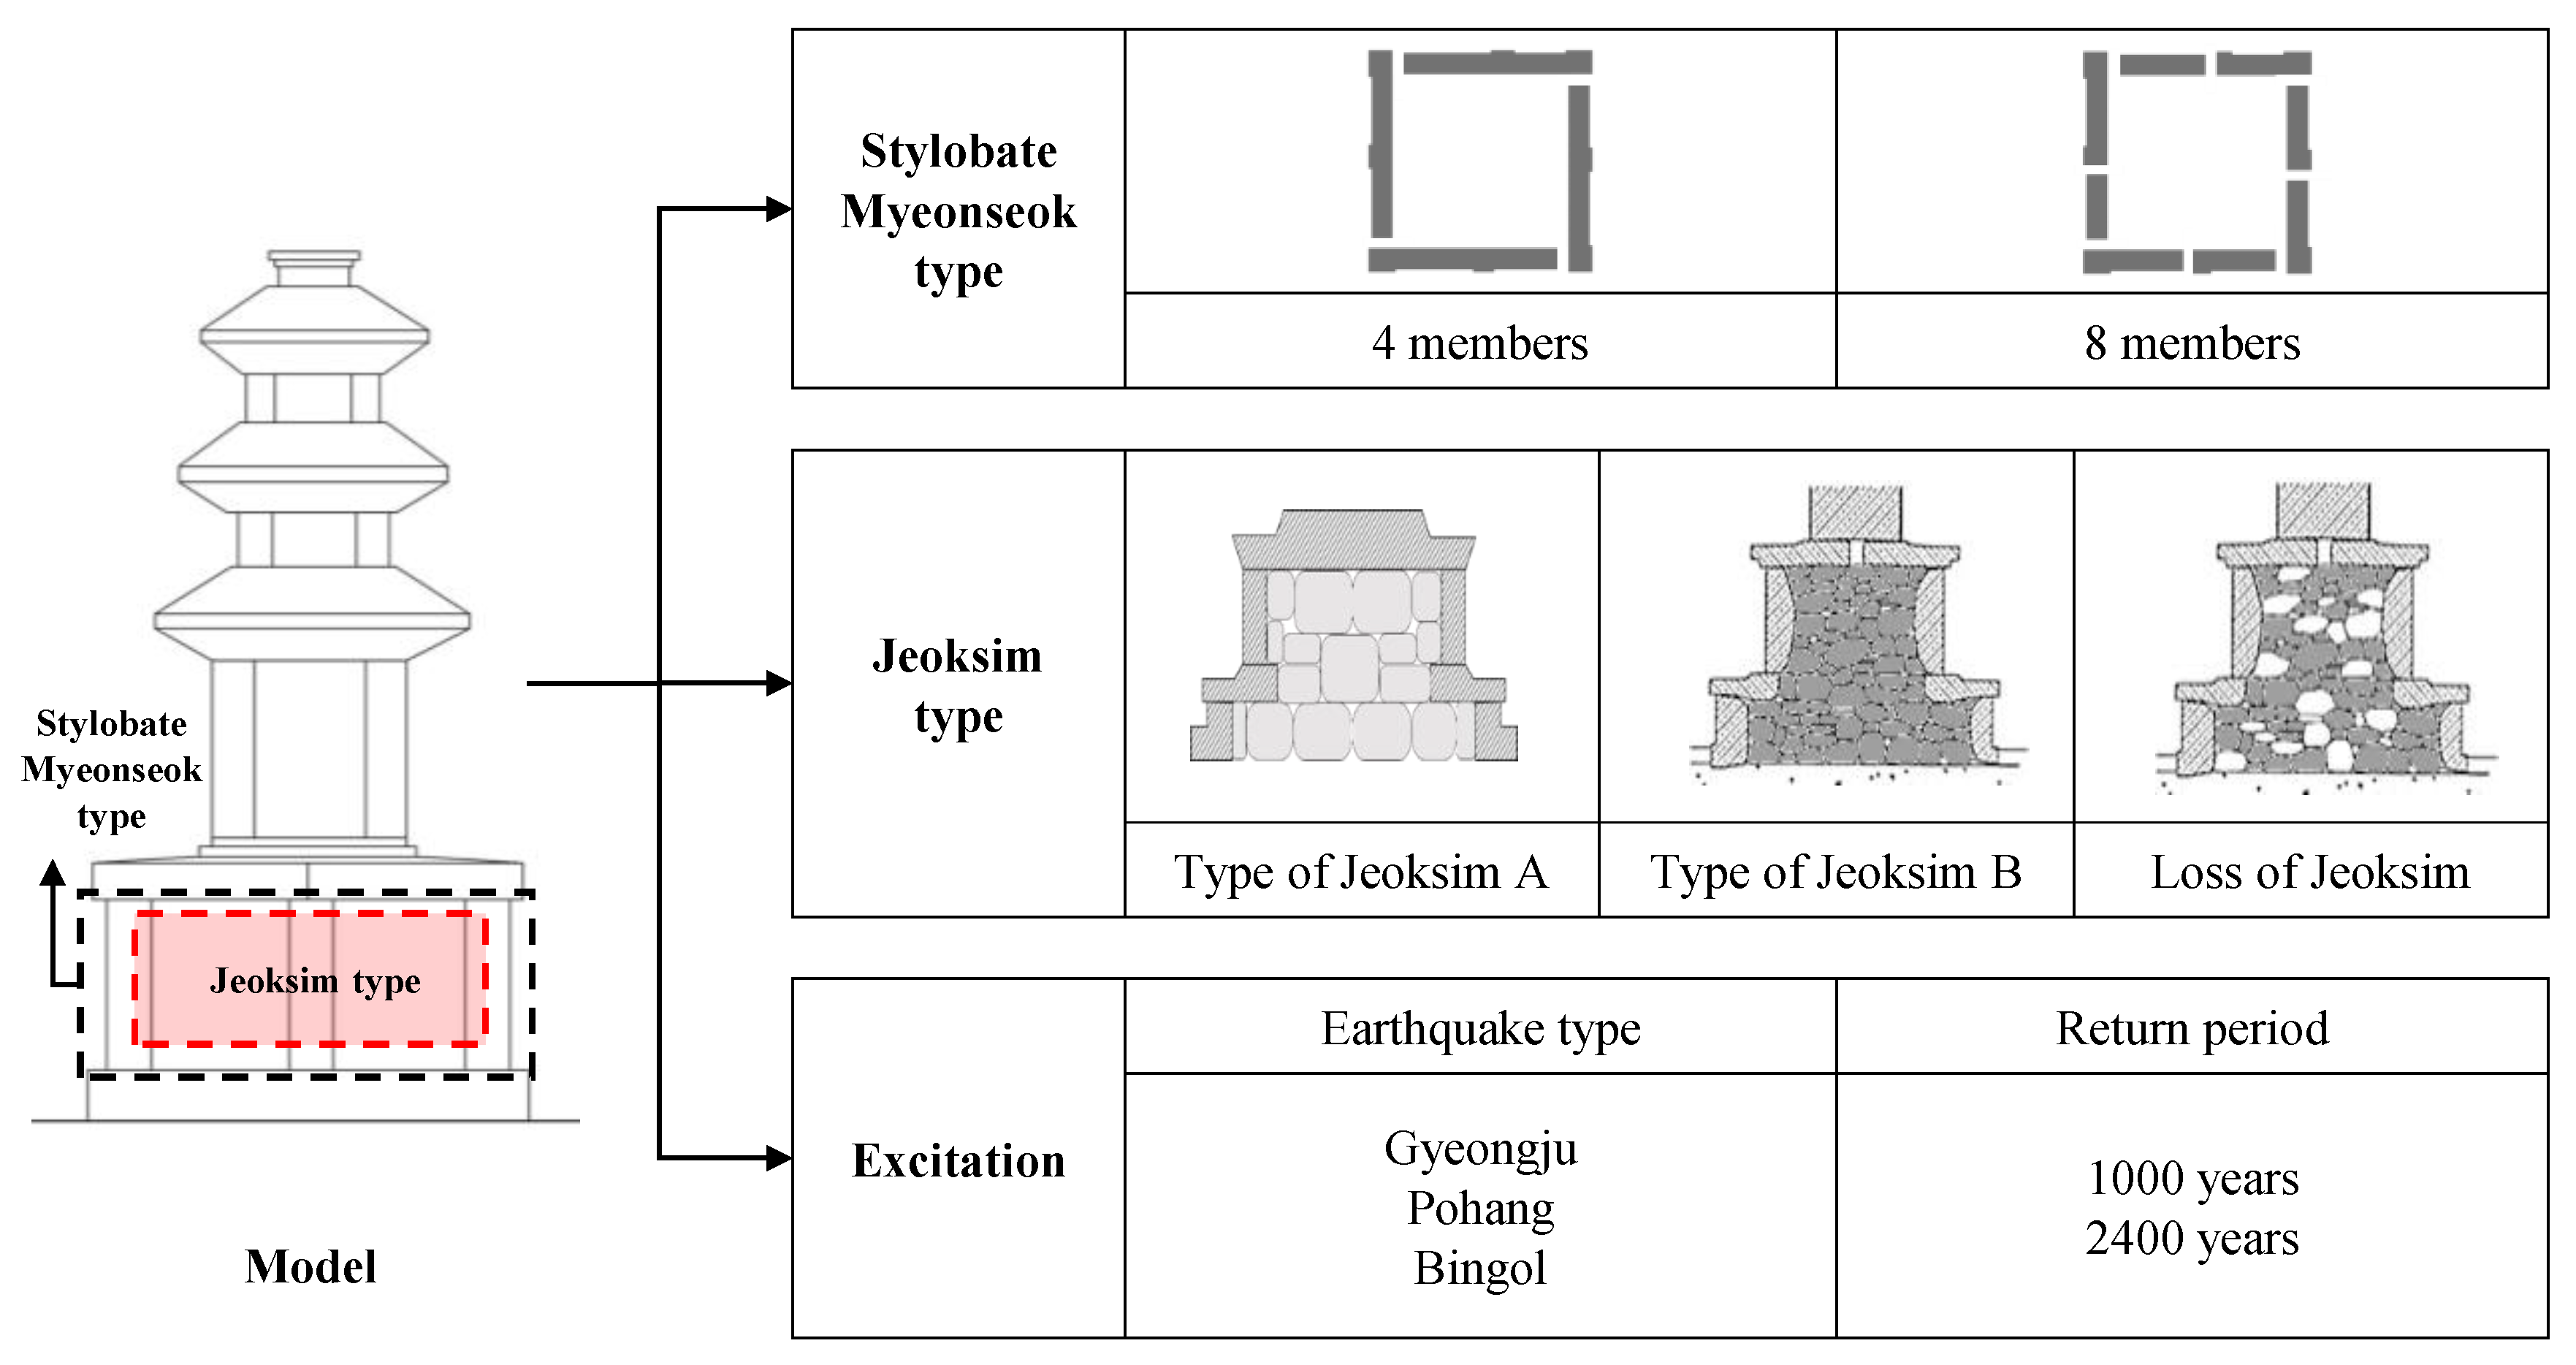
We used a shaking table to evaluate the seismic behavior of the three-story stone pagoda at the Cheollyongsa temple site, which was damaged by the Gyeongju and Pohang earthquakes. The member composition type and the “Jeoksim” type were included among the experimental variables. The seismic wave was based on the Bingol earthquake, which was similar to the design response spectrum of the Korean building seismic design standard (KDS 41 17 00; 2019) [14], along with the Gyeongju and Pohang earthquakes. Deformation, the effects of seismic frequency, the maximum acceleration, permanent displacement, rocking, and sliding were analyzed.
2. The Target Structure
The three-story stone pagoda at the Cheollyongsa temple site was severely damaged by the 2016 Gyeongju earthquake. The stone pagoda is 2.43 m wide and 7.24 m high (the decorative top starts at 4.8 m) and is a representative, single-stylobate stone pagoda of the late Unified Silla Dynasty. The stylobate is composed of 17 sheets, including the foundation stone, with the main body comprising 6 sheets (1 for each story), and the upper part comprising 16 sheets (Table 1) [15]. Figure 1 shows the elevation of the three-story stone pagoda at the Cheollyongsa temple site.
Table 1.
The three-story stone pagoda at the Cheollyongsa temple site.
Figure 1.
Views of the three-story stone pagoda at the Cheollyongsa temple site.
3. Experimental Overview
3.1. Production of a Scale Model
We built a 1/3 scale model of the stone pagoda using high-quality rock with similar strength, absorption properties, surface roughness, and member shape to the pagoda rock. This study used a shaking table with a size of 2 m × 2 m and acceptable weight of 50 kN. After examining the size and load of the specimen, it was reviewed that a 1/3 scale model was appropriate to install the specimen on the shaking table. The dimensions considering the similarity law of the specimen for a 1/3 scale model are shown in Table 2 [7,16], and the material properties are shown in Table 3. Here, is the scale factor of length. In this study, is 1/3 because a 1/3 scale model is applied. In addition, the scaling for volume and weight is .
Table 2.
Dimensions of the scale model of the stone pagoda based on the similarity law.
Table 3.
Material properties of stone.
To manufacture the experimental object as shown in Figure 2, large rocks were cut to size and processed according to the shape and size of each member. The processed members were finished according to the roughness of the three-story stone pagoda at the Cheollyongsa temple site, and the size and condition were reviewed. Finally, the scale model was assembled.
Figure 2.
Photographs showing the model production process: (a) photograph of the members; (b) cutting of the members; (c) manufacturing process; (d) review of the manufactured parts; (e) provisional model assembly; and (f) the final model.
3.2. The Shaking Table
A two-axis shaking table as shown in Table 4 was used (Hyundai Engineering & Construction Co., Ltd., Gyeonggi-do, Korea); the maximum load was 50 kN, while the maximum vibration was 1 g and the maximum stroke was 75 mm.
Table 4.
Shaking table specifications.
3.3. Method
The work plan is shown in Figure 3.
Figure 3.
Details of the shaking table tests.
It was important not to damage the model during transport or assembly. When assembling the model, all contact surfaces were levelled to ensure a good fit. The shaking table and model were directly connected to prevent the model from slipping. The input acceleration, time, stress, and force data by considering the similarity law for a 1/3 scale model are shown in Table 5 [7,16]. Here, is 1/3 as shown in Table 2. As gravity is the same regardless of the scale, 1.0 is applied. Time is calculated according to Equations (1) and (2), and the frequency is an inverse function of time, so it is .
Table 5.
The experimental conditions based on the similarity law.
3.4. Installation of Measurement Equipment
Installation locations of measuring equipment are shown in Table 6. Displacement gauge/accelerometer units were installed on the foundation stone (n = 1), Myeonseok (n = 2), Gapseok (n = 2), each main body stone and roof stone (all n = 1), and the decorative top (n = 1). All units were installed in the excitation direction, at the center of the member, and numbered.
Table 6.
Measuring equipment installation locations.
As shown in Table 7, displacements were measured using the displacement gauge with measurable displacement of ±75 mm, and accelerations were measured by connecting only one type channel with the 3-axis accelerometer.
Table 7.
Specifications for measuring equipment.
3.5. Experimental Variables
The pagoda models as shown in Figure 4 were classified as Jeoksim type A, Jeoksim type B, or loss of Jeoksim. Here, Jeoksim means soil and gravel surrounded by stylobate stones. Jeoksim A models were characterized by large, regularly stacked stones aligned along a central axis, and filled with soil and stone. The Jeoksim B model included irregularly stacked stones of various sizes compacted with soil. The loss of Jeoksim model was characterized by a partial loss of the stones in Jeoksim B type regions.
Figure 4.
Schematic of a pagoda model and experimental variables.
Table 8.
Model types.
Figure 5.
The Myeonseok and Gapseok: (a) Myeonseok included in models 1, 3, and 4; (b) Myeonseok included in model 2; and (c) Gapseok included in models 1–4.
3.6. Earthquake Waves
We modeled the waves from the Gyeongju earthquake (2016), Pohang earthquake (2017), and Bingol earthquake (2003), based on the KDS 41 17 00. The return periods were 1000 and 2400 years. Details of the simulated earthquakes are shown in Table 9.
Table 9.
Details of the simulated earthquakes.
The effective ground acceleration and ground conditions were considered by the KDS 41 17 00 [15]. The details of the input earthquake waves are presented in Table 10. The input order of earthquakes was determined by spectral accelerations of the response spectrum of each earthquake. Table 10 shows the input order from small to large earthquakes. Between the experiments, the accelerometer and displacement gauge were adjusted to zero, and relative displacements and cumulative displacements were measured.
Table 10.
Details of the earthquake waves.
4. Results
4.1. Deformation
The Myeonseok and Gapseok experienced the largest deformation; the main body of the stone pagoda was also rotated. Separation of the Myeonseok was minimal for models 1 and 2 (Jeoksim A; Figure 6a,b). However, for models 3 [Jeoksim B; Figure 6c] and 4 [loss of Jeoksim; Figure 6d], separation of Myeonseok 6 and 7, on the righthand side, was the main type of deformation. Myeonseok 7 protruded to the rear (east). Seismic waves were delivered from the left (north) and right (south); the Myeonseok stones on the left and right were able to resist the forces due to the presence of the upper structure, and thus showed minimal deformation. However, the front and rear Myeonseok stones at right angles to the excitation direction were pushed out by the lateral pressure, indicating that the binding effect of the upper load was weak. Therefore, Myeonseok deformation was closely related to Jeoksim type; more regular and stable Jeoksim arrangements were associated with less stylobate deformation. Figure 6e shows the cumulative displacements for all models.
Figure 6.
Images of Myeonseok deformation: (a) model 1; (b) model 2; (c) model 3; (d) model 4; and (e) cumulative displacement graph (for models 1, 3, and 4, displacement occurred between Myeonseok 6 and 7, and for model 2 displacement occurred between Myeonseok 3 and 4).
In addition, the first story of the main body of the tower was rotated counter-clockwise in models 1 and 3, while the second and third stories were rotated clockwise. All stories of the main body were rotated clockwise in model 2, and the first story of the main body in model 4. This result occurred because the loads acting on the tower differed by story. The roof stones tended to behave similarly to the main body stones.
The basic model 1 [Figure 7a] showed less deformation of the stylobate than models 3 and 4, but there was more rotational deformation of the tower body of model 1 than for the other models. For model 3 and model 4 [Figure 7c,d], the Jeoksim type and stylobate deformation affected the deformation of the tower body. In model 2 [Figure 7b], in which four sheets of Myeonseok were affected, the generally stable stylobates reduced overall tower body deformation. Figure 7e shows the cumulative rotation angle of the first-story main body stone.

Figure 7.
Images showing the deformation of the main body stone in the various models: (a) model 1; (b) model 2; (c) model 3; (d) model 4; and (e) cumulative rotation angle of the first-story main body stone.
In summary, tower body deformation was affected by member configuration and the Jeoksim type. The first-story main body stone is more slender than those of the second and third story, and therefore exhibited rotational deformation caused by rocking.
4.2. Frequency Analysis
The frequency data for all models are shown in Table 11 and Figure 8. Frequency can be analyzed based on the acceleration response spectra or by using the amplification function of the measured accelerations. However, for a stone pagoda, if frequencies are calculated using only the acceleration response spectra method, the values may be inflated, for example by rocking. Thus, we analyzed frequencies using both methods. Frequency is related to stylobate stiffness; reduced frequency means change or a decrease in stiffness. The Bingol earthquake reduced stiffness more than the Gyeongju and Pohang earthquakes. For model 4, most seismic waves were very low frequency, because stylobate stiffness was reduced by the loss of Jeoksim. For model 3, the frequency with a return period of 1000 years was lower than for the other models, while with a return period of 2400 years, the frequency was similar to that of model 1. The frequency of the waves was higher for model 1 than models 3 and 4 over the short return period; for the longer period, the behavior was similar to that of model 3. As the return period increased, the frequency decreased sharply, attributable to the rocking of the first story of the main body stone. Overall, model 2 was the least damaged.
Table 11.
Frequency data for the four stone pagoda models.
Figure 8.
Frequency graphs for the four stone pagoda models.
4.3. Maximum Acceleration
Large changes in maximum acceleration were measured with a return period of 2400 years rather than 1000 years. The acceleration data for all models are shown in Table 12. For model 1, as the return period increased, the maximum acceleration also increased slightly, particularly for the decorative top and the Gapseok. Acceleration did not differ significantly among the other parts of the stone pagoda. The high acceleration at the decorative top was reflected in severe rocking, where the members are light in this part of the stone pagoda and the contact surface is unstable. Model 2 was similar to model 1, but the maximum acceleration was slightly lower. The discontinuous surface area of model 2 (four sheets of Myeonseok) was smaller than that of model 1 (eight sheets), and the resistance to seismic load was accordingly higher. For model 3 (Jeoksim type B), the stylobate stiffness was relatively low compared to the Jeoksim type A models, but the maximum acceleration did not differ significantly. This is because the weight of the stone pagoda structure was mainly supported by the Jeoksim, so the seismic load was concentrated in the Jeoksim part. Maximum acceleration was not significantly measured in the Myeonseok or Gapseok. For model 4, the acceleration of both the Myeonseok and Gapseok was low due to their discontinuous surfaces, in turn caused by the loss of Jeoksim. Furthermore, the surface contact areas of the Myeonseok and Jeoksim were smaller than in models 1 and 3. When comparing the behavior of the Myeonseok between models 4 (loss of Jeoksim) and 3 (Jeoksim type A), maximum acceleration was lower in model 4 because of the reduced lateral pressure exerted on the Myeonseok (in association with the lack of Jeoksim). Also, the maximum acceleration of the upper members (first and second story of the main body and roof stones, third story of the main body stone) was lower than that of the other models. This occurred because seismic energy was dissipated toward the top, and mainly deformed Myeonseok when stiffness was low because of the loss of Jeoksim.
Table 12.
Acceleration data for all stone pagoda models.
4.4. Permanent Displacement
The permanent displacement data for all models are shown in Table 13. In model 1, permanent displacement of the first story of the main body stone was largest for the Bingol earthquake simulation; the stone was significantly rotated by rocking. For model 2, the overall displacement was not large. In most of the simulations, Myeonseok and Gapseok displacement did not occur. In model 2, the seismic load was relatively large due to the short vibration period. However, earthquake resistance was high due to the small discontinuous contact surface, so no permanent displacement occurred. For models 3 and 4, no obvious displacement of Myeonseok or Gapseok was evident; any displacement of Myeonseok stones was perpendicular to the direction of deformation. Stylobate deformation was significant (2.5~20 mm) on the y-axis, due to the separation of Myeonseok, but not on the x-axis. Stylobate stiffness was lower when there was no Jeoksim, which greatly increased stylobate deformation.
Table 13.
Permanent displacement data of the stone pagoda models.
4.5. Rocking
When only vertical loads were applied to the unit member, the forces were compressive [Figure 9a] [17]. When the moments acted with the vertical loads, the load distributions were as shown in Figure 9b. As the moments increased, the load distributions changed [Figure 9c]. When the compressive stress was zero on the left side and reached its maximum value on the right side, a critical state without uplift developed. The moment in this state is the moment of the resistance force. In a triangular load distribution, the load was applied at 1/3 of the member width (Lf); the distance from this point to the centroid was 1/6 of the member width. The moment resistance (overturning moment) of each member is given by Equation (3). The calculation of the overturning moments is shown in Figure 10.
where W is the total weight between the upper and lower members, is the width of the contact surface of the bottom member, i is the top member number, and n is the member number.
Figure 9.
Limitations on the uplift of members: (a) initial state; (b) elastic state prior to uplift; and (c) elastic state at uplift.
Figure 10.
Calculation of the overturning moments.
The rocking analysis revealed that the moment resistance of the decorative top was very low, because the weight and area of the contact surface were very small compared to those of the other parts of the stone pagoda. However, for the slender first-story main body stone, the overturning moment greatly exceeded the moment resistance, and rocking occurred. Rocking over time for all models is shown in Table 14. We found no significant difference in the time of rocking occurrence between models 1 and 2. However, for model 2, the maximum overturning moments of stories 1 and 3 were smaller. For the first-story main body stone, the probability of rocking was higher for model 1 than model 2. Therefore, resistance to overturning was lower when there were eight rather than four sheets of Myeonseok. For models 3 and 4, stylobate stiffness was lower than for model 1; upper-story shearing and the overturning moments decreased because vibration energy was dissipated by deformation of the stylobates.
Table 14.
Rocking over time in the various stone pagoda models (return period 2400 years; Gyeongju earthquake).
4.6. Sliding
The critical horizontal forces required for sliding are shown in Figure 11. Here, P is the vertical force acting on a block, H is the horizontal force, W is the weight, is the displacement, µ is the friction coefficient of the contact surface, is the horizontal force when sliding occurs, is the horizontal stiffness, and is the displacement when sliding occurs. The normal force (P) acting on a block is the sum of the weights of the members above the block. Here, the weight of the tower body is the same in all models. Sliding occurs when the story-shearing force exceeds a critical value. However, as µ varies by the contact surface, it is difficult to estimate. We considered that sliding occurred when the maximum story-shearing force exceeded the horizontal force derived using a µ value of 0.6.
Figure 11.
The critical horizontal force (Hs).
Table 15 shows the sliding data for all models. The decorative top is very light and is not subjected to any loading force; thus, it slid during all earthquake simulations, for all return periods. In addition, as the µ value of 0.6 was exceeded by more members during the Bingol earthquake than the other earthquakes, it was associated with more sliding. For models 1, 2, and 3, sliding was mostly confined to the decorative top and third-story roof stone, while for model 4, only the top slid for the return period of 2400 years. In most models, sliding was reduced in lower regions because the self-weights and vertical loads increased sliding resistance.
Table 15.
Sliding data for all stone pagoda models.
4.7. Countermeasures of Vulnerable Parts
Three types of damage were investigated in this shaking table test. First, in stylobate, as the input earthquake increased, Myeonseok and Gapseok stones were separated and protruded. These deformations caused the loss of Jeoksim in the stylobate and resulted in the structural instability of the stone pagoda structure. In order to reduce the damage on stylobates, steel connectors in Figure 12a, or reinforcement of Jeoksim by adding a binder in Figure 12d, can be used to reduce the separation.
Figure 12.
Reinforcement example of vulnerable parts: (a) insert steel connector; (b) installation of doweled joints; (c) processing roughness; (d) reinforcement of Jeoksim; (e) installation of steel bar; (f) installation of binder.
Second, the rocking of the 1F main body stone was investigated. The rocking effect due to the slenderness of the member might cause the overturning of a stone pagoda. When a stone pagoda is newly constructed, the slenderness of the member might be considered. However, when an existing stone pagoda is restored, installing doweled joints or vertical steel connectors between the members in Figure 12b,e can prevent the rocking and overturning.
Third, the sliding of the upper member was investigated. Because the vertical load on the bottom of the upper member was small, the friction resistance on the sliding decreased and the upper member was horizontally moved. Processing roughness on the contact surface or installing a binder on the contact surface in Figure 12c,f can be used to increase the friction of contact surface and to prevent the sliding.
5. Conclusions
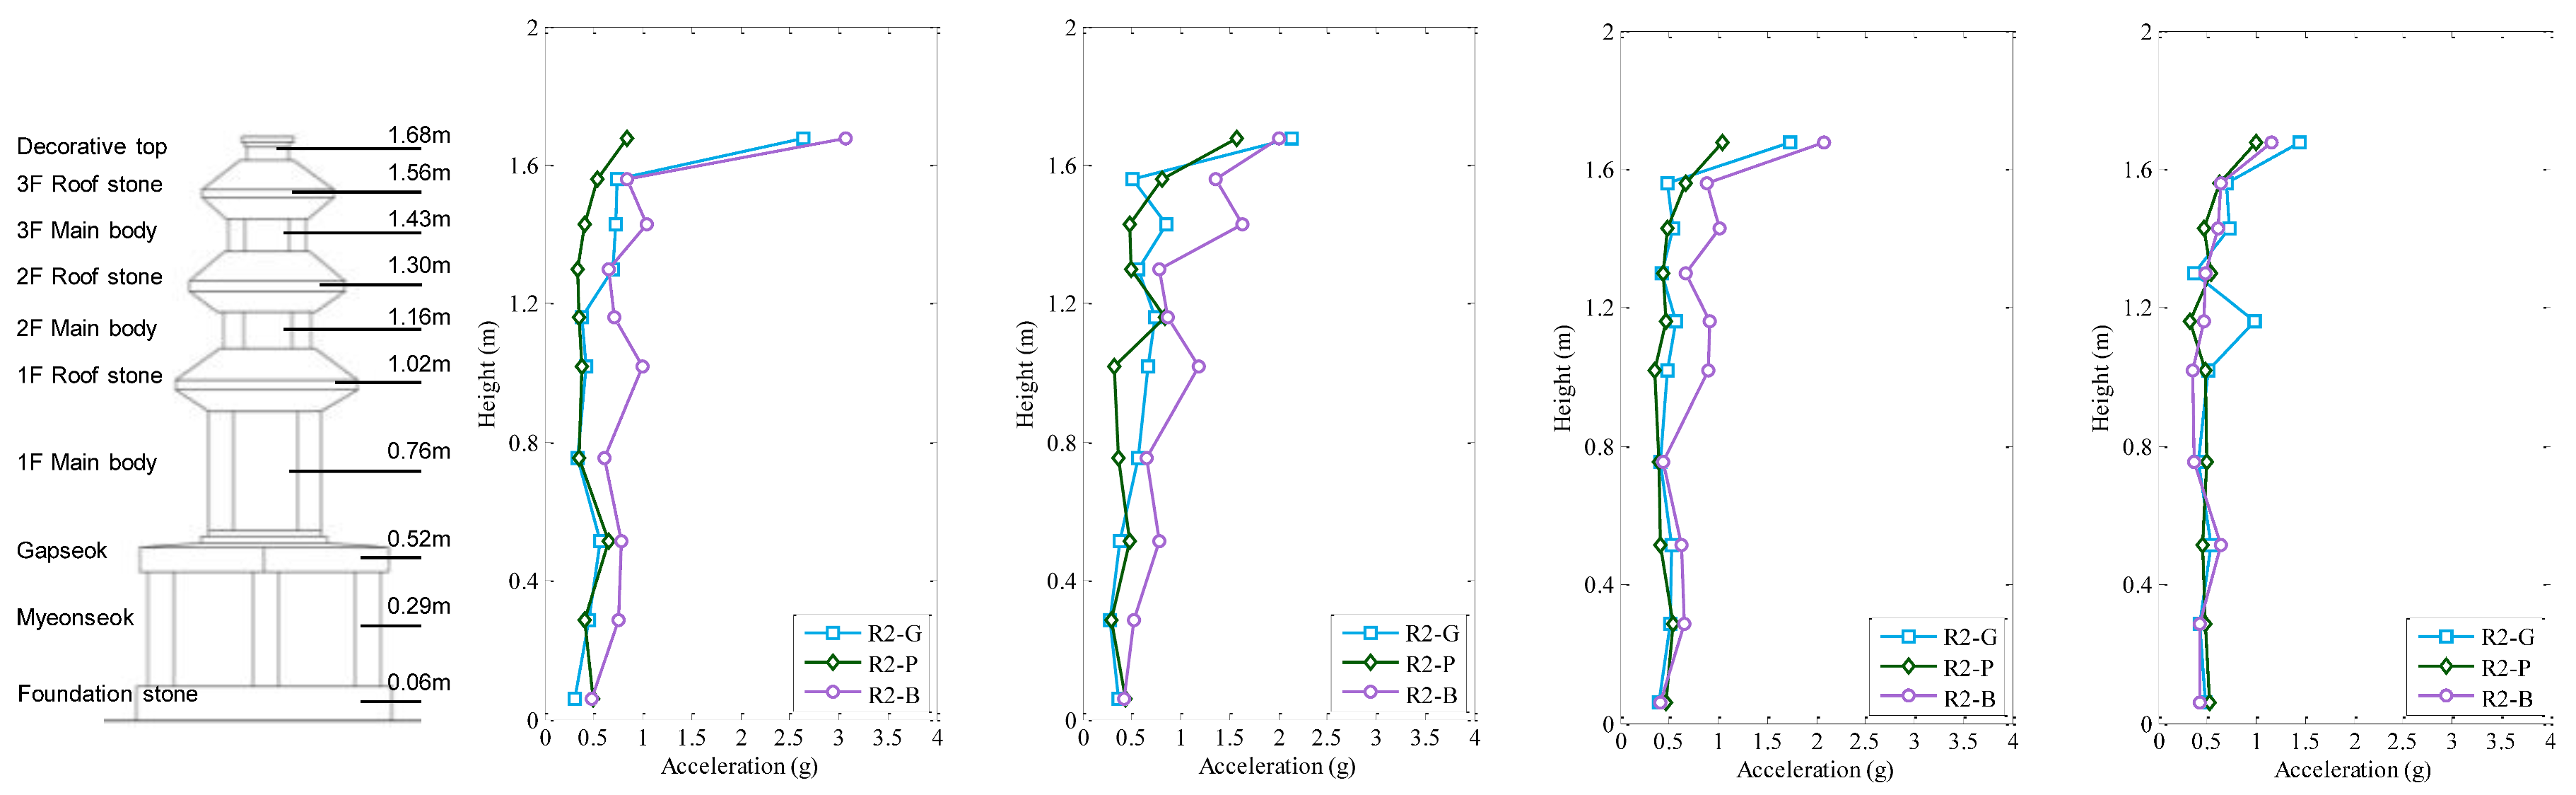
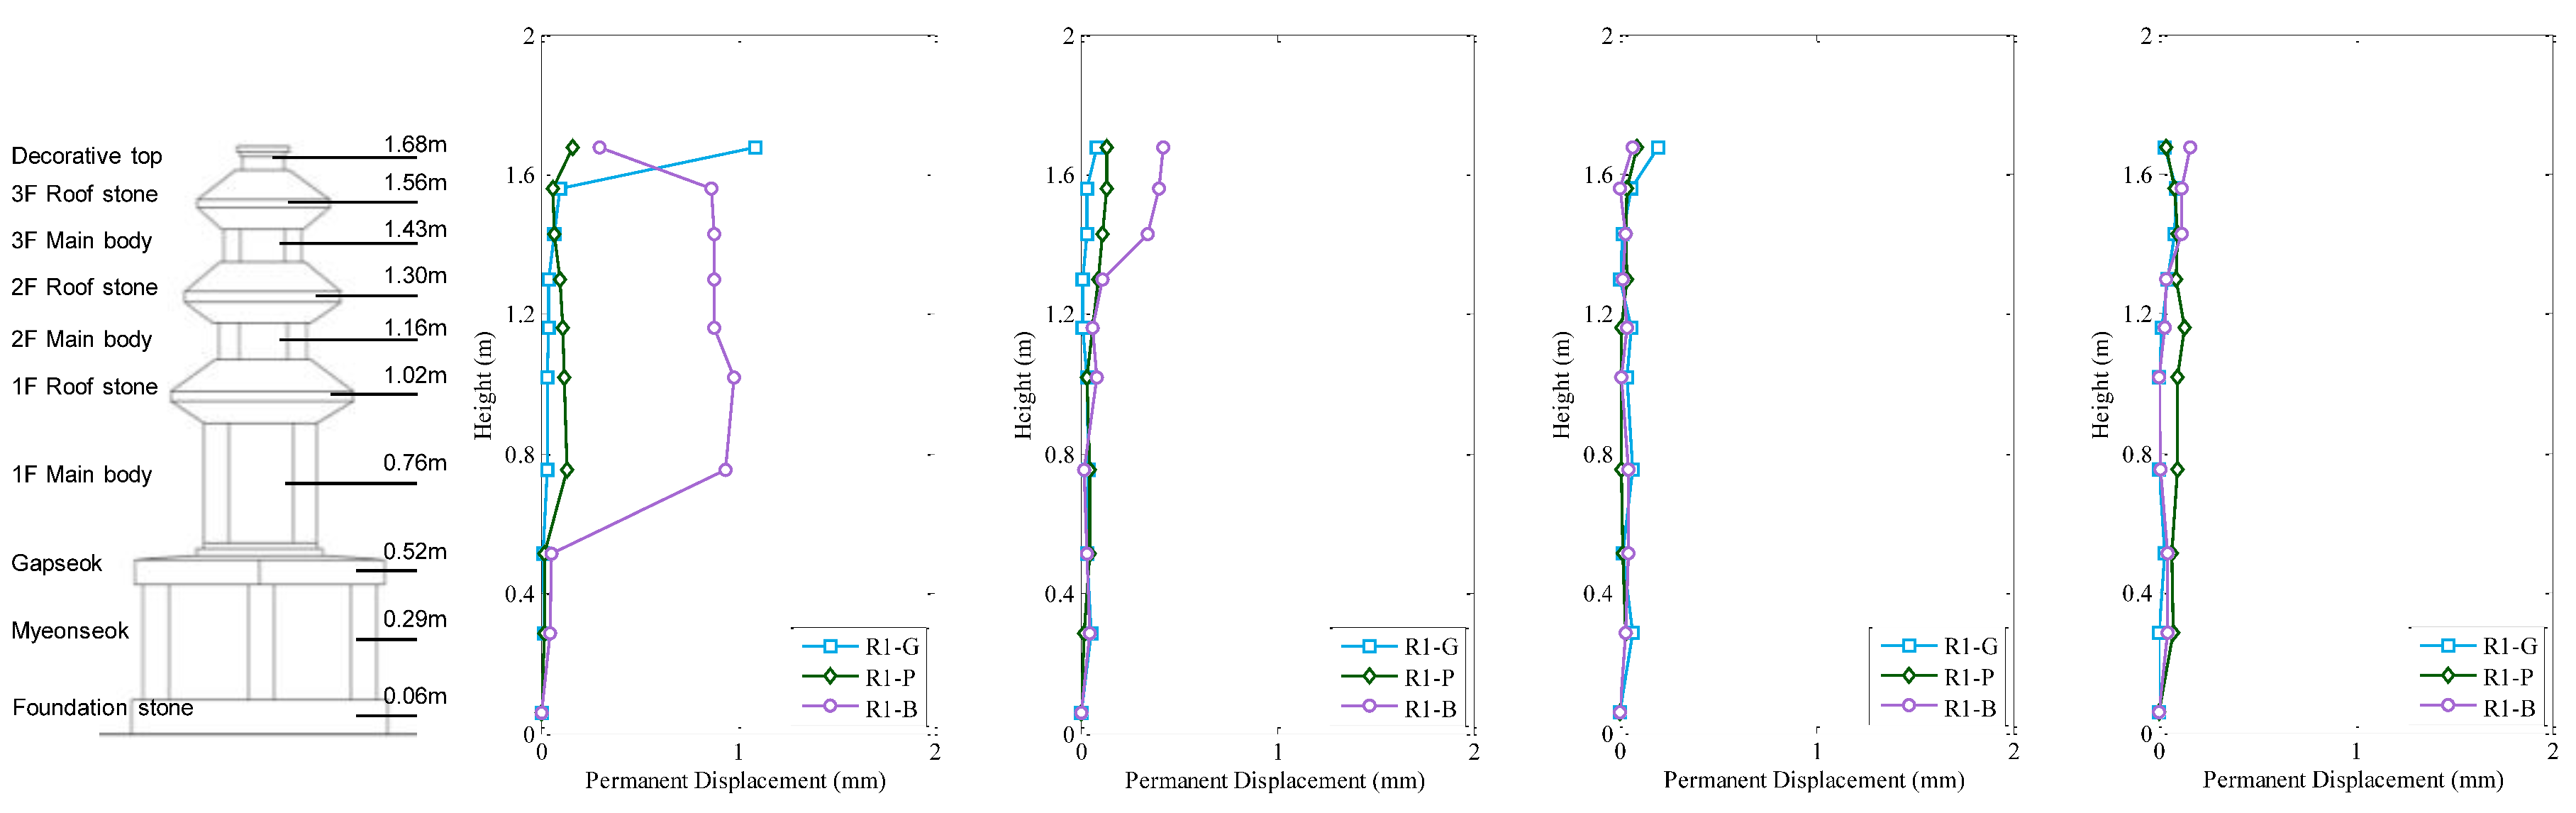
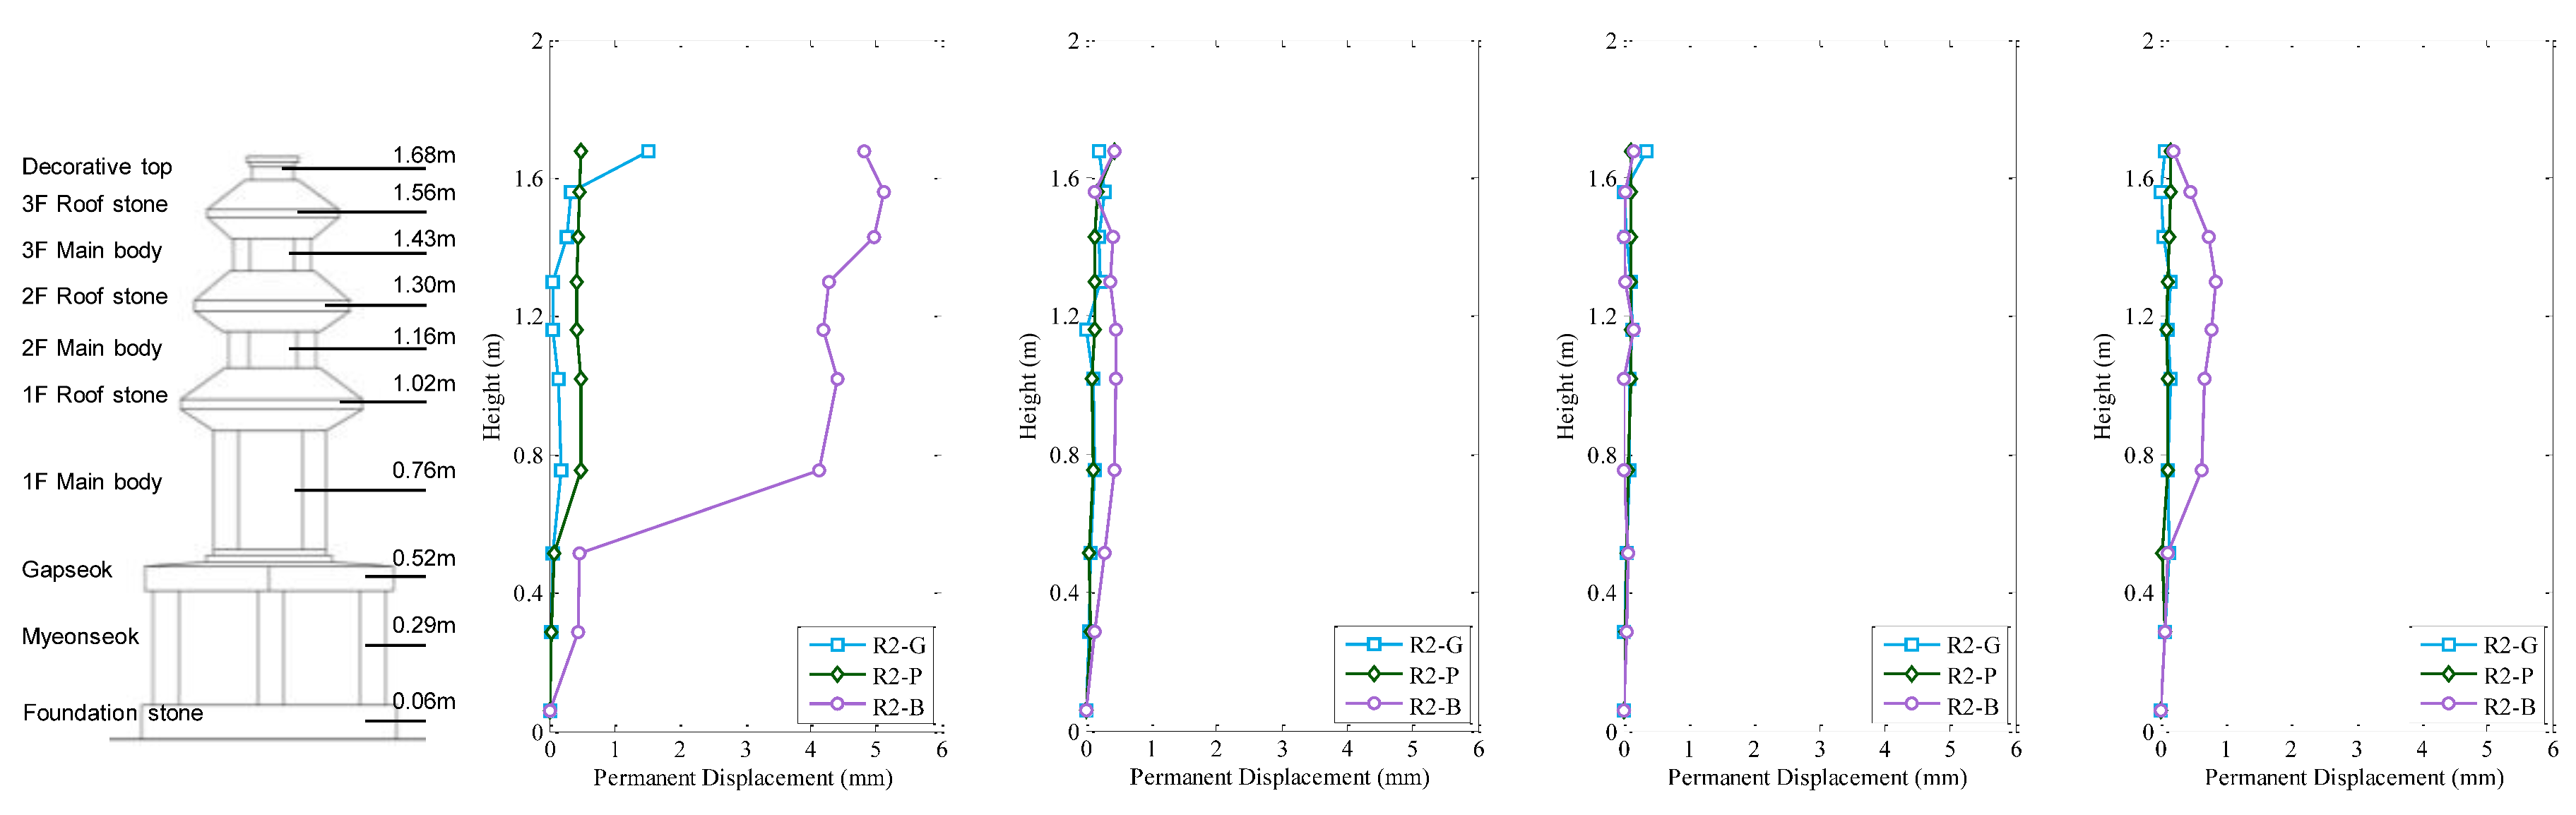
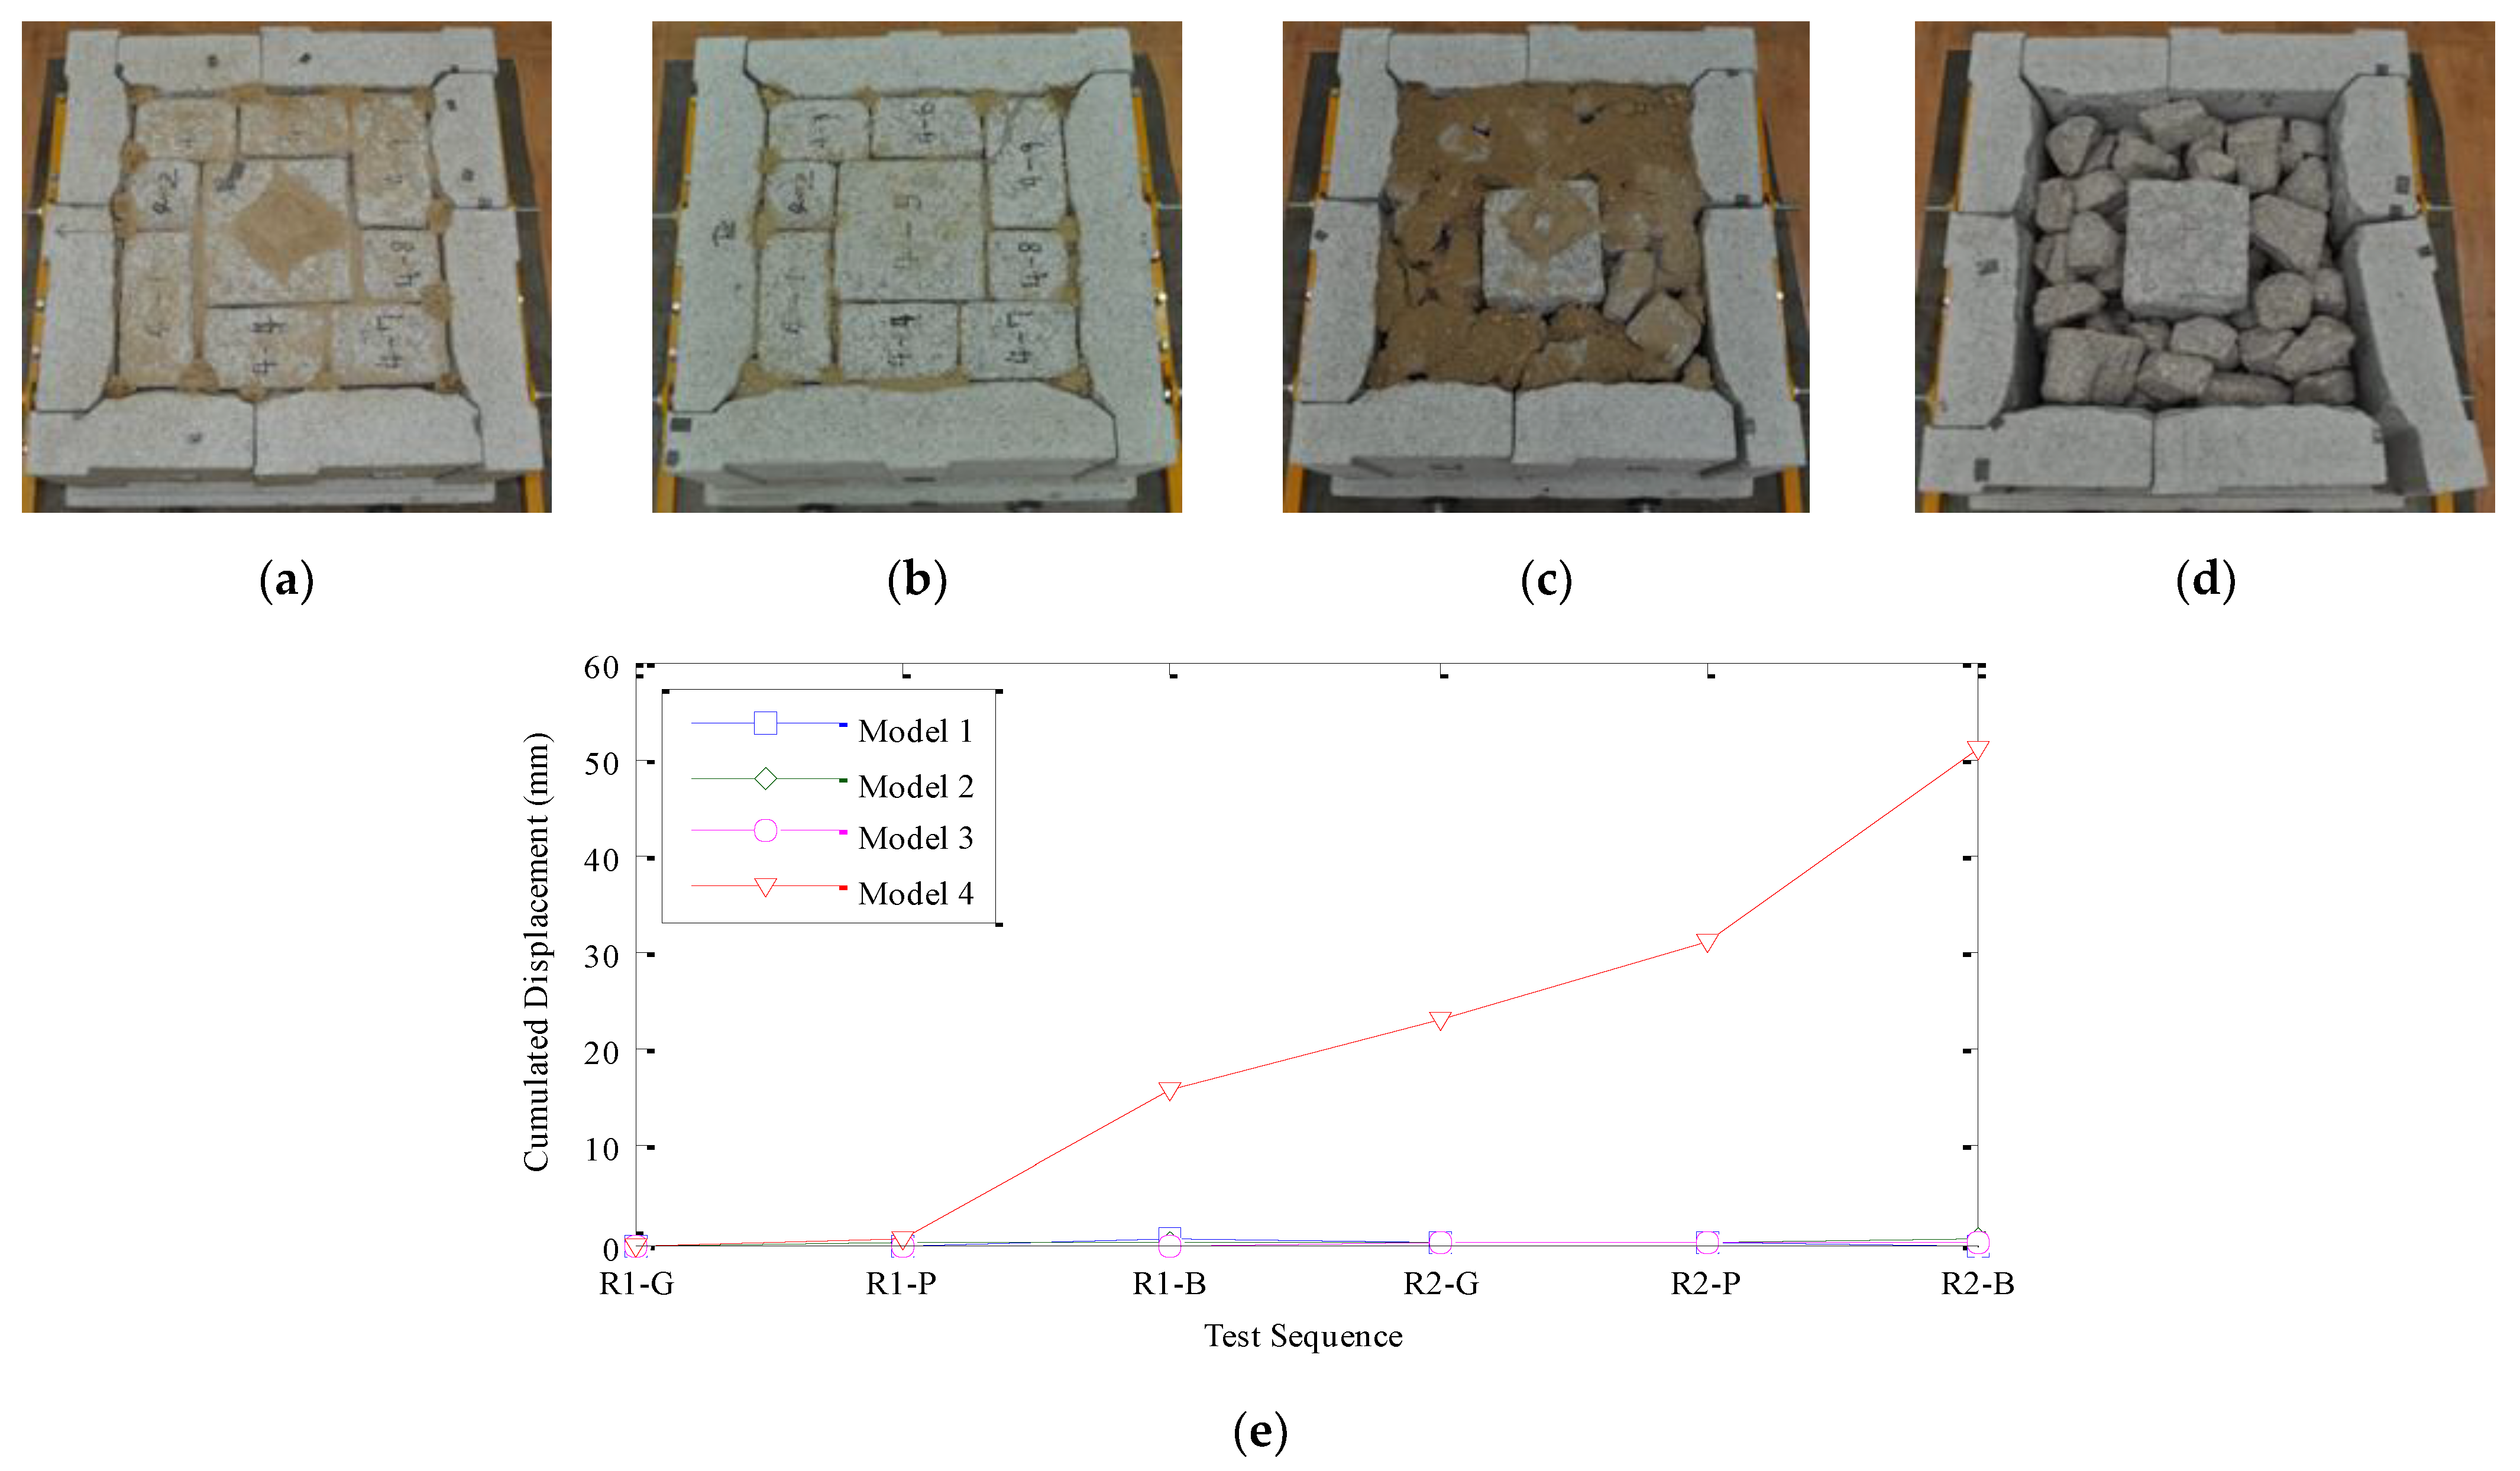
We analyzed the seismic behavior of a 1/3 scale model of the three-story stone pagoda during earthquake simulation performed using a shaking table test. Deformation, maximum acceleration, permanent displacement, rocking, and sliding were evaluated.
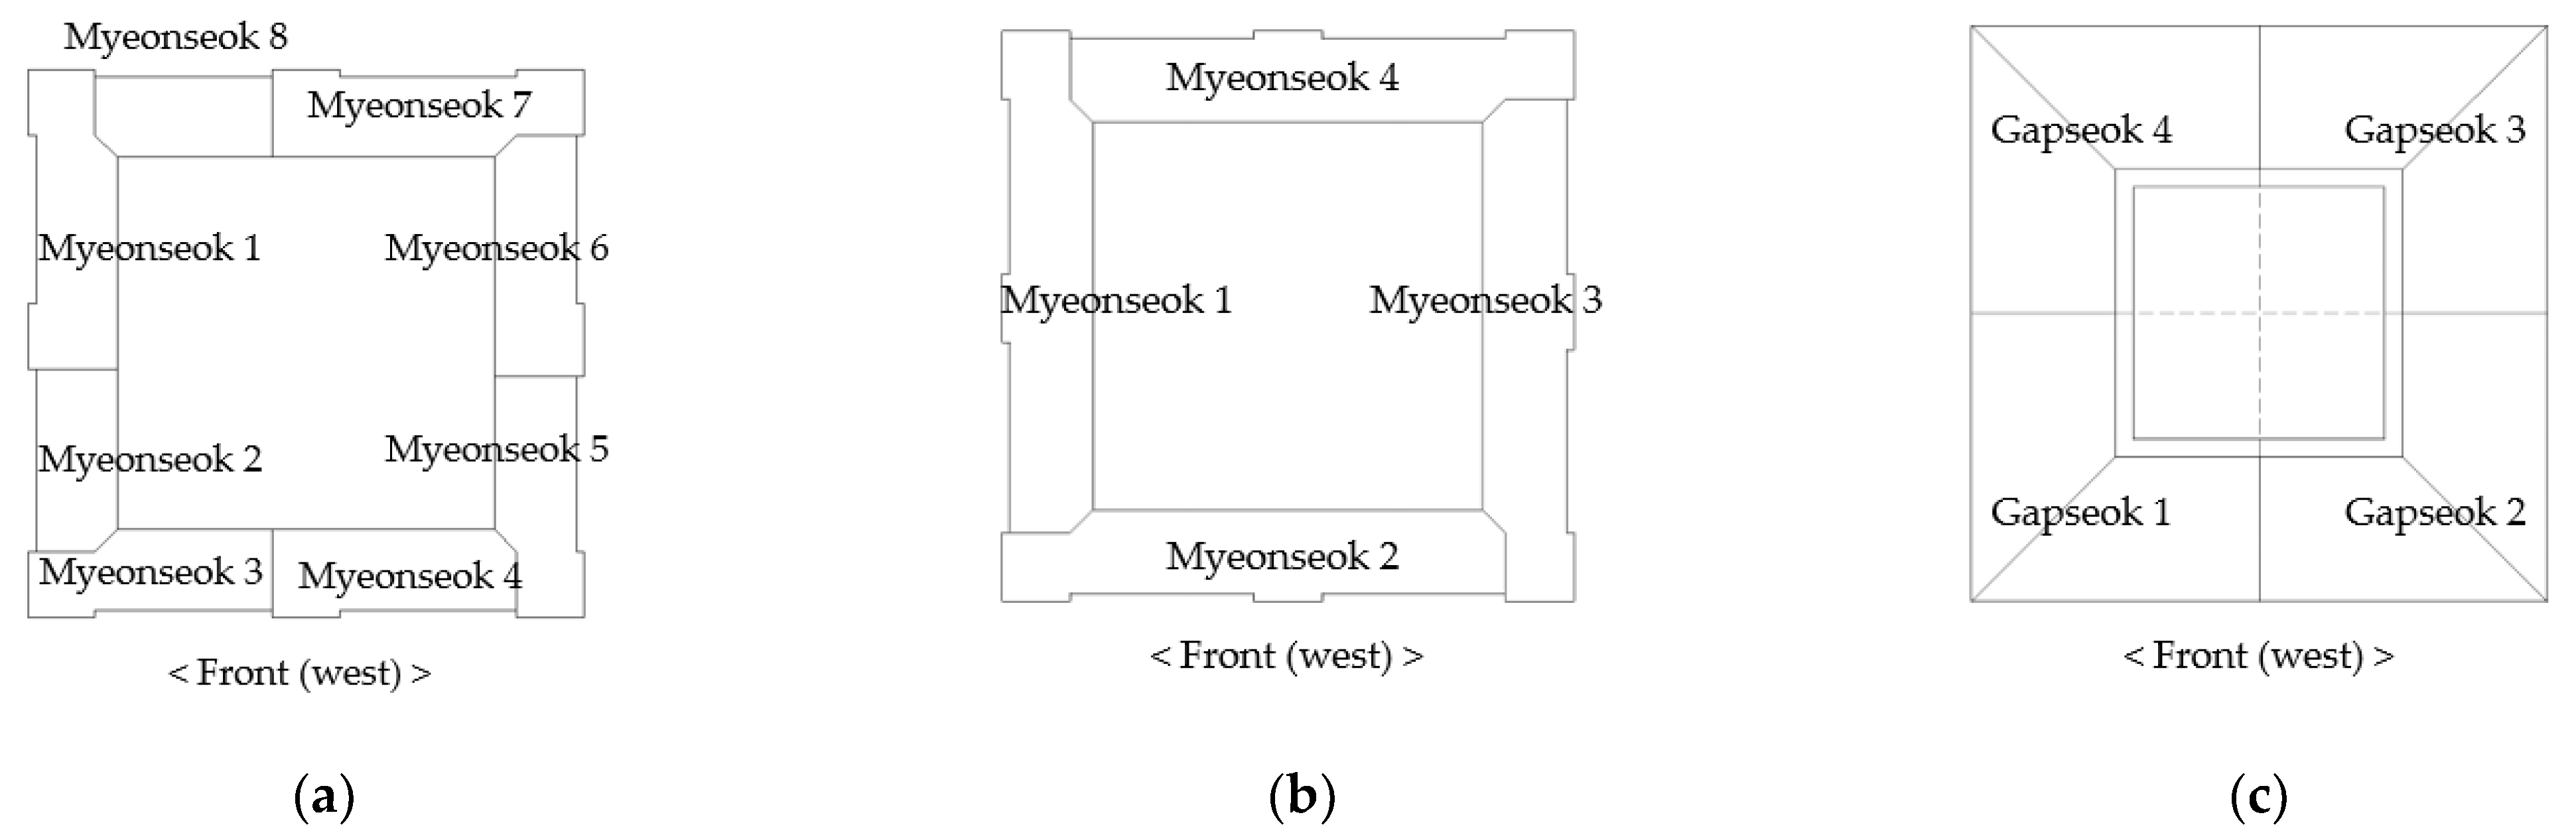
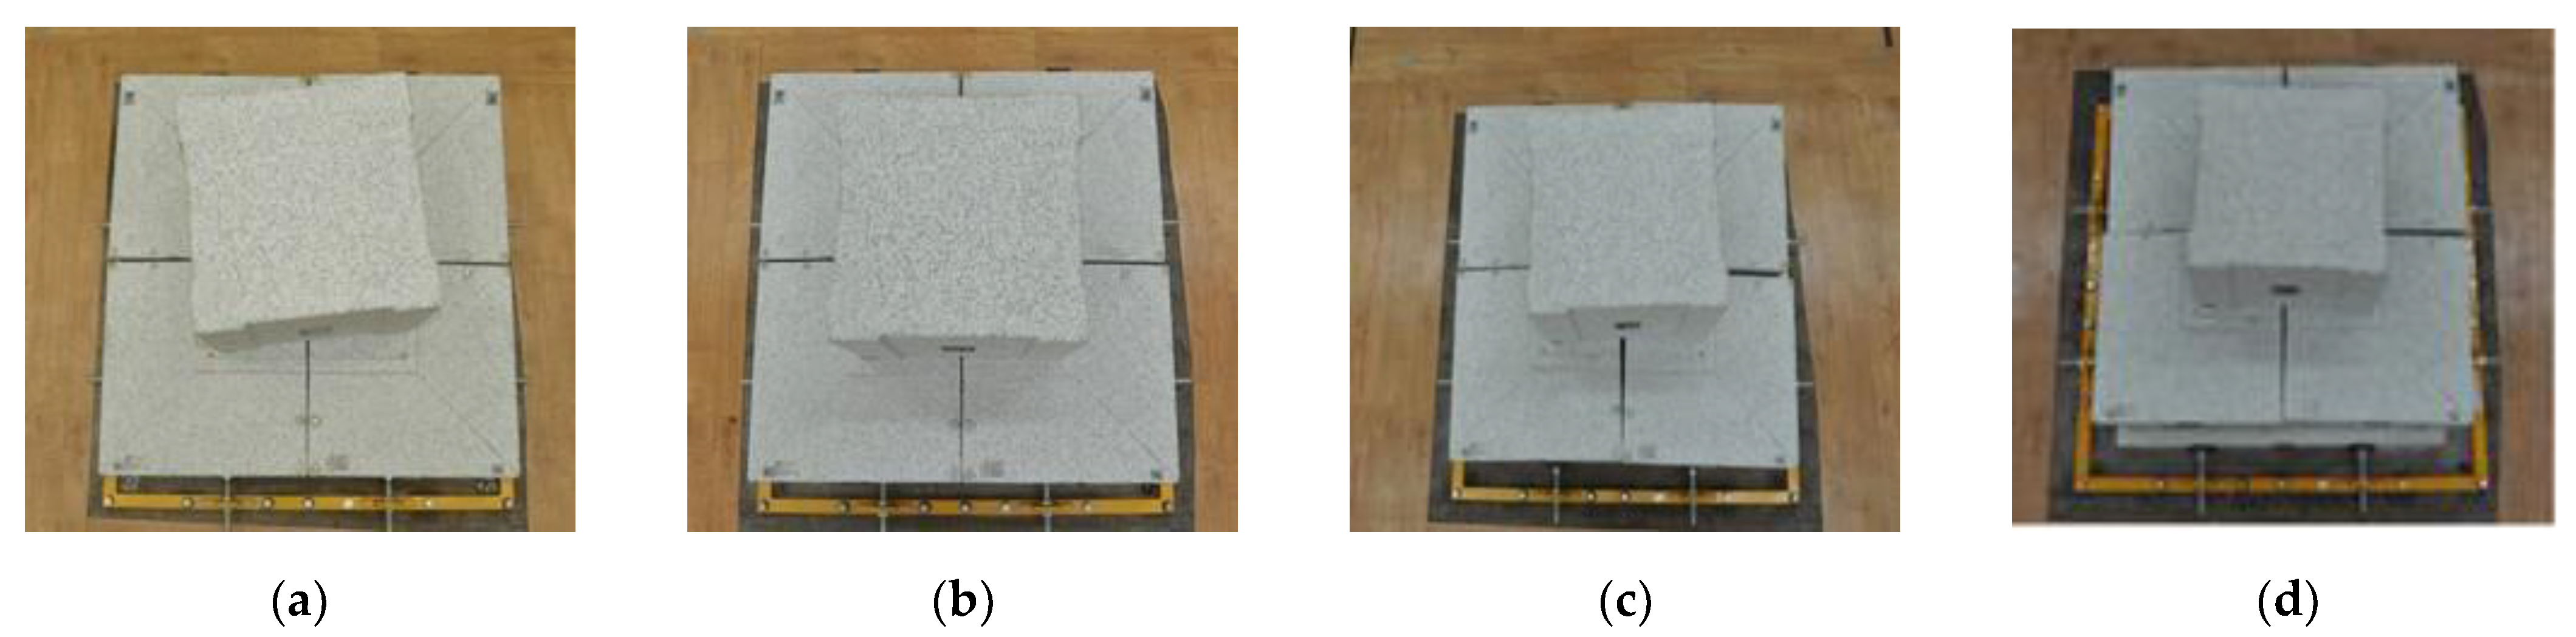
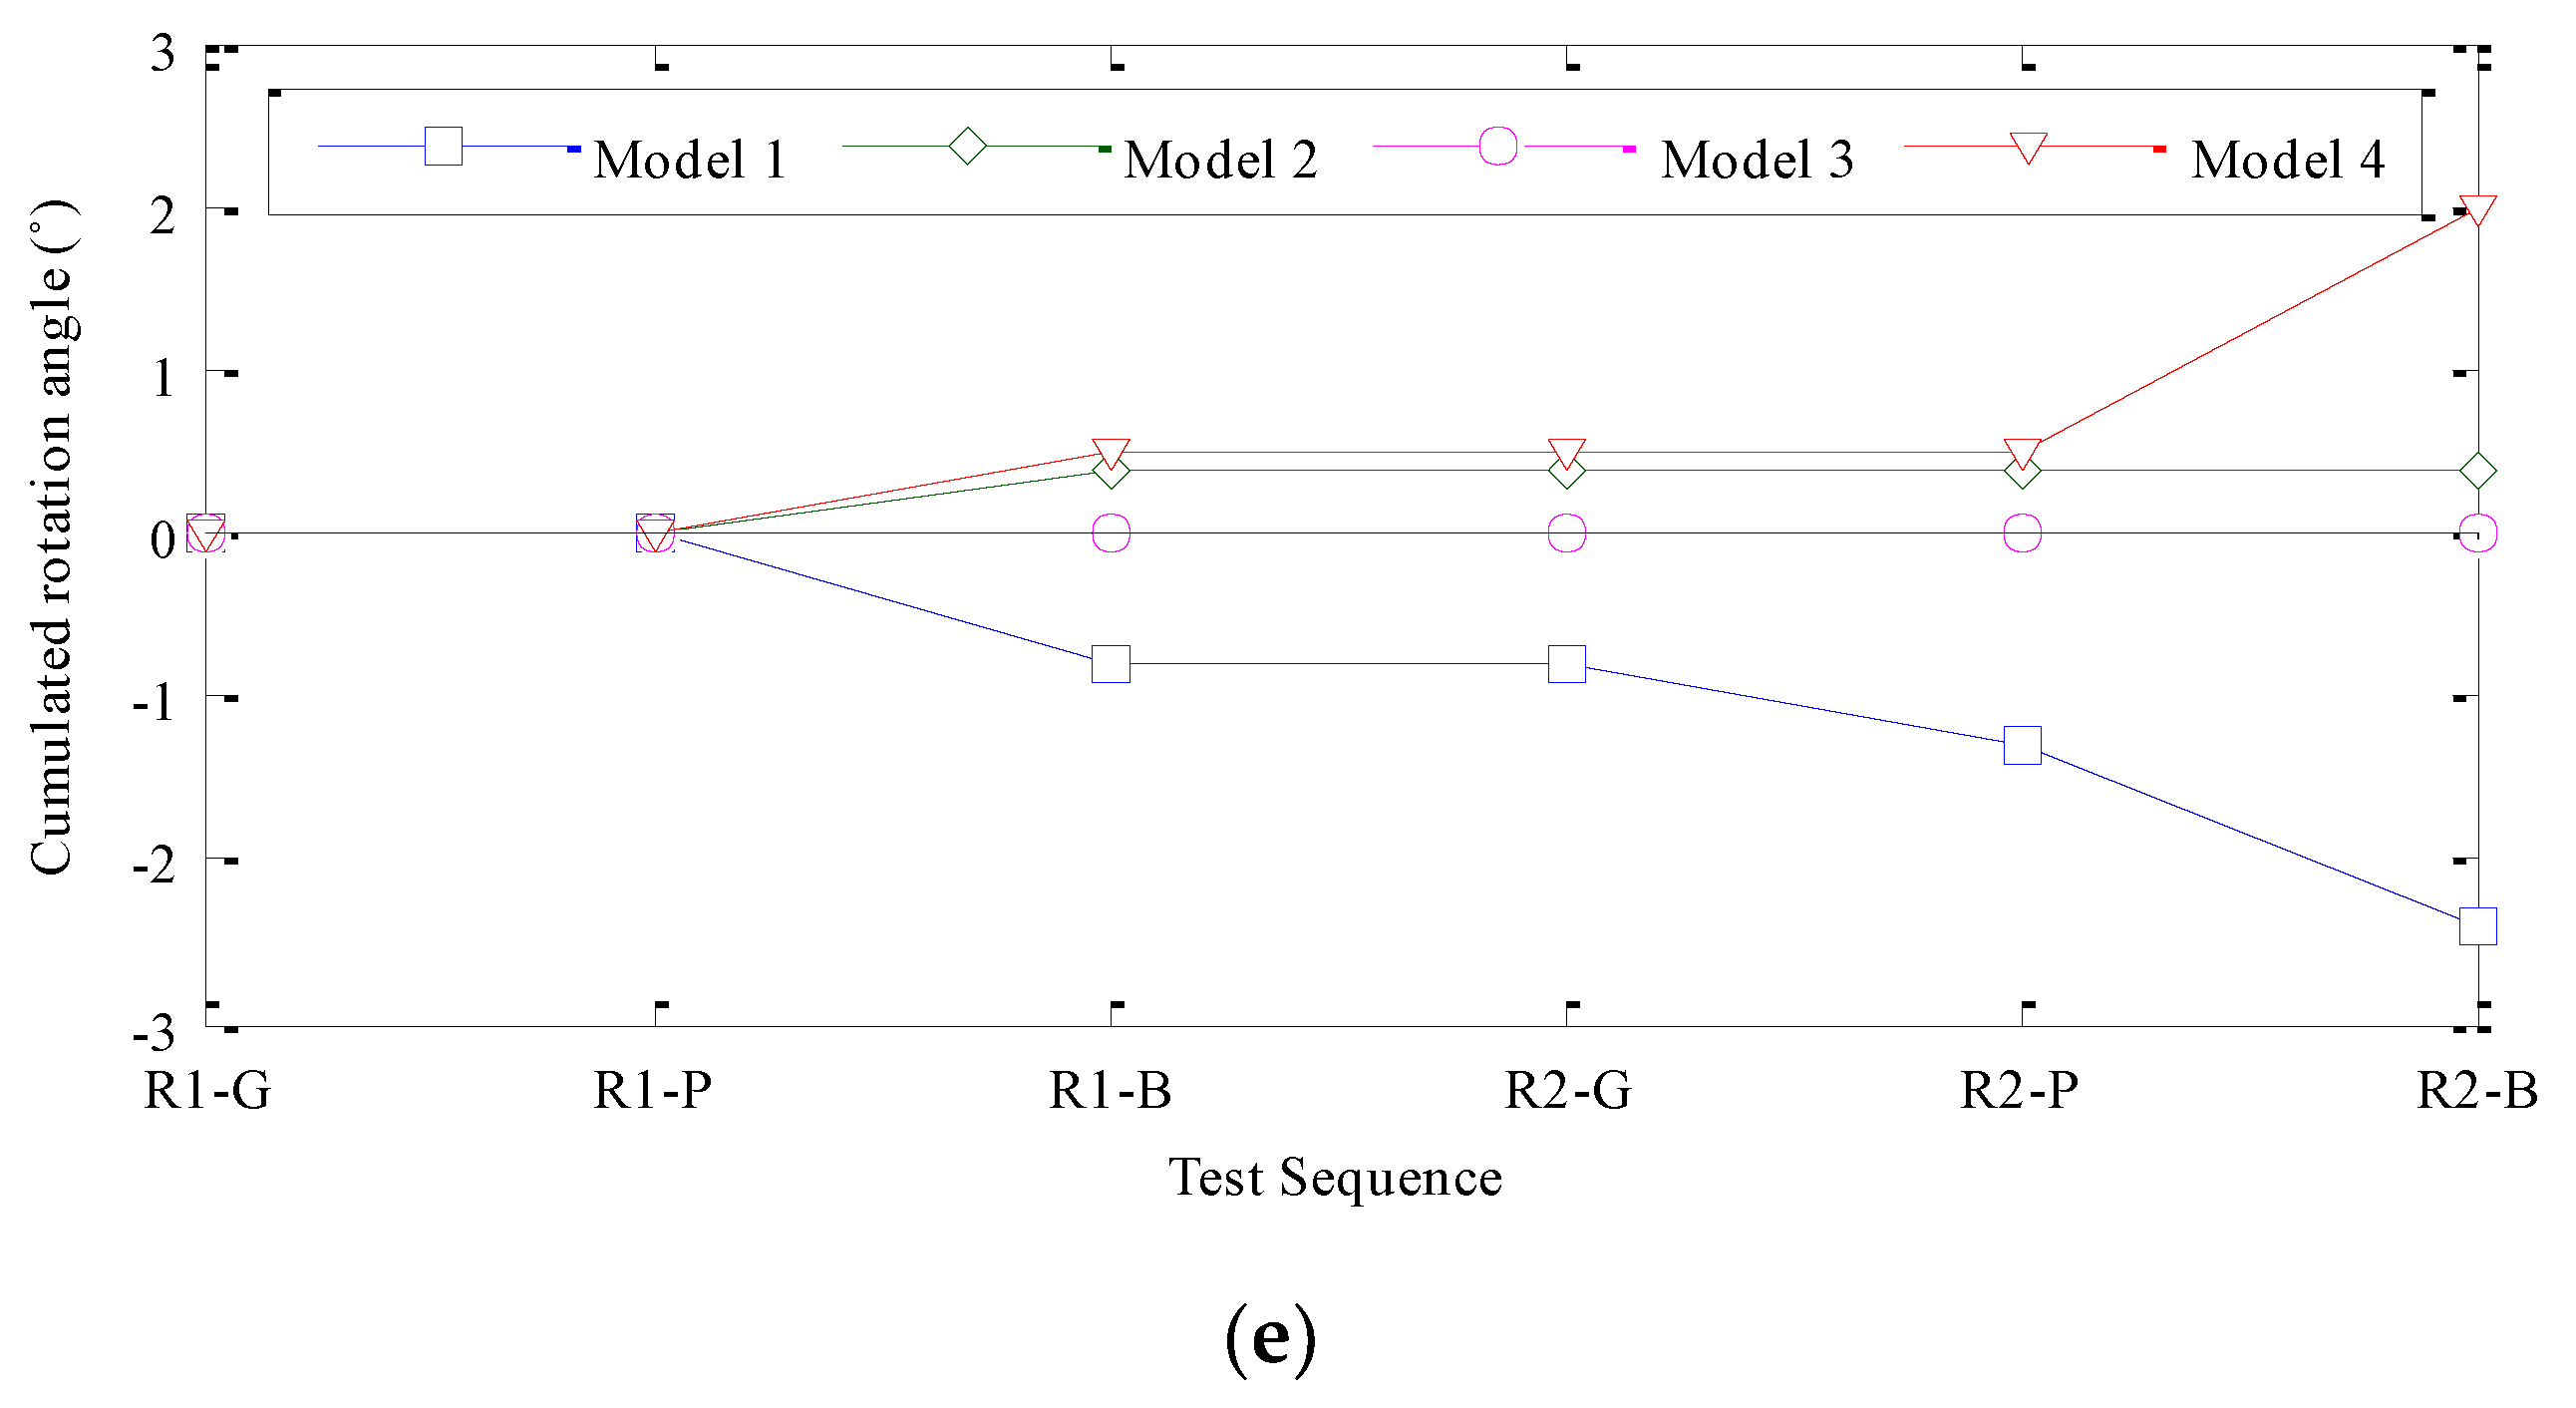
With fewer Myeonseok stylobates, the discontinuous contact surface area was smaller and seismic performance was better. For the Jeoksim B and loss of Jeoksim models, the contact surface between Myeonseok and Gapseok decreased, and stylobate stiffness also decreased, resulting in significant stylobate deformation. As most of the seismic energy transversely deformed the Myeonseok, damage was mainly seen in the lower region of the stone pagoda. In contrast, in the Jeoksim type A models, stylobate stiffness was relatively high, and rotational deformation (caused by rocking of the main body stones) was more significant than the deformation seen in the lower region. This mainly affected the first-story main body stone, leading to rotational deformation above that region.
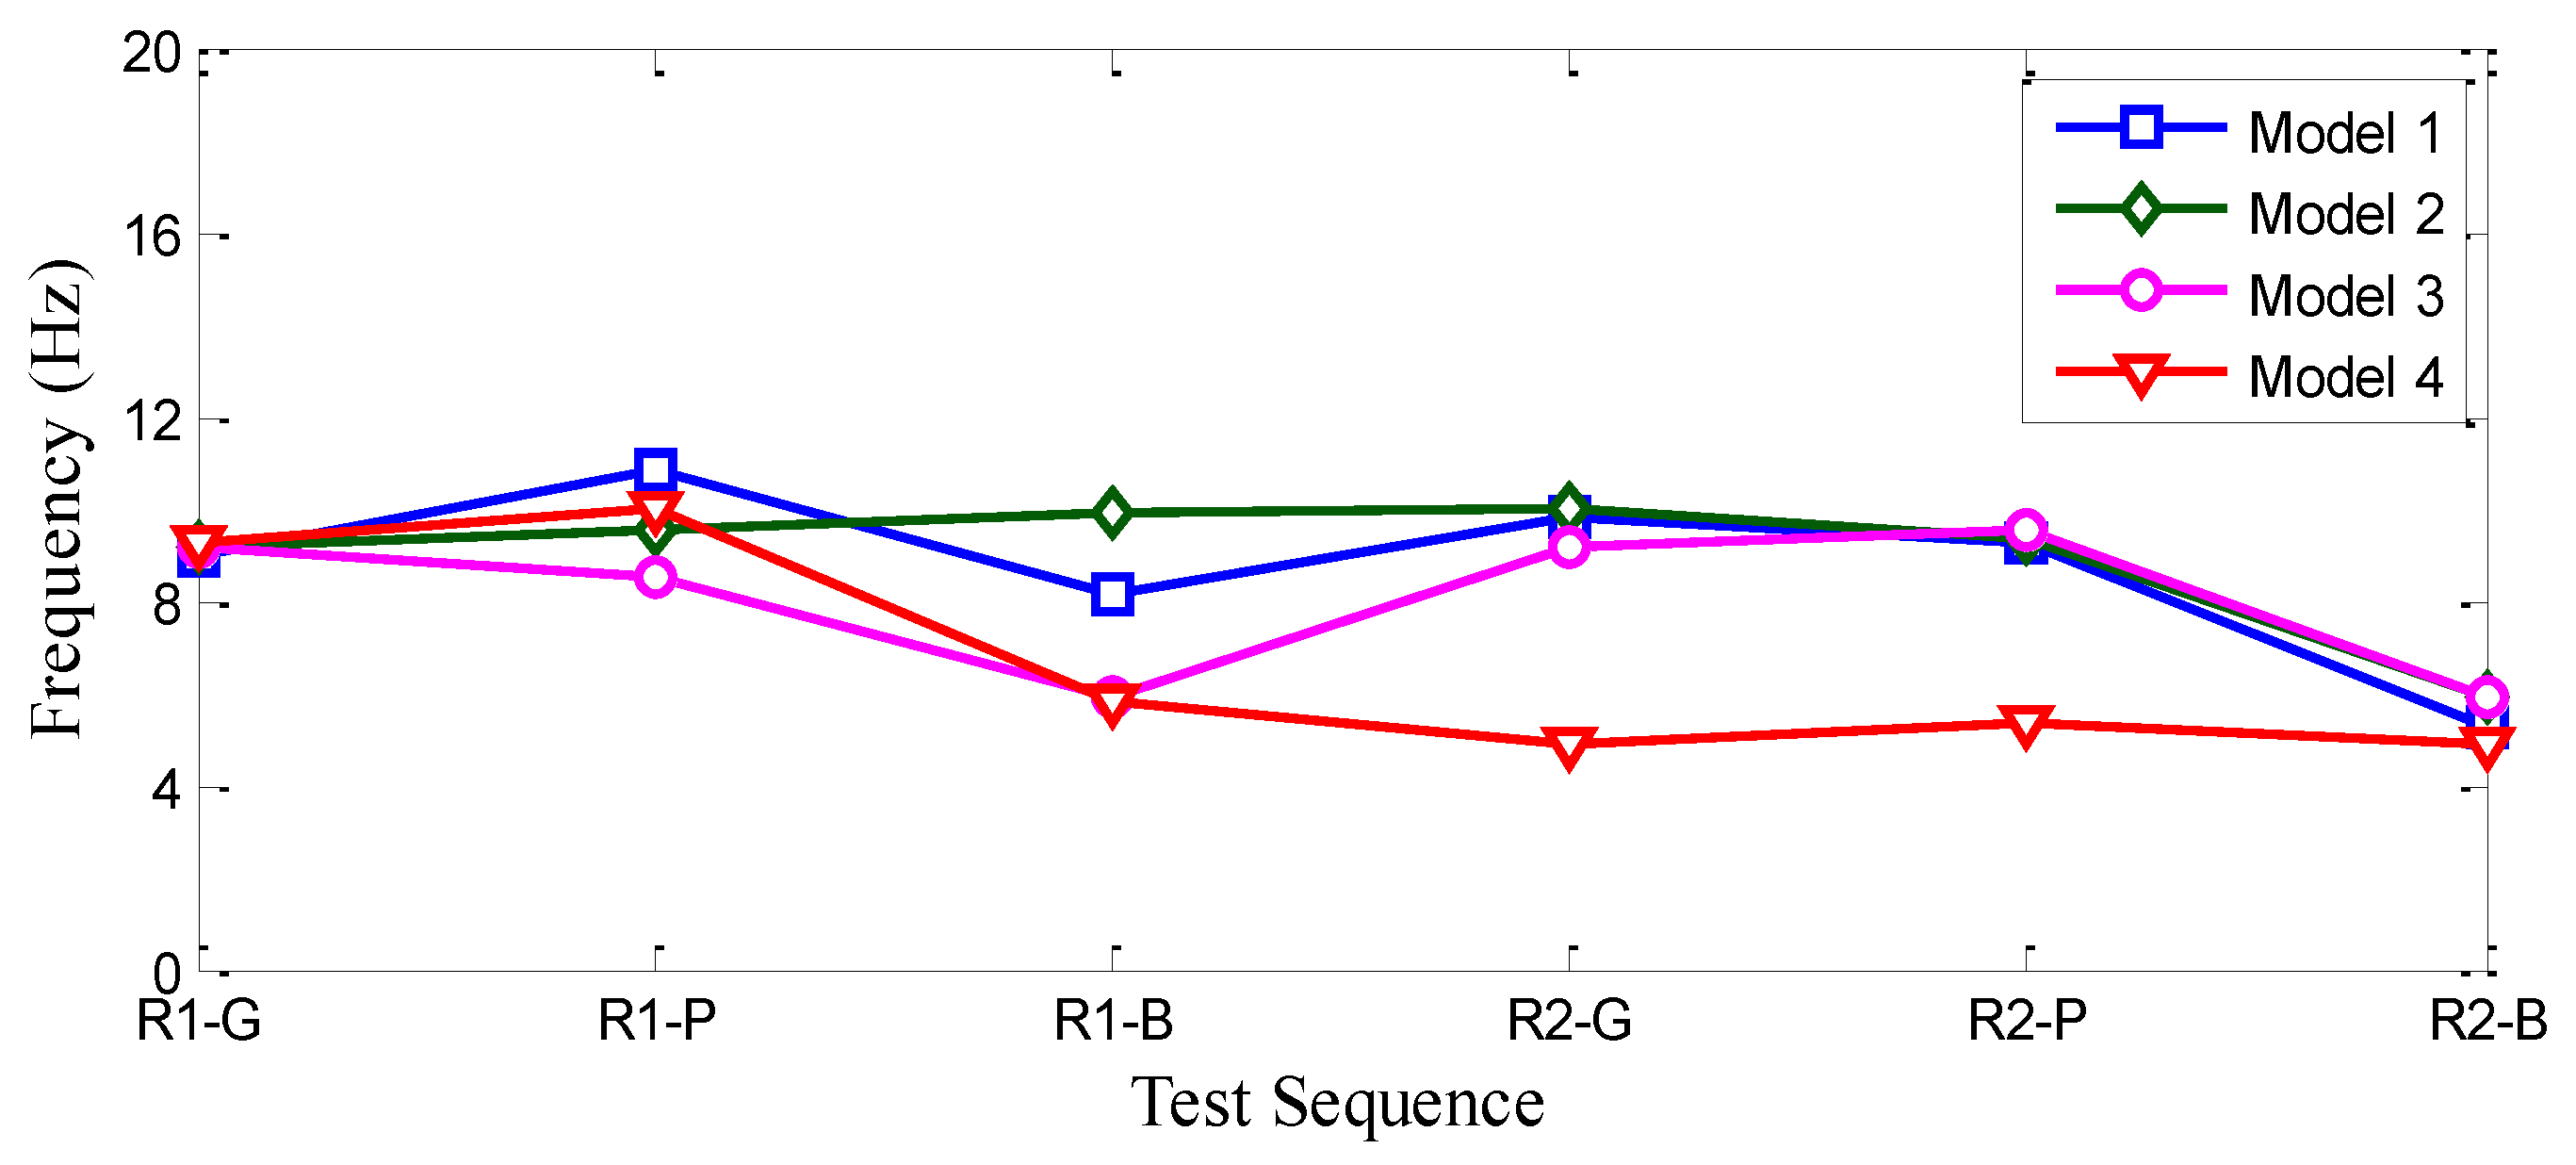
The variation in maximum acceleration was greater for the longer return period, as was permanent displacement, rocking, and sliding. However, in terms of frequency, the seismic wave input was more important than the return period. Both the Gyeongju and Pohang earthquakes had short periods and relatively small deformation. The seismic duration was longest for the Bingol earthquake, and the response acceleration was therefore large. Thus, the structure became more deformed, and the frequency decreased because of the reduced stylobate stiffness.
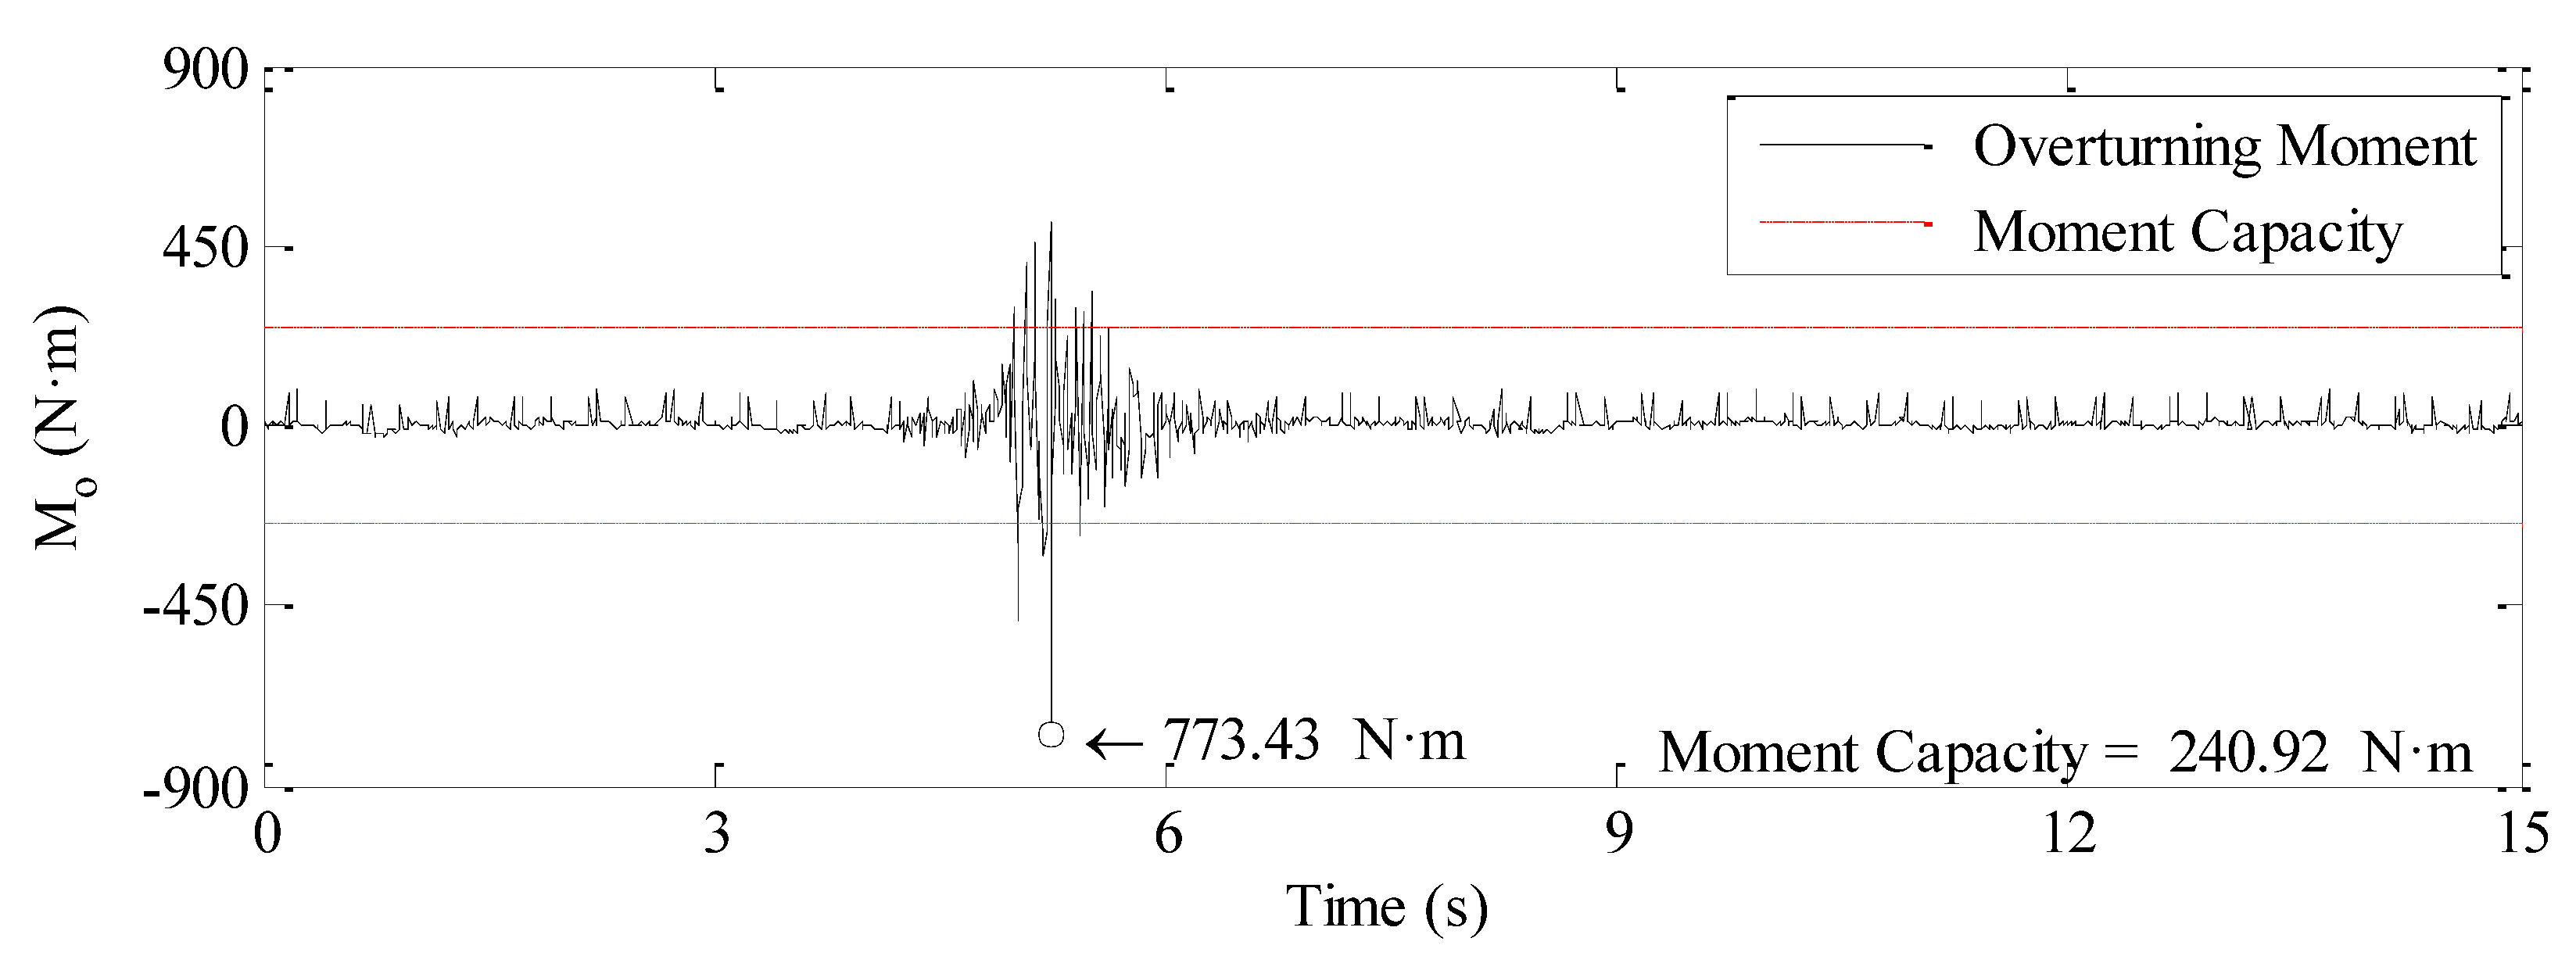
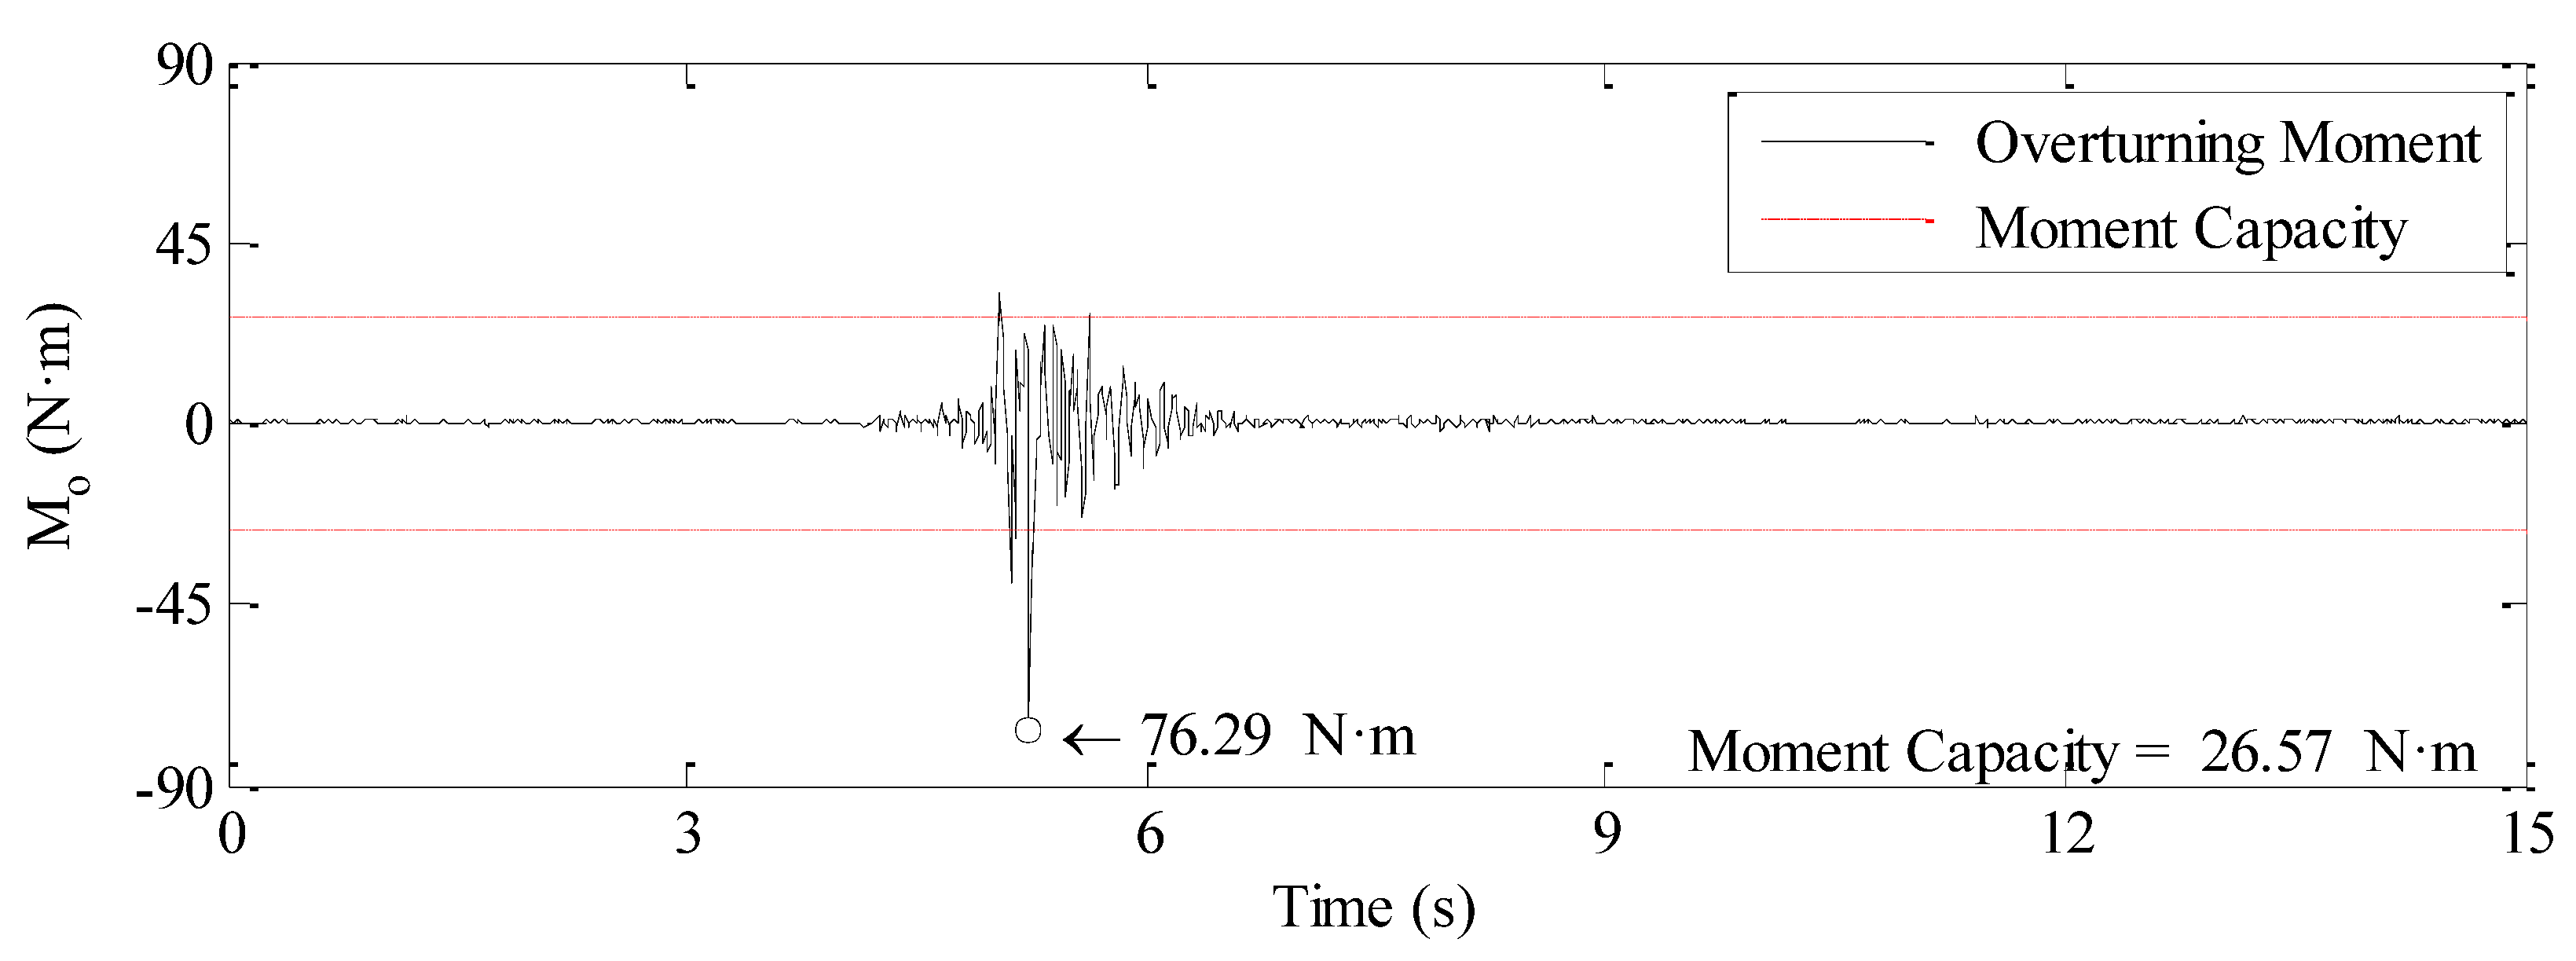
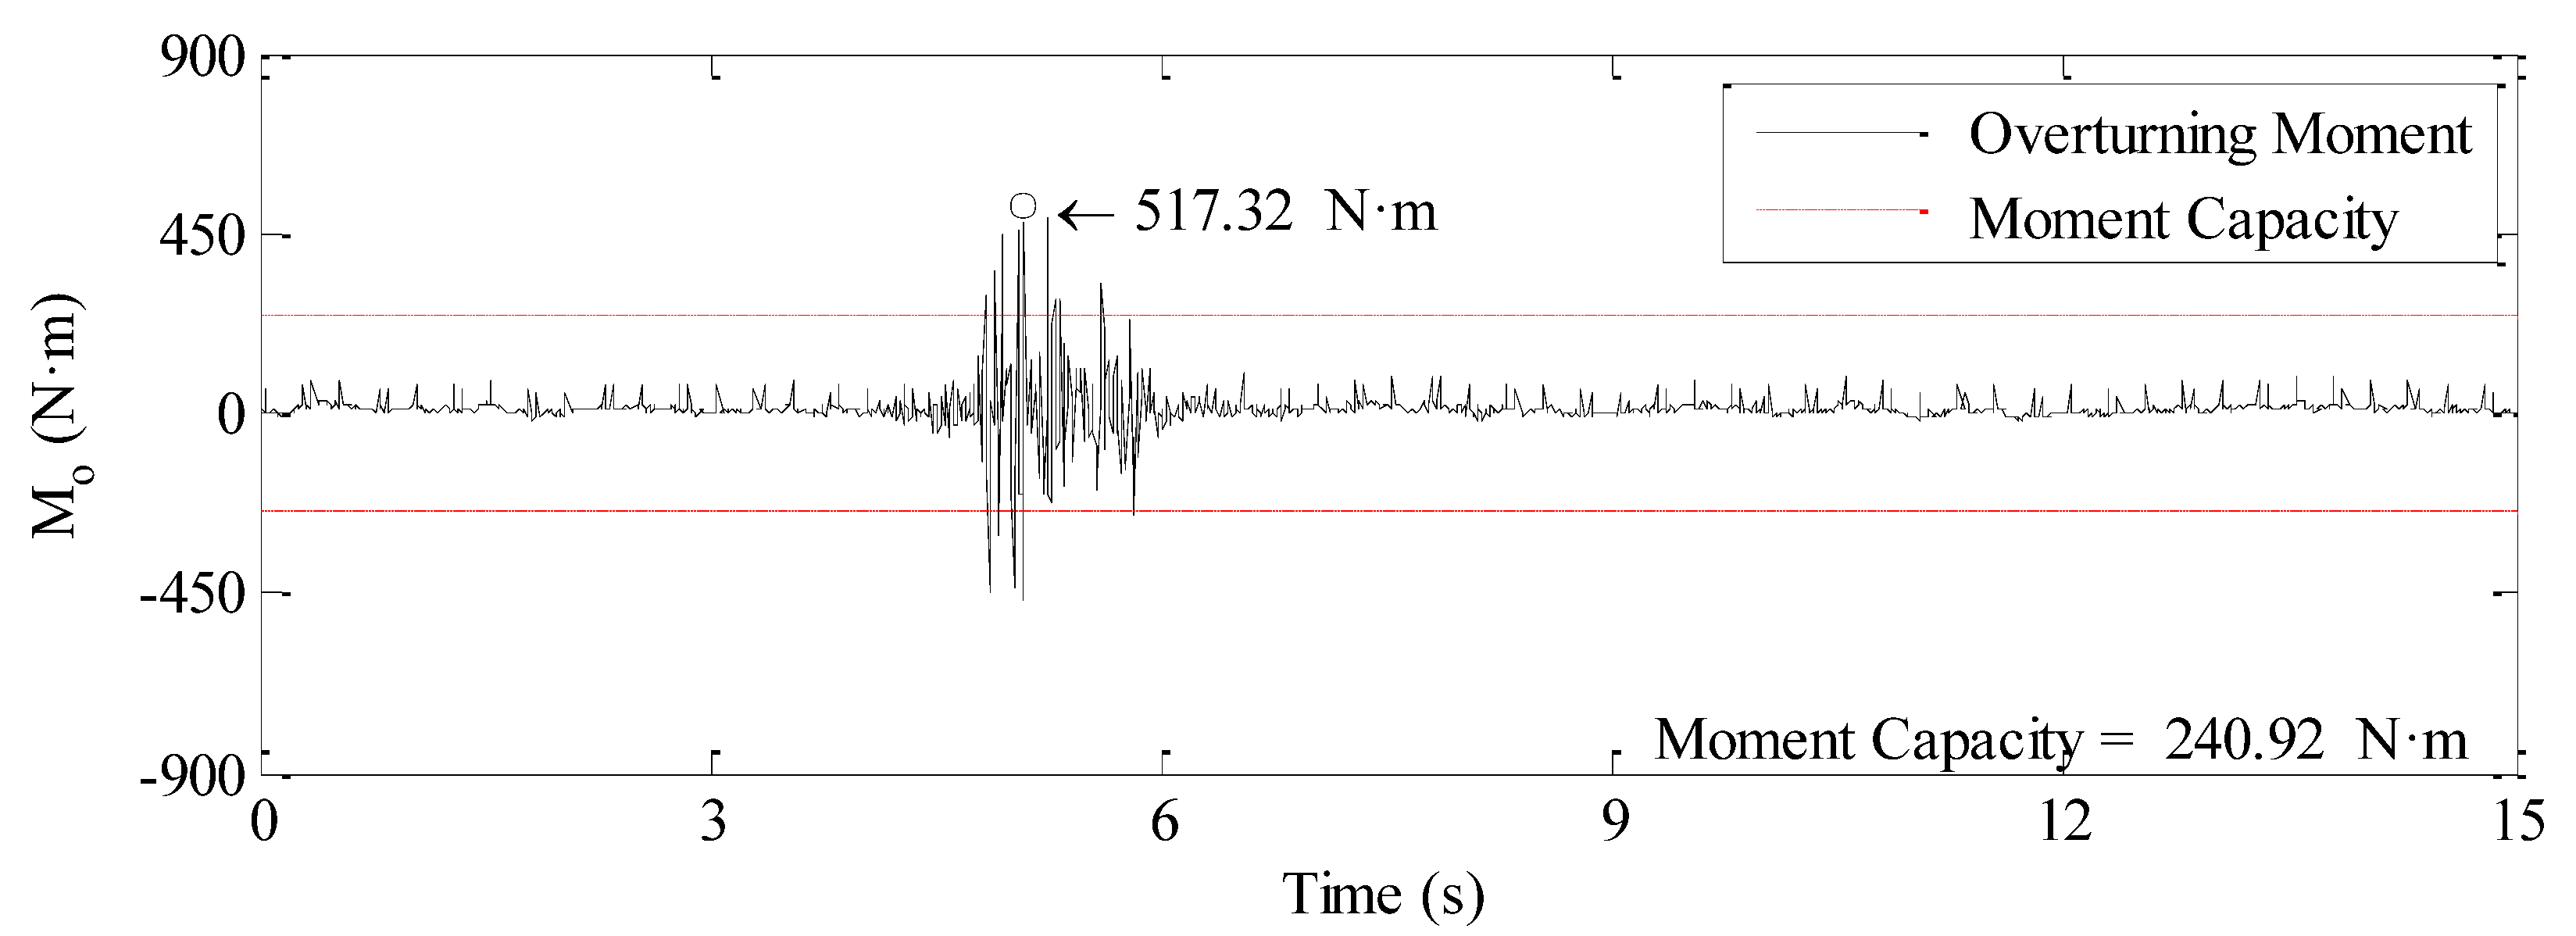
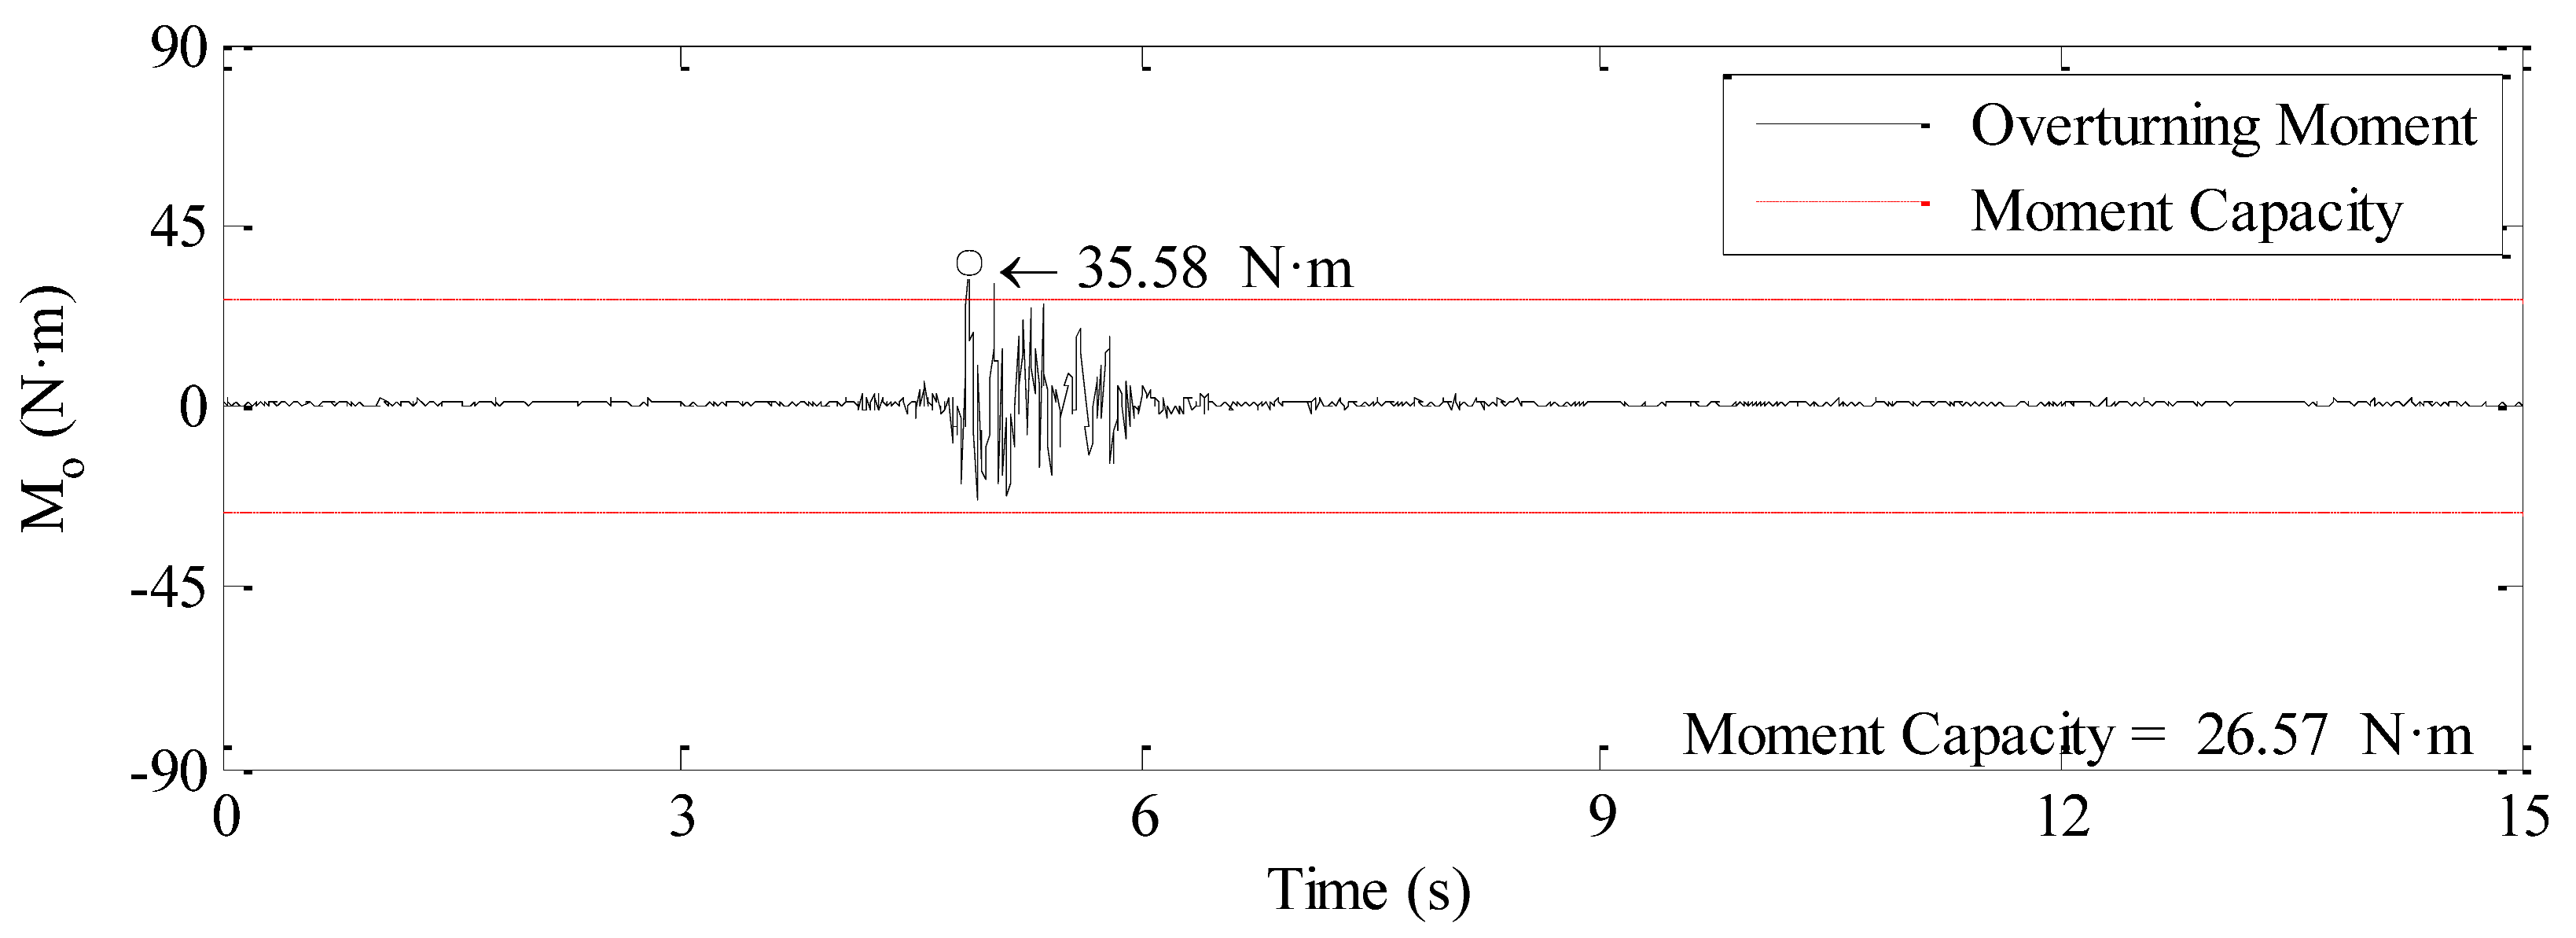
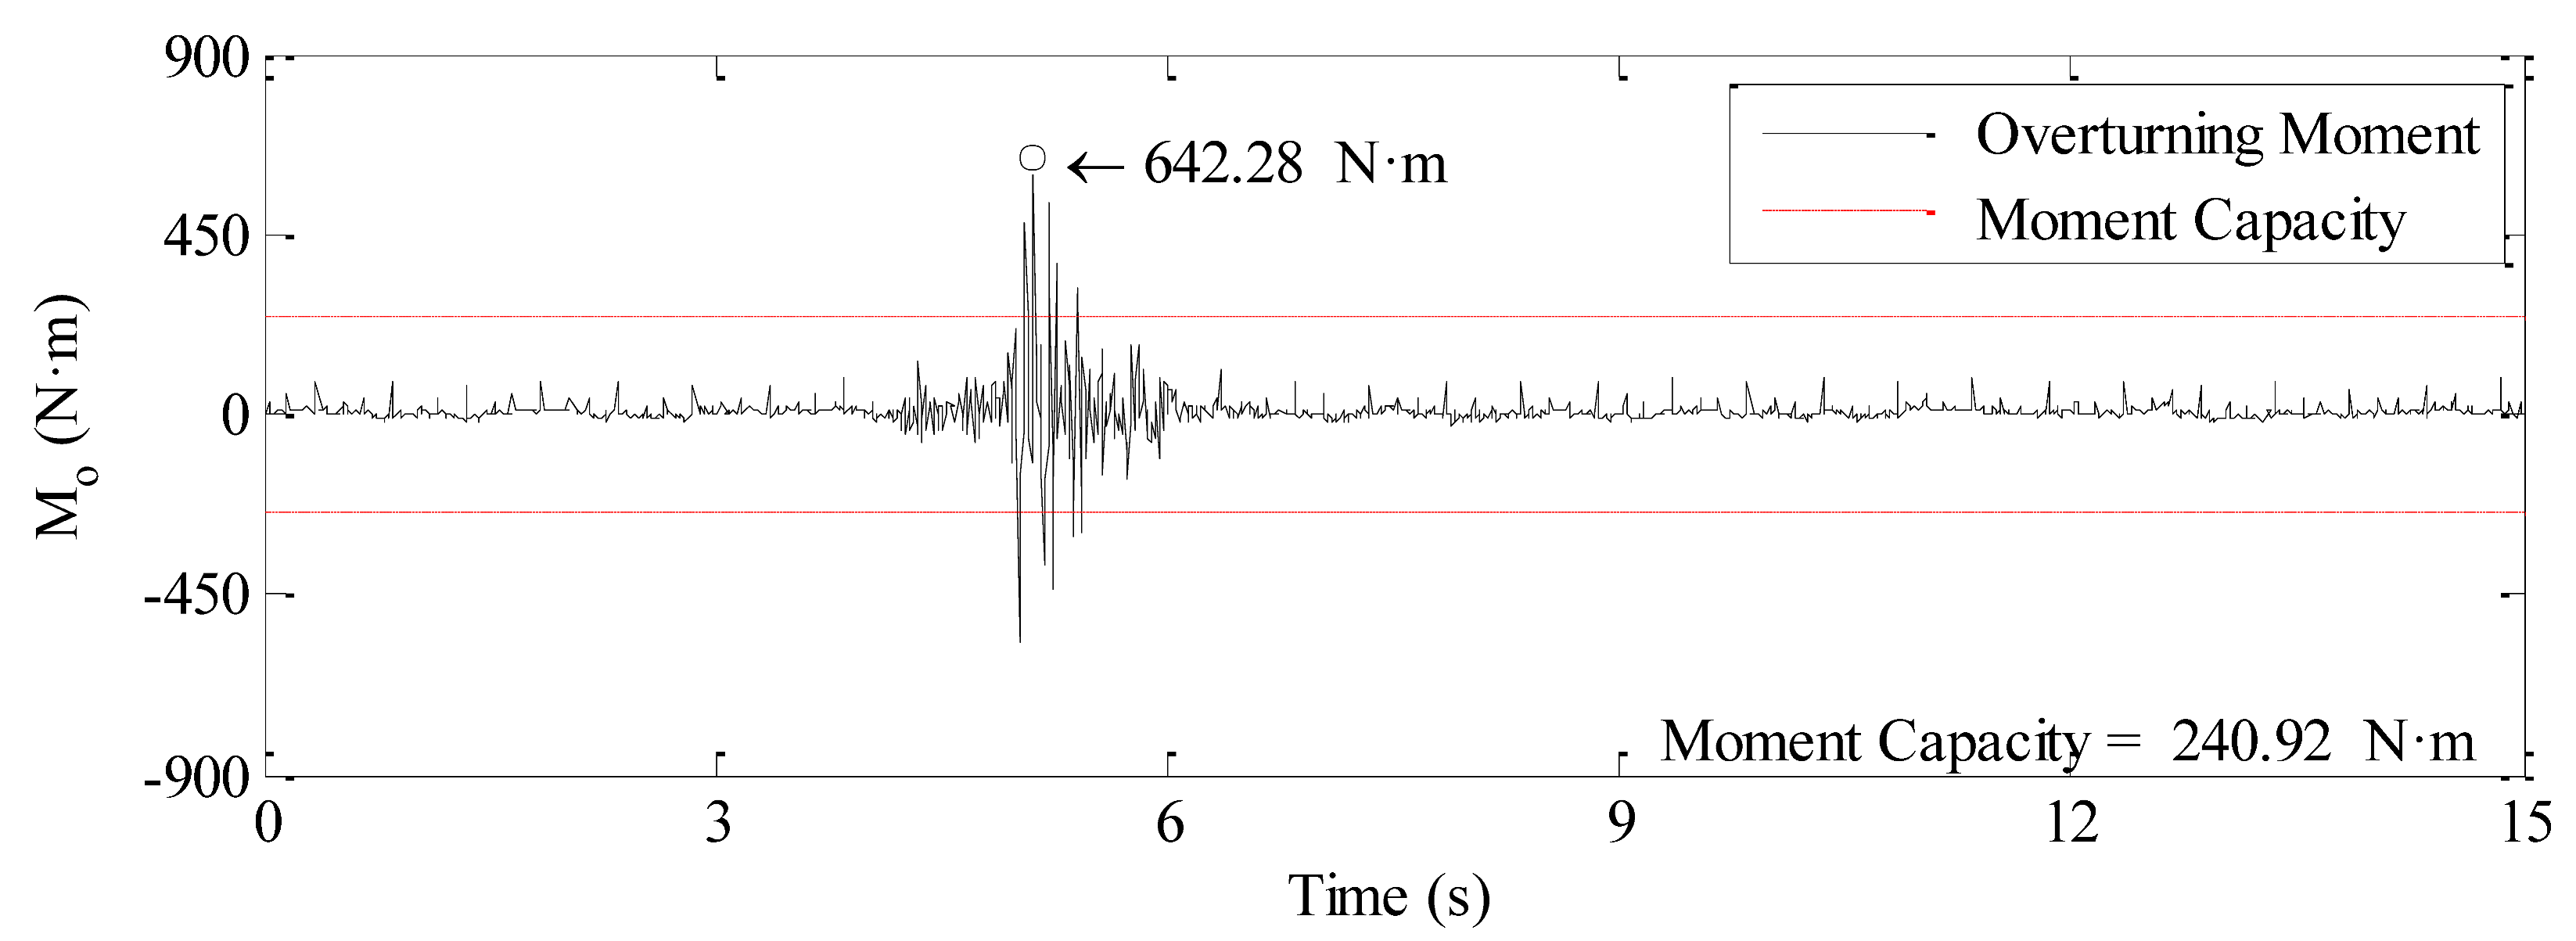
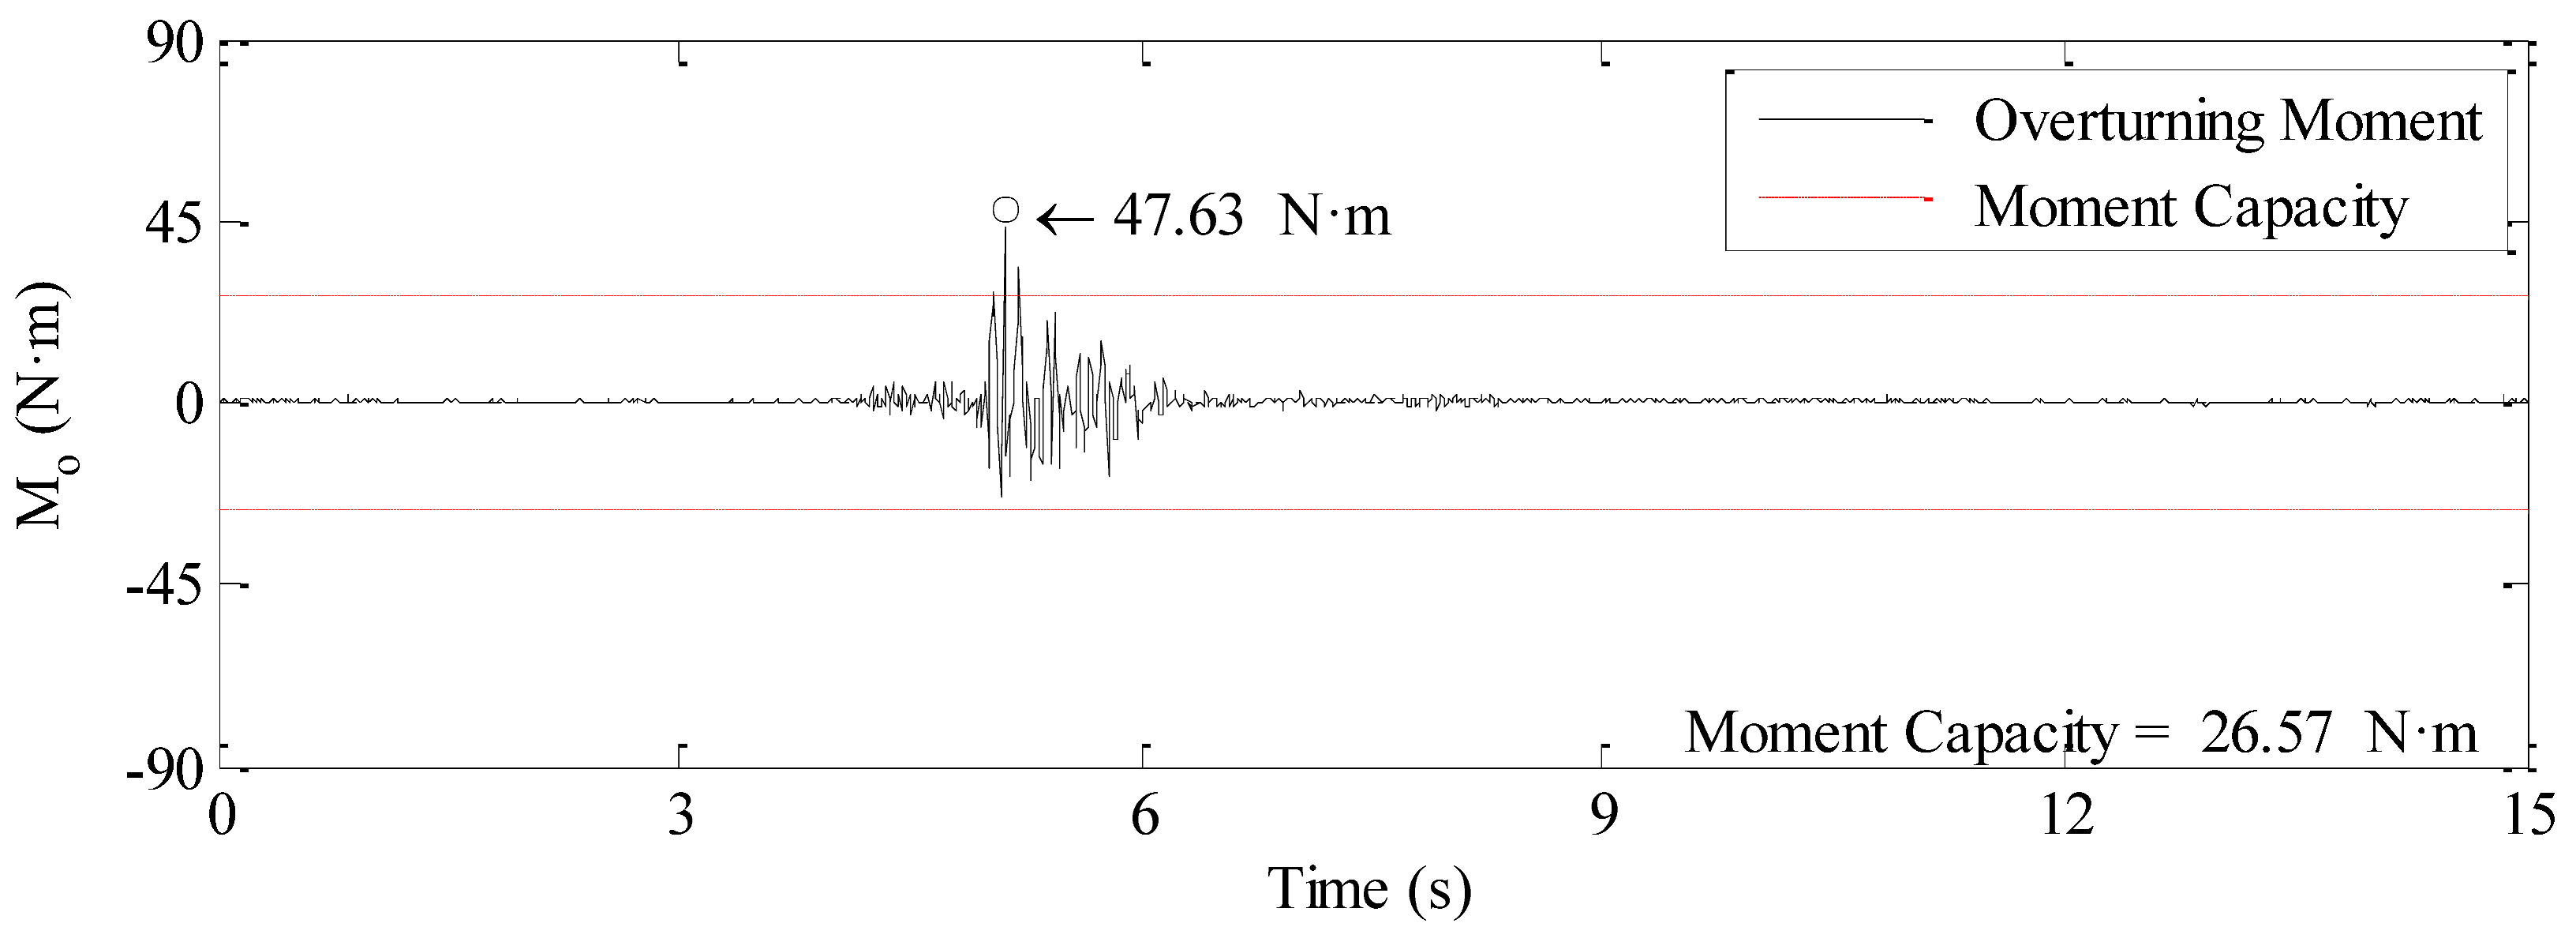
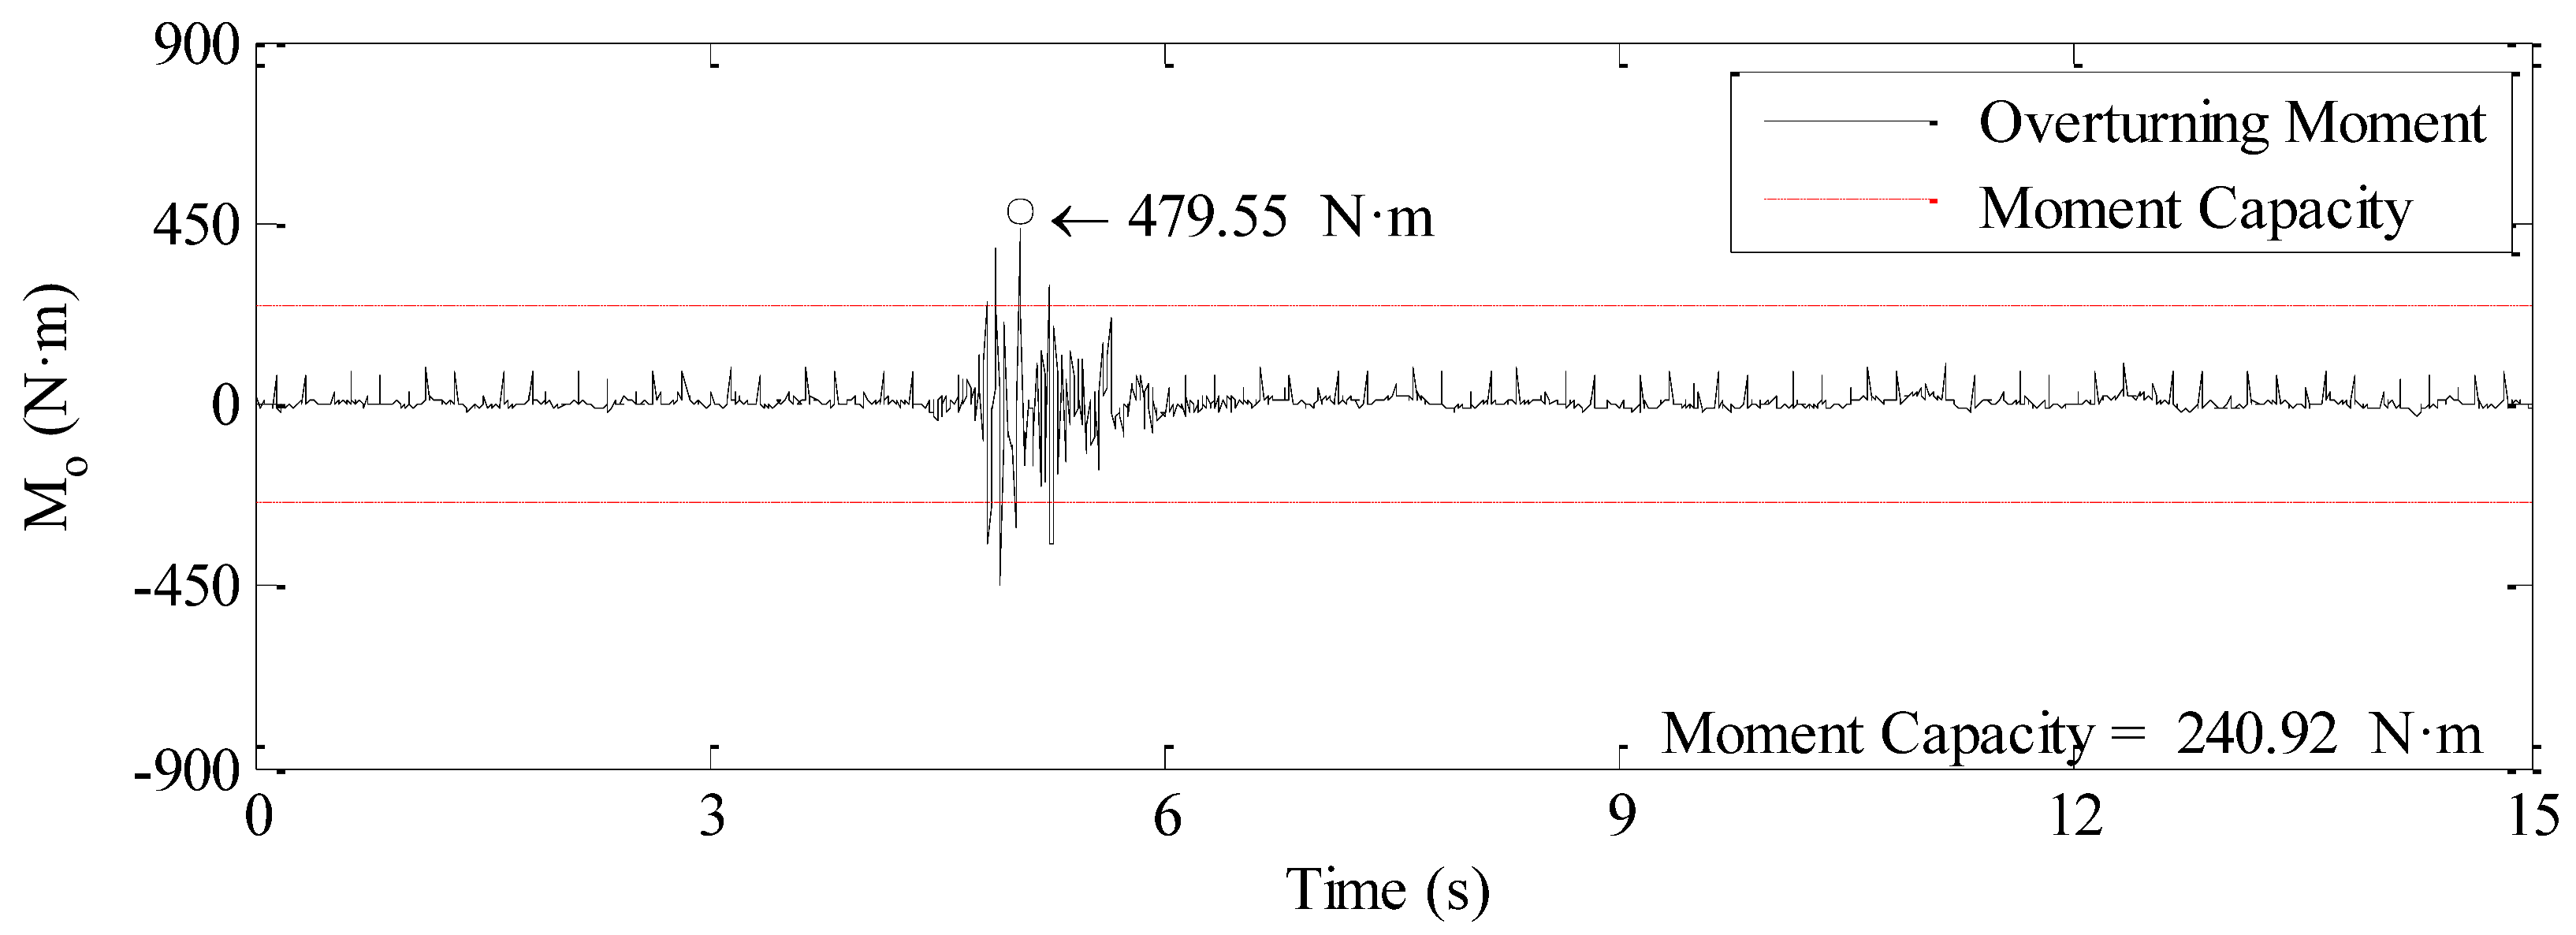
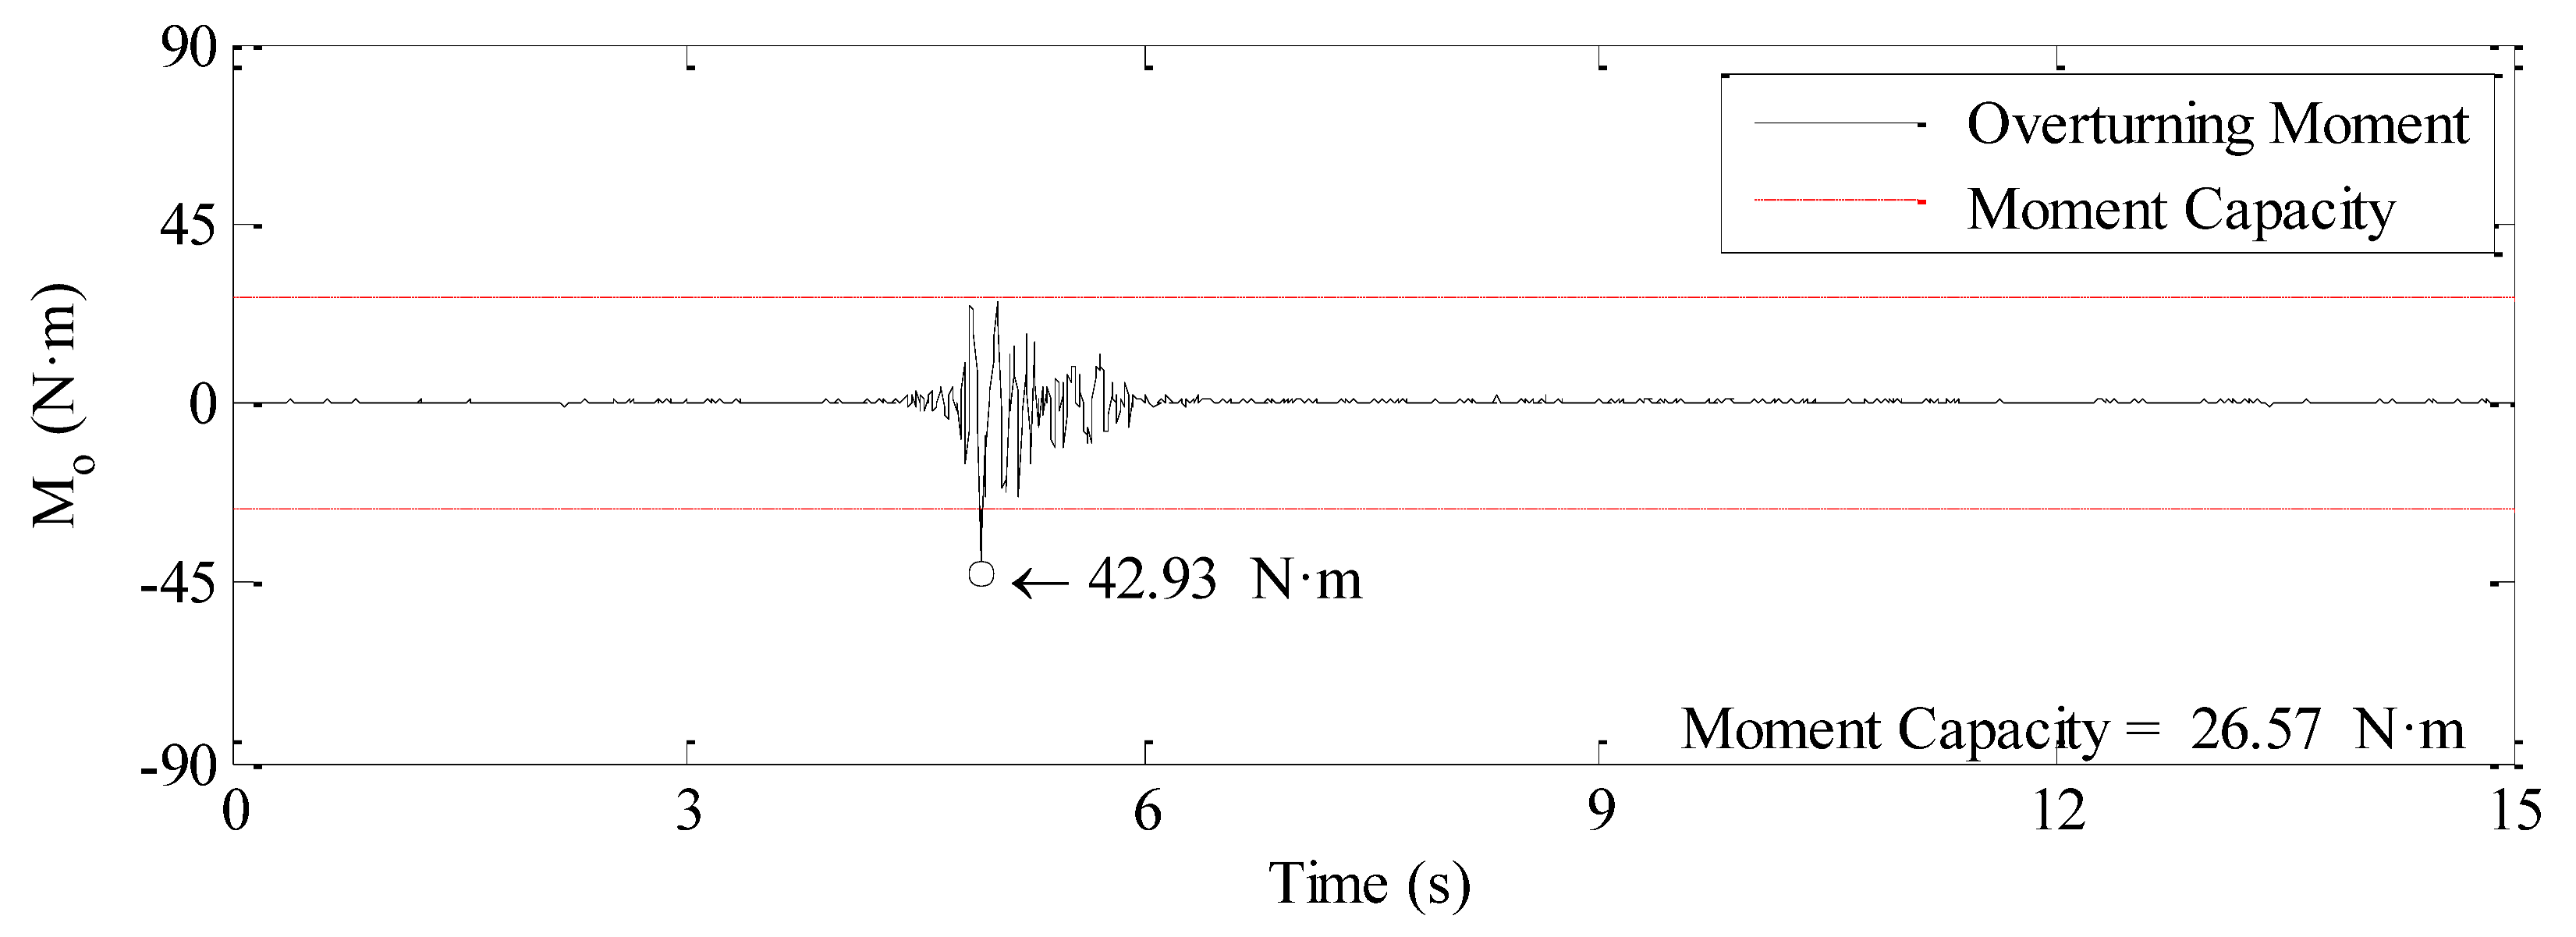
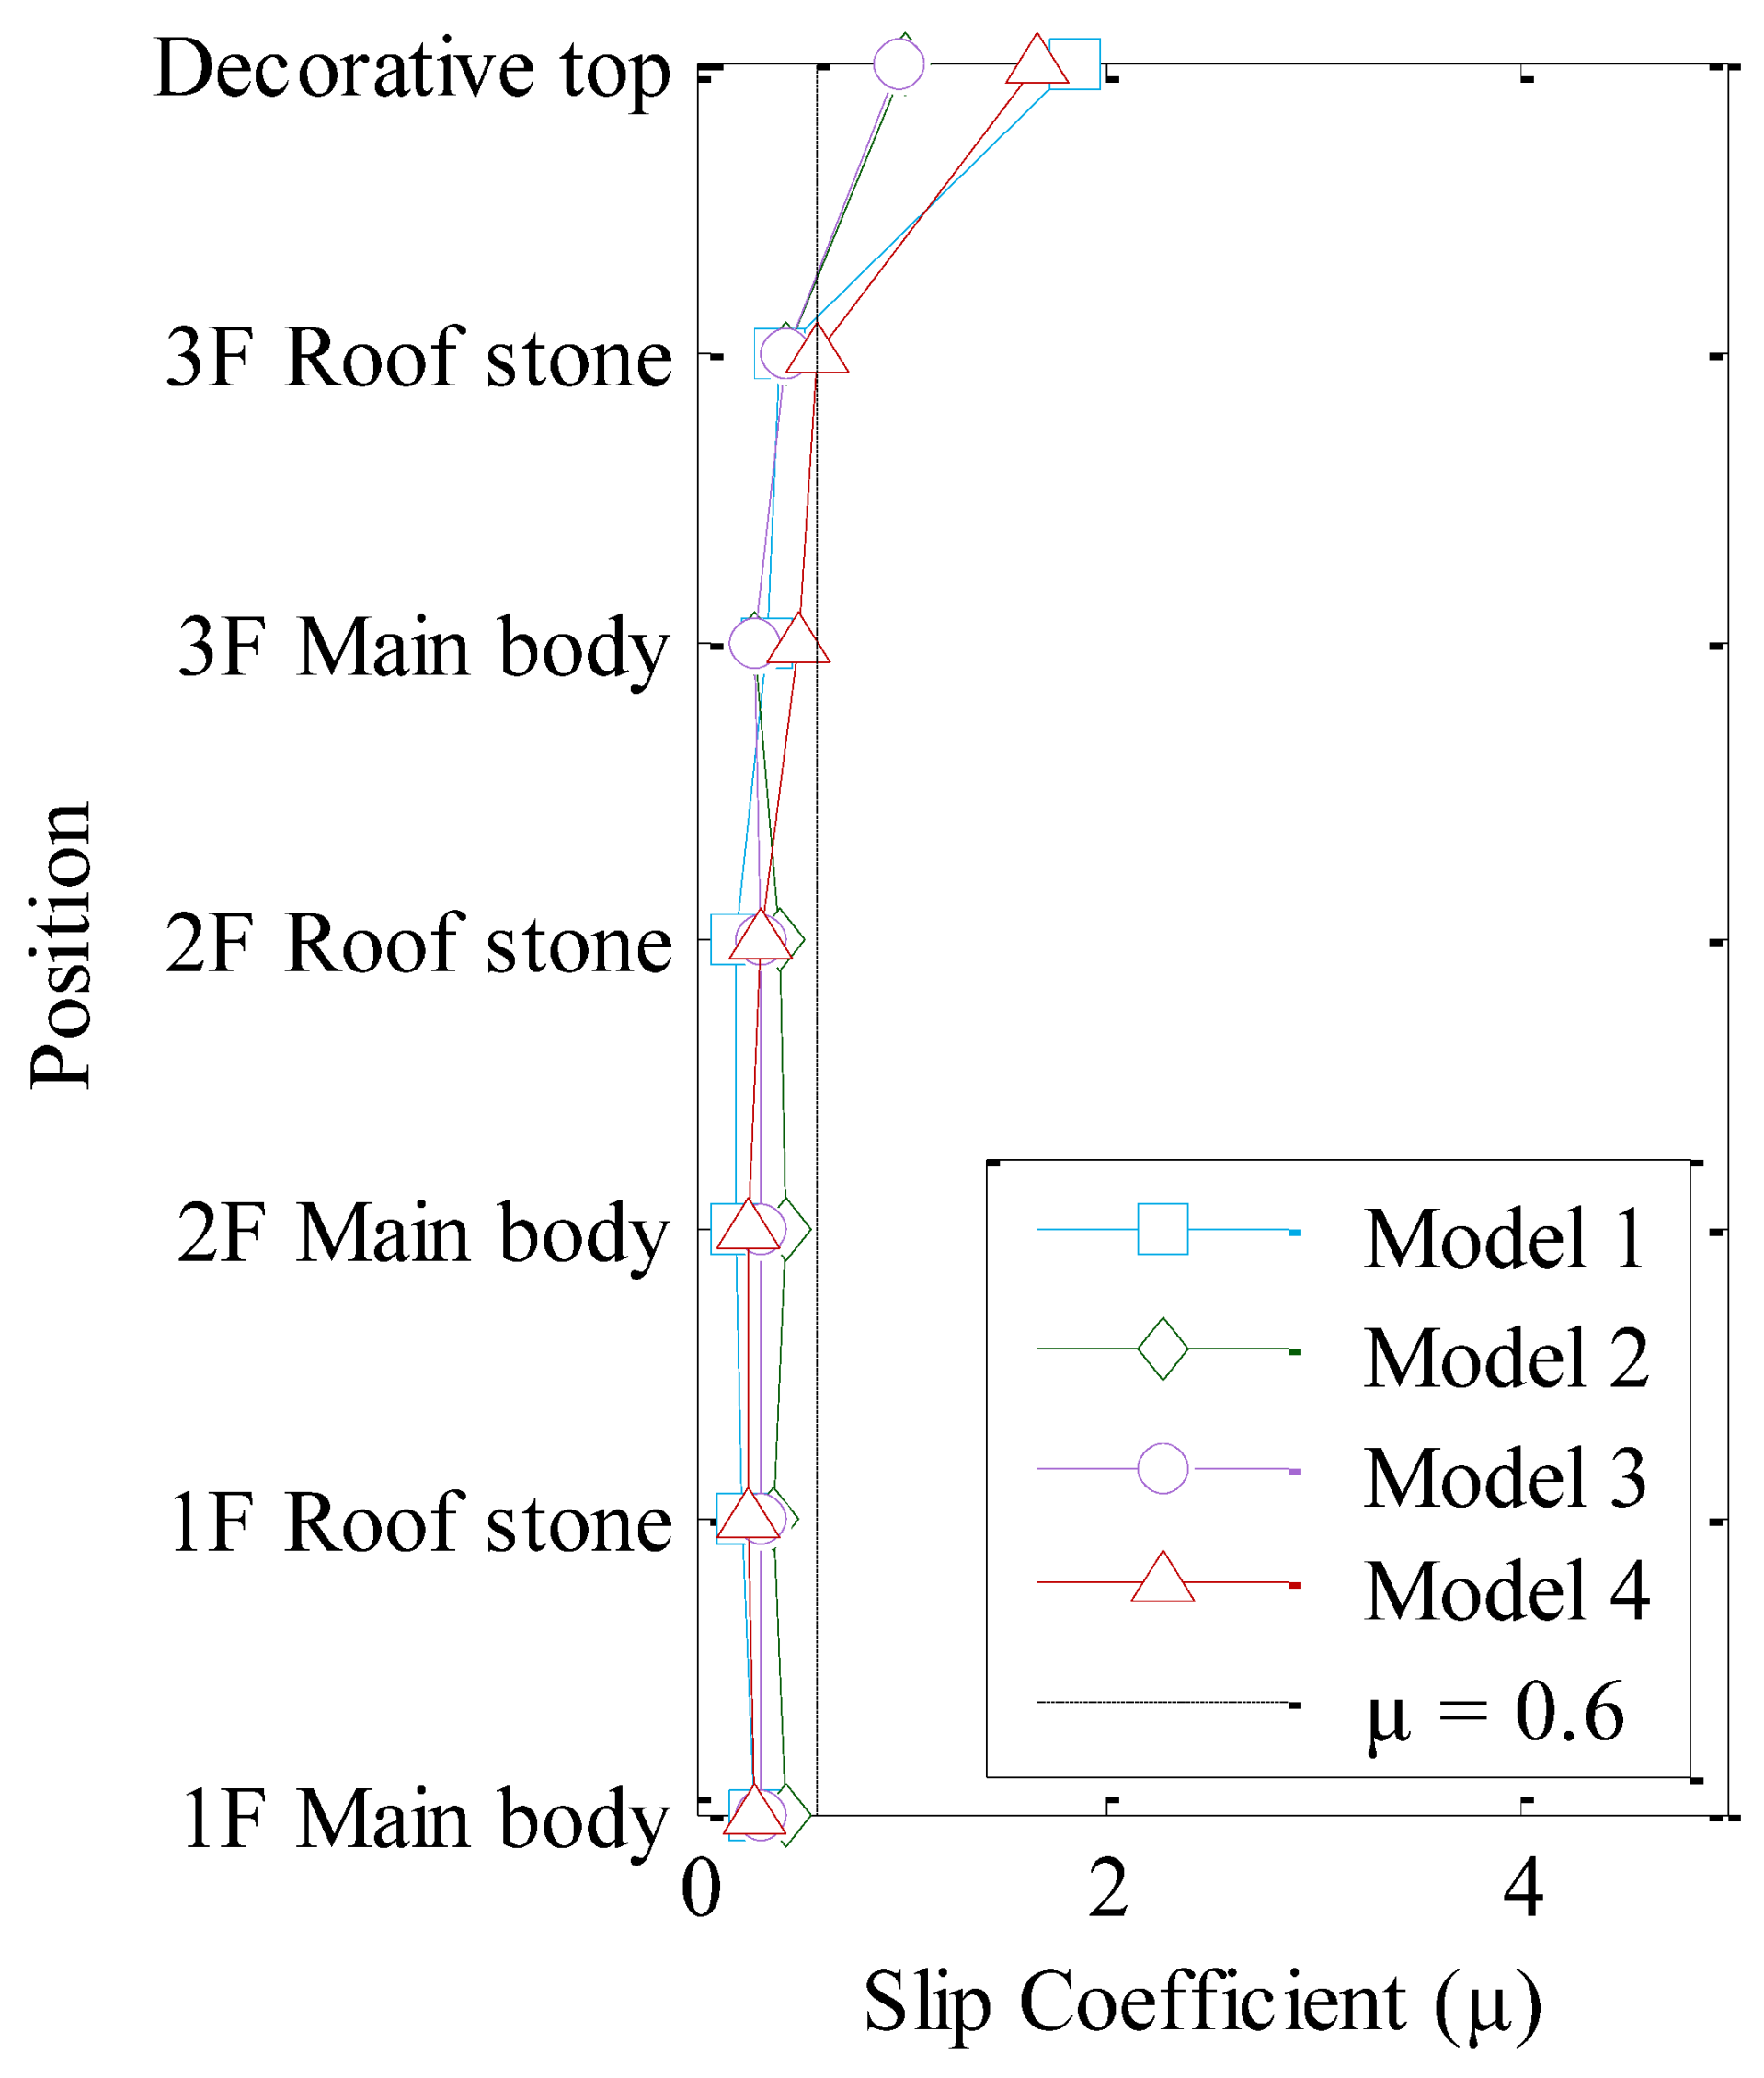
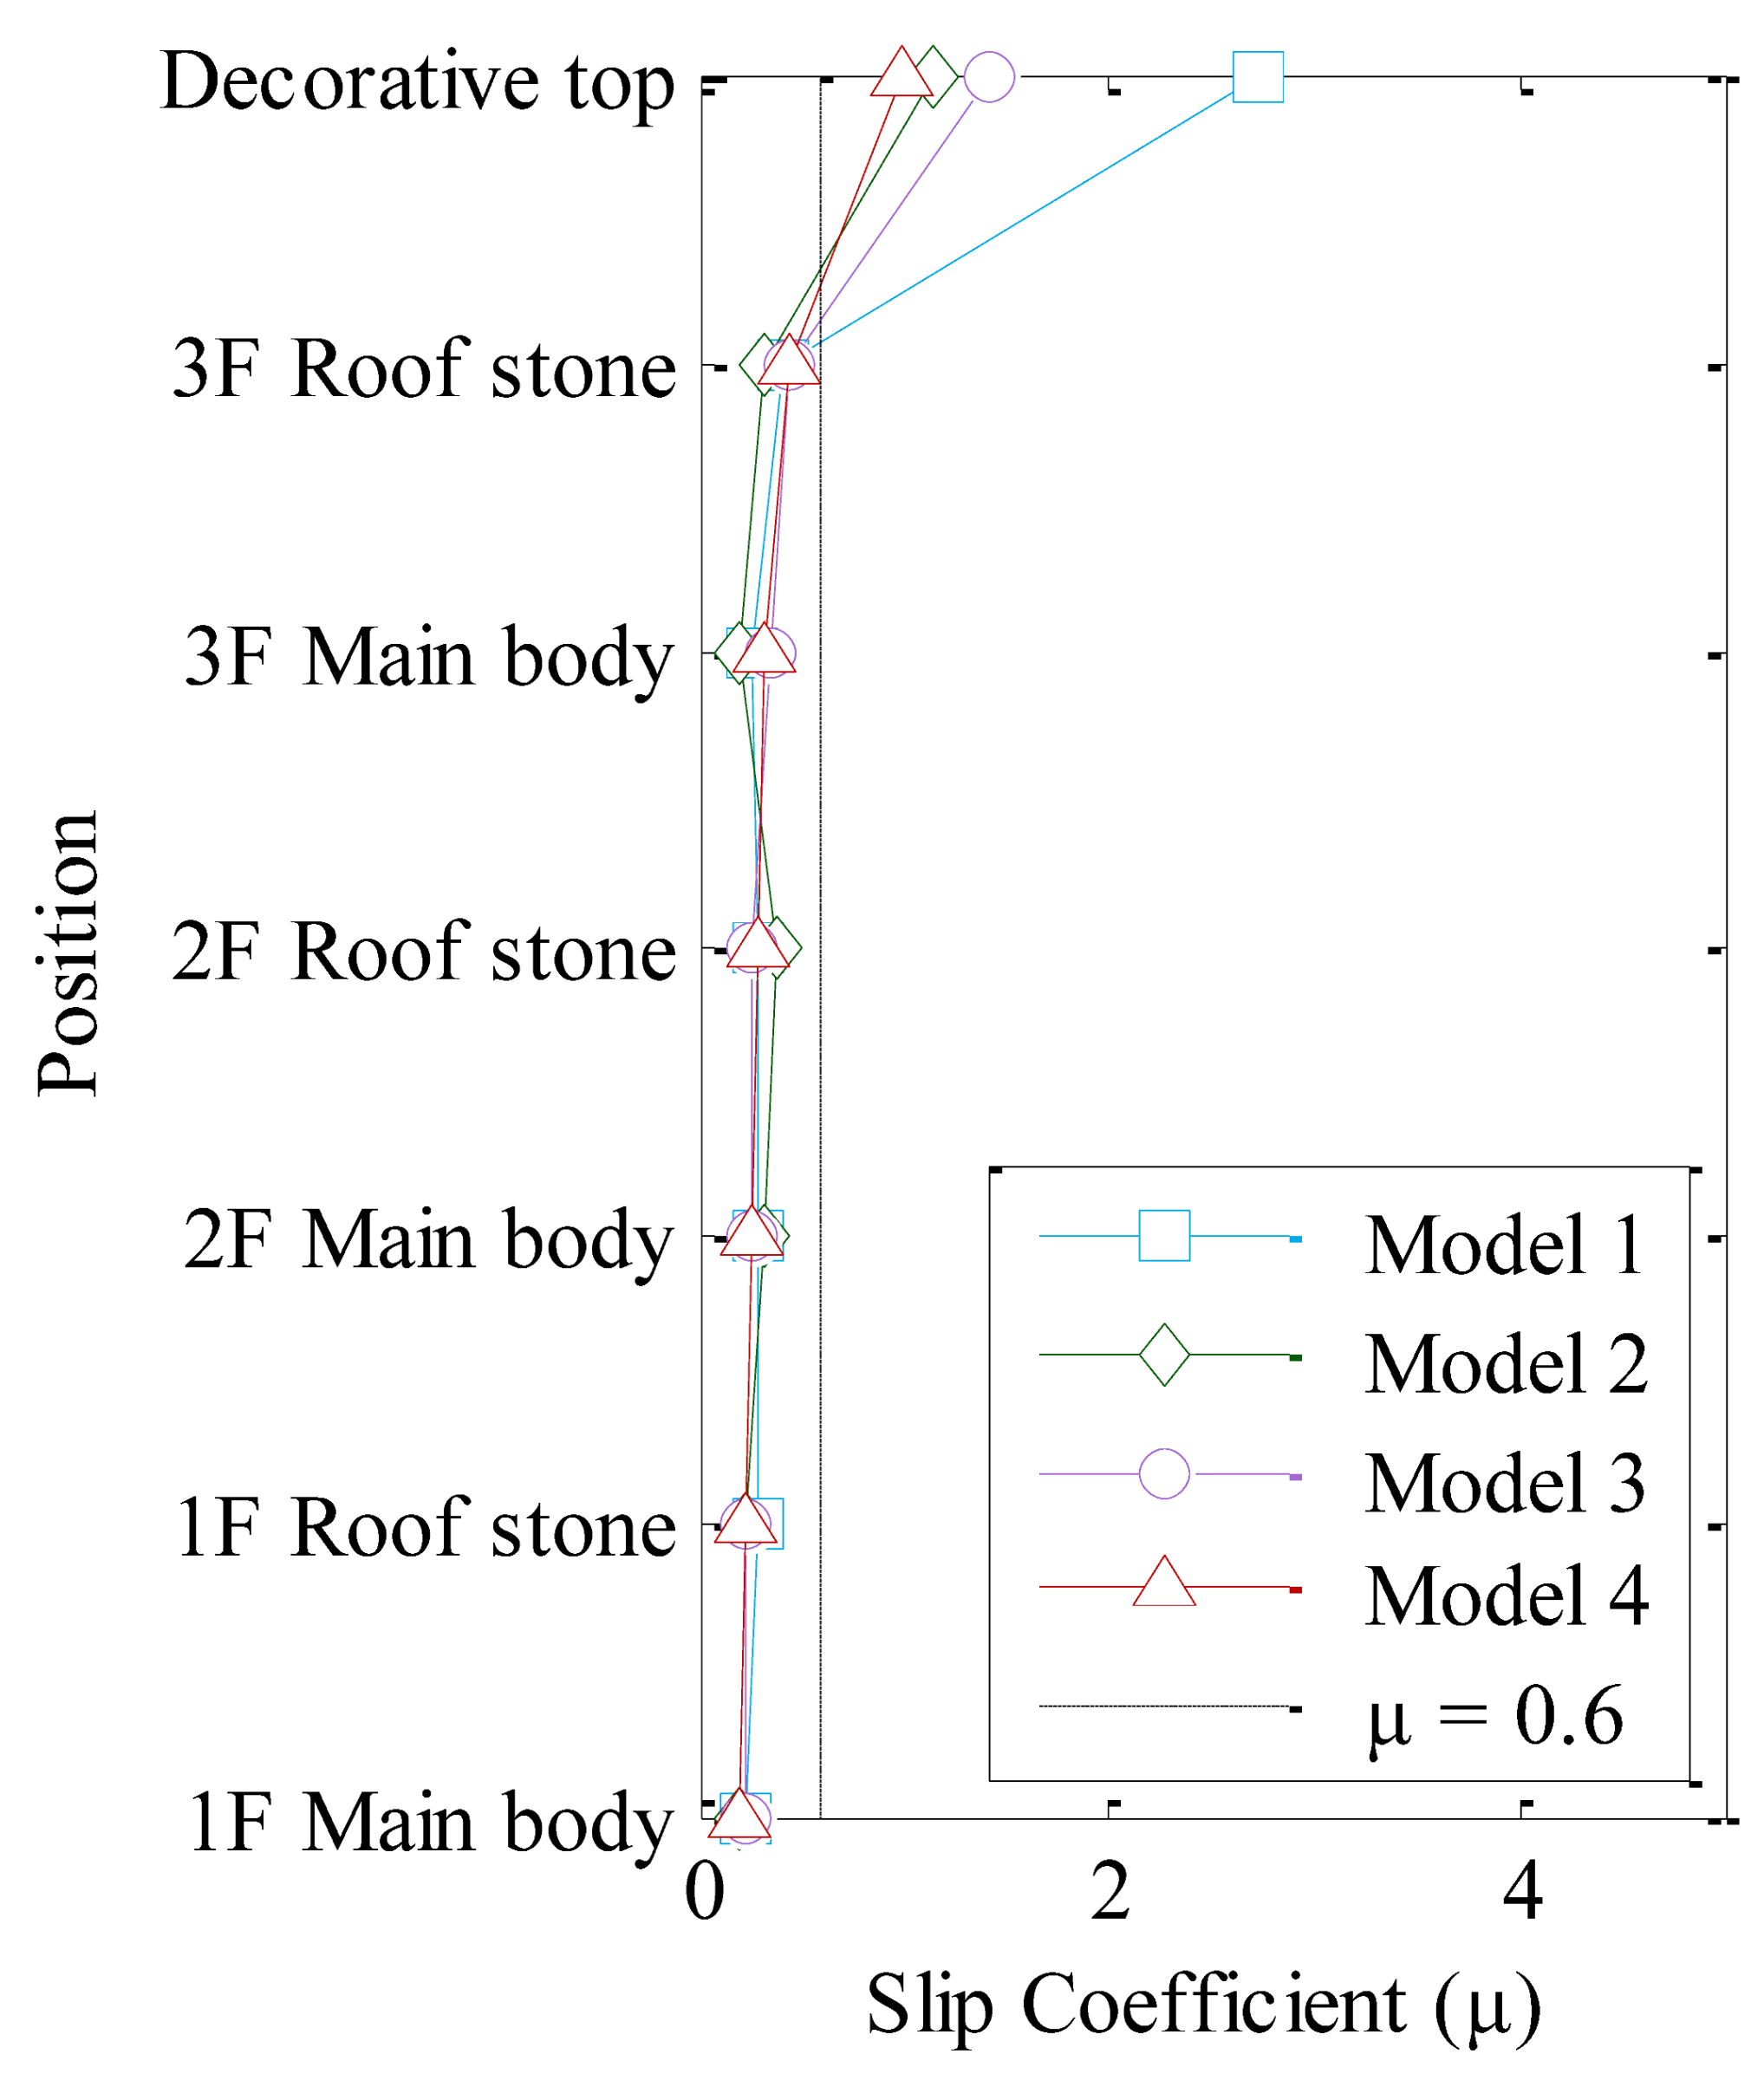
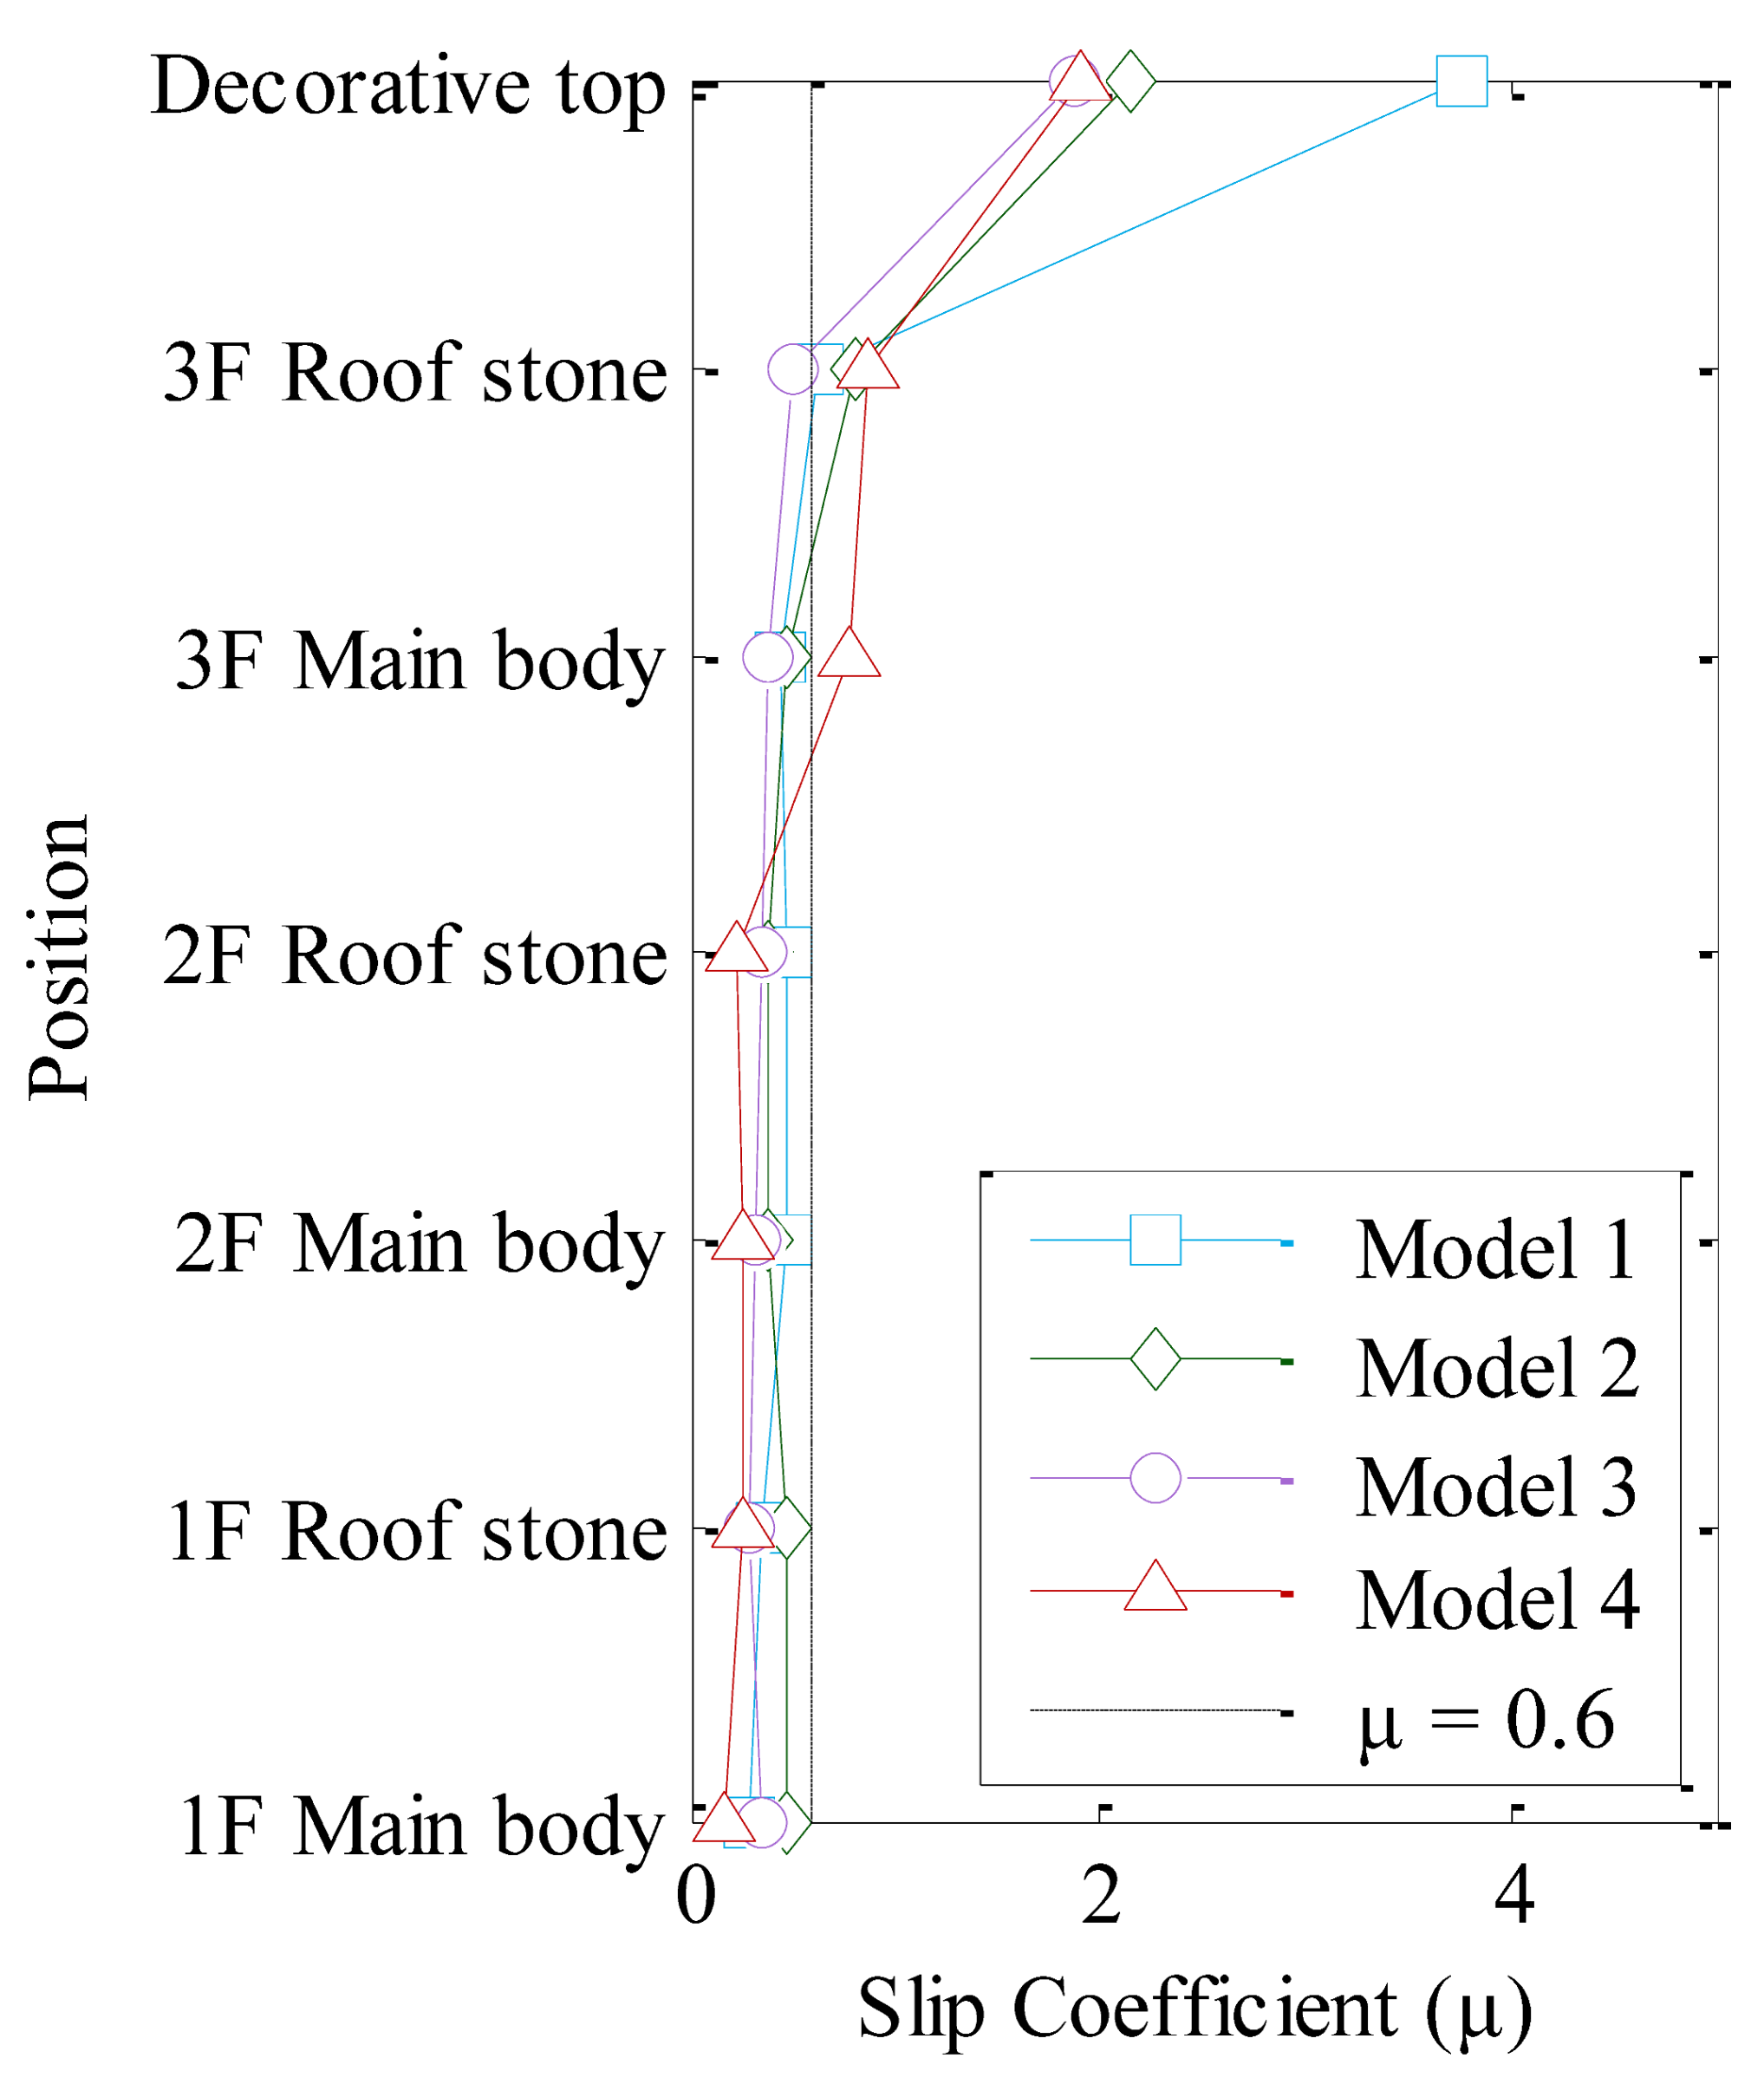
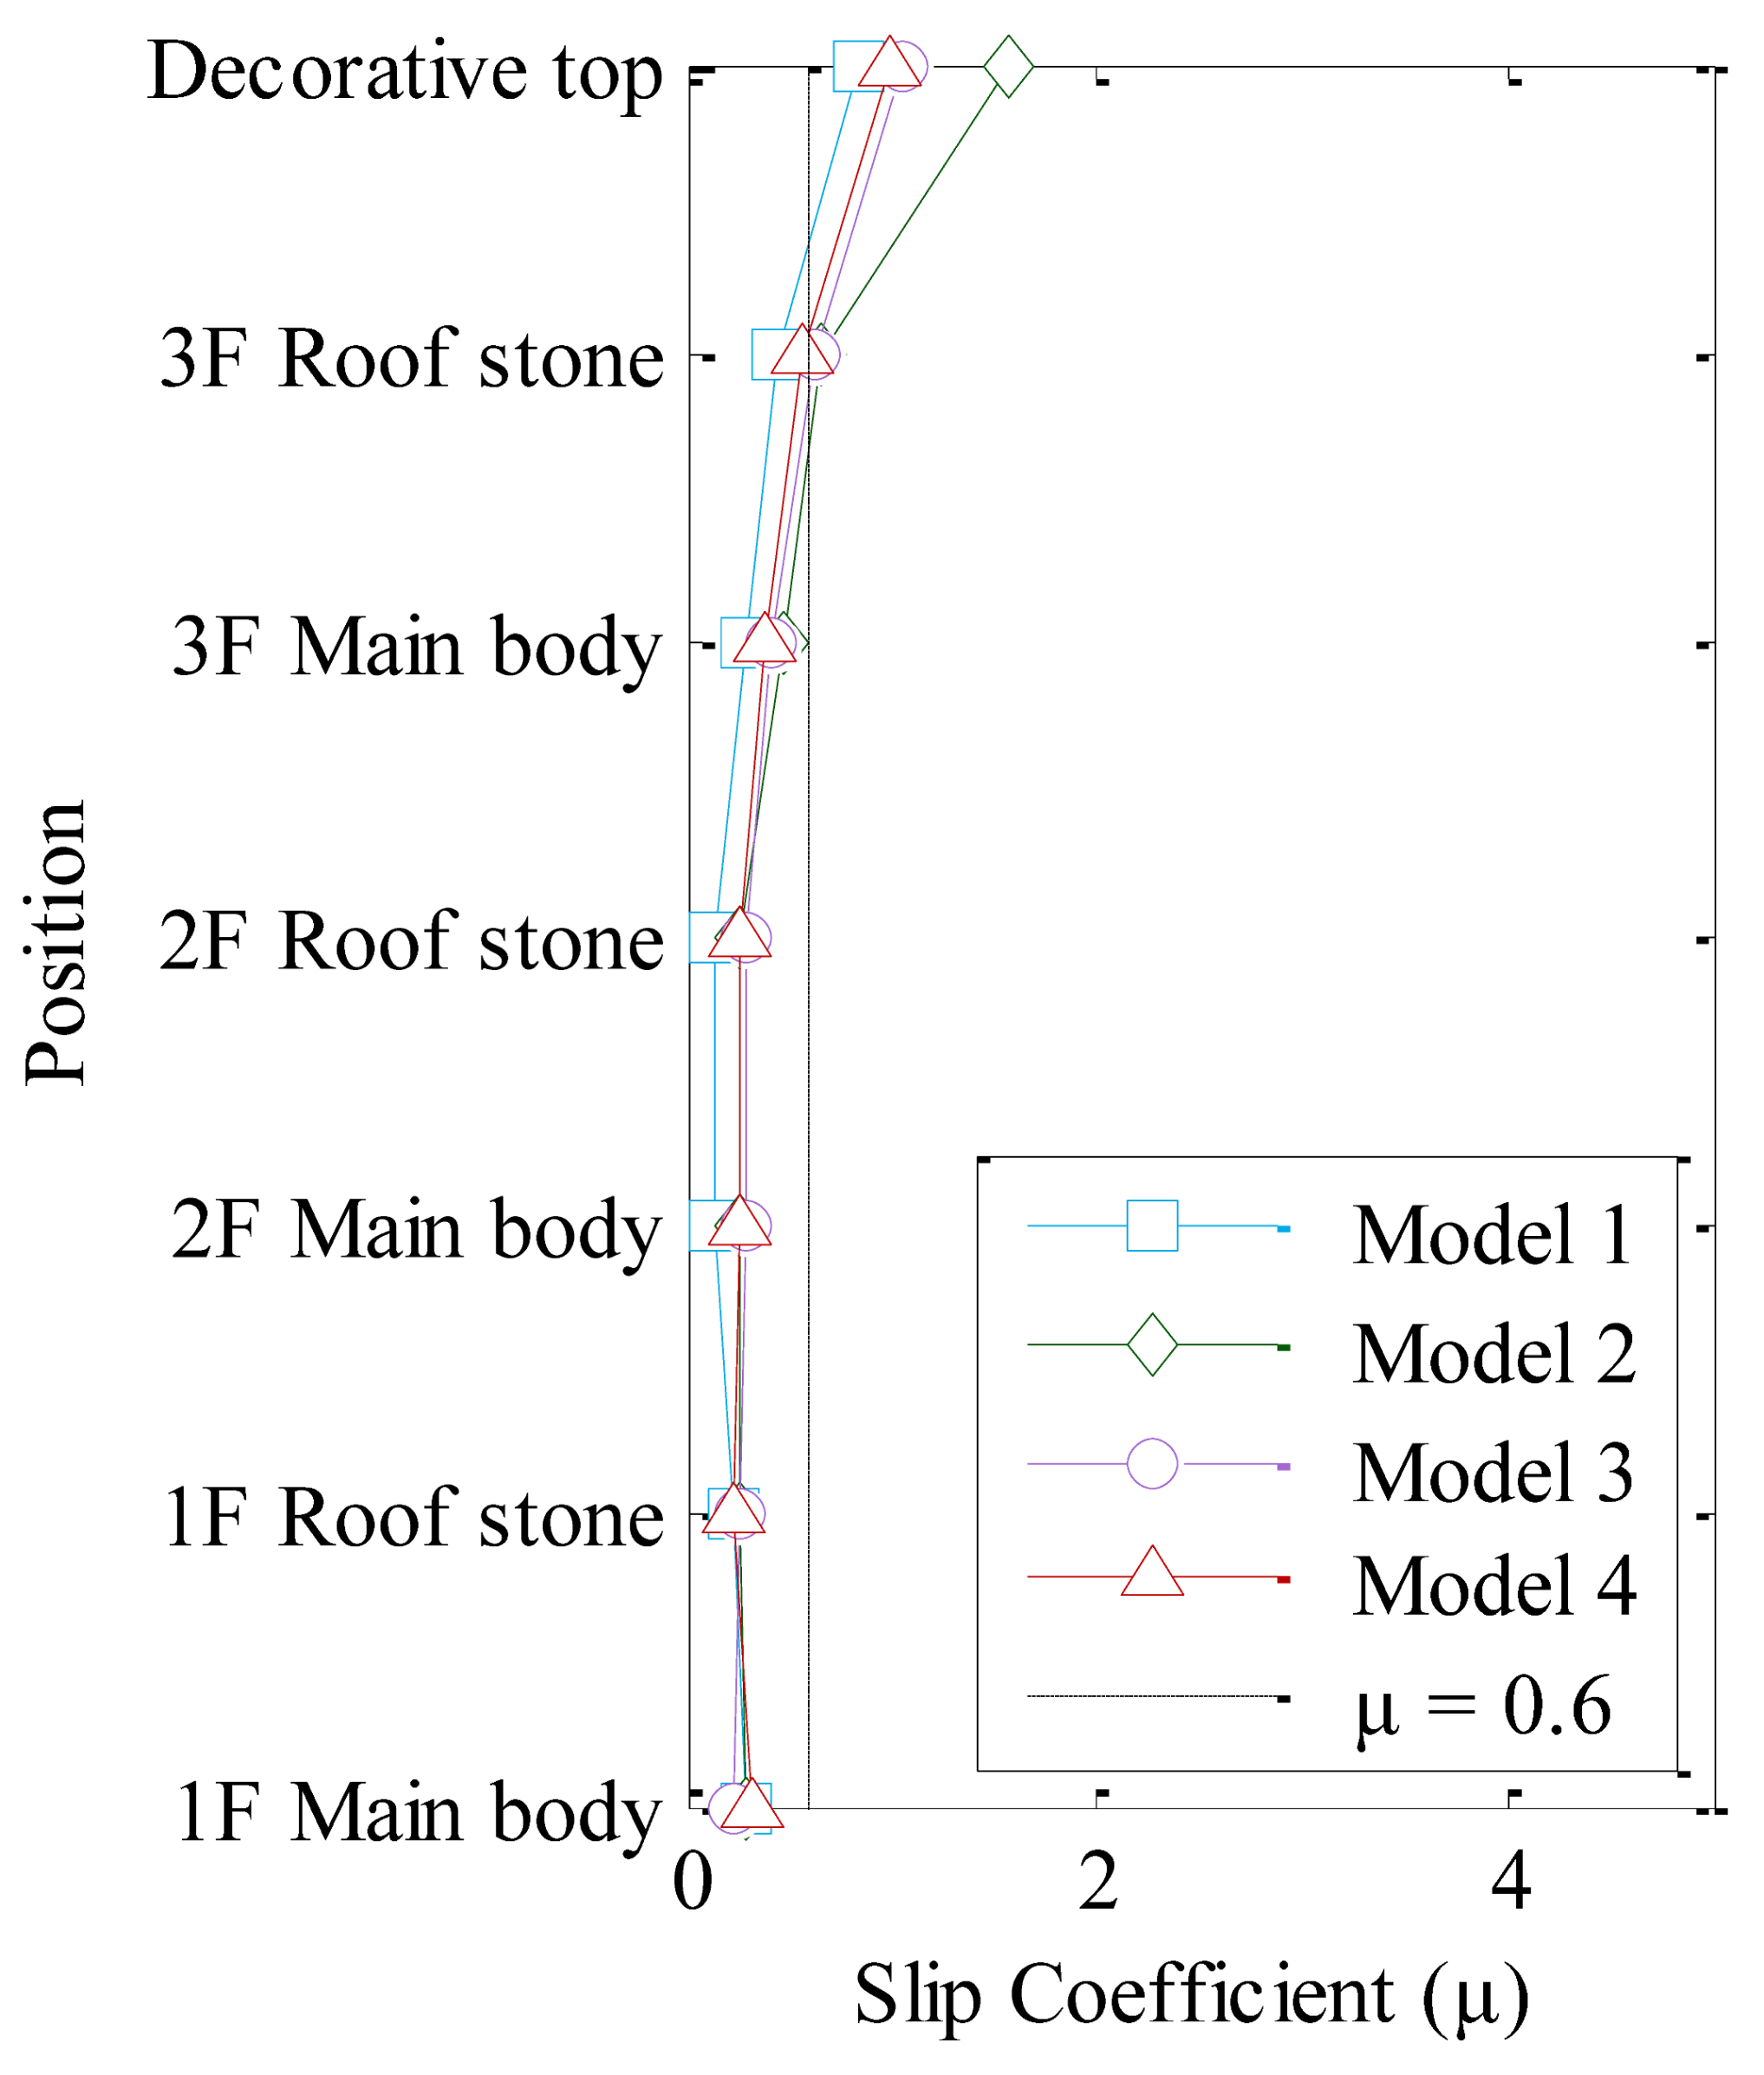
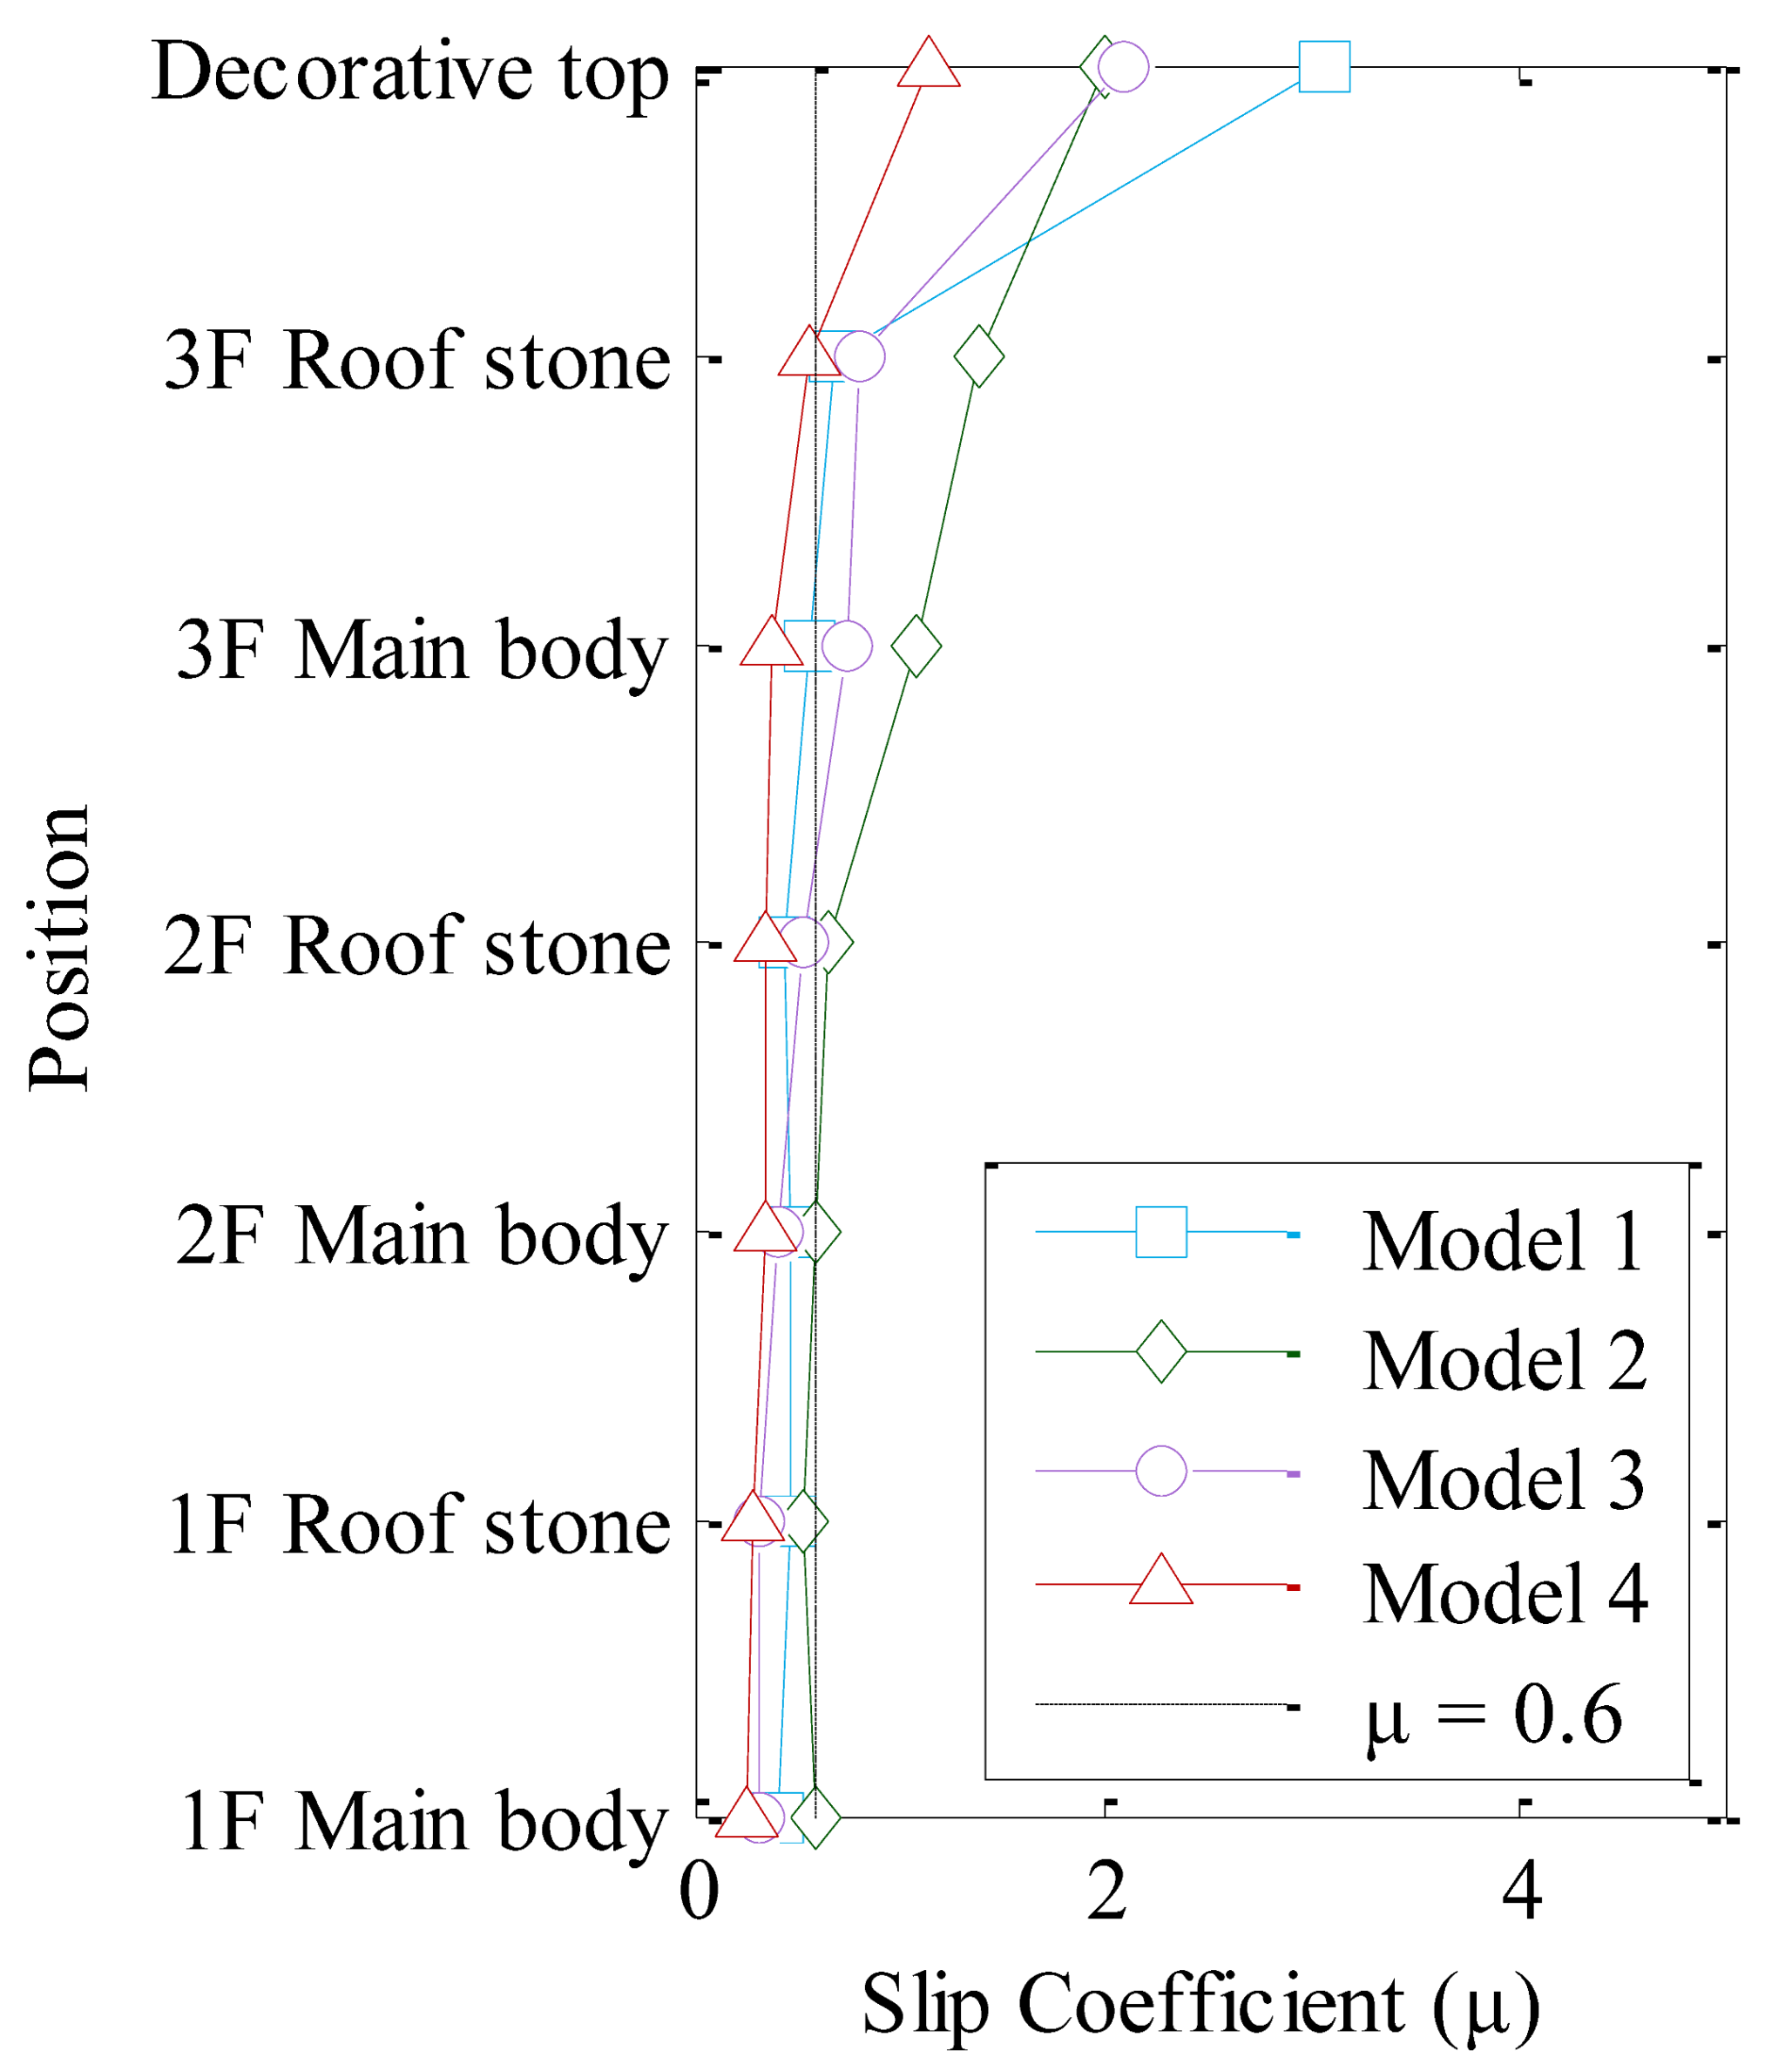
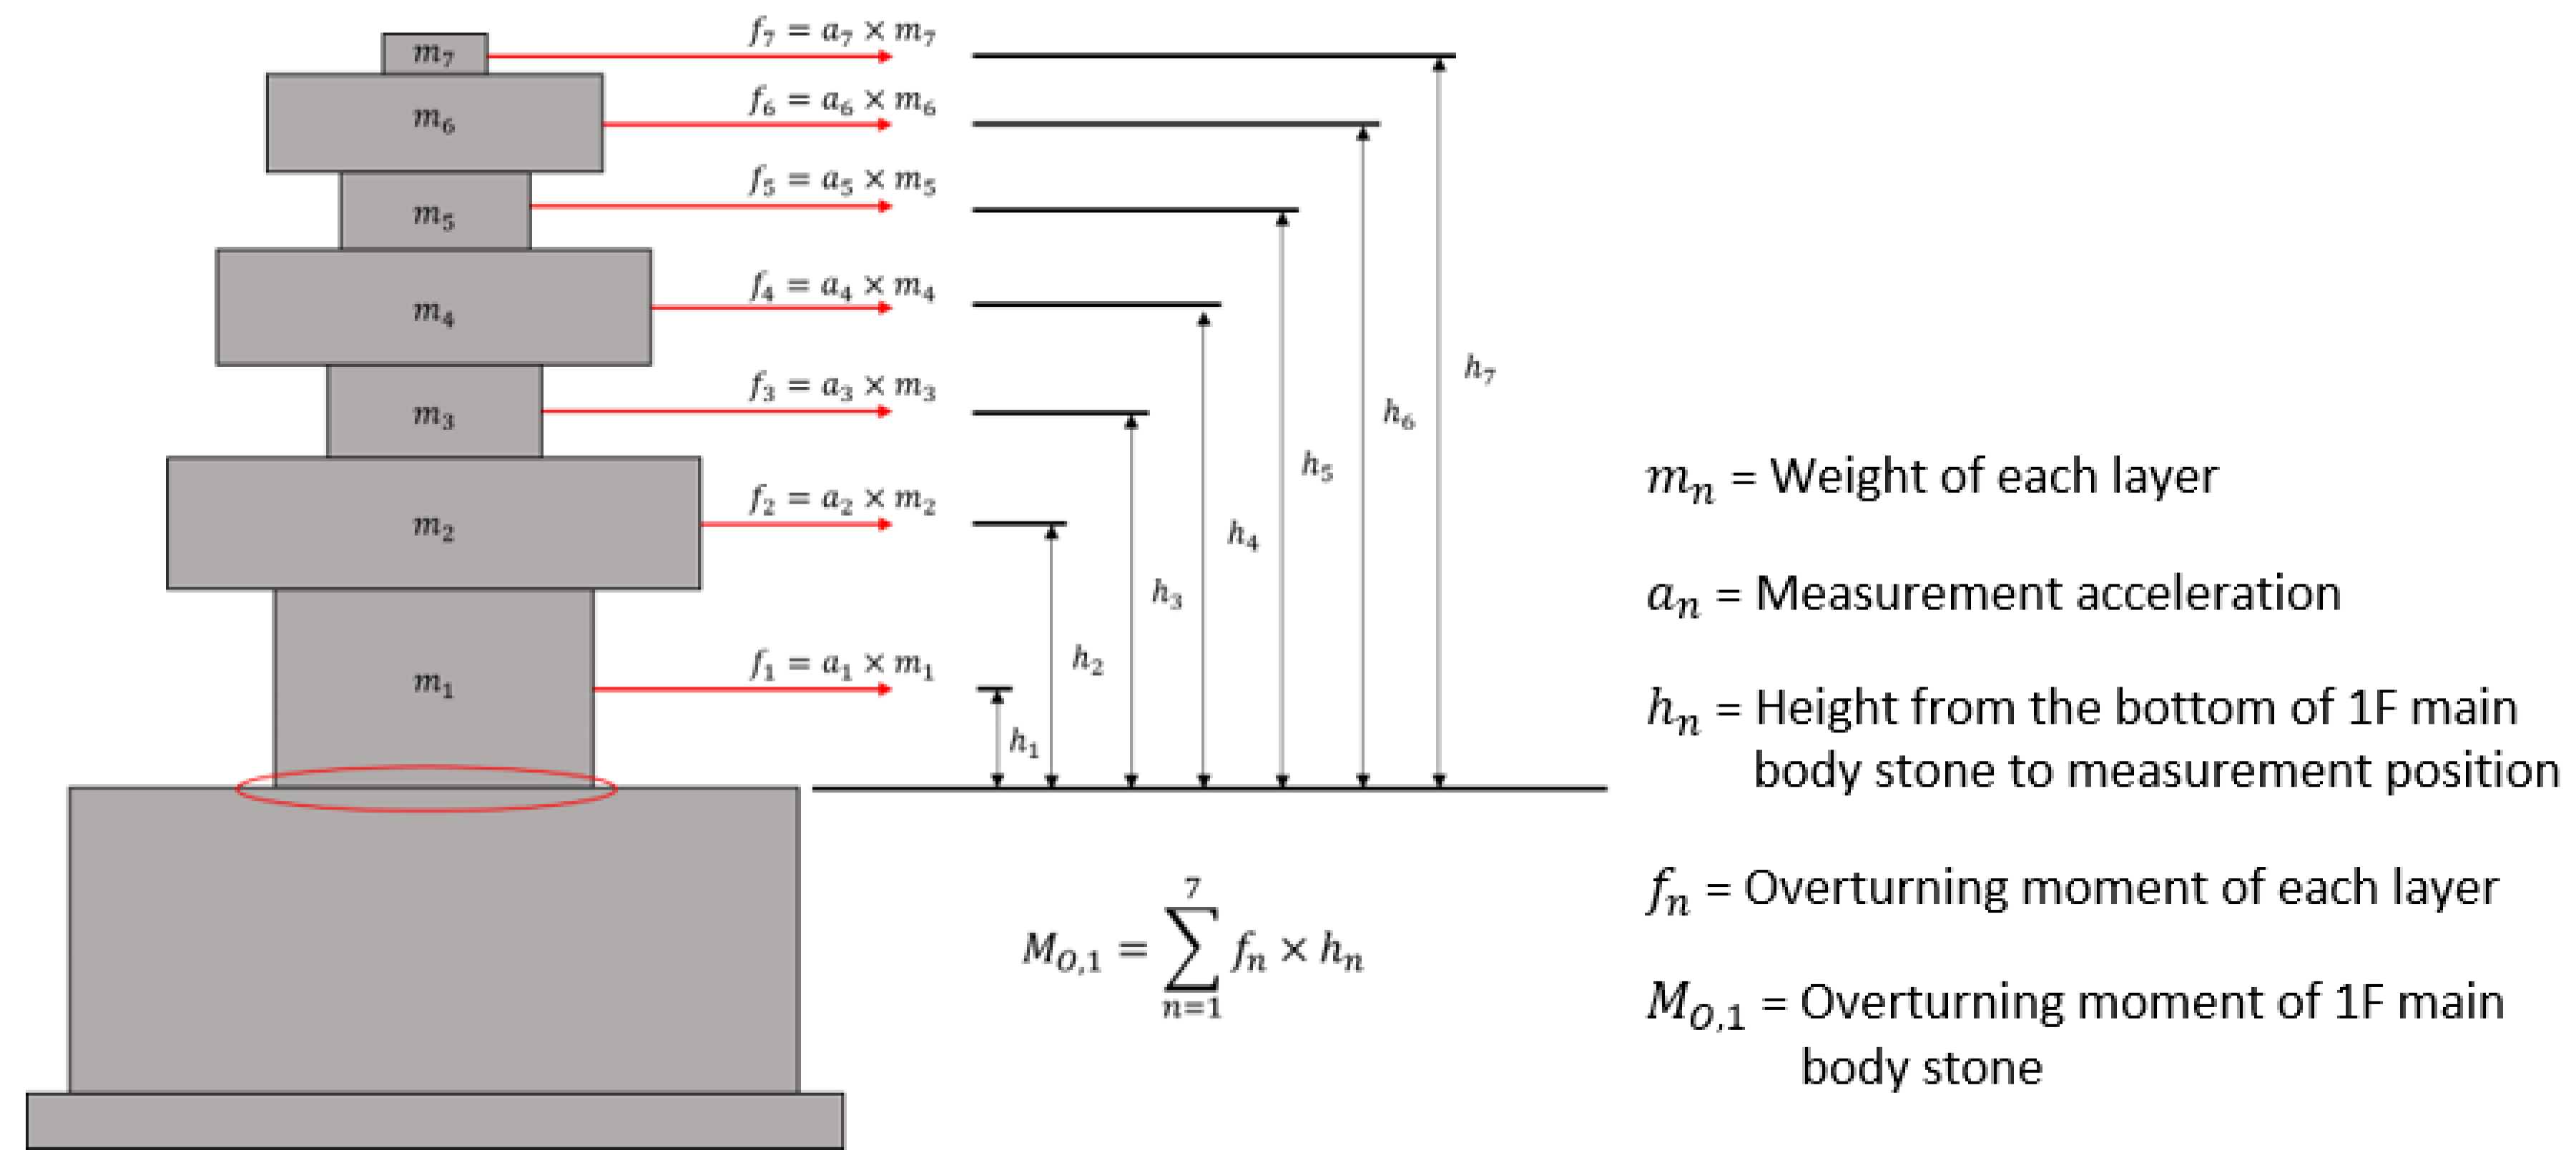
The Bingol earthquake caused the most sliding, mainly in the upper region. Both the self-weight and vertical loads reduced sliding in the lower region. Rocking of the decorative top was associated with a low overturning moment resistance; the top was very light and had minimal contact with other members. Furthermore, the first-story main body tended to rock because of its slender members.
When stylobate stiffness is high, seismic energy received at the bottom of the pagoda is transferred upwards, which is associated with upper-region deformation. When stylobate stiffness is low, the Jeoksim absorbs most of the seismic energy, an effect associated with large stylobate deformation. In particular, the tower stone is strongly affected by rocking, because it becomes more slender toward the bottom. In contrast, sliding damage increases toward the top, because it is associated with a low applied load and minimal contact surface with lower members.
Based on the test results, earthquake damages and countermeasures were analyzed. The main deformations in the stone pagoda structure were the separation between the Myeonseok, the separation and protrusion between the Gapseok, and the rotation and sliding of the tower body part. To reduce the damage of stylobates, steel connectors can be installed in Myeonseok and Gapseok to prevent separation, and a reinforcement method that increases the stiffness of stylobates by adding binder in Jeoksim can be applied. When an existing stone pagoda is restored, installing doweled joints or vertical steel connectors between the members can prevent the rocking and overturning. The damage caused by the sliding in the tower body part can be reduced through a method of increasing friction by changing the roughness of the contact surface or a reinforcement method of installing a binder on the contact surface.
Existing general experimental research focuses on analyzing the basic behavior of structures from experimental results, but reliable data for future structural analysis or maintenance are insufficient. Therefore, this study suggests directly useful values applicable to future numerical analysis by providing the demonstrated horizontal stiffness and moment capacity based on the experimental results. In addition, it provides sustainable countermeasures for the continuous preservation and maintenance of stone pagoda structures.
For further research, a detailed analysis of the stress acting on the stone is required by performing a structural analysis to examine the weak points of the stone pagoda structure and prepare a reinforcement plan. This study can provide basic data for structural modeling and analysis, and furthermore it can provide basic information for preventing earthquake damage and preparing countermeasures to contribute to the sustainable preservation and maintenance of stone pagoda structures.
Author Contributions
Conceptualization, H.-S.K. and S.-S.J.; methodology, D.-K.K.; software, G.-W.J. and D.-K.K.; validation, H.-S.K. and S.-S.J.; formal analysis, G.-W.J. and D.-K.K.; investigation, G.-W.J. and S.-H.K.; resources, S.-S.J. and S.-H.K.; data curation, G.-W.J. and S.-H.K.; writing—original draft preparation, G.-W.J. and S.-S.J.; writing—review and editing, G.-W.J. and S.-S.J.; visualization, G.-W.J. and S.-H.K.; supervision, H.-S.K.; project administration, H.-S.K. and S.-S.J.; funding acquisition, H.-S.K. All authors have read and agreed to the published version of the manuscript.
Funding
This research was carried out with the support of the Cultural Heritage Administration’s National Research Institute of Cultural Heritage.
Institutional Review Board Statement
Not applicable.
Informed Consent Statement
Not applicable.
Data Availability Statement
The data presented in this study are available on request from the corresponding author. The data are not publicly available due to plan to perform numerical analysis in the future.
Acknowledgments
The authors would like to express sincere gratitude for the support of the Cultural Heritage Administration’s National Research Institute of Cultural Heritage.
Conflicts of Interest
The authors declare no conflict of interest.
References
- Guerrini, G.; Senaldi, I.; Graziotti, F.; Magenes, G.; Beyer, K.; Penna, A. Shake-Table Test of a Strengthened Stone Masonry Building Aggregate with Flexible Diaphragms. Int. J. Arch. Herit. 2019, 13, 1078–1097. [Google Scholar] [CrossRef]
- Ruggieri, S.; Tosto, C.; Rosati, G.; Uva, G.; Ferro, G.A. Seismic Vulnerability Analysis of Masonry Churches in Piemonte after 2003 Valle Scrivia Earthquake: Post-event Screening and Situation 17 Years Later. Int. J. Arch. Herit. 2020, 1–29. [Google Scholar] [CrossRef]
- De Matteis, G.; Zizi, M. Seismic Damage Prediction of Masonry Churches by a PGA-based Approach. Int. J. Arch. Herit. 2019, 13, 1165–1179. [Google Scholar] [CrossRef]
- Ruggieri, N. Damage Assessment of Historical Masonry Churches Subjected to Moderate Intensity Seismic Shaking. Sustainability 2021, 13, 4710. [Google Scholar] [CrossRef]
- Fujita, K.; Kawai, N.; Minowa, C.; Koshihara, M.; Chiba, K. Shaking Table Test and Earthquake Response Monitoring of Traditional Japanese Timber Pagoda. In Proceedings of the 9th World Conference on Timber Engineering, Portland, OR, USA, 6–10 August 2006; pp. 207–214. [Google Scholar]
- Tashkov, L.; Mazzolani, F.; Portioli, F.; Landolfo, R.; Gramatikov, K.; Krstevska, L.; Mammana, O. Shaking table tests on the large scale model of Mustafa Pasha Mosque without and with FRP. In Structural Analysis of Historic Construction: Preserving Safety and Significance, Two Volume Set: Proceedings of the VI International Conference on Structural Analysis of Historic Construction, SAHC08, Bath, UK, 2–4 July 2008, 1st ed.; CRC Press: Boca Raton, FL, USA; pp. 383–391. [CrossRef]
- Lu, J.; Han, X.; Wang, Z.; Li, C. Research on Dynamic Properties of Ancient Masonry Pagoda with Solid Structure in China. Int. J. Arch. Herit. 2020, 1–21. [Google Scholar] [CrossRef]
- Gavrilovic, P.; Zelenkovska, V.; Ginell, W.S.; Sumanov, L. Development of a Methodology for seismic strengthening of Byzantine churches. Trans. Built Environ. 1995, 15, 37–44. [Google Scholar]
- Gavrilovic, P.; Sendova, V.; Kelley, S.J. Seismic isolation: A new approach to earthquake protection of historic monuments. Proc. IV Int. Semin. Struct. Anal. Hist. Constr. 2005, 4, 1257–1264. [Google Scholar]
- Sang-Hyo, K.; Moon-Seock, C.; Se-Jun, P.; Jin-Hee, A. Seismic Performance Evaluation of Masonry Walls Retrofitted with Semi-buried Lattice Reinforcement. J. Korea Inst. Struct. Maint. Insp. 2011, 15, 88–98. [Google Scholar]
- Krstevska, L.; Nikolić, Ž.; Kustura, M. Shake Table Testing of Two Historical Masonry Structures for Estimation of Their Seismic Stability. Int. J. Arch. Herit. 2021, 15, 45–63. [Google Scholar] [CrossRef]
- Jae-Kwan, K.; Won-Joo, L.; Young-Joong, K.; Byung-Hyun, K. Shaking Table Test of the Model of Five-story Stone Pagoda of Sang-Gye-Sa Mounted on Base Isolation Systems. Proc. Earthq. Eng. Soc. Korea Conf. 2001, 1, 331–338. [Google Scholar]
- Jae-Kwan, K.; Hyeuk, R. Dynamic Test of a Full Scale Model of Five-Story Stone Pagoda if Sang-Gye-Sa. J. Earthq. Eng. Soc. Korea 2001, 5, 51–66. [Google Scholar]
- Architectural Institute of Korea. KDS 41 17 00, Seismic Building Design Code; Ministry of land: Seoul, Korea, 2019; pp. 9–37.
- National Research Institute of Cultural Heritage (NRICH). Stone Pagoda of Gyeongsangbuk-do III; NRICH: Daejeon, Korea, 2009; p. 149. (In Korean) [Google Scholar]
- Sabnis, G.M.; Harris, H.G.; White, R.N.; Mirza, M.S. Structural Modeling and Experimental Techniques, 2nd ed.; CRC Press: Boca Raton, FL, USA, 1999. [Google Scholar]
- Kim, D.-K.; Park, H.-G.; Lee, H. Nonlinear system identification on shallow foundation using Extended Kalman Filter. Soil Dyn. Earthq. Eng. 2020, 128, 105857. [Google Scholar] [CrossRef]
Publisher’s Note: MDPI stays neutral with regard to jurisdictional claims in published maps and institutional affiliations. |
© 2021 by the authors. Licensee MDPI, Basel, Switzerland. This article is an open access article distributed under the terms and conditions of the Creative Commons Attribution (CC BY) license (https://creativecommons.org/licenses/by/4.0/).


