Abstract
In Mexico, atrazine is widely used in agriculture to control broadleaf weeds. The objective of this research was to compare atrazine removal in water and energy consumption between an up-flow cylinder electro-oxidation reactor (UCER) and an up-flow rectangular electro-oxidation reactor (URER) using the response surface methodology. In each reactor, two titanium (Ti) mesh electrodes (cathodes) and one Titanium-Lead Dioxide (Ti-PbO2) mesh electrode (anode). Current intensity effects, electrolysis treatment time, and recirculation flow were evaluated. Synthetic water with 5 mg/L atrazine content was used. Optimum atrazine removal values were obtained at 2 A electric current, 180 min of treatment time, and 200 mL/min recirculation rate for both reactors: in these conditions an atrazine removal of 77.45% and 76.89% for URER and UCER respectively. However, energy consumption showed a significant difference of 137.45 kWh/m3 for URER and 73.63 kWh/m3 for UCER. Regarding energy efficiency, a 60% atrazine removal was reached in both reactors using less energy for UCER at (1.5 A–135 min–150 mL/min–25.8 kWh/m3) and for URER at (0.66 A–135 min–150 mL/min–20.12 kWh/m3).
1. Introduction
Industrial development has led to numerous synthetic chemical products manufactured, the production of which increase the presence of potentially hazard pollutants in the environment. Mining activities, manufacturing processes, combustion, and pesticides are the main sources for heavy metals concentration discharged in waterbodies [1]. The presence of various organic compounds generates problems in agricultural, urban, and industrial wastewater [2]. It is common to talk about emerging contaminants such as pharmaceuticals, personal care products, surfactants, industrial additives, pesticides, herbicides, and a variety of chemical compounds, which are generally found in small concentrations (mg/L or even ng/L), and are not generally regulated by most countries [3].
Atrazine has been widely used as a pre-emergence and post-emergence herbicide for the control of herbaceous and broadleaf weeds in crops such as rice, wheat, corn, and sorghum [4]. It is a selective herbicide that can be applied to the soil before or after the germination of weeds, being absorbed by the roots and leaves. It can control the presence of weeds in crops and various types of grasses, as well as in lakes, ponds, golf courses, lawns, and along roads or railways. This herbicide was introduced in 1958 and its use has been increasing steadily since then [5].
In Mexico, atrazine is widely used in agricultural production to control broadleaf weeds, which inhibits photosynthesis; it has been found in water supply sources and is associated with health risks [5,6]. The application of various pesticides and their inappropriate disposal are contamination sources in underground water resources [7]. Furthermore, the processes of absorption, volatilization, degradation, mobility, and absorption of plants interact over time to determine the fate and transport of herbicides. Environmental factors, such as evapotranspiration, precipitation, and temperature, also affect herbicide transport [8].
Atrazine can cause irritation, some organs functions alteration, reproductive problems, hormonal levels alteration and birth defects in humans; carcinogenicity in animals, but not in humans [5]. Atrazine and its chlorinated degradation products have been found to be endocrine disruptors and potentially dangerous to human health even at low concentrations; Teratogen is also suspected. These compounds persist in drinking water sources for decades and require appropriate corrective measures [9]. There are some significantly negative impacts on plant photosynthesis, batrachian reproductive growth, and even human breast cancer [10]. Estimates of the half-life of atrazine range from 21 to 80 days [11]. Exposure to atrazine can occur through inhalation or dermal exposure.
Water treatment methods are contained chemical, biological, physical that should be technically considered in industrial processes [12]. The methods for removing pollutants from wastewater are physical, chemical, and biological processes; biological treatment, chemical oxidation and adsorption are the most used [13]. Biosorption offers the benefits of a low operating cost [14]. Biopurification systems are used to treat wastewater contaminated with pesticides such as lindane, atrazine, and diuron [15]. However, micropollutant removal has low values, generally between 20–50%. In recent years, electrocoagulation has been used successfully to treat a variety of industrial wastewater [16]. Coagulation-flocculation is a commonly conventional process used in water treatment [17]. The use of micro-algae in comparison with mentioned methods, in addition to the great effect on cost reduction, leads to the removal of Chemical Oxygen Demand (COD), reduction of the factors causing illnesses, phosphorus and nitrogen [18].
In recent years, advanced electrochemical oxidation technologies have drawn attention to wastewater treatment. They can generate highly potent oxidants in situ as OH radicals with electrical energy to deal with persistent organic pollutants, especially atrazine [9]. Electrochemical technologies have reached a promising state of development and can also be used effectively for contaminant removal [19]. Electrochemistry is a treatment related to electrical currents and chemical reactions, the conversion of chemical energy into electrical energy and in the opposite direction. Electro-oxidation is one of the electrochemical oxidation methods used to treat organic pollutants; degrades pollutants without forming other polluting residues, such as clots or flocs; requires a supporting electrolyte to improve electrical conductivity. Although sodium chloride is the most widely used for electrolytic processes, its use remains controversial due to the possible formation of organic by-products of chlorine. Recent work has shown that sodium sulfate is the best support electrolyte for the electrochemical process, considering economic, efficiency and environmental aspects [20].
The central composite design has been used for the analysis of results, which consists of a 23 factorial matrix with additional experiments at the extremes of low and high values (axial). This design includes uniformly distributed points in the space of the coded variables. The matrix allows the description of an optimal response region [21].
Romero-Soto et al. [21] obtained that the electrolysis time and the intensity of the current had the greatest effect on the elimination of chloramphenicol. Zadaka et al. [22] designed and tested the polycation (4-vinylpyridine-co-styrene) (PVP-co-S)–clay (mont- morillonite) composites for the removal of atrazine from water in batch experiments and by filtration. Atrazine removal from water was 90–99% even at its high concentrations. Zahran et al. [23] in an electrochemical sensor based on silver nanoparticles (AgNPs) was developed by immobilizing dissolved organic matter (DOM) to interact with AgNPs on a glassy carbon electrode (GC), forming a DOM/AgNP/GC composite. The DOM/AgNP/GC composite has been used for atrazine assessment under the optimized conditions based on the aggregated and nonaggregated AgNPs. The sensor linear range is between 20 and 220 μg/L for both aggregated and nonaggregated AgNP-based sensors. The electrochemical oxidation technique has shown 96% recovery values. Turan et al. [24] in an electrochemical method was optimized for atrazine removal from synthetic groundwater using TiO2 and graphite electrodes. The results show atrazine removal efficiency (99.70%) and close optimum conditions for both applied methods (pH 7 and 7.4; current 2.5 and 2 A and time 14 and 12.12 min, respectively). Zaviska et al. [25] carried out a study using a cylindrical reactor with electrodes of different material (Ti/IrO2 and Ti/SnO2), under different conditions (current intensity of 2 A and electrolysis time of 40 min), they obtained a 95% removal of atrazine; according to the analysis, the three variables studied have a significant effect on atrazine removal. The duration of electrolysis and the intensity of the current have a direct effect on the removal of atrazine, the longer the duration of the electrolysis, and the intensity of the current, the greater the removal.
The objective of this research was to compare the atrazine removal in water and the energy consumption between a cylindrical up-flow electrooxidation reactor and a rectangular up-flow electro-oxidation reactor, using the response surface methodology.
The novelty in this work is to make a comparison between two reactors of different configuration, stablishing a recirculation effect in atrazine removal and report energy consumption to scale for industrial applications.
2. Materials and Methods
2.1. Preparation of the Synthetic Solution
Analytical grade atrazine was used for the calibration curve. A stock solution of atrazine (20 mg/L) was prepared using distilled water. Atrazine was solubilized by stirring for 24 h at room temperature. This solution was kept refrigerated at 4 °C. Subsequently, a volume of 250 mL of atrazine stock solution was scaled to 1 L with distilled water. Then, it was stirred for 10 min. The resulting mixture, with a concentration of 5 mg/L, was used to carry out all the experiments. Sodium sulfate was used as an electrolyte support (400 mg/L) to increase the electrical conductivity. Using a synthetic solution reduces interference from unknown microelements present in rea water.
Calibration curve was made with analytical grade atrazine solutions with concentrations of 0.5, 1.0, 2.0, 3.0, 4.0 and 5.0 mg/L. Absorbance was measured for all solutions. A lineal equation for concentration vs. absorbance was made to calculate the atrazine content from absorbance results in the experiment samples.
2.2. Experimental Reactors
An up-flow cylindrical electro-chemical reactor (UCER) was manufactured using acrylic material with a radius of 4.6 cm and a height of 15.1 cm, with a total volume of one liter (Figure 1). The operating volume was 550 mL. Two circular titanium mesh electrodes were used as the cathode and one PbO2 coated titanium mesh electrode anode as the anode. All electrodes were placed in a concentric arrangement from the center to the periphery (cathode-anode-cathode) to maximize conductivity efficiency. Synthetic solution was put in recirculation flow with an external pump, electric current was added within an established time. Samples were taken before and after treatment.
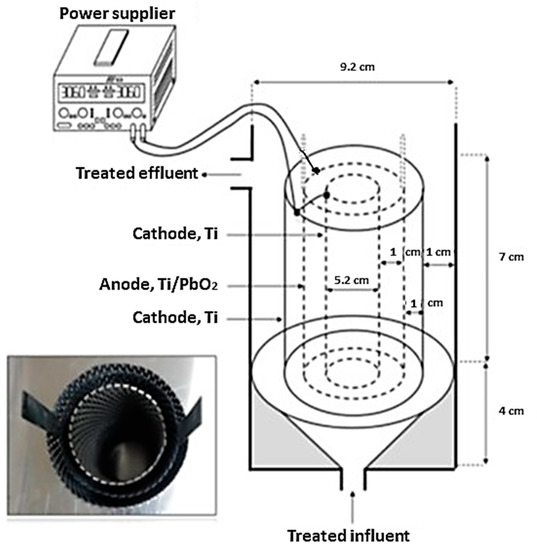
Figure 1.
Graphical representation of the up-flow cylindrical electro-chemical reactor (UCER).
A second configuration, an up-flow rectangular electro-chemical reactor (URER) was constructed of acrylic material with a width of 4.5 cm, a length of 12 cm and a height of 14 cm with a total volume of 756 mL and an operating volume of 550 mL (Figure 2). Two rectangular titanium mesh electrodes and a titanium mesh anode coated with PbO2 were interspersed. The electrodes were arranged in order (cathode-anode-cathode) to maximize conductivity efficiency. The space between electrodes was 1 cm. The recirculation flow was kept constant with a peristaltic pump at various flow rates. The intensity of the current was adjusted using a power supply with a maximum output of three amps. Processing was the same that used in the cylindrical reactor UCER.
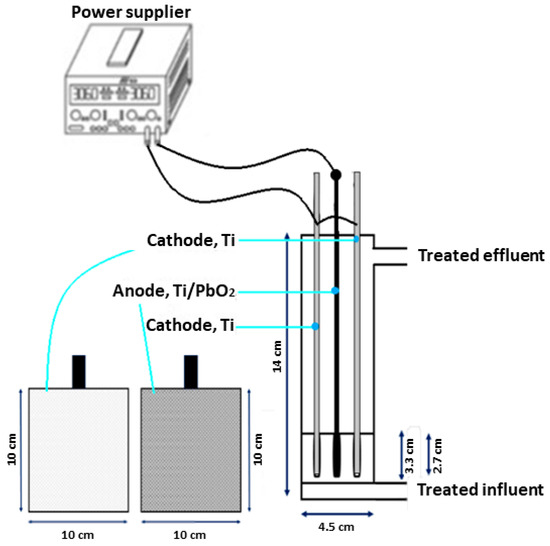
Figure 2.
Graphical representation of the up-flow rectangular electro-chemical reactor URER.
2.3. Samples and Measurements
Samples were taken at the beginning and at the end of each treatment. The atrazine concentration in the solution was determined by UV spectrophotometry. The maximum atrazine absorption was obtained by scanning with the spectrophotometer; the resulting wavelength of 223 nm was used to evaluate residual atrazine concentrations. A calibration curve of known concentration (0.5 to 5 mg/L) was used to calculate the atrazine concentration and estimate the removal efficiency.
2.4. Experimental Design
A preliminary experiment with a 23 factorial design (two level factorial experiment design with three factors) was carried out; time (min), intensity of electrical current (A) and recirculation flow rate (mL/min) were used as independent variables to evaluate their effect on atrazine removal percentage (%) and energy consumption (kWh/m3). In the case of electrical current intensity, the low value was 1 A while the high value was 2 A; over time, the values were 90 min and 180 min, low and high respectively; in the recirculation flow it was set at 100 mL/min and 200 mL/min for low and high values, respectively. Obtaining eight different experiments using the Design Expert 7.0® software. In addition, a central composite design was considered that resulted in six central values and six axial values, with a total of 20 experiments for each reactor. In total, 5 levels were evaluated for each reactor (Table 1).

Table 1.
Levels of the evaluated variables.
Table 2 shows the combination of variables for each of the 20 experiments. For each experiment the initial and final concentrations were obtained, and the removal efficiency was calculated according to the following Equation (1):
Table 2.
Matrix of atrazine removal treatments.
3. Results
3.1. Atrazine Removal
The results are presented in Table 3 and Table 4 and Figure 3 and Figure 4. The removal of atrazine is affected by the intensity of the current, the duration of the electrolysis and the recirculation flow, showing a significant difference. The highest removal was 76.89% in the UCER and 77.45% in the URER, both values achieved with a current intensity of 2 amperes, 180 min of duration of electrolysis and a flow of recirculation of 200 milliliters per minute (see Figure 3 and Figure 4). For simulation purpose please refer to Equations (2) and (3).
Table 3.
Atrazine removal and energy consumption in the cylindrical reactor UCER.
Table 4.
Atrazine removal and energy consumption in the rectangular reactor URER.
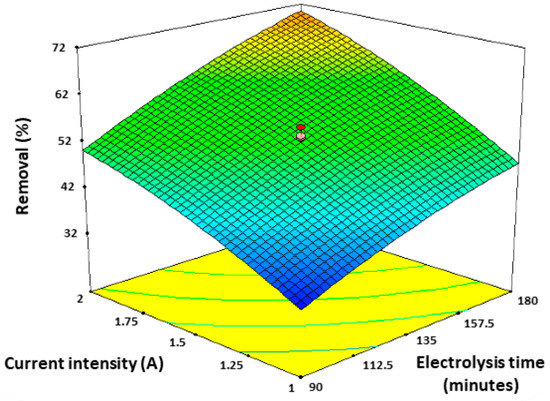
Figure 3.
Graphic representation of atrazine removal in the cylindrical reactor UCER.
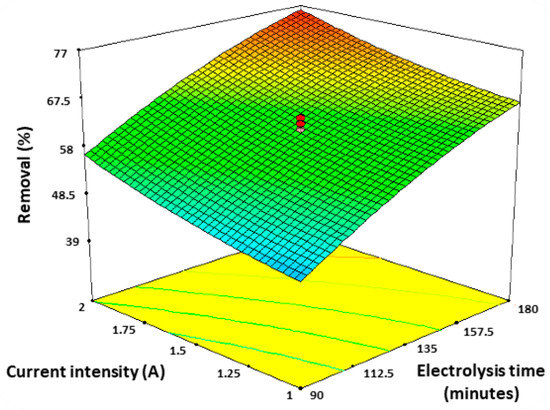
Figure 4.
Graphic representation of atrazine removal in the rectangular reactor URER.
Final Equation in terms of coded factors for atrazine removal in UCER:
Final Equation in terms of coded factors for atrazine removal in URER:
3.2. Energy Consumption
On the other hand, energy consumption showed a significant difference of 73.63 kWh/m3 and 137.45 kWh/m3 with a relative removal ratio of 1.04 and 0.56, respectively. During the electrochemical oxidation, part of the applied electrical energy was converted into heat, and transferred through the walls of the two reactors, where the cylindrical reactor had a surface area of 372 cm2, while the rectangular reactor had 504 cm2. The above explains why electricity consumption per cubic meter was: 73.63 kWh, and 137.45 kWh, respectively. The fact that in the cylindrical reactor the inflow is parallel to the electrodes causes a piston effect that decreases resistance, while the rectangular reactor has an inflow perpendicular to the electrodes, which hinders the piston effect and increases resistance. This could be the reason why the cylindrical reactor has lower energy consumption than the rectangular one and therefore a greater relative removal in the cylindrical reactor. Results are presented in Table 3 and Table 4 and Figure 5 and Figure 6. For simulation purpose please refer to Equations (4) and (5).
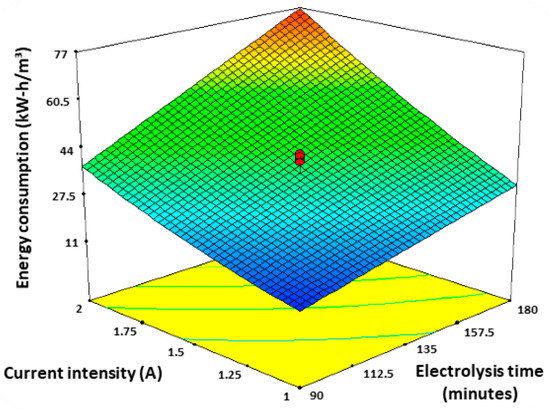
Figure 5.
Graphic representation of energy consumption in the UCER.
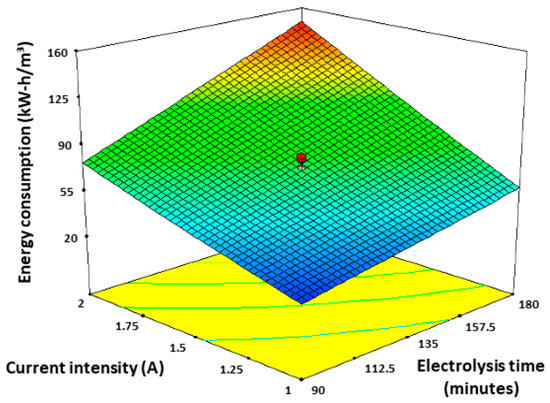
Figure 6.
Graphic representation of energy consumption in the rectangular reactor URER.
Final Equation in terms of coded factors for energy consumption in UCER:
Final Equation in terms of coded factors for energy consumption in URER:
3.3. Recirculation Rate Effect
In this study 20 treatments were run with different combinations for current intensity–treatment time–recirculation flow rate, a fraction of data was selected to show the circulation rate effect. Treatments 3, 5, 7, 12, 15, 16, 18, 19, were taken (1.5 A and 135 min). It was noted that recirculation rate effect was proportional to atrazine removal in both reactors UCER and URER, the more recirculation rate produced a major atrazine removal, to mention that in UCER atrazine removal had a decrement from 65.91 mL/min to 150 mL/min and posterior increment from 150 mL/min to 234.09 mL/min. In Figure 7 shows a chart for recirculation flow rate in mL/min versus average atrazine removal percentage for UCER and URER with fixed values of 1.5 A current intensity and 135 min treatment time.
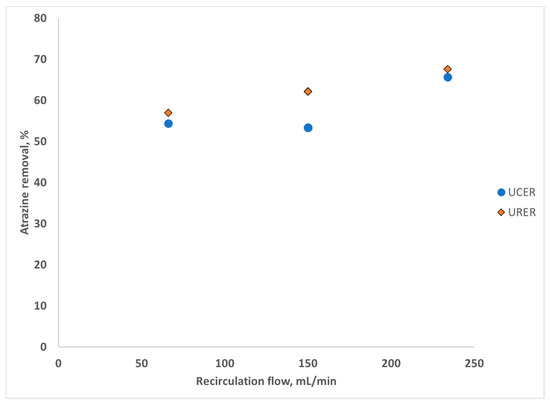
Figure 7.
Atrazine removal vs recirculation flow in UCER and URER for 1.5 A and 135 min treatment.
3.4. Process Efficiency
The duration of electrolysis and the intensity of the current with an average recirculation flow rate in the removal of atrazine can also be observed using the response surface plot in Figure 3 and Figure 5. The effect of the same variables on the Energy consumption is observed in Figure 4 and Figure 6. In addition, significant effects of the duration of electrolysis and the intensity of the current were demonstrated for the ANOVA analysis (F = 0.0001). In the case of recirculating flow, the indirect effect on atrazine removal is also significant for ANOVA analysis (F = 0.0075).
An additional analysis can be carried out considering the cost-benefit process with Table 5 and Table 6. A relative removal ratio is proposed as the relationship between the atrazine removal percentage per electrical energy (kWh/m3) used. Considering a removal of at least 60%, energy consumption can be drastically reduced. For the UCER, the best conditions considering a minimum of 60% atrazine removal were 1.5 A, 135 min of time and 150 mL/min of recirculation flow rate (relative removal ratio = 2.33) while the URER had 0.66 A, 135 min of time and 150 mL/min of recirculation (relative removal ratio = 3.01). According to this criterion, the relative optimal value removal ratio for a UCER is 1.04 and the optimal value for URER is 0.56.
Table 5.
Atrazine relative removal ratio in the cylindrical reactor UCER.
Table 6.
Atrazine relative removal ratio in the rectangular reactor URER.
3.5. Reactors Comparison
The ANOVA analysis comparing the effects between both reactors shows F = 0.0001 for atrazine removal and energy consumption, indicating that both reactors have significant difference.
4. Discussion
In accordance Romero-Soto et al. [21], the electrolysis time and the intensity of the current had the greatest effect on the elimination of atrazine. On the other hand, the atrazine removal in this research were lower (77.45% and 76.89% for URER and UCER respectively) than the reported by Zadaka et al. [22], (96%) using an electrochemical sensor based on silver nanoparticles (AgNPs), the process uses nanoparticles in different electrodes to the used in this study, and even with superior removal this process represents a higher cost and potential further processes. No energy consumption was reported.
Zahran et al. [23] reported 96% removal values using nanoparticles in different electrodes having a higher removal compared with this study, their process represents a higher cost and potential further cleaning processes and no energy consumption was reported.
Furthermore, Turan et al. [24], obtained atrazine removal efficiency of 99.70%, from synthetic groundwater (TiO2) using an electrochemical method and close optimum conditions for both applied methods (pH 7 and 7.4; current 2.5 and 2 A and time 14 and 12.12 min, respectively). Turan et al. [24] used different electrodes than the used in this research, but it coincides in the significant variables with current intensity values coinciding in 2A with this research and with less treatment time, however, does not report energy consumption.
The results observed in this research were also lower (77.45% and 76.89% for URER and UCER respectively) than the reported by Zaviska et al. [25], (95% of atrazine removal) using a cylindrical reactor. However, the authors used electrodes with a different material (Ti/IrO2 and Ti/SnO2), under different conditions (current intensity of 2 A and electrolysis time of 40 min), that the used in this research (two titanium (Ti) mesh electrodes (cathodes) and one Titanium-Lead Dioxide (Ti-PbO2) mesh electrode (anode)). The authors also, stated that their results were different when the conditions of the treatment used in its elimination change.
According Zaviska et al. [25], the three variables studied have a significant effect on atrazine removal. The duration of electrolysis and the intensity of the current have a direct effect on the removal of atrazine, the longer the duration of the electrolysis, and the intensity of the current, the greater the removal. In the present research the electrodes used were different than the used by Zaviska et al. [25]. However, there are some similarities in other variables such as; current intensity and treatment time, but with a different third independent variable. Zaviska et al. [25] maintains recirculation flow rate fixed and atrazine concentration variable, in this paper is presented the atrazine removal by maintaining an atrazine concentration fixed and recirculation flow rate variable. It was also noted that initial atrazine concentration used by Zaviska et al. [24] with value of 3.5 mg/L was very similar that the used in this research (5.0 mg/L), showing the major similarity. This research results show that the main four independent variables make an impact in the atrazine removal in water.
Above works do not report energy consumption, in contrast with this research showing this data.
From the statistical results obtained in this research, I, t, reactor type, and the interaction between I-t (Electrical current- time) where significant models. The results are in agreement with the observed by Romero-Soto et al. [19] the authors stated that the combination of electrolysis time and the current intensity, are significant parameters in the chloramphenicol removal.
On the other hand, in this research the electrical current had a significant effect in the atrazine removal, this results are also in agreement with the reported by Turan et al. [24], the authors mentioned the importance of electrical current of 2.5 and 2 A in the removal of atrazine from agriculture used. However, Turan et al. [24] used a different reactor (Batch electrochemical experiments), and in this study a recirculation reactor was used.
5. Conclusions
The removal of atrazine in both different reactors is similar, 77.45% and 76.89% in the rectangular and cylindrical reactors, respectively. On the other hand, energy consumption showed a significant difference of 137.45 kWh/m3 and 73.63 kWh/m3 with a relative removal ratio of 0.56 and 1.04 respectively.
Considering a removal of at least 60% (which can be used for industrial applications), the highest relative removal ratio value in the cylindrical reactor was 2.33 with 1.5 A, 135 min of time and 150 mL/min recirculation flow conditions, while the rectangular reactor had 0.66 A, 135 min of time and conditions of recirculation flow of 150 mL/min.
The obtained results show that treatment time, current intensity (and recirculation flow rate in URER) have a direct proportional influence in the atrazine removal in water. In contrast, the effect of recirculation flow rate in UCER shows no direct effect in atrazine removal, leading to atrazine removal lower value at 150 mL/min. All the variables showed a statistically significant effect. I, t, Q, and the interaction between I-t (Electrical current- time).
This process appears to be a promising technology that could be used as a tertiary treatment to remove emerging contaminants from water.
Author Contributions
P.G.-M., J.A.V.-C., C.G.-G., J.N.-A., and L.A.S.-G.; methodology, P.G.-M., J.A.V.-C., C.G.-G., J.N.-A., L.A.L.-S., and L.A.S.-G.; software, P.G.-M., J.A.V.-C., C.G.-G., J.N.-A., and L.A.S.-G.; validation, P.G.-M., J.A.V.-C., and C.G.-G.; formal analysis, P.G.-M., J.N.-A., J.A.V.-C., L.A.S.-G., E.R.M.-E., L.M.D.-T., and C.G.-G.; investigation, J.N.-A., and L.A.S.-G.; resources, P.G.-M., and J.N.-A.; data curation, P.G.-M., J.N.-A., J.A.V.-C., C.G.-G., and E.M.-O.; writing—original draft preparation, J.N.-A., C.D.L.M.-O., and E.M.-O.; writing—review and editing, J.N.-A., C.D.L.M.-O., L.A.L.-S. and E.M.-O.; visualization, J.N.-A., C.D.L.M.-O., and E.M.-O. All authors have read and agreed to the published version of the manuscript.
Funding
This research received no external funding.
Institutional Review Board Statement
Not applicable.
Informed Consent Statement
Not applicable.
Data Availability Statement
The data presented in this study are available on request from the corresponding author. The data are not publicly available due to not having a public repository at the moment of this publication.
Acknowledgments
All authors thank the Instituto Tecnológico de Sonora, and the Universidad Autónoma de Nuevo León; for the financial support, and laboratory facilities for carrying out this study. Also, the first author expresses his thanks to CONACYT for the Ph.D. scholarship.
Conflicts of Interest
The authors declare no conflict of interest.
Abbreviations
The following abbreviations are used in this manuscript:
| C0 | Initial atrazine concentration [mg/L] |
| Cf | Final atrazine concentration [mg/L] |
| E | Energy consumption [kWh/m3] |
| I | Current intensity, [A] |
| N | Relative removal ratio [%.m3/kWh] |
| Q | Recirculation flow rate, [mL/min] |
| R | Atrazine removal percentage [%] |
| t | Time, [min] |
| UCER | Up-flow cylindrical electro-chemical reactor |
| URER | Up-flow rectangular electro-chemical reactor |
References
- Balderrama-Carmona, A.Y.; Silva-Beltrán, P.S.; Ayala-Parra, P.A. Estimating the Health Risk Assessment of the Consumption of Oreochromis Niloticus, Tap Water, Surface Water and Prey Sediments, Contaminated with Heavy Metals in Communities Close to a Copper Mine and to Adolfo Ruiz Cortines Dam, in Sonora, Mexico. Rev. Bio Cienc. 2019, 6, 1–12. [Google Scholar] [CrossRef]
- Loos, R.; Carvalho, R.; António, D.C.; Comero, S.; Locoro, G.; Tavazzi, S.; Paracchini, B.; Ghiani, M.; Lettieri, T.; Blaha, L.; et al. EU-Wide Monitoring Survey on Emerging Polar Organic Contaminants in Wastewater Treatment Plant Effluents. Water Res. 2013, 47, 6475–6487. [Google Scholar] [CrossRef]
- Diamantis, B.P.; Stamatis, A.G. Incorporating Available Micro Gas Turbines and Fuel Cell: Matching Considerations and Performance Evaluation. Appl. Energy 2013, 103, 607–617. [Google Scholar] [CrossRef]
- Amadori, M.F.; Rodrigues, M.B.; Rebouças, C.C.; Peralta-Zamora, P.G.; Grassi, M.T.; Abate, G. Behavior of Atrazine and Its Degradation Products Deethylatrazine and Deisopropylatrazine in Oxisol Samples. Water Air Soil Pollut. 2016, 227, 1–13. [Google Scholar] [CrossRef]
- Hansen, A.M.; Treviño-Quintanilla, L.G.; Márquez-Pacheco, H.; Villada-Canela, M.; González-Márquez, L.C.; Guillén-Garcés, R.A.; Hernández-Antonio, A. Atrazina: Un Herbicida Polémico. Rev. Int. Contam. Ambient. 2013, 29, 65–84. Available online: https://www.revistascca.unam.mx/rica/index.php/rica/article/view/41420 (accessed on 20 January 2021).
- González-Márquez, L.C.; Hansen, A.M. Efecto de la salinidad en la adsorción de un herbicida en suelos agrícolas. Rev. Int. Contam. Ambient. 2014, 30, 191–199. Available online: http://www.scielo.org.mx/scielo.php?pid=S0188-49992014000200006&script=sci_abstract&tlng=pt (accessed on 20 January 2021).
- Góngora-Echeverría, V.R.; Martin-Laurent, F.; Quintal-Franco, C.; Lorenzo-Flores, A.; Giácoman-Vallejos, G.; Ponce-Caballero, C. Dissipation and Adsorption of 2,4-D, Atrazine, Diazinon, and Glyphosate in an Agricultural Soil from Yucatan State, Mexico. Water Air Soil Pollut. 2019, 230, 1–15. [Google Scholar] [CrossRef]
- Tindall, J.; Friedel, M.J. Transport of Atrazine Versus Bromide and δO 18 in Sand. Water Air Soil Pollut. 2016, 227, 1–11. [Google Scholar] [CrossRef]
- Ding, X.; Wang, S.; Shen, W.; Mu, Y.; Wang, L.; Chen, H.; Zhang, L. Fe@Fe2O3 promoted electrochemical mineralization of atrazine via a triazinon ring opening mechanism. Water Res. 2017, 112, 9–18. [Google Scholar] [CrossRef] [PubMed]
- Wang, H.; Li, L.; Cao, X.; Long, X.; Li, X. Enhanced Degradation of Atrazine by Soil Microbial Fuel Cells and Analysis of Bacterial Community Structure. Water Air Soil Pollut. 2017, 228, 1–10. [Google Scholar] [CrossRef]
- Schwab, A.P.; Splichal, P.A.; Banks, M.K. Persistence of Atrazine and Alachlor in Ground Water Aquifers and Soil. Water Air Soil Pollut. 2006, 171, 203–235. [Google Scholar] [CrossRef]
- Jin, Y.; Davarpanah, A. Using Photo-Fenton and Floatation Techniques for the Sustainable Management of Flow-Back Produced Water Reuse in Shale Reservoirs Exploration. Water Air Soil Pollut. 2020, 231, 1–8. [Google Scholar] [CrossRef]
- Ghamsari, M.; Madrakian, T. Highly Fast and Efficient Removal of Some Cationic Dyes from Aqueous Solutions Using Sulfonated-Oxidized Activated Carbon. Anal. Bioanal. Chem. Res. 2019, 6, 157–169. [Google Scholar] [CrossRef]
- Almeida, F.B.P.S.; Meili, L.; Soletti, J.I.; Esquerre, K.P.S.O.R.; Ribeiro, L.M.O.; de Farias Silva, C.E. Oil produced water treatment using sugarcane solid residue as biosorbent. Rev. Mex. Ing. Química 2019, 18, 27–38. [Google Scholar] [CrossRef]
- Castro-Gutiérrez, V.; Masís-Mora, M.; Carazo-Rojas, E.; Mora-López, M.; Rodríguez-Rodríguez, C.E. Fungal and Bacterial Co-Bioaugmentation of a Pesticide-Degrading Biomixture: Pesticide Removal and Community Structure Variations during Different Treatments. Water Air Soil Pollut. 2019, 230, 1–13. [Google Scholar] [CrossRef]
- Zaroual, Z.; Chaair, H.; Essadki, A.H.; El Ass, K.; Azzi, M. Optimizing the Removal of Trivalent Chromium by Electrocoagulation Using Experimental Design. Chem. Eng. J. 2009, 148, 488–495. [Google Scholar] [CrossRef]
- Sandoval-Reyes, J.L.; Ramírez-Zamora, R.M. Simultaneous removal of dissolved organic matter, microcystis aeruginosa, and microcystin-lr by pre-oxidation and coagulation-flocculation processes. Rev. Mex. Ing. Química 2019, 18, 889–900. [Google Scholar] [CrossRef]
- Valizadeh, K.; Davarpanah, A. Design and construction of a micro-photo bioreactor in order to dairy wastewater treatment by micro-algae: Parametric study. Energy Sources Part A Recovery Util. Environ. Eff. 2020, 42, 611–624. [Google Scholar] [CrossRef]
- Farhadi, S.; Aminzadeh, B.; Torabian, A.; Khatibikamal, V.; Fard, M.A. Comparison of COD removal from pharmaceutical wastewater by electrocoagulation, photoelectrocoagulation, peroxi-electrocoagulation and peroxi-photoelectrocoagulation processes. J. Hazard. Mater. 2012, 219–220, 35–42. [Google Scholar] [CrossRef]
- García-Gómez, C.; Drogui, P.; Zaviska, F.; Seyhi, B.; Gortáres-Moroyoqui, P.; Buelna, G.; Neira-Sáenz, C.; Estrada-Alvarado, M.; Ulloa-Mercado, R.G. Experimental Design Methodology Applied to Electrochemical Oxidation of Carbamazepine Using Ti/PbO2 and Ti/BDD Electrodes. J. Electroanal. Chem. 2014, 732, 1–10. [Google Scholar] [CrossRef]
- Romero-Soto, I.C.; Dia, O.; Leyva-Soto, L.A.; Drogui, P.; Buelna, G.; Díaz-Tenorio, L.M.; Ulloa-Mercado, R.G.; Gortáres-Moroyoqui, P. Degradation of Chloramphenicol in Synthetic and Aquaculture Wastewater Using Electrooxidation. J. Environ. Qual. 2018, 47, 805–811. [Google Scholar] [CrossRef] [PubMed]
- Zadaka, D.; Nir, S.; Radian, A.; Mishael, Y.G. Atrazine removal from water by polycation-clay composites: Effect of dissolved organic matter and comparison to activated carbon. Water Res. 2009, 43, 677–683. [Google Scholar] [CrossRef] [PubMed]
- Zahran, M.; Khalifa, Z.; Zahran, M.A.H.; Abdel Azzem, M. Dissolved Organic Matter-Capped Silver Nanoparticles for Electrochemical Aggregation Sensing of Atrazine in Aqueous Systems. ACS Appl. Nano Mater. 2020, 3, 3868–3875. [Google Scholar] [CrossRef]
- Turan, N.B.; Sari Erkan, H.; Çaglak, A.; Bakırdere, S.; Engin, G.O. Optimization of atrazine removal from synthetic groundwater by electrooxidation process using titanium dioxide and graphite electrodes. Sep. Sci. Technol. 2020, 55, 3036–3045. [Google Scholar] [CrossRef]
- Zaviska, F.; Drogui, P.; Blais, J.F.; Mercier, G.; Lafrance, P. Experimental Design Methodology Applied to Electrochemical Oxidation of the Herbicide Atrazine Using Ti/IrO2 and Ti/SnO2 Circular Anode Electrodes. J. Hazard. Mater. 2011, 185, 1499–1507. [Google Scholar] [CrossRef] [PubMed]


Publisher’s Note: MDPI stays neutral with regard to jurisdictional claims in published maps and institutional affiliations. |
© 2021 by the authors. Licensee MDPI, Basel, Switzerland. This article is an open access article distributed under the terms and conditions of the Creative Commons Attribution (CC BY) license (https://creativecommons.org/licenses/by/4.0/).