Abstract
Disaster risk management, including response and recovery, are essential elements of sustainable development. With the recent increase in natural hazards, the importance of techniques to understand, model and predict the evacuation and returning behavior of affected individuals is rising. Studies have found that influence from real world social ties affects mobility decisions during disasters. Despite the rapid spread of social media platforms, little has been quantitatively understood about the influence of social ties on online social media on such decisions. Information provided by who at what timing influences users’ decision-making process by how much during disasters? In this study, we answer these research questions by proposing a data-driven framework that can predict post-disaster mobility decisions and simultaneously unravel the influence of various information on online social media. More specifically, our method quantifies the influence of information provided by different types of social media accounts on the peoples’ decisions to return or stay displaced after evacuation. We tested our approach using real world data collected from more than 13 million unique Twitter users during Hurricane Sandy. Experiments verified that we can improve the predictive accuracy of return and displacement behavior, and also quantify the influence of online information. In contrast to popular beliefs, it was found that information posted by the crowd influenced the decisions more than information disseminated by official accounts. Improving our understanding of influence dynamics on online social media could provide policy makers with insights on how to disseminate information on social media more effectively for better disaster response and recovery, which may contribute towards building sustainable urban systems.
1. Introduction
Disaster risk management, including response and recovery, are essential elements of sustainable development [1,2,3]. With the increase in both the severity and frequency of natural hazards in recent years, the importance of techniques to understand, model, and predict the evacuation and returning behavior of affected individuals is rising [4]. Studies using household surveys and focus group interviews have revealed the effect of various factors on the decision-making processes of the affected people during disasters. Sociodemographic factors such as family membership, race, and income, hazard related factors including the intensity of the hazard and location of residence, and individual factors including past disaster experiences and risk perception, were shown to have influence on mobility decision making processes [5,6,7,8,9,10,11,12,13]. In addition to such factors, studies have found social influence to be an important psychological process that characterizes the decision to evacuate or not during a crisis [14]. Studies have modeled the influence of real-world social network ties on post-disaster mobility decisions using statistical model [15] and simulation approaches [16].
The rapid spread of various social media platforms such as Twitter and Facebook have drastically increased the number of channels from which individuals can obtain information during disasters [17]. Social media platforms are being utilized to disseminate information by official agencies such as the Federal Emergency Management Agency (FEMA), The White House, and non-profit organizations such as the Red Cross [18]. Studies in other domains have revealed the significant influence of information from online social media platforms on opinion formation, which could lead to serious real-world consequences such as election outcomes and stock prices [19,20]. Studies have mainly focused on understanding how social media platforms are being utilized during hazards and who disseminates what types of information [21,22]. Despite such recent efforts, little has been quantitatively understood on whose information provided at what timing influences users’ decision making and by how much. This gap in the literature is mainly due to limitations in the current methods and models that are used to investigate the influence of online social media information on post-disaster mobility decisions.
In this study, we attempt to overcome the aforementioned research gaps by proposing a data-driven framework that can predict post-disaster mobility decisions and also unravel the influence of various information posted on online social media. More specifically, we investigate how information provided by various types of users influences people to return or stay displaced after evacuation. We test our proposed approach using real world data collected from more than 13 million unique Twitter users during Hurricane Sandy. Experiments verify that our proposed approach can (1) improve the predictive accuracy of returning and displacement behavior by utilizing information from social media, and (2) unravel whose information provided when, has how much influence on the decision-making process of the evacuees. Unraveling such influence dynamics of online social media information could provide policy makers with insights on how to disseminate information on social media more effectively for better disaster recovery.
The article is organized as follows: a thorough literature review of studies that predict post-disaster mobility decisions using household survey data and social media data is performed in Section 2. Section 3 describes the materials and methods used in this paper, including the data sources, data processing methods, machine learning methodology, and the classification problem setting. Section 4 presents the results of the modeling and analysis, which are discussed in Section 5. Section 6 concludes the paper with final remarks.
2. Literature Review
The recent increase in the severity and intensity of natural hazards has raised the importance of understanding and modeling the various mobility decisions due to natural hazards including evacuation, return, long term displacement, and migration [4]. Household surveys and focus group interviews have traditionally been the primary data source to understand post-disaster behavior [5,6,7]. Although findings vary across disaster events due to the differences in social context and the characteristics of the hazard, it is generally known that factors such as income, race, family membership, location of residence, storm intensity and past disaster experiences, all affect the mobility decisions of the affected households in a complex manner [8,9,10,11,12,13]. Studies have attempted to model the decision-making mechanisms of households using various statistical methods including sequential logit models [23], mixed logit models [24], hazard models [25], and regression analysis [26]. In addition to such factors, studies have revealed the significant effect of social ties within the community network on evacuation and return decisions [15]. Such social relationships, also referred to as informal networks including family members, friends, neighbors, and coworkers, are known to influence the disaster warning dissemination and adaptation process [27]. Riad et al. found social influence to be an important psychological process that characterizes the decision to evacuate or not during a crisis [14]. Studies have modeled the effect of influence from real world social network peers on post-disaster mobility decisions using statistical models [15] and simulation approaches [16].
The wide spread of social media platforms such as Twitter and Facebook have added an entirely new channel for individuals to obtain information during natural hazards [17,28,29]. It is estimated that nearly 69% of the United States adult population owns at least one social media profile [30]. Activities on social media platforms are known to intensify during disaster events, where users post various thoughts, emotions, and information to their social networks [31]. Studies have shown that the vast amount of data posted on social media during events can be utilized for various applications including modeling travel behavior [32], estimating earthquake location and intensity in real time [33], detecting traffic incidents [34], identifying concerns of the public during a crisis [35], matching the needs and offers of various supplies [36], and performing rapid assessment of disaster damage levels [37]. With the increasing popularity of such platforms, various emergency response organizations have started to use social media accounts as channels to dissemination information to the public during natural hazards, including the forest fires in the Canary Islands, Spain [18,38]. Although many studies have performed analyses on understanding the types of information being disseminated during disasters [21,22], little is understood on how such information influences mobility outcomes of the affected individuals. A recent study showed that social media information can improve the predictability of mobility decisions; however, it did not unravel whose information posted when, affects those decisions and by how much [39]. In this study, we apply a data-driven method to model and unravel the influence of online social media information on the mobility decision making process of the evacuated people during disasters.
3. Materials and Methods
3.1. Data
3.1.1. Hurricane Sandy
Hurricane Sandy was one of the largest hurricanes in the history of the United States of America. Hurricane Sandy made landfall on 29 October at around 8 p.m. in New Jersey. The storm surge inflicted severe damage to infrastructure and buildings, causing 650,000 to be destroyed or damaged [40]. Over 8.5 million people were affected by power loss that lasted for weeks in some areas, even after the hurricane subsided on 31 October [40]. Hurricane Sandy caused 147 direct casualties and an economic loss of $50 billion [40]. Understanding whether we can model the influence of social media information on users during such catastrophic events is of importance for decision makers and various stakeholders.
3.1.2. Twitter Data
To test our models, we used Twitter data provided by Kryvasheveu et al. [31], which were collected by an analytics company, “Topsy Labs”, before, during, and after Hurricane Sandy. The dataset contains 52.55 million messages from 13.75 million unique users between 15th October and 12th November 2012, which contain keywords relevant to Hurricane Sandy [41]. Each tweet contains the user ID, time stamp, tweeted text, and longitude and latitude information when available. Around 2% of the tweets contained longitudinal and latitude information, which we used to infer evacuation and return mobility. The Twitter dataset also contains the network structure data of Twitter users, which allows us to understand the set of users followed by each user. For example, we are able to understand whether user A was “following” (in other words, receiving information from) the FEMA account (@FEMA) at the time of the crisis. By combining the Twitter network data and the aforementioned individual tweet data, we are able to reconstruct each user’s Twitter feed timeline, which is a time-ordered list of all the information each user received from their online connected peers during the crisis. Using this combined dataset, we model the influence of online information provided by various types of peers on the post-disaster mobility decisions of evacuated users.
3.1.3. Geographical Information Related to Hurricane Sandy
In addition to the Tweet data, we also utilize features generated from the geographical information of each user, since it is well known that the post-disaster mobility decisions (evacuation and return) are heavily affected by where they live (e.g., are they living in the flooded zone?) [5,6,8,9]. We utilize the Hurricane Sandy inundation zone map, shown in Figure 1, provided by the New York City Open Data website (https://data.cityofnewyork.us/Environment/Sandy-Inundation-Zone/uyj8-7rv5; accessed on 7 May 2021) to label whether each user was staying in the areas affected by flooding hazards.
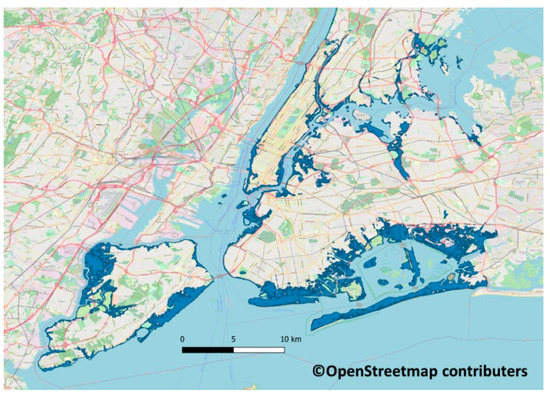
Figure 1.
Hurricane Sandy inundation zone map provided by the New York City Open Data website (https://data.cityofnewyork.us/Environment/Sandy-Inundation-Zone/uyj8-7rv5; accessed on 7 May 2021).
3.2. Overview of the Methodology
In this paper, we model the influence of online social media information on post-disaster mobility decisions using a data-driven, network approach. Figure 2 provides an illustration of the modeling framework. Online peers that the target user is connected to are categorized into different groups, which are government agency accounts, media outlet accounts, utility agency accounts, accounts of spatial neighbors and other online peers. The account names in each category shows some examples of such Twitter accounts, such as @FEMA (Federal Emergency Management Agency) and @FDNY (New York City Fire Department) as government agency accounts. Input features related to online information are generated from the tweets broadcasted from these online accounts using sentiment analysis. These input features are combined with input features related to the user’s evacuation behavior (e.g., when, how far?) and characteristics of his/her residential location before the hurricane (e.g., flooded or not, in hazard zone or not). Using these input features, we predict whether the user returned to his/her original residential area after evacuation. We infer the output label using geo-tagged tweets of the user, which is explained in more detail in the following sections. The data-driven framework explained in the following sections estimates the influence of the online information provided by each user category on post-disaster mobility decisions.
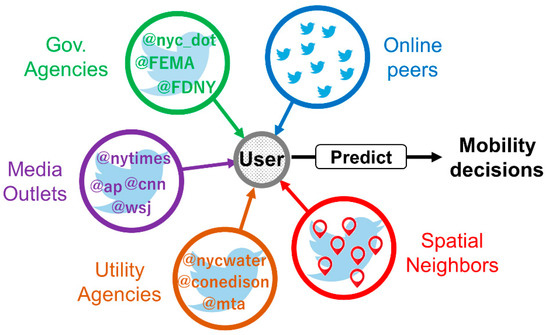
Figure 2.
Illustrative overview of the methodology. The proposed framework predicts the mobility decisions of evacuees, and quantifies the influence of online connected peers belonging to various categories on their mobility decisions.
3.3. Analysis of Tweets and User Profiles
Each tweet is fed into a machine learning algorithm named SentiStrength [42] and assigned a sentiment value. SentiStrength assigns a sentiment value to each tweet (a sequence of words) by computing scores to each word using a pre-defined dictionary. Sentiment values are usually within the range of −3 and +3, where positive values indicate positive sentiments and negative indicate negative sentiments. In this paper, we use sentiment values to represent the information obtained from tweets, since sentiment scores are known to be effective in predicting various social phenomena such as flu epidemics [43], stock prices [20], and political preferences [19]. The tweet sentiments are temporally aggregated into bins of 6 h within the observation period to overcome sparseness of the tweet data in some time periods. Thus, for each Twitter user account, all of its tweets are transformed into a time series of sentiment data. To generate the input data for each target user, the users are further aggregated into different categories of users (e.g., government agencies, media outlets, utility agencies), which are shown in Table 1. These users were chosen manually, thus this may not be an exhaustive list; however, it includes the key user accounts which were followed by the largest number of users in the New York City region at the time of the hurricane. As a result, as shown in Table 2, each user’s input feature consists of evacuation mobility characteristics, his/her own tweet sentiment time series, and also sentiment time series information from his/her online network.

Table 1.
Twitter Users in each Account Category.
Table 2.
Description of Input Features.
3.4. Ground Truth Labels for Post-Disaster Mobility Decisions
The ground truth labels of post-disaster mobility decisions were estimated using the geo-tagged Twitter data. For each user, their “usual” activity area was estimated by applying mean-shift clustering on the geo-tagged location points observed prior to the hurricane (before 28 October). Then the “during crisis” activity area was estimated using similar methods but with location points observed during the landfall of the hurricane (29 October–1 November). We label the users whose “usual” and “during crisis” activity areas were more than 10 km apart as “evacuated”, and if the user’s activity area returned to his/her “usual” activity area after the disaster (2–10 November), we label that user as “returned (y = 1)”, and otherwise “not returned (y = 0)”.
3.5. Classification Models
In our experiments, we test whether information collected from various social media accounts are predictors of the post-disaster mobility decisions of users, using standard machine learning techniques. We use standard machine learning techniques since the methodology itself is not the focus of this study; rather, the insights obtained from the results are what we would like to focus on. We test various classifiers including gradient boosting decision trees, graph convolutional networks, and logistic regression. A gradient boosting decision tree is a popular algorithm for classification tasks, applied to many applications and is shown to be effective for problems across a range of domains, especially in Kaggle contests [44]. The algorithm extends the idea of the random forest model by designing the loss function to put more attention on the misclassified samples so that the algorithm sequentially generates trees that correctly classify the misclassified datapoints. As default hyperparameters for the gradient boosting decision tree algorithm, 500 stumps (trees with depth of 2) were used.
There has been rapid progress in machine learning algorithms for graph-structured data in recent years, which are often referred to as the family of Graph Convolutional Networks (GCNs), that apply a similar idea as convolutional neural networks but on graphs [45,46]. Several studies have applied GCNs to the transportation domain [47,48]. In this paper, we test the graph attention network (GAT) model, which is the state-of-the-art graph convolutional network in the current literature [49]. GAT combines the GCN architecture with the attention mechanism, which has been shown to be effective in various sequence-based tasks such as natural language processing. Recent studies have shown the high performance of GATs on various tasks on social influence modeling and recommendation systems [50,51]. We test the performance of the GAT model with the default hyperparameters used in the original paper.
For comparison, we also test popular machine learning algorithms including Logistic Regression (C = (0.001, 0.001, 0.01, 0.1, 1, 10, 100)), Support Vector Machines (C = (0.1, 1, 10, 100, 1000)), and K-Nearest Neighbors (k = (2,3,4,5,10,20)), where the numbers in brackets are the tested hyperparameters of each algorithm. All algorithms were implemented on Python.
3.6. Evaluation Metrics
Since our problem is formulated as a binary classification problem and the labels are imbalanced (around 73% of labels are “1” (returned), and 27% are “0” (displaced)), we use area under curve (AUC) and F1-score as evaluation metrics, rather than precision and recall. All models were trained using 60% of the data (training data). The hyperparameters of each model were determined using 20% of the data (validation data), and then tested using the remaining 20% of the data (test data). All scores were averaged over 10 iterations with shuffled training, validation, and test datasets.
4. Results
4.1. Analysis of Twitter Data
First, we perform empirical analysis on the Twitter data to understand both the dynamics of tweet sentiments and mobility patterns. Figure 3 shows the mean sentiment values of tweets posted by users from different user categories over time. Note that these are averaged over all users, showing the macroscopic trends in sentiment values. We observe heterogeneous patterns across different user categories. The sentiments of spatial neighbors’ tweets (“Spatial”) shows significant negativity before and during landfall of Hurricane Sandy and an increase in positivity after 3 days from the dissipation of the Hurricane. This pattern reflects the pre-landfall fear and anxiety, the damage inflicted to the affected areas during landfall, and the relief afterwards in the affected areas. Similarly, utility company accounts (“Utility”) show negativity during landfall but turn to positive sentiments shortly after dissipation, indicating the recovery of infrastructure systems shortly after the hurricane. The tweets posted by media outlet accounts (“Media”) show negativity especially during the landfall of the hurricane, and stay negative for at least 2 weeks after the dissipation of the Hurricane in contrast to the tweets posted by the “Spatial” users who were within the New York City area. In contrast to all these patterns, the government accounts (“Government”) continue to stay positive before, during, and after the hurricane. Tweet sentiment values of accounts of all other users (“All Other Peers”) and influencers (“Influencer”) seem to stay stable at neutral sentiment level around 0. For each target user, sentiment time series of these different user categories are different depending on their social network structure. We attempt to predict the target users’ post-disaster mobility decisions (namely whether he/she will return to his/her original location after the hurricane) using these heterogeneous sentiment time series data, and to further identify which user category’s information affects their mobility decisions the most.
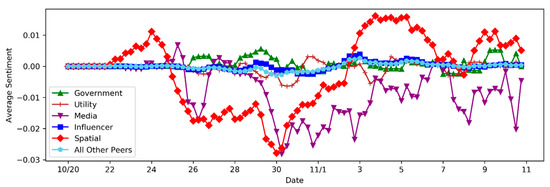
Figure 3.
Mean sentiment of tweets by users from all categories over time. User accounts of different categories have heterogeneous tweet sentiment patterns. These tweet sentiment time series data are used to predict post-disaster mobility decisions of the target users.
Figure 4 shows the estimated 6-hourly and cumulative evacuation and return rates due to Hurricane Sandy. We observe that most people (80% of users) evacuate from their home locations during the few days before landfall (on 28 and 29 October), where the rest of the users evacuate during and after landfall. This result agrees with analysis performed using household surveys performed in past studies [52]. Thus, we clarify that analysis using Twitter geo-tags are reliable in the macroscopic scale, even though Twitter geo-tag data is sparse in the number of observations. On the other hand, the timings of returning movement have a large variance across users. Even after 12 days after the dissipation of the hurricane, around 27% of the evacuated users did not return to their original locations. In this paper, we label these users as “not returned (y = 0)”, and label the users who returned as “returned (y = 1)”. Due to this analysis, we find that the labels are slightly imbalanced. Thus, we use Area Under Curve (AUC) as the evaluation metric as well as the F1-score for evaluating the prediction performance in the following experiments.
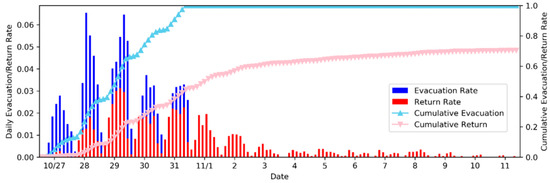
Figure 4.
Evacuation and return mobility rates due to Hurricane Sandy (6-h bins and cumulative). Over 80% of the users evacuate before landfall and return timings have a large variance over time. Even after 12 days, 27% of users do not return to their original locations.
4.2. Predictive Accuracy of Post-Disaster Mobility
Now, we test the predictive performances of the classification models using the aforementioned input features (listed in Table 2). Table 3 shows the predictive accuracy of post-disaster mobility decision labels using the different models. The presented scores are the prediction accuracy scores over the test data, using the best hyperparameters determined using AUC score over the validation data. The standard deviation of the scores over the 10 iterations with randomized training, validation, and test data are shown in brackets after the scores. We observe that out of all tested models, Gradient Boosting Tree performs best compared to the other models both in terms of F1-score and AUC with a significant margin.
Table 3.
Predictive Accuracy of Models.
Furthermore, Table 4 shows the predictive performances using different sets of input features. The model structure and hyperparameters are kept the same in all cases (Gradient Boosting Tree with 100 trees and maximum depth 2). Comparing the F1-score and AUC between the three sets of input features, we show that the information from online networks improves both the F1-score and AUC significantly, compared to only using mobility related features or using mobility related features and sentiment time series data of his/her own tweets. This shows that information posted on online social media by the different user categories does indeed affect the mobility decisions of users after disasters.
Table 4.
Importance of Information from Online Network.
Figure 5 shows the grid search results on the hyperparameters (number of trees and maximum depth) of the Gradient Boosting Tree model. Using the validation dataset, it was determined that using 100 trees with depth 2 (stumps) gives the highest AUC score. Although the F1-score is higher using 10 trees with depth 3, we prioritize AUC score over F1-score since the objective labels are slightly imbalanced (73% are labeled “1”). The Gradient Boosting Tree model allows us to quantify the importance of each input feature. The importance of each input feature is calculated as the total decrease in Gini impurity that the feature contributes to in the model. Figure 6 shows the relative feature importance of the different user categories over time (moving average with a time window of 5 data points is shown here for visual clarity). Out of all user categories, we observe that tweet sentiment time series data of “All other peers”, “Influencer”, and “Spatial” category users had the largest influence in the post-disaster mobility decisions of the target users. On the other hand, media accounts, government agency accounts, and utility company accounts had less influence on the mobility decisions. The high influence of “Spatial” sentiments, which are sentiment values of tweets tweeted by physically close users (thus within the Hurricane affected regions) is intuitive since the sentiments tweeted within the disaster region may reflect the recovery status of the region. However, the high influence of the information of tweets posted by the crowd (“all other users”) users who are not official government accounts, media accounts, or utility companies was unexpected. This result encourages us to focus more on the opinion influence dynamics that occur between individual users, in contrary to the current literature that focuses on how official agencies utilize social media as a platform for information dissemination.
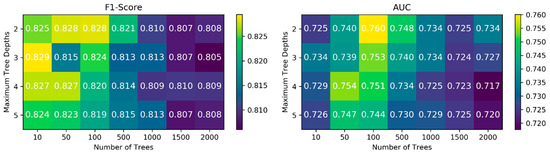
Figure 5.
Sensitivity of prediction performance to hyperparameters of Gradient Boosting Tree. Grid search on the two hyperparameters (number of trees and maximum tree depths) using the validation data show that using 100 trees with depth 2 (stumps) is most effective.
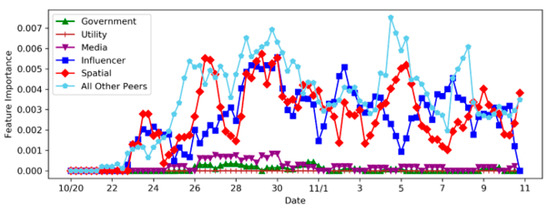
Figure 6.
Influence on mobility decisions by user category and tweet timing.
5. Discussion
In this study, we utilized large scale social media data collected from Twitter users to model the influence of information on online social media on post-disaster mobility decisions of the users affected by Hurricane Sandy. Using data-driven approaches, we showed that by using online information, we are able to better predict real world behaviors of people after disasters. Moreover, we unraveled whose information provided when, affects the users’ decisions and by how much. To the best of our knowledge, this is the first work to model and quantify the influence of online social media information on post-disaster mobility decisions using real world data. In contrast to existing literature that focuses on the information disseminated by “official” accounts such as government agencies, utility agencies, and media outlets, our model revealed that information posted by users in the “crowd” and unofficial influencers were more important in influencing the users’ mobility decisions. From a policy maker’s point of view, this result implies the limited capacity of using official accounts for broadcasting information to control opinion dynamics and decision making of individual users. This motivates us to investigate more the complex influence dynamics among the individual users on social media and provide solutions on how to better model, predict, and in some cases, “nudge” the decisions of users for better outcomes.
Now we touch upon the future research opportunities that this study enables. First, we used sentiment analysis as our tool to quantify each tweet in this study. However, using sentiment data drops the details of the text in the tweet. Applying word or sentence embedding methods such as word2vec [53] to better encode the meanings of the tweets may improve the predictive ability of the model, and allow us to understand the types of information that affect the users’ decisions. Second, we were only able to use data from one disaster event to validate the proposed methods. We are currently collecting Twitter data from other recent disasters including Hurricanes Harvey and Irma to investigate whether the findings from Hurricane Sandy are generalizable to other disaster events. Third, in this study, we focused on predicting whether or not users will return to their original home locations or become displaced. Investigating the predictive performance on different objective variables, such as predicting when each user would come back, could be more challenging as a problem but would be more informative to decision makers. Extending the framework presented in this paper to different problem settings to understand the influence of online social media on various real-world behavioral patterns would be of interest for future studies.
6. Conclusions
Predicting post-disaster displacement and return mobility is important for policy making in various domains related to emergency management. In this study, we proposed a data-driven modeling framework that predicts the post-disaster behavior of affected individuals using information on online social media. Experiments using real world Twitter data collected from Hurricane Sandy showed that we are able to improve the predictive accuracy of mobility decisions by using online social media data. Furthermore, we unraveled the characteristics of tweets (tweeted by who and when) that have large influence on the users’ mobility decisions. It was revealed that information from tweets posted by non-agency user accounts had substantial effects on the decision making of the affected users. The significant influence that non-agency user accounts have on the mobility decisions motivate us to further investigate the opinion formation and influence dynamics among individual users on online social media networks.
Author Contributions
The authors confirm contribution to the paper as follows: study conception and design: T.Y., S.V.U., P.S.C.R.; data collection: T.Y.; analysis and interpretation of results: T.Y., S.V.U.; draft manuscript preparation: T.Y., S.V.U., P.S.C.R. All authors reviewed the results and approved the final version of the manuscript.
Funding
This work was funded by Ford Motor Company through the Purdue-Ford Alliance Program. The work of T.Y. and S.V.U. is partly funded by NSF CMMI Grant No. 1638311 CRISP Type 2/Collaborative Research: Critical Transitions in the Resilience and Recovery of Interdependent Social and Physical Networks.
Institutional Review Board Statement
Not applicable.
Informed Consent Statement
Not applicable.
Data Availability Statement
The authors abide by the publication ethics.
Acknowledgments
We thank John Vincent and James Fishelson of Ford Motor Company for their continuous support on this project.
Conflicts of Interest
The authors declare that they have no competing financial interest.
References
- Guo, J.; Liu, H.; Wu, X.; Gu, J.; Song, S.; Tang, Y. Natural Disasters, Economic Growth and Sustainable Development in China—An Empirical Study Using Provincial Panel Data. Sustainability 2015, 7, 16783–16800. [Google Scholar] [CrossRef]
- Bendimerad, F. Disaster risk reduction and sustainable development. In Proceedings of the World Bank Seminar on the Role of Local Governments in Reducing the Risk of Disasters, Istanbul, Turkey, 28 April 2003; Volume 28, pp. 57–75. [Google Scholar]
- McBean, G.A. Integrating disaster risk reduction towards sustainable development. Curr. Opin. Environ. Sustain. 2012, 4, 122–127. [Google Scholar] [CrossRef]
- UNISDR. Hyogo framework for action 2005–2015: Building the resilience of nations and communities to disasters. In Extract from the Final Report of the World Conference on Disaster Reduction (A/CONF. 206/6); The United Nations International Strategy for Disaster Reduction: Geneva, Switzerland, 2005; Volume 380. [Google Scholar]
- Baker, E.J. Hurricane evacuation behavior. Int. J. Mass Emergencies Disasters 1991, 9, 287–310. [Google Scholar]
- Fischer, H.W.; Stine, G.F.; Stoker, B.L.; Trowbridge, M.L.; Drain, E.M. Evacuation behavior: Why do some evacuate, while others do not? A case study of the Ephrata, Pennsylvania (USA) evacuation. Disaster Prev. Manag. Int. J. 1995, 4, 30–36. [Google Scholar] [CrossRef]
- Murray-Tuite, P.; Wolshon, B. Evacuation transportation modeling: An overview of research, development, and practice. Transp. Res. C Emerg. Technol. 2013, 27, 25–45. [Google Scholar] [CrossRef]
- Lindell, M.K.; Lu, J.C.; Prater, C.S. Household decision making and evacuation in response to Hurricane Lili. Nat. Hazards Rev. 2005, 6, 171–179. [Google Scholar] [CrossRef]
- Whitehead, J.C.; Edwards, B.; Van Willigen, M.; Maiolo, J.R.; Wilson, K.; Smith, K.T. Heading for higher ground: Factors affecting real and hypothetical hurricane evacuation behavior. Glob. Environ. Chang. B: Environ. Hazards 2000, 2, 133–142. [Google Scholar] [CrossRef]
- Dash, N.; Gladwin, H. Evacuation Decision Making and Behavioral Responses: Individual and Household. Nat. Hazards Rev. 2007, 8, 69–77. [Google Scholar] [CrossRef]
- Forrest, T.R.; Peacock, W.G.; Morrow, B.H.; Gladwin, H. Hurricane Andrew: Ethnicity, Gender and the Sociology of Disasters. Contemp. Sociol. A J. Rev. 1999, 28, 328. [Google Scholar] [CrossRef]
- Lovreglio, R.; Ronchi, E.; Nilsson, D. An Evacuation Decision Model based on perceived risk, social influence and behavioural uncertainty. Simul. Model. Pr. Theory 2016, 66, 226–242. [Google Scholar] [CrossRef]
- Gladwin, H.; Lazo, J.K.; Morrow, B.H.; Peacock, W.G.; Willoughby, H.E. Social Science Research Needs for the Hurricane Forecast and Warning System. Nat. Hazards Rev. 2007, 8, 87–95. [Google Scholar] [CrossRef][Green Version]
- Riad, J.K.; Norris, F.H.; Ruback, R.B. Predicting Evacuation in Two Major Disasters: Risk Perception, Social Influence, and Access to Resources1. J. Appl. Soc. Psychol. 1999, 29, 918–934. [Google Scholar] [CrossRef]
- Sadri, A.M.; Ukkusuri, S.V.; Gladwin, H. The Role of Social Networks and Information Sources on Hurricane Evacuation Decision Making. Nat. Hazards Rev. 2017, 18, 04017005. [Google Scholar] [CrossRef]
- Hasan, S.; Ukkusuri, S.V. A threshold model of social contagion process for evacuation decision making. Transp. Res. Part B Methodol. 2011, 45, 1590–1605. [Google Scholar] [CrossRef]
- Simon, T.; Goldberg, A.; Adini, B. Socializing in emergencies—A review of the use of social media in emergency situations. Int. J. Inf. Manag. 2015, 35, 609–619. [Google Scholar] [CrossRef]
- Martinez-Rojas, M.; del Carmen Pardo-Ferreira, M.; Rubio-Romero, J.C. Twitter as a tool for the management and analysis of emergency situations: A systematic literature review. Int. J. Inf. Manag. 2018, 43, 196–208. [Google Scholar] [CrossRef]
- Ceron, A.; Curini, L.; Iacus, S.M.; Porro, G. Every tweet counts? How sentiment analysis of social media can improve our knowledge of citizens’ political preferences with an application to Italy and France. New Media Soc. 2013, 16, 340–358. [Google Scholar] [CrossRef]
- Nguyen, T.H.; Shirai, K.; Velcin, J. Sentiment analysis on social media for stock movement prediction. Expert Syst. Appl. 2015, 42, 9603–9611. [Google Scholar] [CrossRef]
- Imran, M.; Elbassuoni, S.; Castillo, C.; Diaz, F.; Meier, P. Extracting information nuggets from disaster-related messages in social media. In Proceedings of the 15th International Conference on Information Systems for Crisis Response and Management (ISCRAM), Baden-Baden, Germany, 12–15 May 2013. [Google Scholar]
- Landwehr, P.M.; Carley, K.M. Social media in disaster relief. In Data Mining and Knowledge Discovery for Big Data; Springer: Berlin/Heidelberg, Germany, 2014; pp. 225–257. [Google Scholar]
- Fu, H.; Wilmot, C.G. Sequential Logit Dynamic Travel Demand Model for Hurricane Evacuation. Transp. Res. Rec. J. Transp. Res. Board 2004, 1882, 19–26. [Google Scholar] [CrossRef]
- Hasan, S.; Ukkusuri, S.; Gladwin, H.; Murray-Tuite, P. Behavioral model to understand household-level hurricane evacuation decision making. J. Transp. Eng. 2010, 137, 341–348. [Google Scholar] [CrossRef]
- Hasan, S.; Mesa-Arango, R.; Ukkusuri, S. A random-parameter hazard-based model to understand household evacuation timing behavior. Transp. Res. Part C Emerg. Technol. 2013, 27, 108–116. [Google Scholar] [CrossRef]
- Huang, S.-K.; Lindell, M.K.; Prater, C.S.; Wu, H.-C.; Siebeneck, L.K. Household Evacuation Decision Making in Response to Hurricane Ike. Nat. Hazards Rev. 2012, 13, 283–296. [Google Scholar] [CrossRef]
- Kaufman, H.F.; Clifford, R.A.; Killian, L.M.; Fritz, C.E.; Mathewson, J.H. The Rio Grande Flood: A Comparative Study of Border Communities in Disaster. Am. Sociol. Rev. 1958, 23, 102. [Google Scholar] [CrossRef]
- Yu, M.; Yang, C.; Li, Y. Big Data in Natural Disaster Management: A Review. Geosciences 2018, 8, 165. [Google Scholar] [CrossRef]
- Phengsuwan, J.; Shah, T.; Thekkummal, N.; Wen, Z.; Sun, R.; Pullarkatt, D.; Thirugnanam, H.; Ramesh, M.; Morgan, G.; James, P.; et al. Use of Social Media Data in Disaster Management: A Survey. Futur. Internet 2021, 13, 46. [Google Scholar] [CrossRef]
- Social Media Fact Sheet. Pew Research Center: Washington, DC, USA. Available online: http://www.pewinternet.org/fact-sheet/social-media/ (accessed on 1 December 2017).
- Kryvasheyeu, Y.; Chen, H.; Moro, E.; Van Hentenryck, P.; Cebrian, M. Performance of Social Network Sensors during Hurricane Sandy. PLoS ONE 2015, 10, e0117288. [Google Scholar] [CrossRef] [PubMed]
- Rashidi, T.H.; Abbasi, A.; Maghrebi, M.; Hasan, S.; Waller, T.S. Exploring the capacity of social media data for modelling travel behavior: Opportunities and challenges. Transp. Res. C Emerg. Technol. 2017, 75, 197–211. [Google Scholar] [CrossRef]
- Sakaki, T.; Okazaki, M.; Matsuo, Y. Earthquake shakes Twitter users. In Real-Time Event Detection by Social Sensors, Proceedings of the 19th International Conference on World Wide Web, ACM, Raleigh, NC, USA, 26–30 April 2010; Association for Computing Machinery: New York, NY, USA, 2010; pp. 851–860. [Google Scholar]
- Gu, Y.; Qian, Z.; Chen, F. From Twitter to detector: Real-time traffic incident detection using social media data. Transp. Res. Part C Emerg. Technol. 2016, 67, 321–342. [Google Scholar] [CrossRef]
- Sadri, A.M.; Hasan, S.; Ukkusuri, S.V.; Cebrian, M. Crisis Communication Patterns in Social Media during Hurricane Sandy. Transp. Res. Rec. J. Transp. Res. Board 2018, 2672, 125–137. [Google Scholar] [CrossRef]
- Kumar, D.; Yabe, T.; Ukkusuri, S.V. Social-Media aided Hyperlocal Help-Network Matching & Routing during Emergencies. In Proceedings of the 2018 IEEE International Conference on Big Data, Seattle, WA, USA, 10–13 December 2018; IEEE: New York, NY, USA, 2019; pp. 1606–1611. [Google Scholar]
- Kryvasheyeu, Y.; Chen, H.; Obradovich, N.; Moro, E.; Van Hentenryck, P.; Fowler, J.; Cebrian, M. Rapid assessment of disaster damage using social media activity. Sci. Adv. 2016, 2, e1500779. [Google Scholar] [CrossRef]
- Zamarreño-Aramendia, G.; Cristòfol, F.J.; De-San-Eugenio-Vela, J.; Ginesta, X. Social-Media Analysis for Disaster Prevention: Forest Fire in Artenara and Valleseco, Canary Islands. J. Open Innov. Technol. Mark. Complex. 2020, 6, 169. [Google Scholar] [CrossRef]
- Yabe, T.; Ukkusuri, S.V. Integrating information from heterogeneous networks on social media to predict post-disaster returning behavior. J. Comput. Sci. 2019, 32, 12–20. [Google Scholar] [CrossRef]
- Blake, E.S.; Kimberlain, T.B.; Berg, R.J.; Cangialosi, J.P.; Beven Ii, J.L. Tropical cyclone report: Hurricane sandy. Natl. Hurric. Cent. 2013, 12, 1–10. [Google Scholar]
- Kryvasheyeu, Y.; Chen, H.; Moro, E.; Van Hentenryck, P.; Cebrian, M. Data from: Performance of social network sensors during Hurricane Sandy. Dryad Digit. Repos. 2015, 31. [Google Scholar] [CrossRef]
- Thelwall, M.; Buckley, K.; Paltoglou, G.; Cai, D.; Kappas, A. Sentiment strength detection in short informal text. J. Am. Soc. Inf. Sci. Technol. 2010, 61, 2544–2558. [Google Scholar] [CrossRef]
- Signorini, A.; Segre, A.M.; Polgreen, P.M. The Use of Twitter to Track Levels of Disease Activity and Public Concern in the U.S. during the Influenza A H1N1 Pandemic. PLoS ONE 2011, 6, e19467. [Google Scholar] [CrossRef]
- Friedman, J.H. Stochastic gradient boosting. Comput. Stat. Data Anal. 2002, 38, 367–378. [Google Scholar] [CrossRef]
- Kipf, T.N.; Welling, M. Semi-Supervised Classification with Graph Convolutional Networks. In Proceedings of the 2017 International Conference on Learning Representations (ICLR), Toulon, France, 24–26 April 2017. [Google Scholar]
- Defferrard, M.; Bresson, X.; Vandergheynst, P. Convolutional neural networks on graphs with fast localized spectral filtering. In Proceedings of the Neural Information Processing Systems 2016, Barcelona, Spain, 5–10 December 2016; pp. 3844–3852. [Google Scholar]
- Han, Y.; Wang, S.; Ren, Y.; Wang, C.; Gao, P.; Chen, G. Predicting Station-Level Short-Term Passenger Flow in a Citywide Metro Network Using Spatiotemporal Graph Convolutional Neural Networks. ISPRS Int. J. Geo-Inf. 2019, 8, 243. [Google Scholar] [CrossRef]
- Lin, L.; He, Z.; Peeta, S. Predicting station-level hourly demand in a large-scale bike-sharing network: A graph convolutional neural network approach. Transp. Res. Part C Emerg. Technol. 2018, 97, 258–276. [Google Scholar] [CrossRef]
- Veličković, P.; Cucurull, G.; Casanova, A.; Romero, A.; Lio, P.; Bengio, Y. Graph attention networks. arXiv preprint arXiv:1710.10903, 2017. In Proceedings of the ICLR 2018, Vancouver, BC, Canada, 30 April–3 May 2018. [Google Scholar]
- Song, W.; Xiao, Z.; Wang, Y.; Charlin, L.; Zhang, M.; Tang, J. Session-based Social Recommendation via Dynamic Graph Attention Networks. In Proceedings of the Twelfth ACM International Conference on Web Search and Data Mining, ACM, Melbourne, Australia, 11–15 February 2019; pp. 555–563. [Google Scholar]
- Qiu, J.; Tang, J.; Ma, H.; Dong, Y.; Wang, K.; Tang, J. Deepinf: Social influence prediction with deep learning. In Proceedings of the 24th ACM SIGKDD International Conference on Knowledge Discovery & Data Mining, ACM, London, UK, 19–23 August 2018; pp. 2110–2119. [Google Scholar]
- Sadri, A.M.; Ukkusuri, S.V.; Murray-Tuite, P. A random parameter ordered probit model to understand the mobilization time during hurricane evacuation. Transp. Res. Part C Emerg. Technol. 2013, 32, 21–30. [Google Scholar] [CrossRef]
- Mikolov, T.; Sutskever, I.; Chen, K.; Corrado, G.S.; Dean, J. Distributed representations of words and phrases and their compositionality. In Proceedings of the Neural Information Processing Systems, NIPS 2013, Lake Tahoe, CA, USA, 5–10 December 2013; pp. 3111–3119. [Google Scholar]


Publisher’s Note: MDPI stays neutral with regard to jurisdictional claims in published maps and institutional affiliations. |
© 2021 by the authors. Licensee MDPI, Basel, Switzerland. This article is an open access article distributed under the terms and conditions of the Creative Commons Attribution (CC BY) license (https://creativecommons.org/licenses/by/4.0/).