Article

Analysis of River Water and Air Pollution—Pljevlja as a “Hot Spot” of Montenegro

1
Department of Geografphy, Faculty of Philosophy, University of Montenegro, 81400 Nikšić, Montenegro
2
Department of History, Faculty of Philosophy, University of Montenegro, 81400 Nikšić, Montenegro
*
Author to whom correspondence should be addressed.
Sustainability 2021, 13(9), 5229; https://doi.org/10.3390/su13095229
Submission received: 15 March 2021 / Revised: 30 April 2021 / Accepted: 1 May 2021 / Published: 7 May 2021

Abstract

:
The aim of the study was to gather information necessary for the examination of the river Ćehotina water quality as well as the air pollution in the urban area of Pljevlja (far north of Montenegro), from 2011 until 2018. The water quality of the Ćehotina River was observed by the Water Quality Index (WQI) method, based on ten physicochemical and microbiological parameters from five hydrological stations. In order to examine the air quality, we used data on the concentration of the PM10 particles from the station located in the center of Pljevlja. The obtained results of river water quality indicate that the situation was disturbing (bad quality dominates). The results of the air quality analysis indicate that the situation has been alarming and Pljevlja itself as a “hot spot” of Montenegro. Annual, seasonal and daily mean concentrations of PM10 particles were above the prescribed limit values, except during summer. Sources of pollution were mostly known, and in order to protect public health, it is necessary to take appropriate measures as soon as possible, primarily the introduction of modern exhaust gas treatment technology TPP ‘‘Pljevlja’’ and construction of a heating plant that would replace numerous individual (home) fireplaces in Pljevlja.

1. Introduction

Rapid population growth (e.g., in Asia, Africa and Latin America), accelerated economic development (e.g., Brazil, China, Russia, India, Turkey, Indonesia, Mexico, etc.) and socio-economic changes are the main drivers of increasing water demand, but also factors that pose a primary threat to water safety. Water-related problems, especially surface water quality, are ranked second as a serious threat to human society—energy issues are high [1]. Right now or in the near future, the water demand is higher than the supply in many countries [2]. Most studies dealing with this issue provide an analysis of river water quality, as one of the most important indicators for assessing the sustainability of a particular basin [3,4]. In addition to urban and industrial sources, surface and groundwater pollution also occurs due to various agricultural activities [5].
Various techniques were used to monitor and assess the quality of surface and groundwater, and the Water Quality Index (WQI) method was widely used [6,7]. There are different variants of this index, but most WQI methods treat all three groups of indicators—physical, chemical and biological parameters of water quality [8,9,10,11]. CWQI (Canadian Water Quality Index) or CCME WQI (Canadian Council of Ministers of the Environment Water Quality Index), OWQI (Oregon Water Quality Index), NSFWQI (US National Sanitation Foundation Water Quality Index) and others are often used [12,13,14,15]. The water quality of the Motru River in Romania was observed using WQI, while the ecological status of natural waters in the Alps region was determined by analyzing phytoplankton as indicator—Brettum Index (BI) in Austria and Slovenia, Phytoplankton Saprobic Index (PSI) in Germany and Phytoplankton Trophic Index (PTI). In Italy [16] WQI methods are very useful in the management of water resources and surface water catchments [17], so they are also used in the region to which Montenegro belongs (Southeast Europe and the Balkans). Danube water quality assessment in Serbia [18,19,20,21], as well as its tributaries—the rivers Timok [22] and Tisa [23] was mostly done using the Serbian Water Quality Index (SWQI).
The WQI method was almost not considered in the assessment of surface and groundwater quality in Montenegro, but other techniques were also used. Though, research showed that most surface waters in Montenegro were of good quality [24]. For example, Djurašković [25] pointed out that from 2005 to 2009, the water quality of Skadar Lake belonged to class “A”, mostly. Vukašinović-Pešić et al. [26] found an increase in surface water quality in Montenegro since 2012 but pointed out that there are significant differences in the values of the considered chemical parameters between the rivers in the north (Black Sea basin) and in the south (Adriatic basin). Analysis of data from 2009 to 2018 indicates that the overall microbiological water quality in Montenegrin rivers is quite good [27].
Air pollution is now considered to be the world’s largest environmental problem, especially in urban areas and industrial regions. Back in 1958, the World Health Organization (WHO) recognized that air pollution is a significant risk factor for human health [28]. Among the pollutants that have a very harmful effect on human health, which can be both short-term and long-term [29,30], atmospheric aerosol particles or particulate matter (PM) are noticeable. They are classified as air pollutants that are directly emitted (primary particles) or formed in the atmosphere from precursor gases through reactions (secondary particles).
According to WHO data [31], 4.2 million premature deaths were registered worldwide in 2016 due to exposure to increased concentrations of PM2.5 particles. The urban population is particularly endangered by PM particles, because there are numerous sources in cities (traffic, industry, heating plants, individual furnaces, etc.) that increase the concentration of these particles in the air [32,33]. In neighboring Serbia from 2011 to 2016, there was a growing trend in the number of inhabitants exposed to higher concentrations of PM2.5 particles, because of urbanization [34]. The particles were of natural (aquatic and biological vaporizer, volcanic ash, dust, etc.) or anthropogenic origin (combustion of fossil fuels, of domestic heating, engine production) [35,36,37]. The suspended PM10 tanks were a mixture of smoke, fumes, exhaust gases, dust, acids, metals, etc. These particles have a very negative impact on the human body, because they are inhaled and deposited in the respiratory system, and some are carcinogenic or lethal, especially as a consequence of long-term exposure [38,39,40,41].
The subject of research (the Pljevlja municipality and the surroundings of the rural settlement), was industrially, morphologically and climatically unique compared to the rest of Montenegro. In the morphological sense, the city is located at the bottom of the valley where the river Ćehotina flows. The valley is surrounded by the sides of high mountains and due to this closure in the colder part of the year, temperature inversions are frequent, i.e., the formation of the so-called “cold air lakes”. Furthermore, Pljevlja is the city with the highest frequency of wind silence and the lowest amount of precipitation in Montenegro. In Pljevlja, at the end of 1982, the thermal power plant (TPP) “Pljevlja” started operating. The plant still works today and is the only one in Montenegro. TPP “Pljevlja” is supplied with coal (lignite) from nearby mines and uses water from the Ćehotina river system to cool turbines and other needs. It returns the used water back to the system of the river. In 2018, TPP “Pljevlja” produced 1443.8 GWh of energy [42]. It is important to highlight that a numerous individual households use coal for house heating.
Taking into consideration the mentioned characteristics (terrain configuration, climatic characteristics and large coal combustion for the needs of TPPs and for heating houses—individual fireboxes) Pljevlja is often under fog of smog and smoke in the colder part of the year. Therefore, this paper aimed to obtain a more complete picture of the envirnomental situation in the area of Pljevlja, through the assessment of river water and air quality. It is certain that the results obtained in this paper will have practical significance and that they can help decision makers, above all to understand the seriousness of the situation and need for fast response. It would be desirable for this research to encourage experts from other fields to consider the problem of pollution in the area of Pljevlja, primarily medical scientists who would indicate the degree of danger of the current situation to human health. In general, through a multidisciplinary approach, it is necessary to start solving the problem of water and air pollution in Pljevlja as soon as possible, in order to protect the health of the population.

2. Research Area, Materials and Methods
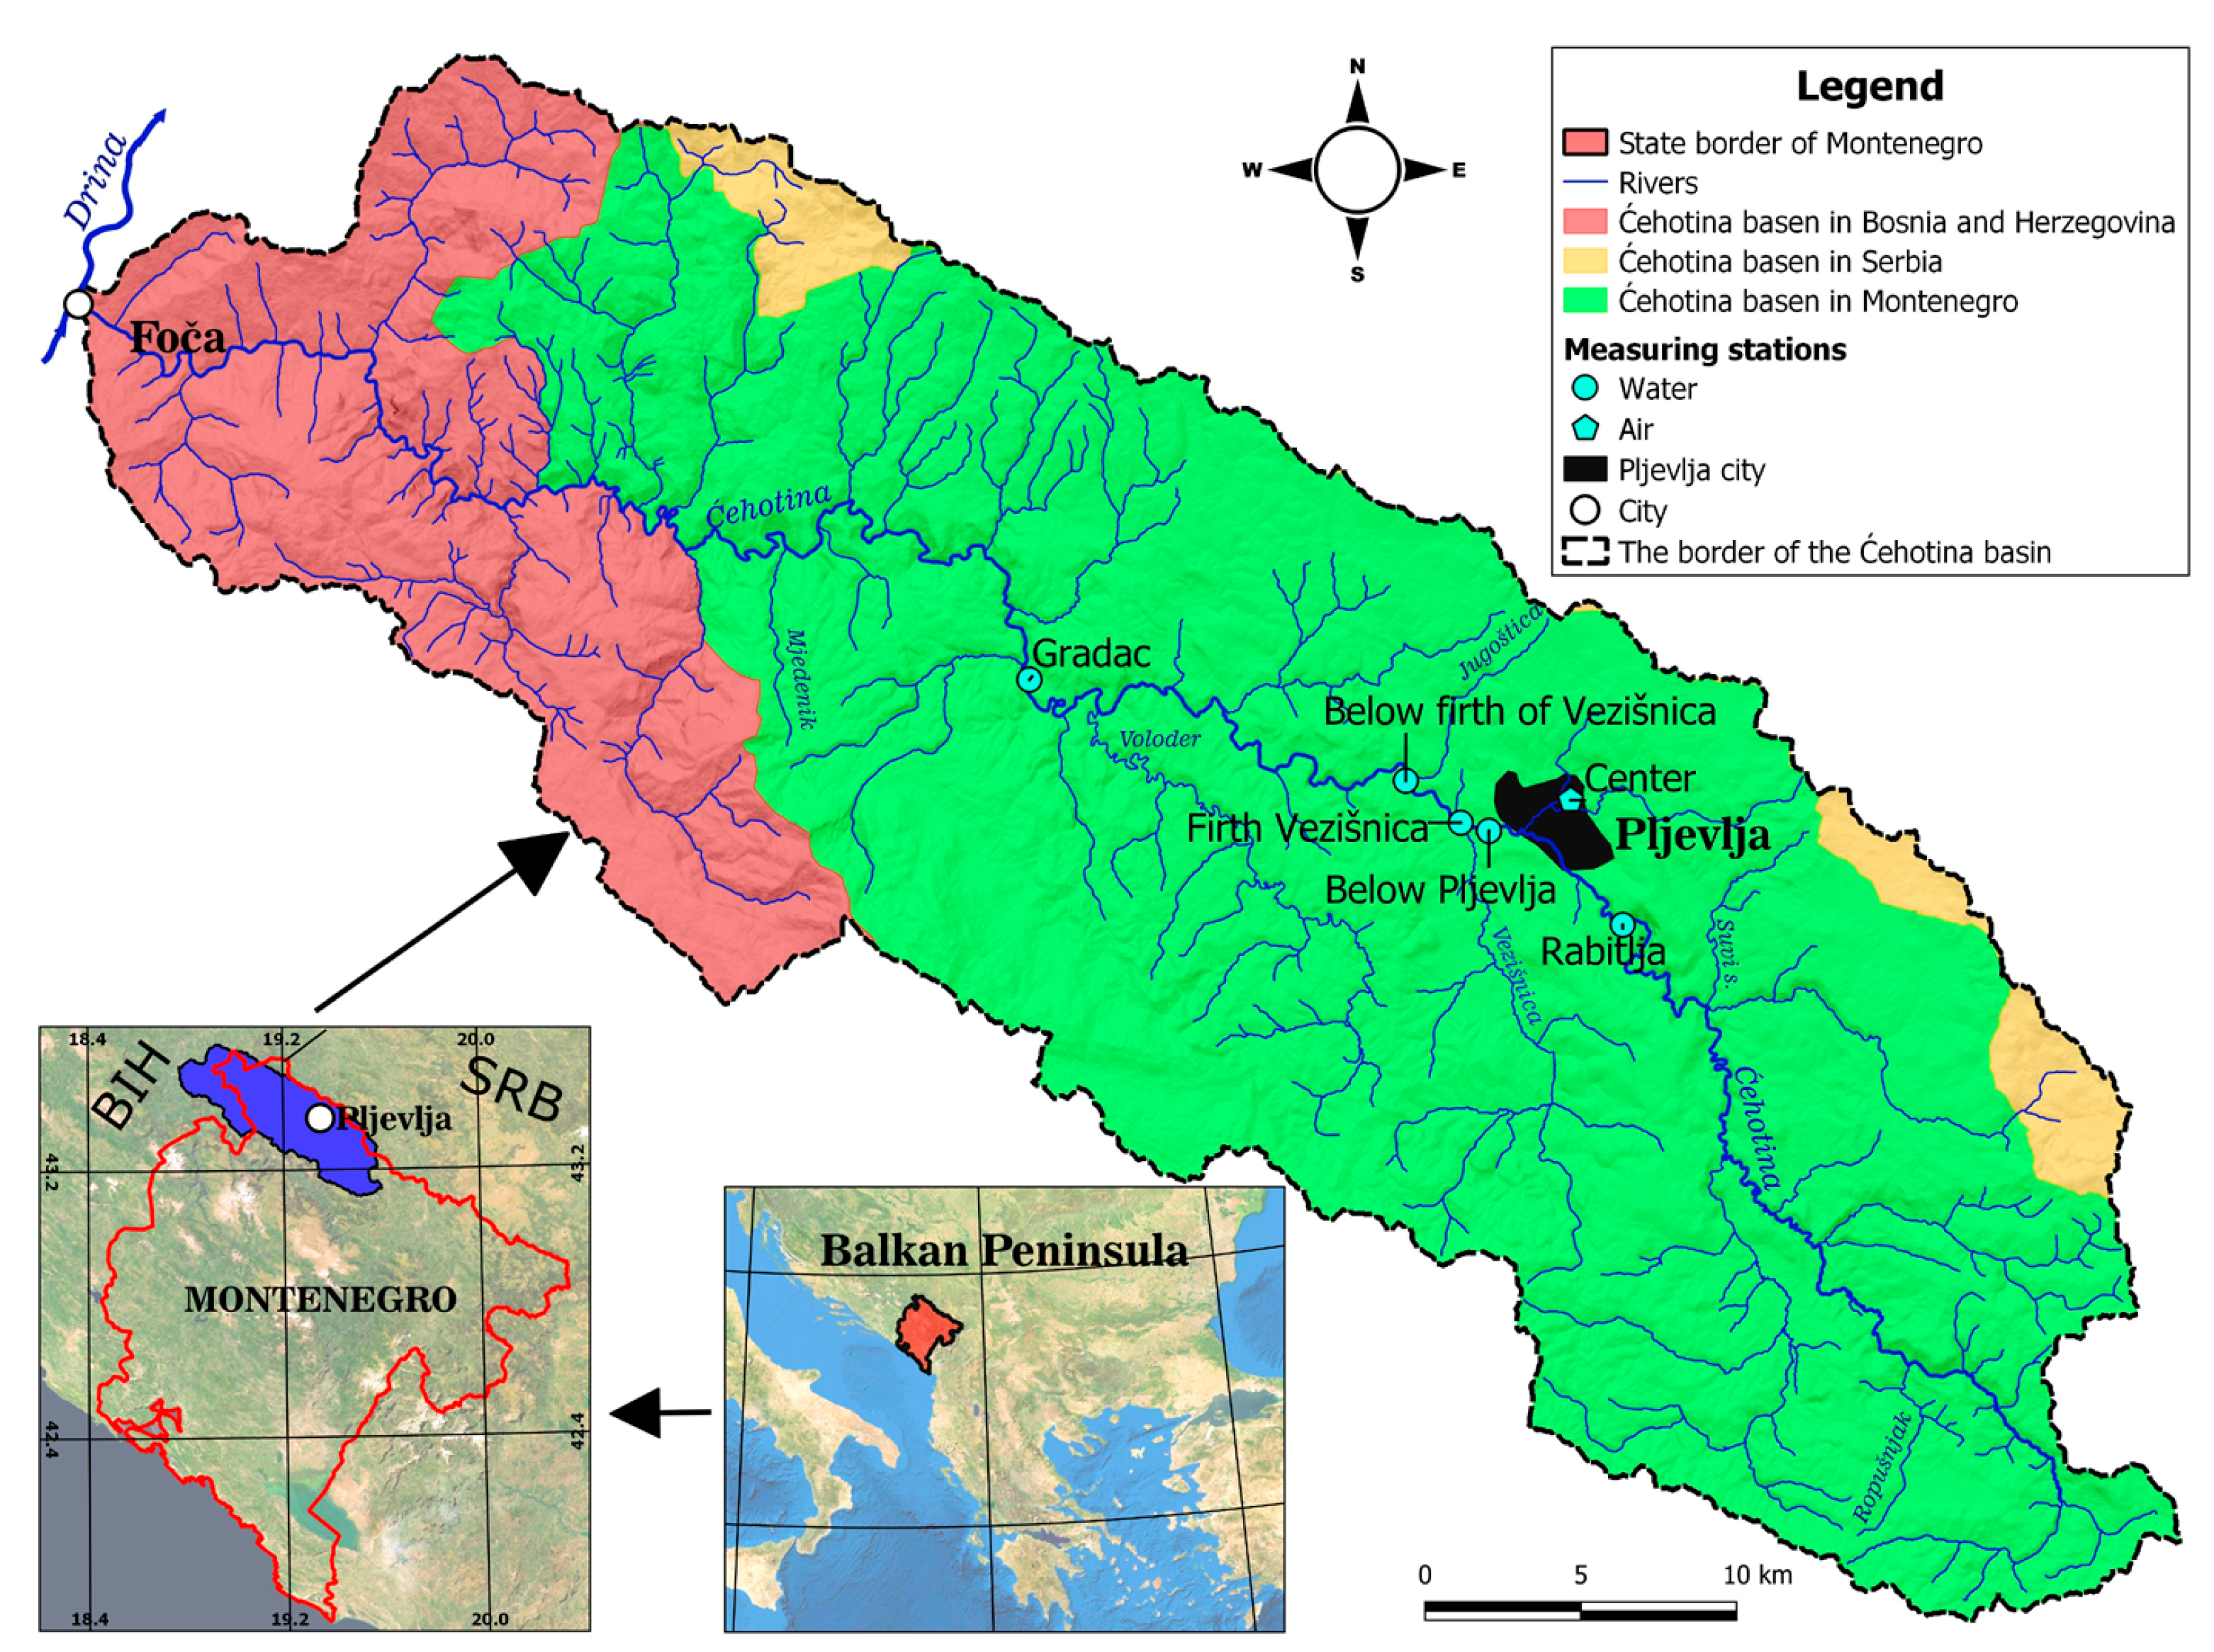
2.1. Research Area

The study included an assessment of river water and air quality in Pljevlja, the largest city in the far north of Montenegro. According to the last census from 2011 [43], the municipality of Pljevlja (a city with surrounding rural settlements) had 31,060 inhabitants, or 5% of the total population in Montenegro (625,266 inhabitants).
The basin of the river Ćehotina, which flows through Pljevlja, is located on the border of Montenegro, Serbia and Bosnia and Herzegovina (Figure 1). The area of the Ćehotina river basin is 1296 km2 and mostly belongs to Montenegro. Ćehotina is a right tributary of the river Drina, and the Drina is a tributary of the Sava (the river Sava is a tributary of the Danube), which means that the river Ćehotina belongs to the Black Sea basin. The river Ćehotina starts from a spring called Glava Ćehotina (945 m above sea level), located on the northern slope of the mountain Stožer [44].
According to the data of the State Institute of Hydrometeorology and Seismology of Montenegro (IHMSM) [45], the length of the river Ćehotina is 128.5 km and on its course it receives a large number of streams and rivers. On the profile of the hydrological station (HS) Gradac, which is located in the central part of the flow, the average annual flow of Ćehotina is 13.4 m3/s, while the extreme values range from 2.1 m3/s (min) to 414 m3/s (max).
According to the data of the main meteorological station in Pljevlja, which is located at 788 m above sea level, the average annual rainfall is 802 mm, and the average annual temperature is 8.5 °C (mean years 1951–2020). Monthly precipitation amounts range from 49 mm (March) to 86 mm (June). Otherwise, Burić et al. [46] point out that Pljevlja is the city with the lowest annual rainfall in Montenegro. Snow and the formation of snow cover are common in winter. The average annual number of days with precipitation is 142 days, and the average annual number of days with snow cover is about 65 days. Pljevlja is characterized by other meteorological features, such as the highest frequency of silence in Montenegro (windless days), which is about 15% per year. Let us add that the most common winds are up to 1 m/s (42.5% per year). Winds of over 5 m/s are very rare (on average about 3.4% per year). The two mentioned facts (relatively small annual rainfall and high frequency of quiet and low wind days), along with the terrain configuration (the city is located at the bottom of the valley closed by the sides of the mountains from 1500 to 2238 m above sea level), have a great diminishing effect on natural air purification.

2.2. Materials and Methods

For the purposes of this paper, we used data from the annual reports on river water quality (IHMSM) [45] and monthly reports on air quality of the Center for Eco-toxicological Research of Montenegro (CETRM) [47]. The analysis included a total of 5 hydrological stations (HS) where water samples were taken and 1 air quality station located in the center of Pljevlja (see Figure 1). Data from HS in the Ćehotina basin in Montenegro were used, with two rivers: Ćehotina (4 stations) and Vezišnica (1 station). The Vezišnica River is a left tributary of the Ćehotina and is 15 km long. The mouth of the Vezišnica in Ćehotin is on the outskirts of the town of Pljevlja, and along the right bank of the lower course of the river Vezišnica is the TPP “Pljevlja”. The assessment of river water and air quality was done for the period 2011–2018. A total of 10 parameters of physico-chemical and microbiological water quality were considered from the 5 mentioned profiles (HS): oxygen saturation (%), biochemical oxygen consumption for 5 days (BOD5 in mg/L), ammonium ion (mg/L), pH value, total nitrogen oxides (mg/L), orthophosphates (mg/L), suspended solids (mg/L), temperature (°C), electrical conductivity (μS/cm) and coliform bacteria (MPN in 100 mL).
River water quality assessment was done using WQI methods. In short, all 10 mentioned parameters were combined into one surface water quality indicator. But the share of each of them in the total water quality did not have the same relative importance. Therefore, each of the 10 parameters got its weight or rank of implication (wi) and number or registered value (qi) according to its share in endangering water quality. Finally, summing the product (WQI = qi × wi) gave an index of 100 as the ideal sum of the quality shares of all parameters [16,23,48]:
WQI = 1/10 (Σqi × wi)
For the parameters used to calculate WQI, data for their annual mean values were available. When it comes to PM10 particles, which are 10 microns or less in diameter or micrometers (≤10 μm), for the purposes of this paper we had average daily concentrations (µg/m3 (microgram/cubic meter)), so except for the annual, analysis performed both on a seasonal and daily basis. In Pljevlja, the concentration of PM10 suspended particles was measured in the city center (Centar Station, see Figure 1) and based on 24-h measurements, the daily mean value was obtained. As far as it is known, no categorization (separation of classes) has been given for the concentration of PM10 particles, but a limit value has been adopted.
The number and type of parameters for calculating WQI, as well as their weighting coefficients, can be modified (adjusted) according to local or regional conditions [49,50], hence there were differences in class intervals. Consequently, the classification of surface water quality according to WQI values (Figure 2) was applied, which was officially in use in Montenegro by the State Agency for Nature and Environmental Protection of Montenegro (ANEPM).
It should also be mentioned that there were no missing data for WQI, while a total of 7.5% of daily mean values for the entire observed period (2011–2018) were missing for PM10, but they were not included in the analysis. Of the 7.5% of missing data for PM10, most of them referred to June and July (3% in total), i.e., October (1.4%), while in other months the percentage of missing data was negligible. For the purpose of more detailed analysis, we calculated both parameters (WQI and PM10) the trend and correlation with precipitation and temperature. The linear trend was calculated by the method of smallest amount of squares, and its significance was examined using the Student’s test (t-test). To examine the relationship with temperature and precipitation, the Pearson correlation coefficient was calculated, and the significance of the test using the t-test.

3. Results

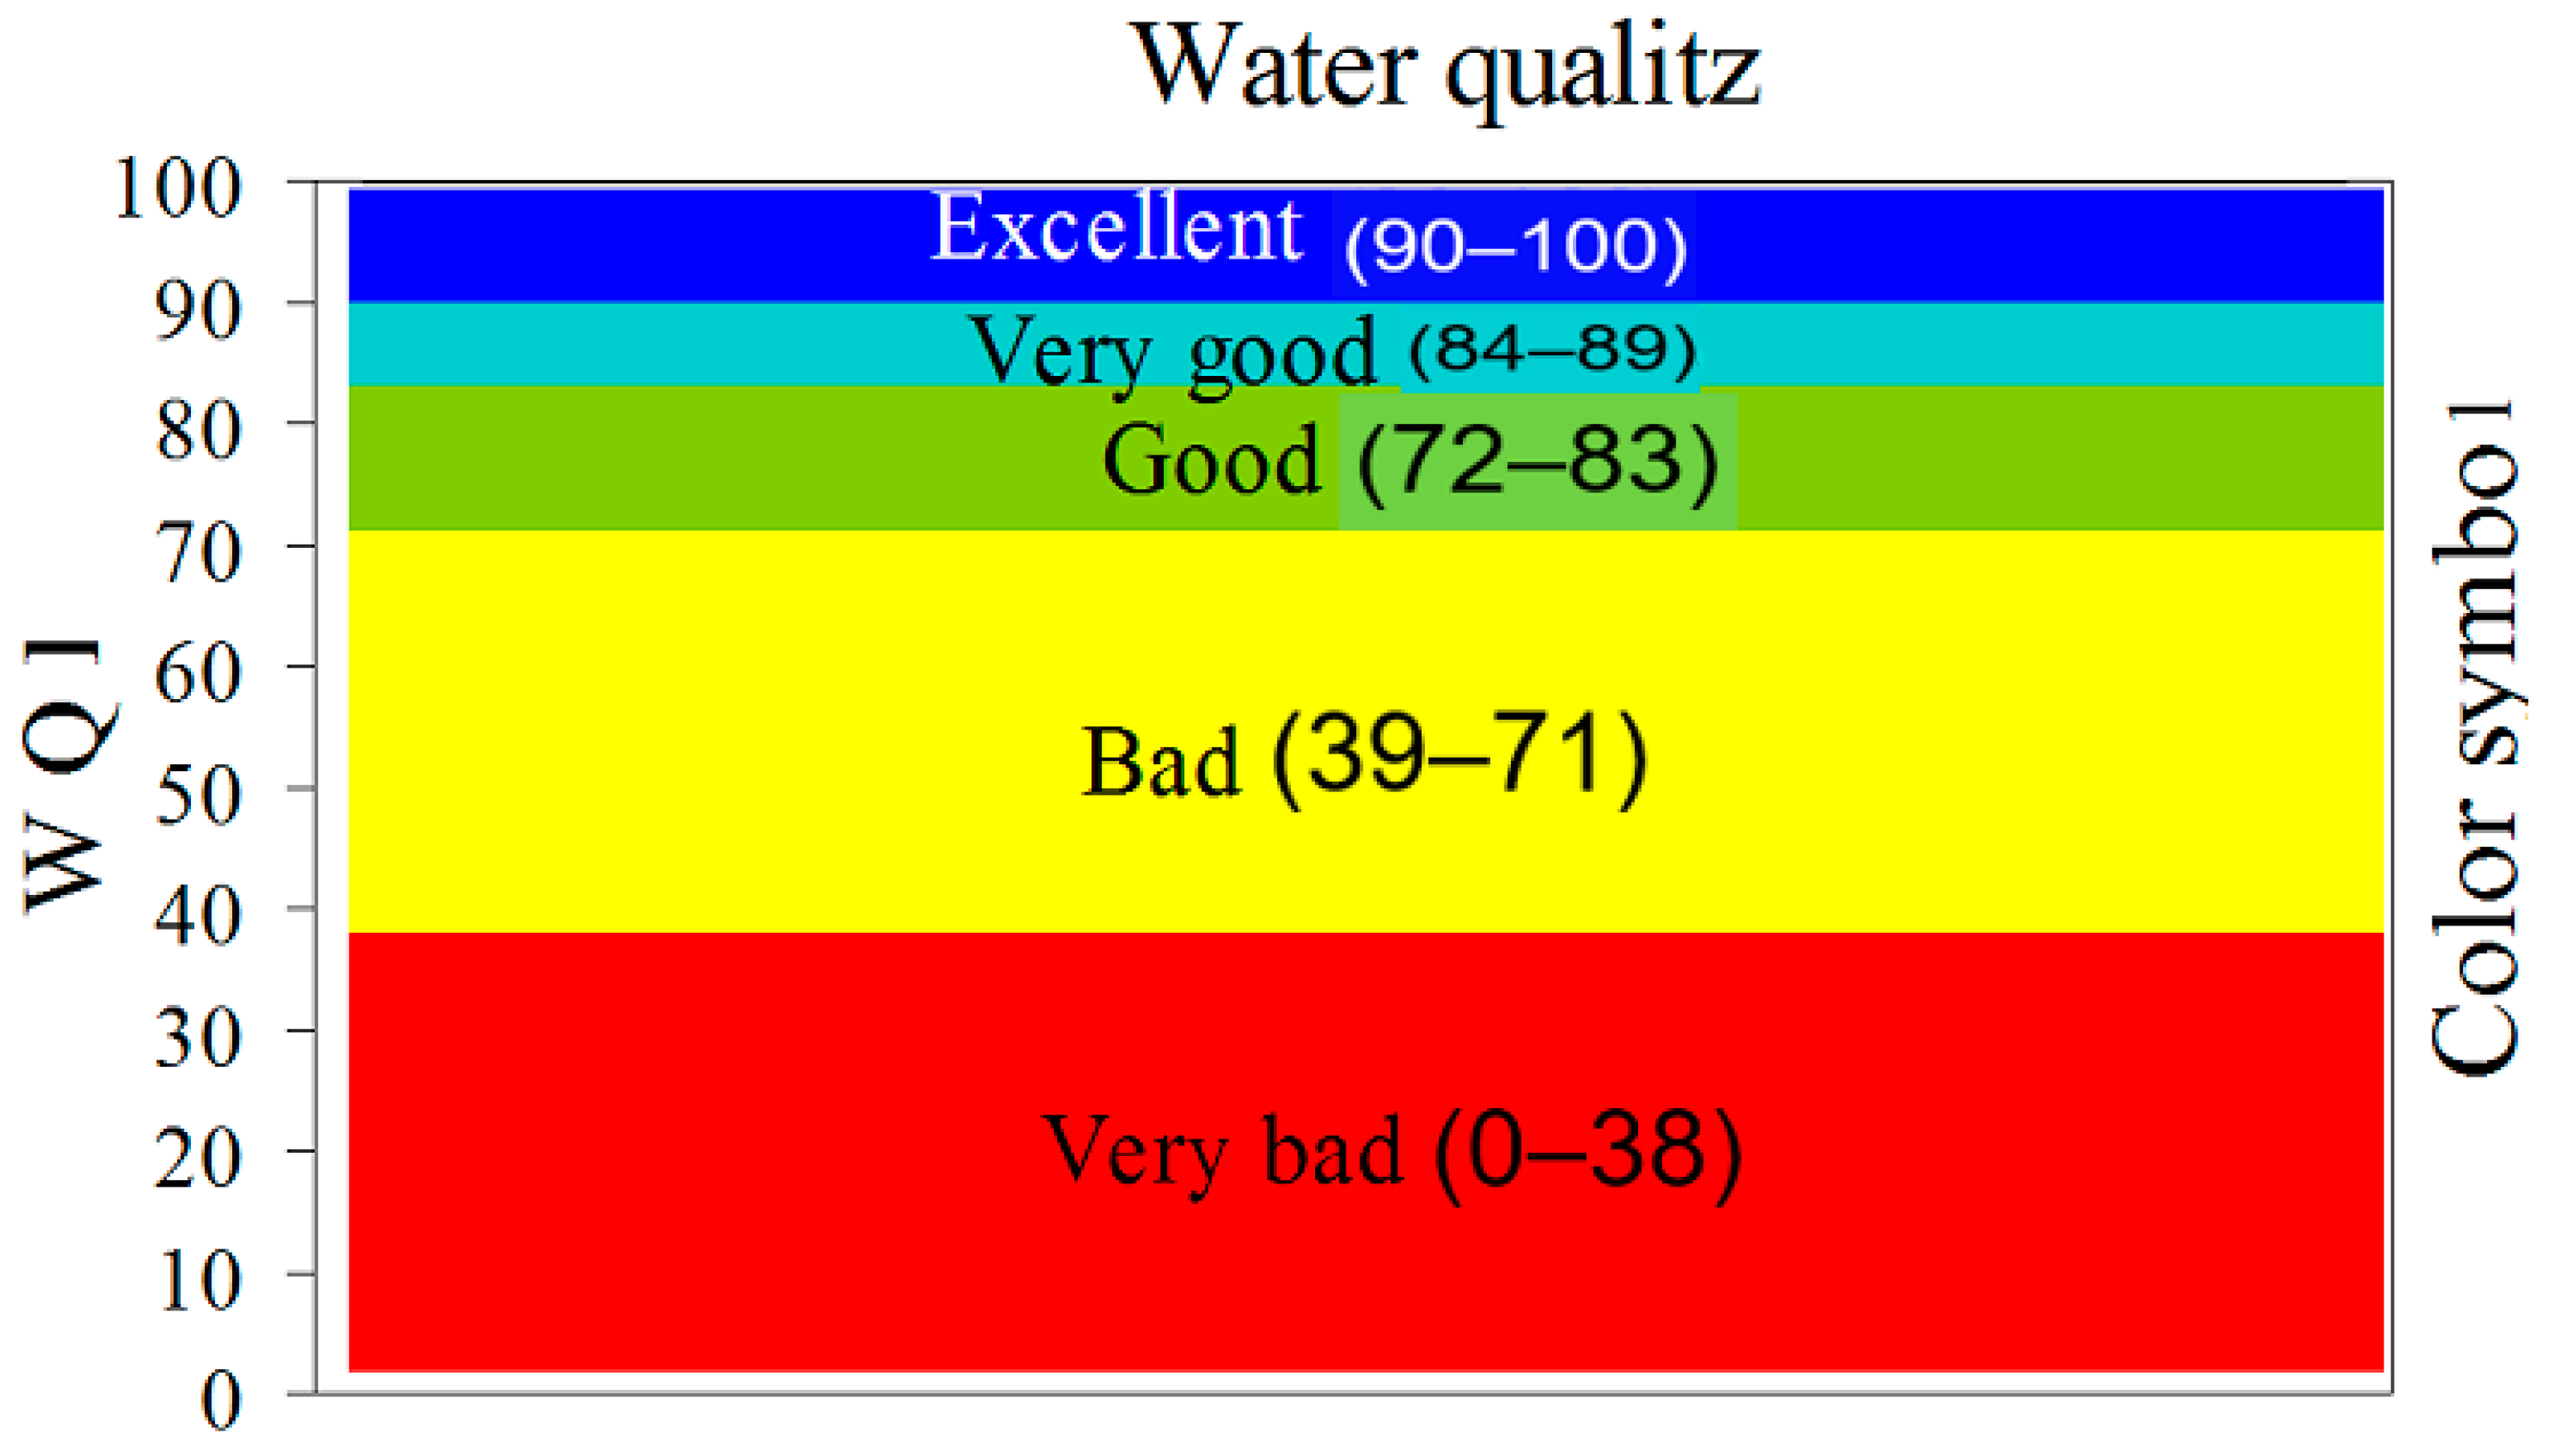
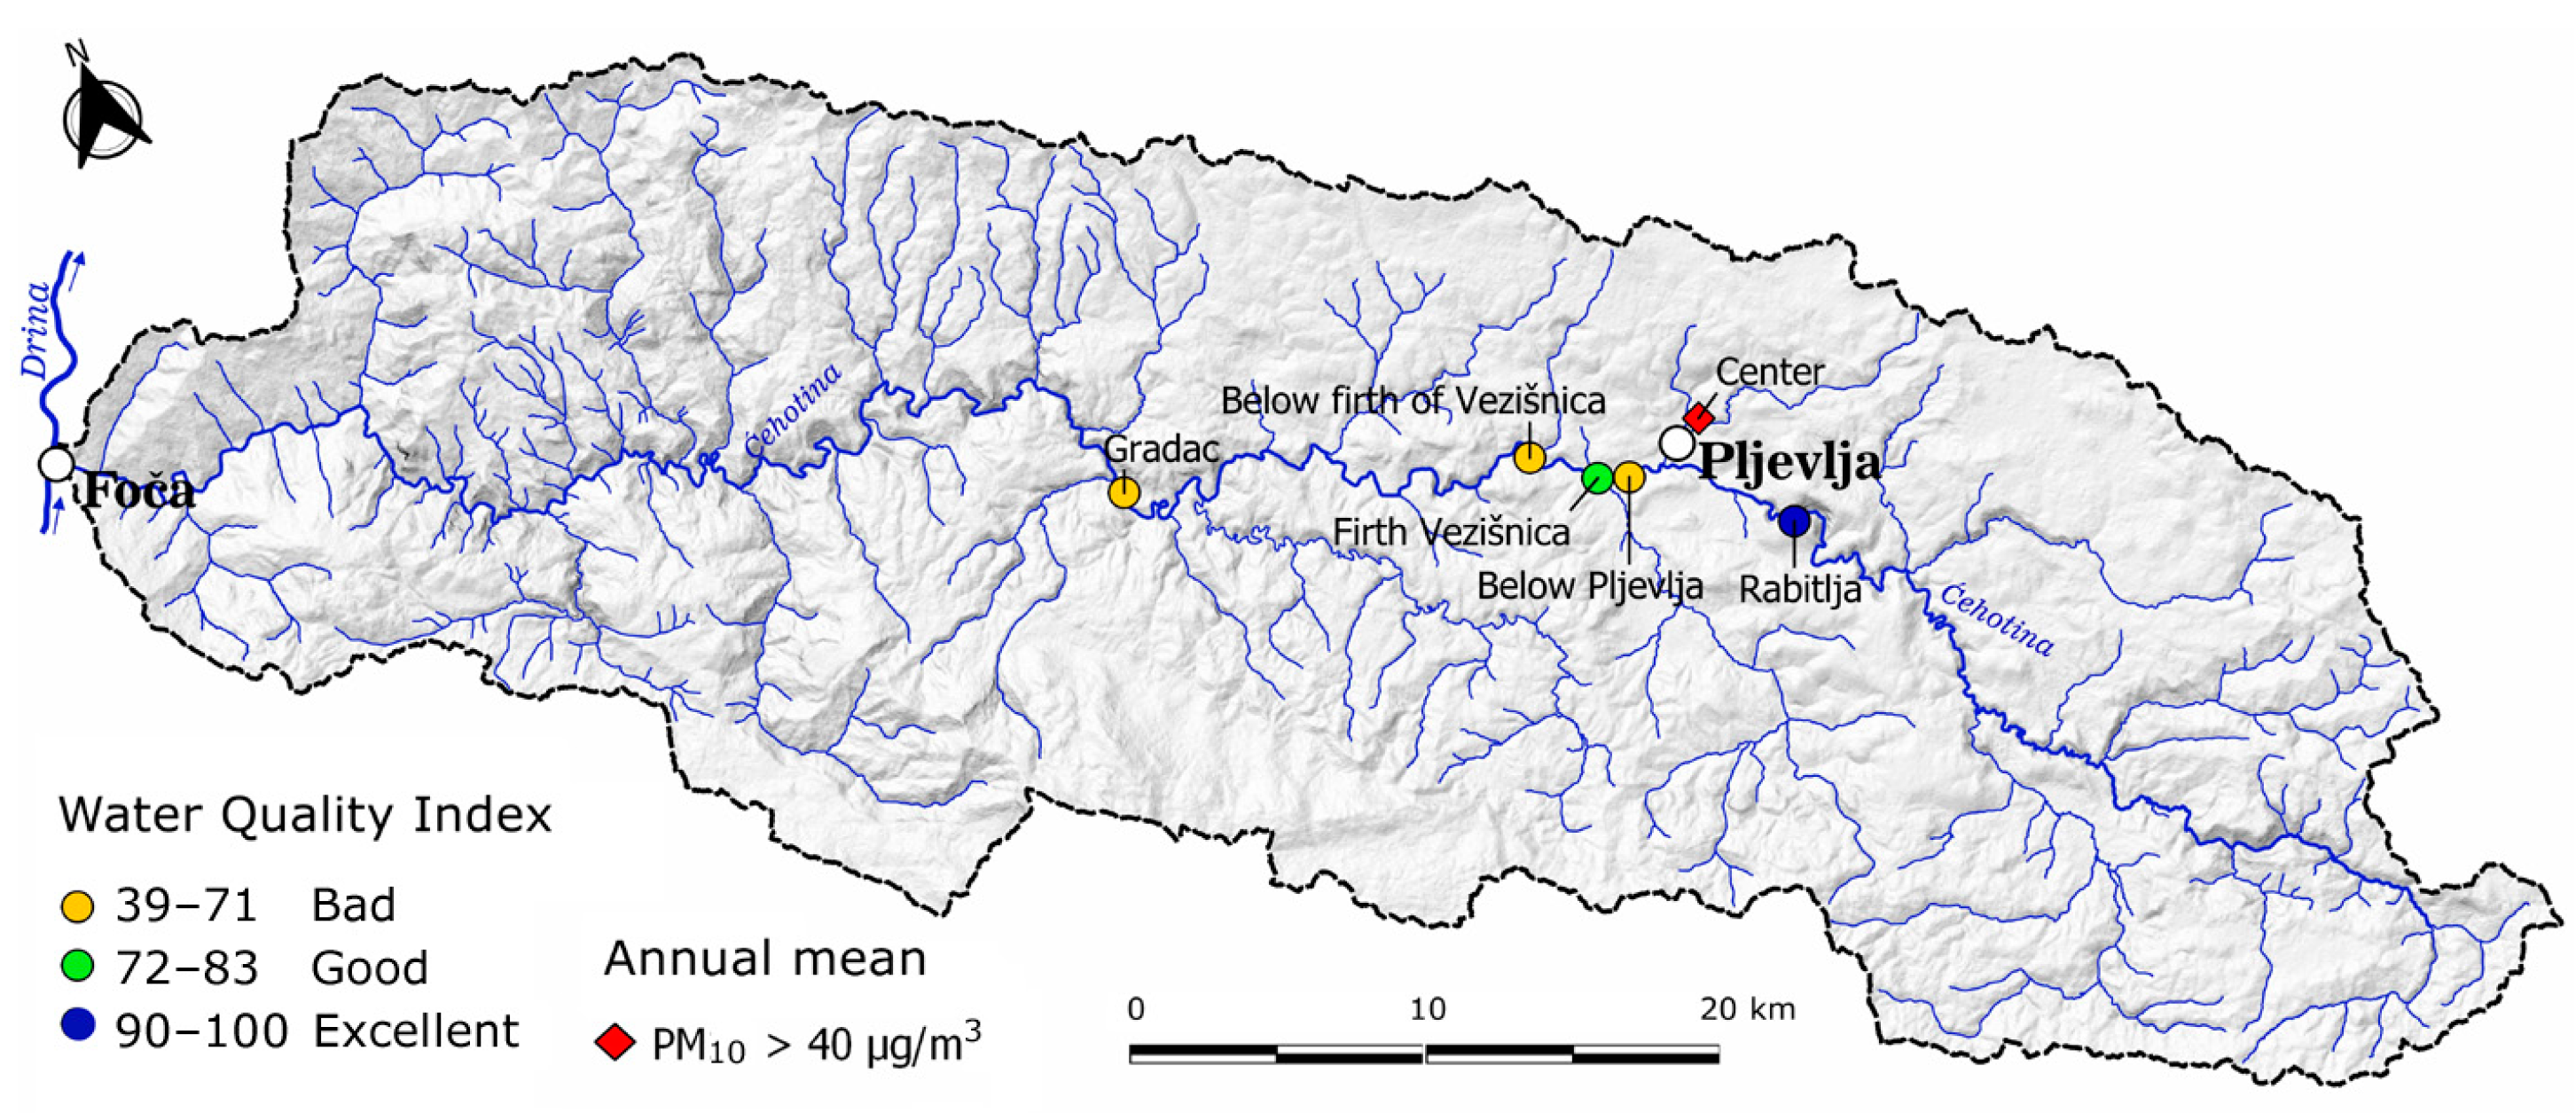
3.1. Water Quality Index Analysis (WQI)

The analysis of the river Ćehotina was conducted at the measuring stations Rabitlja, Below Pljevlja, Below firth of Vezišnica and Gradac, while on its left tributary Vezišnica the analysis was conducted at Firth Vezišnica, HS located at the mouth of Ćehotina. At the measuring station Rabitlja, which is located upstream from Pljevlja, outside the urban zone and the impact of TPP ‘‘Pljevlja’’, water quality in the entire observed period ranged from very good, WQI = 86–89 (2012, 2016 and 2017) to excellent, WQI = 90–92 (2011, 2013–2015 and 2018). Downstream from HS Rabitlja, the river Ćehotina flows through the city area of Pljevlja and collects water from its tributaries Vezišnica, so the water quality is deteriorating. Thus, at HS Below Pljevlja, the water quality in the entire observed period had values ranging from 46 to 68 WQI (bad quality). At the mouth of the Vezišnica in Ćehotina (HS Firth Vezišnica), the average annual WQI values changed almost alternately from bad to good quality class: bad quality classes belong to 2013, 2015 and 2017 (WQI = 64–71), and good 2011, 2012, 2014, 2016 and 2018 (WQI = 73–79). On the next HS, below firth of Vezišnica, which is located on the river Ćehotina downstream from the mouth of Vezišnica, almost in the whole observed period the water was of bad quality (WQI = 44–68), and only 2018 belonged to the class of good (WQI = 74).
The previously mentioned 4 HS (Rabitlja, below Pljevlja, firth Vezišnica and below firth of Vezišnica) are located in the urban zone of Pljevlja or in the immediate vicinity of the city, i.e., they are located in the sector of the river Ćehotina for a length of about 8 km. Downstream, there was only one other measuring point in operation, and that was on the profile of Gradac, HS, which is about 15 km away in relation to the previously analyzed (below firth of Vezišnica). During the observed period (2011–2018), HS Gradac recorded variations in water quality. For 2011, good river water quality was obtained, and for 2012, bad (Table 1). In the period 2013–2015, water quality again belonged to the class of good (WQI = 73–82), and then in 2016 and 2017 it deteriorated and was classified in the class of bad (WQI = 53–71). At the end of the observed period, in 2018, there was a re-improvement of water quality at HS Gradac, because the water of the river Ćehotina was assessed as good quality (WQI = 72).
The obtained results indicated that the state of water quality of the river Ćehotina and its tributaries Vezišnica was alarming, especially in the part of the flow through the urban zone of Pljevlja and downstream from the mouth of Vezišnica. In almost all observed profiles there were year-on-year variations in water quality, which were most likely related to increased/decreased amount of wastewater from settlements, agricultural sources (e.g., livestock and poultry mini farms) and illegal disposal of garbage and other waste both along the stream and in the forest and in the river itself. Year-on-year variations in WQI also occurred in part due to changes in hydrological conditions. In years with an unfavorable hydrological situation (less rainfall and lower runoff than average), river water was of poorer quality (2011 and 2015), in general. On the other hand, the state of water quality in 2018 was slightly better, which can be related to higher water levels, i.e., more favorable meteorological conditions (higher precipitation and higher temperature compared to the average). It should also be mentioned that in recent years, certain measures have been taken to prevent pollution (e.g., the penal policy of illegal waste disposal), and this may be one of the reasons for improving the quality of river water for 2018. Of all the observed HS, the worst quality is the water of the river Ćehotina on the profile of below Pljevlja, and this is the result of an increased amount of municipal wastewater (mostly untreated) from the urban area of Pljevlja. Wastewater from TPP “Pljevlja”, low water levels and human activities along the stream, are the primary causes of water pollution in Vezišnica (a tributary of Ćehotina).
With the aim of analyzing WQI in more detail, the trend was calculated and its significance for the period 2011–2018 was examined. Calculations of the correlation coefficient between WQI and precipitation, i.e., temperature (see Table 1) were also performed. Nevertheless, the value of the WQI trend is minor and has shown no significant bias in the data used. The lack of significance of the trend is likely related to the short record lengths (only 8 years, 2011–2018). The absolute values of the correlation coefficients ranged from 0.01 to 0.60. We are also sure that the reason for the weak correlation (lack of significance) between WQI and precipitation (temperature) is because the coefficient was calculated for annual values, thus canceling the relationship between these two climate elements and WQI. There is no doubt that this connection would be noticed on a monthly basis (probably also seasonally), but, unfortunately, we only had the annual WQI values.
Observing the average annual WQI values for the whole observed period (calculated as the arithmetic mean of annual WQI from 2011 to 2018), the calculation results showed that the water quality of the river Ćehotina was excellent (WQI = 90) and good (WQI = 73) at one HS, and bad at 3 HS (Figure 3). Downstream from the city of Pljevlja and the mouth of the river Vezišnica, the water quality of the river Ćehotina was deteriorating, and this was a consequence of the discharge of municipal city water and wastewater from TPP ‘‘Pljevlja’’. We should mention other factors that had a negative impact on the water quality of the river Ćehotina: anthropogenic impact along its course (large amount of various wastes in its bed and along the banks, agricultural activities, wastewater from mini farms—livestock and poultry, etc.) and low water level (especially tributaries of Vezišnica).
Comparing the data for the 10 mentioned physicochemical and microbiological parameters used to obtain WQI, it is noticeable that their values at HS are located in the part of the flow through the city area of Pljevlja and at the mouth of Vezišnica, which is in line with the above. Thus, at HS Below Pljevlja and HS Firth Vezišnica there were higher concentrations, e.g., BOD5 and ammonium ions relative to the other 3 HS, in general. In addition, increased concentrations of BOD5 and ammonium ions were observed on almost all profiles for the years with the lowest WQI. This was also logical, because the value of BOD5 was an indicator of the biological activity of wastewater i.e., the degree of pollution with organic substances. Ammonium ion concentrations are an indicator of pollution from agricultural sources and industrial facilities [51].
During hydrologically unfavorable years, such as 2011 and 2015, the highest average annual concentrations of BOD5 and ammonium ions (up to 7.2 mg/L and up to 1.33 mg/L, respectively) were registered at HS Below Pljevlja and HS Firth Vezišnica (see Table A1 in Appendix A). Therefore, the quality of the river water quality of Ćehotina was worrying, especially in the part of the flow that flows through the urban zone of Pljevlja and downstream from the mouth of Vezišnica. In the south of Montenegro, the Morača river basin, the situation was much better, except in the part of the flow through the capital Podgorica [24].
There are two important benefits of using the WQI method. Firstly several variables are included in one number and it gives the possibility to compare water quality of one water body in time and secondly we can compare several water objects in space. The main disadvantages of this methodology are that it does not take into account data on some important parameters, such as inorganic pollution (e.g., heavy metals) and that WQI can be calculated even if not all of the mentioned parameters are available [52]. One of the parameters which indicates increased pollution of watercourses is the disturbed natural Ca/Mg ion ratio, which is not taken into account when calculating WQI. Therefore, in future research, the WQI method should be used in combination with other methods to assess water quality.

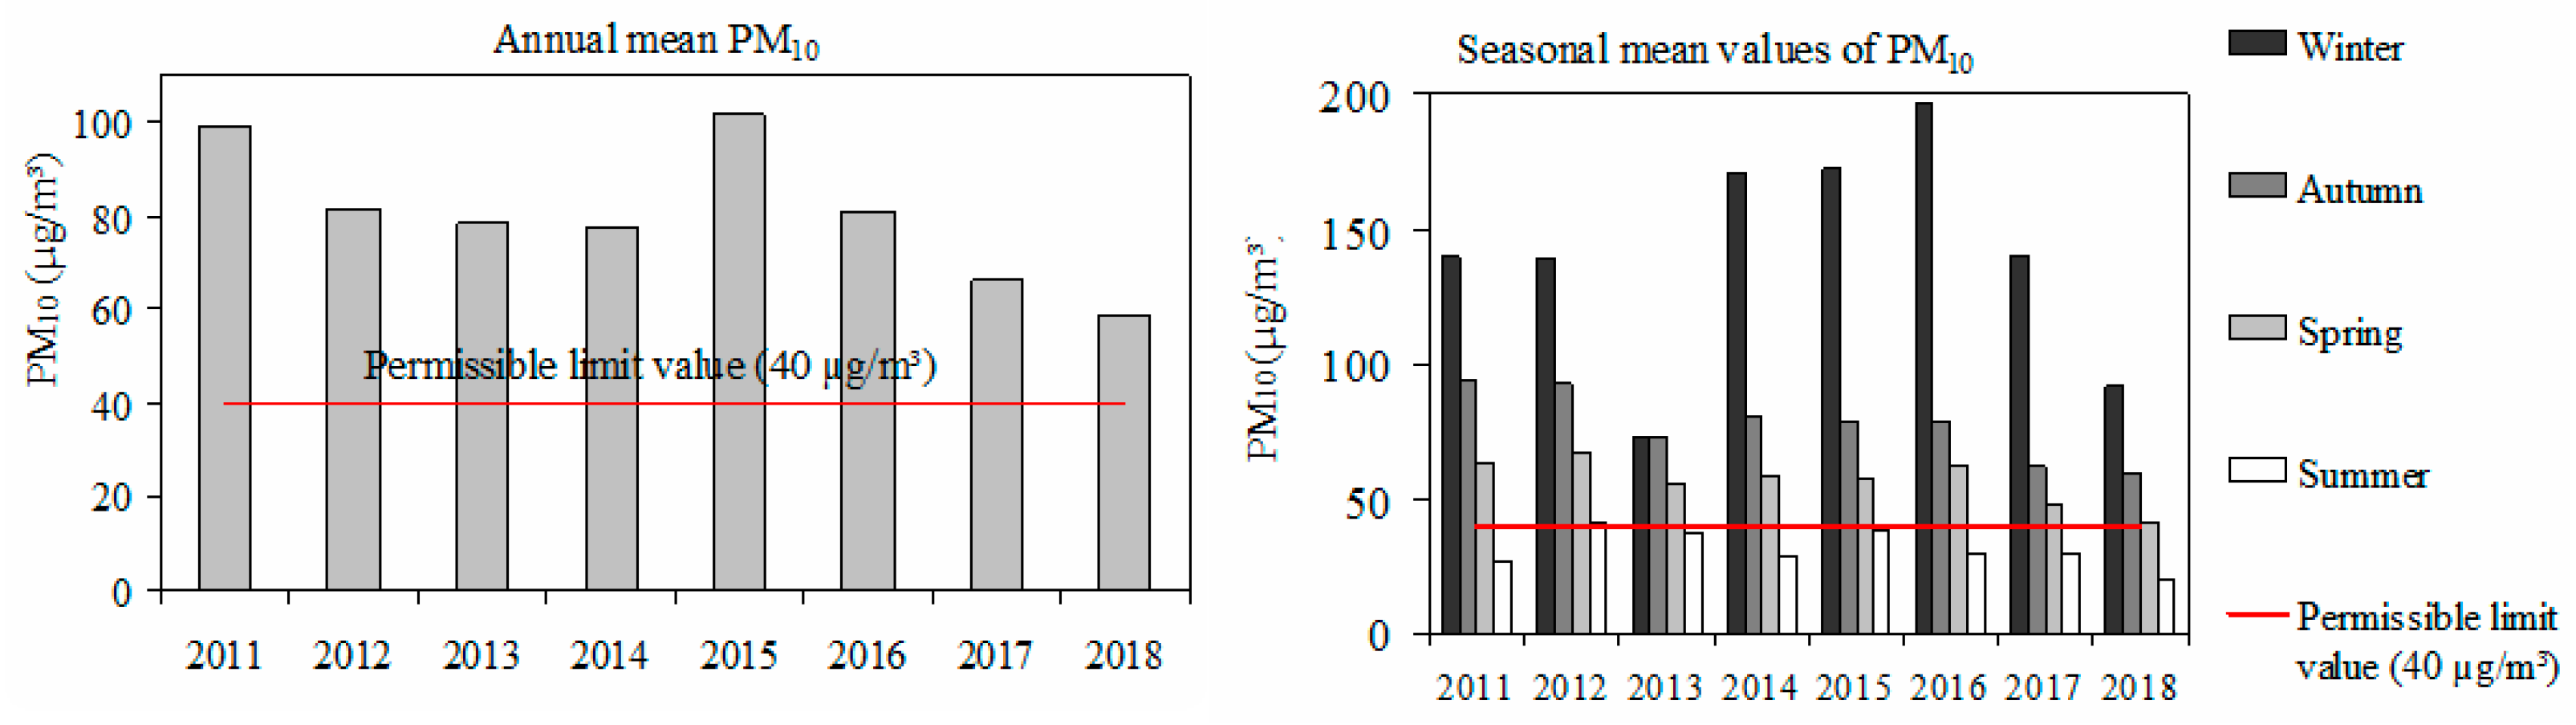
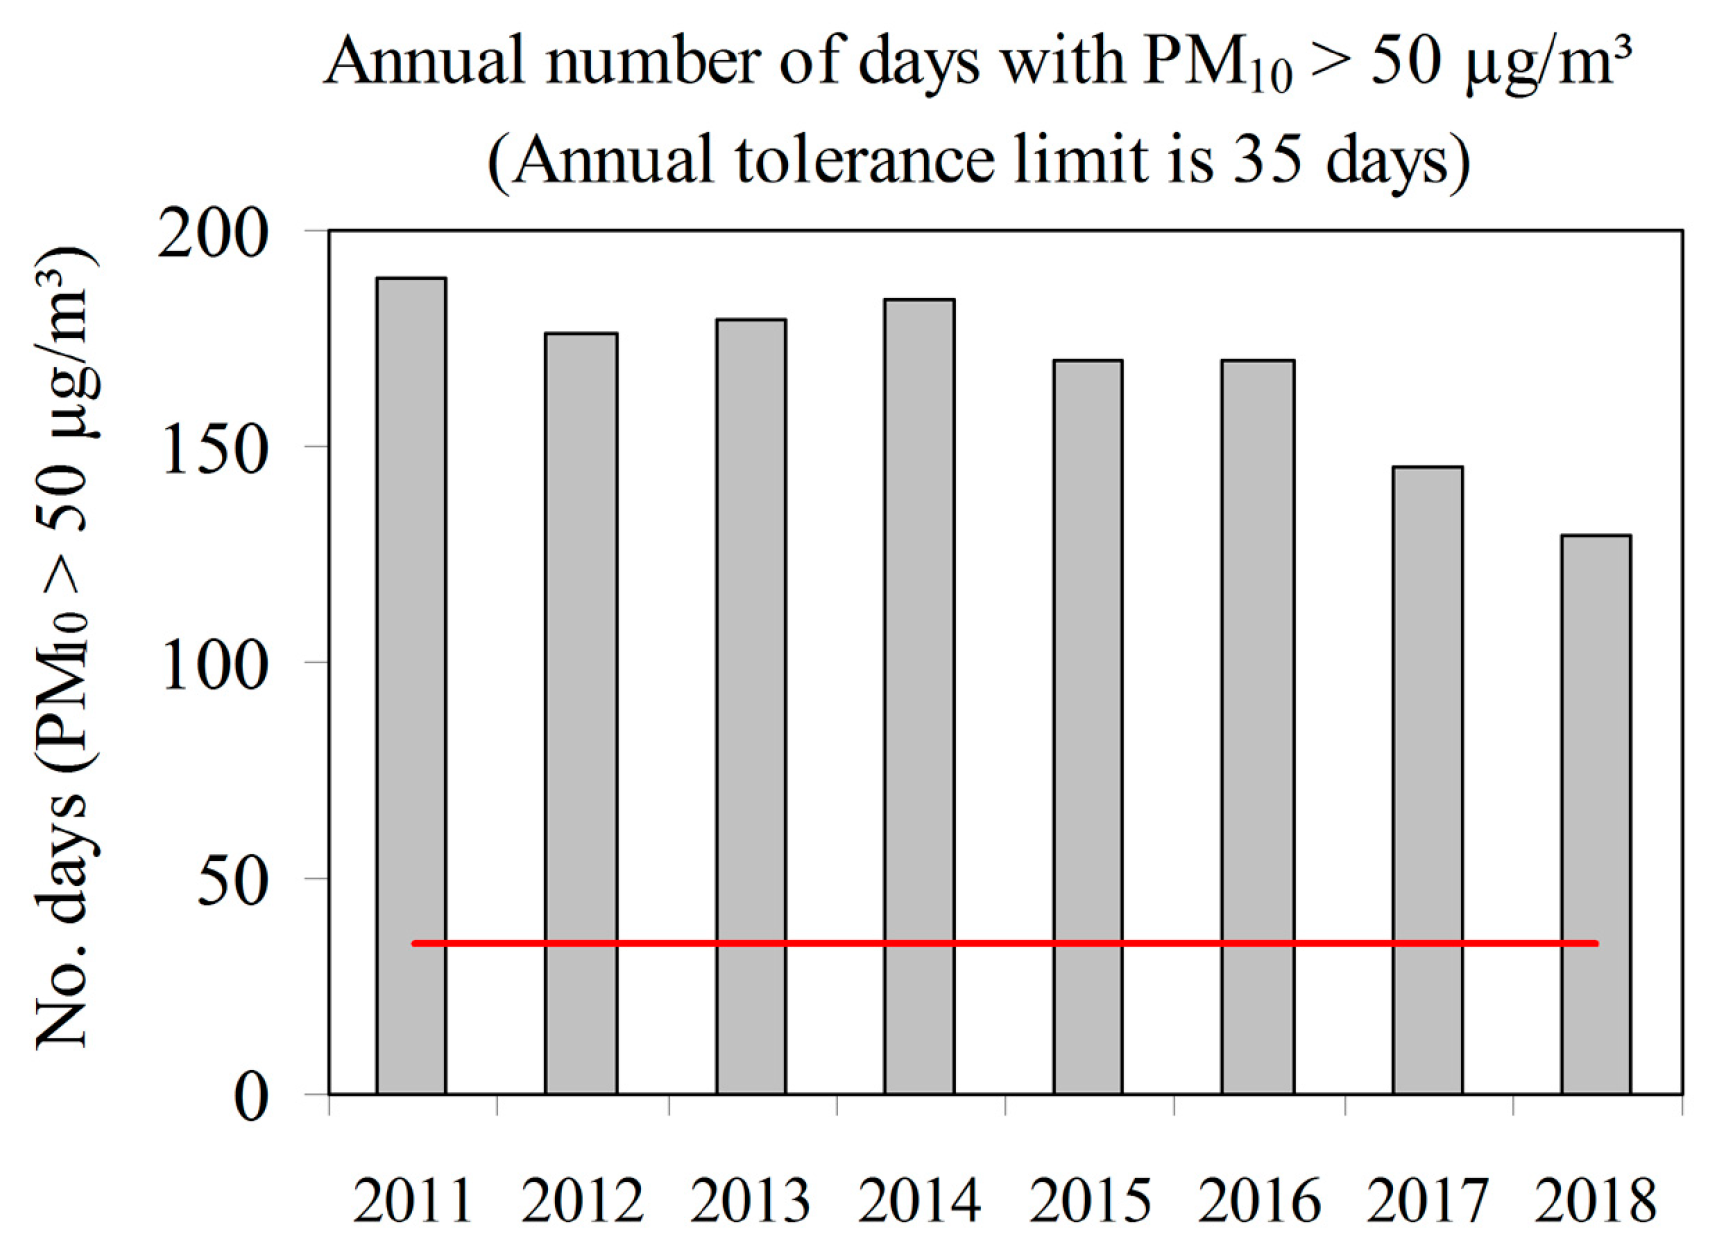
3.2. Analysis of PM10 Concentration of Suspended Particles

In the observed period (2011–2018), the lowest annual mean value of PM10 particles was in 2014 (77.7 µg/m3), and the highest in 2015 (101.5 µg/m3). It is a known fact that the air is cleaner after precipitation (rain, snow). The highest precipitation in Pljevlja (972.9 mm) was in 2014 while the lowest (672.5 mm) was noticed in 2015. This implies that there should have been a significant correlation between these two parameters (PM10 particle concentration and precipitation amount). However, a relatively low and statistically insignificant correlation coefficient (−0.48) was obtained, most likely due to the fact that it was calculated between annual values.
Air quality protection in Montenegro is regulated by new legislation. For the purposes of this paper, the lower thresholds for the concentration of PM10 particles were the values adopted by the State CETRM [47] based on the recommendations of EU Directives [53] and WHO [54], which are 40 µg/m3 on an annual and seasonal level and 50 µg/m3 on a daily basis. CETRM has adopted 35 days per year as a tolerance limit, which means that exceedances above 35 times a year with a mean daily concentration >50 µg/m3 are not desirable (Table 2).
It is important to point out that the annual mean concentrations in the entire observed period (2011–2018) were above the prescribed limit value (50 µg/m3), so it can be concluded that at the annual level the air in Pljevlja is significantly polluted with PM10 particles (Figure 4, left). When it comes to seasons (Figure 4, right), the winter (December–January–February) mean concentration of PM10 particles ranged from 73.0 µg/m3 (2013) to 196.5 µg/m3 (2016). It should be noted that the winter of 2013 had an extreme amount of precipitation (274 mm), or 1.6 times higher than the average (170 mm). Regarding spring (March–April–May) and summer (June–July–August), 2012 with the highest mean concentration of PM10 particles (spring = 67.6 µg/m3, summer = 40.4 µg/m3) and 2018 with the lowest concentration (spring = 41.1 µg/m3, summer = 20.7 µg/m3). In the autumn season, 2018 also had the lowest average concentration of PM10 (59.2 µg/m3), while the highest average concentration was registered in 2011 (94.1 µg/m3).
Previous results showed that the highest mean concentrations of PM10 particles were recorded during winter and autumn, i.e., in the colder part of the year, and the lowest were recorded in summer. This was to be expected, because during the heating period of houses and flats (in winter, and generally in the colder part of the year) the emission of pollutants (from individual fireboxes) is much higher. Additionally, the meteorological factor (temperature and precipitation) is important. In Pljevlja, there is less precipitation in winter, temperatures are often below 0 °C (average winter temperature is −1.2 °C, the absolute minimum is −29.4 °C, recorded on 26 January 1954), and cold air is heavier, so it settles in the valley, because poor air purification (frequent silences and days with light wind). Though, in summer the amount and frequency of precipitation is higher, the warm air is lighter, so it rises.
The average concentration of PM10 particles of 40 µg/m3 was accepted as a limit value and at the level of seasons (up to 40 µg/m3 allowed (acceptable) concentration, and above 40 µg/m3 dangerous concentration for human health). It was clear that during the winter, autumn and spring, the average concentration of PM10 particles in Pljevlja was above the allowed limit. It could be argued that the situation was alarming in winter, because the average values of PM10 particles were higher than 1.8 to as much as 4.9 times (2016) than allowed (40 µg/m3). In summer, the mean concentration of PM10 particles was within the permitted values. The only exception is 2012, when the summer mean concentration of PM10 particles was 40.4 µg/m3, i.e., slightly above the permitted limit.
The analysis of the number of days with the average concentration of PM10 particles in the air in the urban zone of Pljevlja indicates that the situation was more than worrying. Specifically, if we take the value of 35 times per year as the tolerance limit, it could be argued that the situation was alarming, because every year in the observed period (2011–2018) this threshold was exceeded from 3.7 to 5.4 times. For instance, in 2018 it had 129 days with an average daily concentration of PM10 particles greater than 50 µg/m3, and in 2011 it had as many as 189 such days (Figure 5). As already mentioned, the biggest air pollution is in winter, especially in January, which is the coldest month of the year. In the period 2011–2018, daily mean concentrations of PM10 particles in January ranged up to an enormous 793.9 µg/m3 (absolute daily maximum, registered on 10.01.2015). Rarely has a day in January been without a high value. In other words, out of 248 January days for the 8 mentioned years, only 37 times (or 37 days) the daily mean concentration of PM10 particles was below the prescribed limit value of 50 µg/m3.
In the previous part, the influence of the meteorological factor (precipitation and temperature) on the air quality was mentioned several times. Therefore, the results of the calculation of the correlation coefficients of PM10 particles with precipitation and temperature are given below, and the trend of PM10 concentration for the period 2011–2010 was also calculated. It should be noted that the obtained results should be accepted with a certain dose of caution, especially when it comes to the trend, because it was too short a period. Only in the winter season did the average concentration of PM10 particles increase (0.45 µg/m3/year), but the trend was insignificant. In other seasons, as well as on an annual basis, the linear trend was negative (Table 3).
Consequently there was a decrease in the concentration of PM10 particles in the air. This was an encouraging fact, before the trend of decreasing PM10 particles meets the conditions of significance at the level of acceptance of the hypothesis of 95% (risk level p < 0.05) during the spring and annually (trend = −2.82 µg/m3/year and trend = −3.88 µg/m3/year), i.e., by 99% (p < 0.01) in the autumn season (trend = −4.56 µg/m3/year). When it comes to correlation, in most cases negative values of the coefficients (C) were obtained, the higher the amount of precipitation (higher temperature) the lower the concentration of PM10 particles, and vice versa. The inverse correlation between PM10 particles and precipitation was significant for the summer season (C = −0.76), while in other cases it was insignificant. A significant relationship was obtained with temperature for spring −0.89) and on an annual basis (C = −0.87).
The WHO has not defined any value of the concentration of PM10 and PM2.5 particles as a lower threshold below which the impact of these substances on human health would be completely eliminated. The limit values for the concentration of PM particles mentioned in the WHO document [54] are given as lower thresholds, i.e., concentrations that can be reached in order to minimize the effects on human health.
The previous analysis showed that during most of the year there was a lot of air pollution in the urban zone of Pljevlja. Three groups of factors had a major impact on the excessive concentration of PM10 particles in this city, especially in the colder part of the year: economic, morphological and meteorological. In addition to the usual economic elements, such as exhaust gases from cars and small and medium enterprises that consume fossil fuels, it can be concluded that the major impact had a huge combustion of coal for the needs of TPP “Pljevlja” and heating of individual households (houses). When it comes to the configuration of the terrain (morphological factor), Pljevlja is located at the bottom of the depression (valley), which is surrounded and quite closed by the sides of high mountains. This form of relief makes natural air ventilation very difficult. The influence of morphological factors was reflected through temperature, precipitation and frequency and wind speed. Pljevlja is the city with the lowest amount of precipitation, the highest cloudiness [55] and with the highest percentage of silences (days without wind or with wind of negligible speed) in Montenegro. Winters are long and cold, i.e., negative temperatures are frequent. Higher amount and frequency of precipitation purifies the air, and the same goes for higher frequency and wind speed. Cold air is heavier, so in conditions of lack of precipitation and wind, it settles along the bottom of the Pljevlja valley. Consequently temperature inversions were of a common occurrence. Along with the cold air at the bottom of the valley (in the ground layer of the atmosphere), pollutants were also deposited.
In addition to all the above, Pljevlja is the city with the largest number of foggy days in Montenegro (it is not uncommon to have about 200 days a year with low fog). All three groups of the mentioned factors contributed to the increase of the concentration of pollutants in Pljevlja and frequent fogs of smog and smoke in the colder part of the year. The primary sources of emission of suspended PM10 particles in Pljevlja were those related to coal exploitation and fossil fuel combustion (TPP “Pljevlja”, individual combustion plants, motor vehicles and dust emitted from the surrounding coal mines). In the MORTA document [56], agriculture, i.e., synthetic N-fertilizers, was mentioned among the main sources of PM10 particulate emissions.

4. Conclusions

This study presents the results of the quality of river water (using WQI method) and air pollution in Pljevlja (one of the largest urban areas in the northern Montenegro), using the methods of categorization, trends and correlations. The results of the analysis of WQI and concentration of PM10 particles showed that the waters of the river Ćehotina and its tributaries Vezišnica, which flow through Pljevlja, as well as the air in this city, were unacceptably polluted. Pljevlja is a “hot spot” in terms of water and especially air pollution. During the period under review (2011–2018), in most cases, the water of the mentioned rivers belonged to the class of bad quality. The WQI trend is negligible, i.e., showed no significant bias. Likewise, no significant relationship was obtained between air temperature and precipitation on the one hand and WQI on the other. The weak correlation is most likely due to the fact that WQI was considered only on an annual basis. When it comes to PM10 particles, we had daily data, and the general conclusion is that the situation is more than worrying. Average concentrations of PM10 particles (daily, seasonal and annual) were above the prescribed limit values (>40 and 50 µg/m3, respectively), except during summer. Pljevlja is a city with 129 to 189 days per year with a concentration of PM10 particles higher than 50 µg/m3, which is much higher than the legally adopted tolerance limit (35 days per year). Nevertheless, it is encouraging that the concentration of PM10 particles decreases (negative trend) during spring, summer and autumn, as well as on an annual basis. The results further showed that the concentration of PM10 particles is significantly related to the temperature in the spring season and at the annual level, while the best connection with precipitation is during the summer. The main disadvantages of the WQI method were that it did not take into account data on some important parameters (e.g., on inorganic pollution). The drawback of this paper was the relatively short record lengths of water and air (2011–2018) on the observed profiles.
Sources of pollution in this area awere wastewaters, exhaust emissions from TPP “Pljevlja”, individual furnaces, motor vehicles, then agricultural activities, illegal garbage disposal, etc.). Therefore, it is compulsory to take certain measures as soon as possible in order to improve the quality of both river water and air in Pljevlja, and thus protect human health. In order to obtain a more complete picture of the ecological condition (river water and air), not only in this city but also in other parts of Montenegro, it is necessary to continue monitoring and work on developing citizens’ consciousness of the importance of preserving and improving water, air and soil quality. The protection of rivers and other water bodies, air and land, should be one of the priority tasks of the current generations, because pollution grows into a “monster” that seriously endangers today’s civilization.

Author Contributions

Conceptualization, I.M. and D.B.; data curation, I.M.; formal analysis, M.D.; Investigation, M.D.; methodology, D.B. and I.M.; project administration, M.D. and M.P.; supervision, D.B.; validation, D.B. and I.M.; writing—original draft preparation, D.B. and I.M.; writing—review and editing, D.B. and M.P. All authors have read and agreed to the published version of the manuscript.

Funding

This research received no external funding.

Institutional Review Board Statement

Not applicable.

Informed Consent Statement

Not applicable.

Data Availability Statement

Data is not publicly available, though the data may be made available on request from the corresponding author.

Conflicts of Interest

The authors declare no conflict of interest.

Appendix A

Table A1. Average annual values of 10 physicochemical and microbiological parameters used to obtain WQI on five considered hydrological stations (HS).
No.ParameterHS RabitljaHS Below Pljevlja
(Unit)2011201220132014201520162017201820112012201320142015201620172018
1. WT (°C) 12.75 12.25 13.8 13.6 11.5 10.65 11.35 13.6 12.8 14.55 14.75 13.4 12.1 10.9 12.05 13.45
2. pH (0–14) 8.4 8.1 8.1 8.2 8.1 8.1 8.1 8.1 8.2 8.1 7.9 7.9 7.9 7.9 7.8 8
3. EC (μS/cm) 303 295 311 309 316 302 309 300 386 400 398 386 393 366 420 364
4. SS (mg/L) 0 5 1 3 4 4 4 3 6 10 2 1 44 34 17 3
5. OS (%) 101.5 96 98 104.5 100.5 95 99 103.5 88.5 76.5 79.5 93.5 82.5 90 40 87.5
6. BOD5 (mg/L) 1.5 2.2 1.8 1.4 1.8 1.9 5.4 1.9 7.2 6.8 7.3 4.8 6 3.7 7.4 4.6
7. NH4 (mg/L) 0.03 0.12 0.12 0.06 0.08 0.03 0.04 0.01 1.33 1.30 0.89 0.53 1.07 0.65 1.29 0.61
8. PO4 (mg/L) 0.06 0.07 0.08 0.07 0.05 0.09 0.03 0.03 0.39 0.35 0.3 0.24 0.38 0.29 0.46 0.25
9. NO3 (mg/L) 1.78 1.87 1.98 3.02 2.24 2.57 1.94 1.46 2.9 3.8 3.06 5.35 4.18 4 3.07 2.87
10. CB (MPN in 100 mL) 286 167 162 222 228 261 41 221 14550 3785 7175 6410 7770 3650 4000 1075
HS Below Firth of VezišnicaHS Gradac
2011201220132014201520162017201820112012201320142015201620172018
1. WT (°C) 13 15.15 15.15 14 12.7 10.75 12.3 13.5 12.8 14.6 15 13.35 11.9 10.7 12.3 13
2. pH (0–14) 8.3 8.2 7.9 8.1 8.2 8 8 8 8.4 8.3 8.2 8.3 8.3 8.2 8.2 8.1
3. EC (μS/cm) 385 387 386 385 389 377 504 399 359 365 373 366 376 351 423 386
4. SS (mg/L) 1 13 2 3 24 18 21 4 0 15 2 10 17 24 19 27
5. OS (%) 87.5 80 80 95.5 83.5 89.5 68 93.5 114.5 102 102 110 105 89.5 74 109
6. BOD5 (mg/L) 3.9 5.6 6.7 5.4 4.6 3.7 6.7 3.1 2.9 4 4.3 3 2.8 4.1 6.7 4.4
7. NH4 (mg/L) 1.03 1.41 1.06 0.63 1 0.52 3.54 0.41 0.29 0.23 0.39 0.25 0.08 0.32 1.67 0.3
8. PO4 (mg/L) 0.39 0.36 0.39 0.34 0.48 0.36 4.26 0.24 0.24 0.6 0.27 0.18 0.11 0.15 0.93 0.14
9. NO3 (mg/L) 3.23 3.8 3.64 5.91 4.31 4.18 22.37 4.27 4.57 8.8 4.53 4.68 5.42 3.86 4.92 4.28
10. CB (MPN in 100 mL) 12,250 2502 1400 705 1150 1035 10,840 755 3195 1377 369 625 755 1990 3735 255
HS Firth Vezišnica
20112012201320142015201620172018Definition
1. WT (°C) 13.2 16 15.4 13.85 12.7 11.1 12.7 13.5 WT—Water temperature
2. pH (0–14) 8.5 8.6 8.7 8.4 8.8 8.3 8.7 8.5 pH value
3. EC (μS/cm) 370 386 379 444 460 385 422 417 EC—Electrical conductivity
4. SS (mg/L) 13 6 10 39 12 17 6 9 SS—Suspended solids
5. OS (%) 87 93.5 89.5 95 81.5 91 87 89 OS—Oxygen saturation
6. BOD5 (mg/L) 1.7 3.9 5.8 2.6 2.2 1.8 5.3 2.5 BOD5—Biochemical oxygen consumption for 5 days
7. NH4 (mg/L) 0.25 0.22 0.47 0.26 0.46 0.21 0.46 0.34 NH4—Ammonium ion
8. PO4 (mg/L) 0.26 0.15 0.57 0.21 0.18 0.13 0.22 0.16 PO4—Orthophosphates
9. NO3 (mg/L) 2.24 2.49 4.29 3.54 3.82 3.22 2.93 2.21 NO3—Total nitrogen oxides
10. CB (MPN in 100 mL) 2325 4385 1728 1145 730 1250 1720 747 CB—Coliform bacteria

References

  1. Dong, H.; Geng, Y.; Sarkis, J.; Fujita, T.; Okadera, T.; Xue, B. Regional water footprint evaluation in China: A case of Liaoning. Sci. Total Environ. 2013, 442, 215–224. [Google Scholar] [CrossRef]
  2. O’Connell, E. Towards Adaptation of Water Resource Systems to Climatic and Socio-Economic Change. Water Resour. Manag. 2017, 31, 2965–2984. [Google Scholar] [CrossRef]
  3. Kowalkowski, T.; Zbytniewski, R.; Szpejna, J.; Buszewski, B. Application of chemometrics in river water classification. Water Res. 2006, 40, 744–752. [Google Scholar] [CrossRef] [PubMed]
  4. Córdoba, E.B.; Martínez, A.C.; Ferrer, E.V. Water quality indicators: Comparison of a probabilistic index and a general quality index. The case of the Confederación Hidrográfica del Júcar (Spain). Ecol. Indic. 2010, 10, 1049–1054. [Google Scholar] [CrossRef]
  5. Sasakova, N.; Gregova, G.; Takacova, D.; Mojzisova, J.; Papajova, I.; Venglovsky, J.; Szaboova, T.; Kovacova, S. Pollution of Surface and Ground Water by Sources Related to Agricultural Activities. Front. Sustain. Food Syst. 2018, 2, 1–11. [Google Scholar] [CrossRef] [Green Version]
  6. Kawo, N.S.; Karuppannan, S. Groundwater quality assessment using water quality index and GIS technique in Modjo River Basin, central Ethiopia. J. Afr. Earth Sci. 2018, 147, 300–311. [Google Scholar] [CrossRef]
  7. Farooqui, K.M.; Sar, S.K.; Diwan, V. Investigation of water quality in Ambur city by water quality indexing. Holist. Approach Environ. 2020, 10, 48–52. [Google Scholar] [CrossRef]
  8. Cude, C.G. Oregon water quality index a tool for evaluating water quality management effectiveness. Jawra J. Am. Water Resour. Assoc. 2001, 37, 125–137. [Google Scholar] [CrossRef]
  9. Boyacioglu, H. Development of a water quality index based on a European classification scheme. Water Sa 2009, 33, 101–106. [Google Scholar] [CrossRef] [Green Version]
  10. Rocha, F.C.; Andrade, E.M.; Lopes, F.B. Water quality index calculated from biological, physical and chemical attributes. Environ. Monit. Assess. 2014, 187, 4163. [Google Scholar] [CrossRef]
  11. Abuzaid, A.S. Evaluating surface water quality for irrigation in Dakahlia Governorate using water quality index and GIS. J. Soil Sci. Agric. Eng. Mansoura Univ. 2018, 9, 481–490. [Google Scholar]
  12. Khan, H.; Khan, A.A.; Hall, S. The Canadian Water Quality Index: A tool for water resources management. In Proceedings of the MTERM International Conference, AIT, Pathum Thani, Thailand, 6–10 June 2005; pp. 1–8. [Google Scholar]
  13. Lumb, A.; Halliwell, D.; Sharma, T. Application of CCME Water Quality Index to Monitor Water Quality: A Case Study of the Mackenzie River Basin, Canada. Environ. Monit. Assess. 2006, 113, 411–429. [Google Scholar] [CrossRef] [PubMed]
  14. Bharti, N.; Katyal, D. Water quality indices used for surface water vulnerability assessment. International journal of environmental sciences. 2011, 1, 154–173. [Google Scholar]
  15. Sutadian, A.D.; Muttil, N.; Yilmaz, A.G.; Perera, B. Development of river water quality indices—A review. Environ. Monit. Assess. 2016, 188, 1–29. [Google Scholar] [CrossRef] [PubMed] [Green Version]
  16. Mititelu-Ionuş, O. Water Quality Index—Assessment method of the Motru river water quality (Oltenia, Romaia). Univ. Craiova Ser. Geogr. 2010, 13, 74–83. [Google Scholar]
  17. Yisa, J. Analytical Studies on Water Quality Index of River Landzu. Am. J. Appl. Sci. 2010, 7, 453–458. [Google Scholar] [CrossRef] [Green Version]
  18. Jakovljevic, D. Serbian and Canadian water quality index of Danube river in Serbia in 2010. J. Geogr. Inst. Jovan Cvijicsasa 2012, 62, 1–18. [Google Scholar] [CrossRef] [Green Version]
  19. Walker, D.; JakovljeviĆ, D.; Savić, D.; Radovanović, M. Multi-criterion water quality analysis of the Danube River in Serbia: A visualisation approach. Water Res. 2015, 79, 158–172. [Google Scholar] [CrossRef]
  20. Josimov-Dunđerski, J.; Savić, R.; Grabić, J.; Blagojević, B. Water quality of the Danube River in the Pannonian part of its flow through Serbia. Letopis Naučnih Radova/Ann. Agron. 2016, 40, 8–14. [Google Scholar]
  21. Mladenović-Ranisavljević, I.I.; Žerajić, S.A. Comparison of different models of water quality index in the assessment of surface water quality. Int. J. Environ. Sci. Technol. 2017, 15, 665–674. [Google Scholar] [CrossRef]
  22. Milijasevic-Joksimovic, D.; Gavrilovic, B.; Lovic-Obradovic, S. Application of the water quality index in the Timok River basin (Serbia). J. Geogr. Inst. Jovan Cvijicsasa 2018, 68, 333–344. [Google Scholar] [CrossRef]
  23. Babić, G.; Vuković, M.; Voza, D.; Takić, L.; Mladenović-Ranisavljević, I. Assessing Surface Water Quality in the Serbian Part of the Tisa River Basin. Pol. J. Environ. Stud. 2019, 28, 4073–4085. [Google Scholar] [CrossRef]
  24. Doderovic, M.; Mijanovic, I.; Buric, D.; Milenkovic, M. Assessment of the water quality in the Moraca River basin (Montenegro) using water quality index. Glas. Srp. Geogr. Drus. 2020, 100, 67–81. [Google Scholar] [CrossRef]
  25. Djurašković, P. Water Quality Index—WQI as Tool of Water Quality Assessment. Available online: http://balwois.com/wp-content/uploads/old_proc/ffp-2026.pdf (accessed on 12 February 2021).
  26. Vukašinović-Pešić, V.; Blagojević, N.; Savić, A.; Tomić, N.; Pešić, V. The Change in the Water Chemistry of the Rivers of Montenegro over a 10-Year Period. In The Handbook of Environmental Chemistry; Springer: Cham, Switzerland, 2019; Volume 93, pp. 83–109. [Google Scholar]
  27. Kolarević, S.; Kračun-Kolarević, M.; Jovanović, J.; Ilić, M.; Paunović, M.; Kostić-Vuković, J.; Martinović, R.; Jokanović, S.; Joksimović, D.; Pešić, V.; et al. Microbiological Water Quality of Rivers in Montenegro. Handb. Environ. Chem. 2019, 93, 135–155. [Google Scholar] [CrossRef]
  28. WHO Regional Office for Europe. Evolution of WHO Air Quality Guidelines: Past, Present and Future; WHO Regional Office for Europe: Copenhagen, Denmark, 2017. [Google Scholar]
  29. Cohen, A.J.; Brauer, M.; Burnett, R.; Anderson, H.R.; Frostad, J.; Estep, K.; Balakrishnan, K.; Brunekreef, B.; Dandona, L.; Dandona, R.; et al. Estimates and 25-year trends of the global burden of disease attributable to ambient air pollution: An analysis of data from the Global Burden of Diseases Study 2015. Lancet 2017, 389, 1907–1918. [Google Scholar] [CrossRef] [Green Version]
  30. Vodonos, A.; Abu Awad, Y.; Schwartz, J. The concentration-response between long-term PM2.5 exposure and mortality; A meta-regression approach. Environ. Res. 2018, 166, 677–689. [Google Scholar] [CrossRef]
  31. WHO. Burden of Disease from Ambient Air Pollution for 2016. Available online: https://www.who.int/airpollution/data/AAP_BoD_results_May2018_final.pdf (accessed on 12 February 2021).
  32. Karagulian, F.; Belis, C.A.; Dora, C.F.C.; Prüss-Ustün, A.M.; Bonjour, S.; Adair-Rohani, H.; Amann, M. Contributions to cities’ ambient particulate matter (PM): A systematic review of local source contributions at global level. Atmos. Environ. 2015, 120, 475–483. [Google Scholar] [CrossRef]
  33. Yang, D.; Ye, C.; Wang, X.; Lu, D.; Xu, J.; Yang, H. Global distribution and evolvement of urbanization and PM2.5 (1998–2015). Atmos. Environ. 2018, 182, 171–178. [Google Scholar] [CrossRef]
  34. Stanojević, G.B.; Miljanović, D.N.; Doljak, D.L.; Ćurčić, N.B.; Radovanović, M.M.; Malinović-Milićević, S.B.; Hauriak, O. Spatio-temporal variability of annual PM2.5 concentrations and population exposure assessment in Serbia for the period 2001-2016. J. Geogr. Inst. Jovan Cvijicsasa 2019, 69, 197–211. [Google Scholar] [CrossRef]
  35. Fuzzi, S.; Baltensperger, U.; Carslaw, K.; Decesari, S.; Van Der Gon, H.D.; Facchini, M.C.; Fowler, D.; Koren, I.; Langford, B.; Lohmann, U.; et al. Particulate matter, air quality and climate: Lessons learned and future needs. Atmos. Chem. Phys. Discuss. 2015, 15, 8217–8299. [Google Scholar] [CrossRef] [Green Version]
  36. European Environmental Agency. Air Quality in Europe—2018 Report. 2018. Available online: https://www.eea.europa.eu/publications/air-quality-in-europe-2018/ (accessed on 12 February 2021).
  37. Vicente, E.; Alves, C. An overview of particulate emissions from residential biomass combustion. Atmos. Res. 2018, 199, 159–185. [Google Scholar] [CrossRef]
  38. Beelen, R.; Hoek, G.; Brandt, P.A.V.D.; Goldbohm, R.A.; Fischer, P.; Schouten, L.J.; Jerrett, M.; Hughes, E.; Armstrong, B.; Brunekreef, B. Long-Term Effects of Traffic-Related Air Pollution on Mortality in a Dutch Cohort (NLCS-AIR Study). Environ. Heal. Perspect. 2008, 116, 196–202. [Google Scholar] [CrossRef] [PubMed]
  39. Samoli, E.; Peng, R.; Ramsay, T.; Pipikou, M.; Touloumi, G.; Dominici, F.; Burnett, R.; Cohen, A.; Krewski, D.; Samet, J.; et al. Acute Effects of Ambient Particulate Matter on Mortality in Europe and North America: Results from the APHENA Study. Environ. Heal. Perspect. 2008, 116, 1480–1486. [Google Scholar] [CrossRef] [Green Version]
  40. Maciejewska, K. Short-term impact of PM2.5, PM10, and PMc on mortality and morbidity in the agglomeration of Warsaw, Poland. Air Qual. Atmos. Health 2020, 13, 659–672. [Google Scholar] [CrossRef]
  41. IARC. Outdoor Air Pollution a Leading Environmental Cause of Cancer Deaths. 2013. Available online: https://www.iarc.who.int/wp-content/uploads/2018/07/pr221_E.pdf (accessed on 20 March 2021).
  42. Osnovni Podaci o Termoelektrani “Pljevlja’’ (Basic Information about Thermal Power Plant “Pljevlja”). Available online: https://www.epcg.com/o-nama/termoelektrana-pljevlja (accessed on 7 January 2021).
  43. MONSTAT. Zavod za Statistiku Crne Gore, MONSTAT (First Results Census of Population, Households and Dwellings in Montenegro). Available online: https://www.monstat.org/userfiles/file/popis2011/saopstenje/knjiga_prvi%20rezultati(1).pdf (accessed on 13 January 2021).
  44. Hrvačević, S. Resursi površinskih voda Crne Gore; Elektroprivreda Crne Gore A.D. Nikšić: Nikšić, Podgorica, 2004; p. 331. [Google Scholar]
  45. Zavod za Hidrometeorlogiju i Seizmologiju Crne Gore (Institute of Hydrometeorology and Seismology of Montenegro.). Godišnji Izvještaji za Period 2011–2018 (Annual Reports for the Period 2011–2018). Available online: http://www.meteo.co.me/ (accessed on 15 January 2021).
  46. Buric, D.; Ducic, V.; Mihajlovic, J. The climate of Montenegro: Modificators and types - part two. Glas. Srp. Geogr. Drus. 2014, 94, 73–90. [Google Scholar] [CrossRef] [Green Version]
  47. Centar za Ekotoksikološka Istraživanja Crne Gore (Center for Eco-Toxicological Research of Montenegro.). Godišnji Izvještaji za Period 2011–2018 (Annual Reports for the Period 2011–2018). Available online: http://mne.ceti.me/ (accessed on 6 March 2021).
  48. Lopes, F.B.; Teixeira, A.S.; Andrade, E.M.; Aquino, D.N.; Araújo, L.F.P. Mapa da qualidade das águas do rio Acaraú, pelo emprego do IQA e Geoprocessamento (Map of Acaraú River water quality by the use of WQI and GIS.). Revista Ciência Agronômica 2008, 39, 392–402. [Google Scholar]
  49. Hurley, T.; Sadiq, R.; Mazumder, A. Adaptation and evaluation of the Canadian Council of Ministers of the Environment Water Quality Index (CCME WQI) for use as an effective tool to characterize drinking source water quality. Water Res. 2012, 46, 3544–3552. [Google Scholar] [CrossRef]
  50. Garcia, C.A.B.; Silva, I.S.; Mendonça, M.C.S.; Garcia, H.L. Evaluation of Water Quality Indices: Use, Evolution and Future Perspectives. Adv. Environ. Monit. Assess. 2019, 18. [Google Scholar] [CrossRef] [Green Version]
  51. Hernea, C.; Teche-Constantinescu, A.M. Variability of groundwater quality parameters from periurban area of Timisoara (Romania). J. Environ. Prot. Ecol. 2013, 14, 64–70. [Google Scholar]
  52. Lumb, A.; Sharma, T.C.; Bibeault, J.-F. A Review of Genesis and Evolution of Water Quality Index (WQI) and Some Future Directions. Water Qual. Expo. Health 2011, 3, 11–24. [Google Scholar] [CrossRef]
  53. EU. Directive on Ambient Air Quality and Cleaner Air for Europe. Available online: https://eur-lex.europa.eu/legal-content/EN/TXT/PDF/?uri=CELEX:32008L0050&from (accessed on 10 March 2021).
  54. WHO. Ambient (Outdoor) Air Pollution. Available online: www.who.int/mediacentre/factsheets/fs313/en/index.html (accessed on 6 March 2021).
  55. Burić, D.; Stanojević, G. Trends and possible causes of cloudiness variability in Montenegro in the period 1961–2017. Clim. Res. 2020, 81, 187–205. [Google Scholar] [CrossRef]
  56. Ministarstvo Održivog Razvoja i Turizma Crne Gore (Ministry of Sustainable Development and Tourism of Montenegro.). Nacionalna Strategija Upravljanja Kvalitetom Vazduha sa Akcionim Planom za Period 2013–2016. (National Air Quality Management Strategy with Action Plan for the Period 2013–2016). Available online: https:///Nacionalna%20strategija%20upravljanja%20kvalitetom%20vazduha%20sa%20Akcionim%20planom.pdf (accessed on 11 March 2021).
Figure 1. Position of Montenegro (MNE) on the Balkan Peninsula and the studied area in MNE.
Sustainability 13 05229 g001
Figure 2. Classification of surface water quality by the water quality index method.
Sustainability 13 05229 g002
Figure 3. Average annual WQI values at measuring stations for the period 2011–2018.
Sustainability 13 05229 g003
Figure 4. Annual (left) and seasonal (right) mean values of PM10 in Pljevlja (2011–2018).
Sustainability 13 05229 g004
Figure 5. Annual number of days with daily mean concentration of PM10 particles > 50 µg/m3.
Sustainability 13 05229 g005
Table 1. Mean annual values of WQI, trend of WQI of the river Ćehotina and its tributary Vezišnica, correlation of WQI with precipitation (P) and temperature (T) for the period 2011–2018.
RiverHydrological StationMean Annual Values of WQITrend (WQI/year)Correlation
20112012201320142015201620172018WQI-PWQI-T
ĆehotinaRabitlja90689090928986940.140.100.36
ĆehotinaBelow Pljevlja59746068566646680.170.600.25
ĆehotinaBelow firth of Vezišnica64725965596844740.190.490.19
ĆehotinaGradac7578737582715372−1.130.01−0.26
VezišnicaFirth Vezišnica77776473717967780.000.17−0.12
Table 2. Limit values of PM10 particles according to Montenegrin legislation, based on EU directives and WHO recommendations.
ParameterLimit ValueTolerance Limit
Daily mean (PM10) 50 µg/m3 35 times per year
Annual mean (PM10) 40 µg/m3 /
Table 3. Trend of average seasonal and annual values of PM10 particles (µg/m3/year) and correlation coefficients (C) of PM10 with precipitation (P) and temperature (T).
ParameterWinterSpringSummerAutumnAnnual
Trend PM10 0.45 −2.82 * −1.29 −4.56 ** −3.88 *
C (PM10 and P) −0.51 0.20 −0.76 * −0.54 −0.48
C (PM10 and T) 0.04 −0.89 ** 0.23 −0.33 −0.87 **
Significance: * p < 0.05 and ** p < 0.01.
Publisher’s Note: MDPI stays neutral with regard to jurisdictional claims in published maps and institutional affiliations.

