Abstract
The concept of a zero energy building is a significant sustainable strategy to reduce greenhouse gas emissions. The challenges of zero energy building (ZEB) achievement in Thailand are that the design approach to reach ZEB in office buildings is unclear and inconsistent. In addition, its implementation requires a relatively high investment cost. This study proposes a guideline for cost-optimal design to achieve the ZEB for three representative six-story office buildings in hot and humid Thailand. The energy simulations of envelope designs incorporating high-efficiency systems are carried out using eQuest and daylighting simulation using DIALux evo. The final energy consumptions meet the national ZEB target but are higher than the rooftop PV generation. To reduce such an energy gap, the ratios of building height to width are proposed. The cost-benefit of investment in ZEB projects provides IRRs ranging from 10.73 to 13.85%, with payback periods of 7.2 to 8.5 years. The energy savings from the proposed designs account for 79.2 to 81.6% of the on-site energy use. The investment of high-performance glazed-windows in the small office buildings is unprofitable (NPVs = −14.77–−46.01). These research results could help architects and engineers identify the influential parameters and significant considerations for the ZEB design. Strategies and technical support to improve energy performance in large and mid-rise buildings towards ZEB goals associated with the high investment cost need future investigations.
1. Introduction
Continuously rising global energy demand is a serious concern in several countries. In Thailand, the final energy consumption in the building sector accounts for 23% of the national energy consumption [1]. Without energy conservation control, energy consumption in the commercial sector will suddenly increase and be higher than in other sectors. Such an increment of energy demand will make the country face energy shortages, high energy prices, and an increase in pollutants and CO2 emissions. Regarding this concern, the Department of Energy of Thailand has enforced the Energy Conservation Promotion Act and Building Energy Code (BEC) for promoting energy reduction in commercial and residential buildings. In addition, three higher energy efficiency standards were defined in the Thailand 20-Year Energy Efficiency Development Plan (2011–2030) to lessen the final energy use by 17% in 2030 [2]. These standards comprise (1) higher energy performance standard level (HEPS), (2) economic level (ECON), and (3) zero energy buildings level (ZEB), with the aim being to reach the ZEB in 2037.
Achieving greater energy efficiency for HEPS and ECON levels can be done using a higher energy-efficiency building envelope, including air-conditioning and ventilation systems, office equipment, and lighting systems. ZEB refers to the building that can produce renewable energy on-site, equal to the total amount of energy used by the building [3,4]. According to the APEC Nearly (Net) Zero Energy Building Roadmap, several countries set a plan and energy strategies to achieve ZEB in the next 10–20 years. However, several projects in Europe, the United States, and China have achieved net-zero consumption, due to rapid development in building materials and technologies. Ref. [5] revealed that the implementation of ZEB in developing countries still requires hard efforts. It requires high investment costs, and there is a lack of personal capability in ZEB design. Consequently, the development of design strategies promoting ZEB in Thailand should be examined to enhance the national savings goal.
1.1. Current Situation of ZEB Development in Thailand
Bangkok, Thailand, has a hot and humid air-condition above thermal comfort conditions almost all year. Air conditioning units are necessary and widely used in most office buildings, and the cooling energy demand takes a large portion of total energy use. To achieve the ZEB design will require a huge renewable energy production capacity to meet the balance of such high cooling demand. As reviewed from the ZEB projects, the number of buildings successfully achieving ZEB in Thailand is small. Most are small government and academic buildings with 2–3 stories with a gross floor area lower than 10,000 m2 [6,7,8,9]. Ref. [9] showed that a replacement of fluorescent lamps with LED, using high efficiency air-conditioners and energy-star computers could significantly reduce the energy use and make the buildings zero consumption. Later, the Department of Alternative Energy Development and Efficiency (DEDE) [10] proposed a guideline for the ZEB design of a small office building with six stories. The final energy use showed 59.08 kWh/m2–year, near the national ZEB goal of 57 kWh/m2–year. In this project, renewable energy generation accounted for 91.1% of the total energy demand. Ref. [11] investigated the potential energy production from the rooftop PV system to match with the energy demand of small and large office buildings. From their study, a ratio of PV power generation to the energy use of office buildings was relatively small when compared to the residential buildings, owing to the limited roof area.
According to the comprehensive review by [6,12], several studies have investigated and proposed the ZEB design for residential buildings and low-rise small office buildings. Their effort successfully changes those buildings to net-zero consumption ahead of the national plan. However, there is a knowledge gap and lack of guidelines for ZEB design for medium and large buildings. Furthermore, high investment cost from advanced designs and technologies is a significant barrier for the ZEB development in Thailand. Consequently, the efficiency measures associated with feasibility analysis should be carried out to define the best practices to reach the ZEB goal.
1.2. A Review of Design Measures and Strategies to Achieve the ZEB Goal
The design concept for ZEB is to reduce the building’s energy demand as much as possible; then, renewable energy generation is provided to meet the energy balance. From previous works, several energy-efficiency designs through passive and active strategies have been proposed under different contexts.
Through passive techniques, natural ventilation is a crucial design for cooling energy reduction. Ref. [13] investigated a potential use of naturally ventilated office buildings in three cities in hot and humid summer zones to evaluate thermal comfort and cooling energy savings. The use of natural airflow could provide a maximum savings potential of 30%. However, the benefit of natural ventilation is limited for office buildings in hot and humid conditions. The challenge of using this technique has to deal with human thermal comfort.
Another passive design approach typically used in most ZEB projects is to minimize heat gain through the envelope via increasing thermal insulation. Several works have been evaluated combined strategies to improve building envelope performance. Ref. [5] did a comprehensive review of current developments and technologies in 34 NZEB projects in hot and humid regions. It was found that an average u-value of walls and windows in nearly zero energy building (NZEB) and ZEB projects in China, Canada, the Republic of Korea, and the United States had higher performance than that required by ASHRAE 90.1 [5,14]. Several studies examined the impact of envelope designs and retrofits, including wall insulation, type of glazed window, solar shading, and envelope’s airtightness, on the building energy reduction [15,16,17,18,19]. The improvement in wall insulation and high-performance glazed windows could save energy from 5 to 33%, depending on climates. Ref. [15] examined the close relationship of the effect of envelope retrofits in existing buildings to improve energy performance and thermal comfort in educational buildings in Egypt’s hot arid climate. The study revealed that the average energy savings obtained from the simple envelope-retrofit strategies were 33%. A significant reduction of up to 23% occurred when applied solar shading followed by the glazed window. Wall insulation had a small effect on energy reduction. Furthermore, light-colored external surfaces were used to reflect the solar heat [20,21]. Ref. [21] compared the impact of two different wall colors on the thermal comfort and energy efficiency of buildings in a hot and arid climate. The light wall-painted color with high solar reflection could reduce external surface temperature by 24.5%, and the heating demand was decreased by 3.86% in the cold season.
Lessening the window to wall ratio (WWR) could significantly reduce heat gain through the windows [5,22]. Ref. [19] investigated the combinations of building envelope designs, including WWRs, materials, and shading devices to make the four-story office buildings in Brazil achieve a net-zero energy target. Reducing WWR from 80% to 50% and 30% could make the building achieve the ZEB goal. However, this reduction could lower daylighting benefits and make office space feel small. Maximizing energy-savings and daylighting performance, optimal WWRs with shading devices in different orientations were carried out in previous works [23,24]. Shading devices are another design feature that prevents the envelope from being directly exposed to solar heat and has made significant savings by 12% [17,25].
Reducing the envelope area exposed to the solar heat can be done by geometry design with the building orientation. Ref. [26] investigated the cooling energy consumptions in eight geometries of residential buildings for four building orientations. The studied buildings are located in Bangkok neighborhood areas. The tall with a rectangular-shaped building were more energy efficient than the low-rise square-shaped buildings, owing to that they had the less “surface-to-volume ratio” (S/V). As similar to other investigations [27,28], the small building with a large ratio of envelope surface area to the building volume (S/V) shows less energy efficiency than that of the large building. For an energy-efficiency design concept, a small envelope area of the building should be oriented to the E-W axis to minimize the solar heat gain.
Regarding active strategies, high-performance lighting systems, such as cost-effective light-emitting diode (LED) light bulbs and integrated lighting systems with occupancy-based control, are implemented in ZEB projects [18,29,30]. Besides the lighting system, a significant reduction occurs when using high energy-efficient ventilation strategies. For example, high energy efficiency ratio (EER), heat and energy recovery ventilators (HRV, ERV), variable air volume (VAV), and variable refrigerant flow (VRF) systems were designed and implemented in ZEB projects [31,32,33]. Designs with a high-efficiency air-conditioning system could considerably reduce heating and cooling demand by 12–60% [31,33].
Solar power generated from rooftop PV systems is the most common and widely used for buildings’ primary energy sources. Ref. [5] reviewed the ZEB implementation in 34 office buildings and found that low-rise buildings could reach the ZEB goal. The maximum building height in ZEB projects was four–five stories [5,17]. The implementation of ZEB in medium and large buildings has a limit of PV energy generation, which could not cover a whole building’s energy consumption. Several works [34,35,36] investigated the potential increment of solar electricity production with an integrated façade PV and the rooftop system. Optimal designs of a building’s geometry were examined for the electricity production potential from façade PV installation as seen in [35,37]. Besides the limited installation area, weather conditions, surrounding environment, and building geometry related to its orientation also affect the PV production capacity [22,37,38,39]. Consequently, these topics should be considered at the initial design stage.
1.3. Cost-Benefit Analysis in Energy Efficiency Buildings
All the ZEB projects have to deal with the high investment cost. Several financial perspectives have been used to assess ZEB design’s proper measures, which provides the lowest investment cost, while shows high energy performance. The building’s lifetime commonly used in economic evaluation ranges from 20 to 30 years [40]. Most studies considered microeconomic level in the financial perspectives, including interest rate, incentives, and taxes, but not accounting for the cost of emission from environmental impacts [40]. Economic evaluation approaches, such as Net Present Value (NPV), Internal Rate of Return (IRR), and discounted payback period (DPB), have been used to perform a cost-benefit analysis of the investment in energy-efficient buildings [41].
Ref. [41] performed a comprehensive retrofit of building skins and open heating pipe network for improving the energy efficiency of four apartment buildings in Beijing, China. The actual energy savings and associated benefits were calculated using two indices: payback period (Pt) and IRR for the financial assessment. The study revealed that heating system retrofit was more cost-effective (IRR = 59%, Pt = 1.7 year) than envelope retrofit (IRR = −3.06%, Pt = 28.2 year). The improvement of external walls was more cost-effective than that of external windows, due to the high investment cost of the window frame’s material. Ref. [42] investigated cost-optimal solution achieving ZEB in an Estonian office building for a 20-year period using the investment cost and NPV. The study showed that the cost-optimal level, representing minimal life cycle cost, occurred in the low building energy demand (≤130 kWh/m2) via smaller WWRs, high-performance glazed windows, and insulated walls. However, the zero energy building (≤100 kWh/m2) was not cost-optimal in that current economic situation. They suggested that the improvement of such a high-performance façade would possibly achieve the ZEB if the escalation of energy cost and construction cost decreased in the future. The use of IRR alone is not recommended because this indicator could help decision-makers measure and rank the project’s profitability when the capital budgets are limited.
The cost-optimal analyses have been used to examine the energy-efficiency measures in nearly and net-zero projects. Ref. [43] did a comprehensive review of cost-optimal analyses in nearly zero projects. Many alternative designs could provide the accuracy of effective solutions than the limited number of design measures. However, it requires computational time and effort. A multi-stage optimization could offer more time efficiency. Ref. [44] developed three-stage optimization to evaluate alternative measures, including building-envelope parameters, heating and cooling systems, and PV solar and thermal systems towards ZEB for a residential building. They presented that low thermal insulation levels, including shading, building tightness, operable windows when the cool air outside, were the cost-optimal solutions for a residential building in Finland in summer. The mechanical system was not the optimal option, due to its high initial cost and operation and maintenance costs. In contrast, Ref. [45] revealed that high-performance envelope design, accounting WWRs, window orientation, and width-to-depth ratio were not the cost-optimal solution in a cold climate. Later, Ref. [46] identified the optimal solutions of 13,456 designs, including building envelope and heating system options, for building energy performance via using CO2-eq emissions and discounted payback period. The study revealed that the heating energy source was a significant parameter influencing the CO2-eq emissions reduction and the payback period.
According to the reviews, the proposed effective designs from cost-benefit and optimal analysis serve different purposes and building performances, depending on design assumptions, building functions, building operation, and climate. These proposed solutions might not directly implement for the ZEB design in Thailand.
1.4. Research Gap and Objective
The limitation of ZEB design guidelines and high investment cost are significant barriers for the ZEB development in Thailand. This study tries to fill the current knowledge gap on how to design the new buildings in Thailand to achieve the ZEB by integrating the on-site renewable energy source. Firstly, the study investigates energy savings potential when different energy-efficient approaches are developed. The final energy use for each design measure is compared to the on-site energy production from the rooftop PV system. Then, economic evaluation and optimal energy-efficiency level are used to examine the best design solutions. Finally, the significant design parameters and current challenges from this research are discussed, and recommendations are provided for future studies. This research could provide the guidelines and best practices for the new construction buildings to help architects and engineers design zero-energy office buildings on different scales.
2. Materials and Methods
This research framework is comprised of four parts, as shown in Figure 1. The study provides the methods to select the three representative office buildings as case studies. In addition, the design strategies for passive and active approaches are reviewed to define the studied parameters for improving the buildings to reach the ZEB goal. Daylighting performances from improvement in envelope designs are carried out to design the artificial lighting in office space. Then, the energy analysis of each design step is calculated.
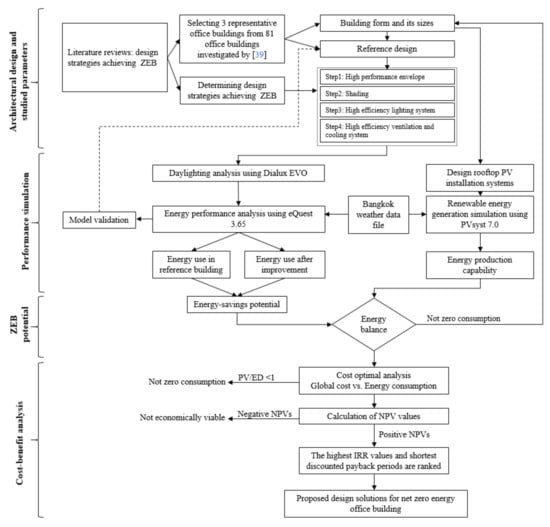
Figure 1.
Research framework.
Meanwhile, the rooftop PV installations in different orientations are designed, and the PV energy production of each scenario is calculated. The energy-savings potentials are then compared to the energy generation from the rooftop PV system to evaluate the potential to become the ZEB goal. For the nearly zero energy consumption, the building geometry, especially a ratio of rooftop area and building height, is adjusted to increase sufficient PV energy generation. When the building achieves the ZEB, the investment cost and energy savings of several design measures are compared. The optimal points as comparable to IRR and DPB are used to propose the best practice for ZEB in suburban areas of Bangkok, Thailand.
2.1. Overview of Case-Studies Selection
2.1.1. Site Selection
The studied location is in suburban areas of Bangkok (the shaded-gray area), Thailand, which has low-rise academics, offices, and residential buildings, as shown in Figure 2. The weather of Bangkok is hot, and rain falls almost all year, even in the winter. Table 1 presents the weather conditions, including air temperature, relative humidity, mean velocity, and mean global solar radiation.
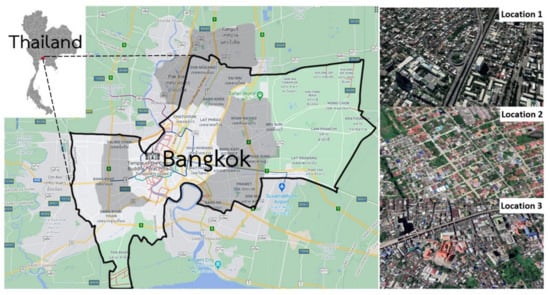
Figure 2.
Studied location in suburban areas of Bangkok (shaded-gray area).

Table 1.
The weather condition of Bangkok/Don Muang, Thailand.
2.1.2. Define the Reference Buildings and Model Setting
In this study, the new construction buildings are used as reference buildings. The modeled building sizes include three scales: small (5000 m2), medium (15,000 m2), and large (32,500 m2), which these sizes were the mode values observed from 81 office buildings in Bangkok areas investigated from [39]. All reference buildings have a square shape (1:1) since it allows the least heat transfer through the building’s envelope compared to the rectangular-shaped building [26,28]. Each building has a service core at the center, surrounded by the open-plan office space, which the ratio of office space accounts for 80% of the gross floor area, as presented in Figure 3. Three reference buildings have six stories (21 m height) with 3m floor-to-ceiling panels. In order to define the materials used for design newly constructed buildings (reference buildings), the study did a few surveys and collected the data of envelope designs, typically found in existing buildings, from different sources, which were mainly from previous studies [5,39,43,47,48] and manufacturing data. The variation of WWRs of three reference buildings ranging from 20 to 80% without external shading devices. In this design, the lighting power density (LPD) has to be below the maximum allowance of 14 W/m2 as defined by the previous version of Ministerial Regulation Prescribing Type or Size of Building and Standard, Criteria, and Procedure in Designing Building for Energy Conservation BE 2552 [49]. Unavailable data, such as material reflectance and absorption values, air infiltration, and set-point temperature, use the default values provided in the energy model. Table 2 provides detailed information on the building’s construction, materials, and systems, which all will be implemented in three reference buildings.
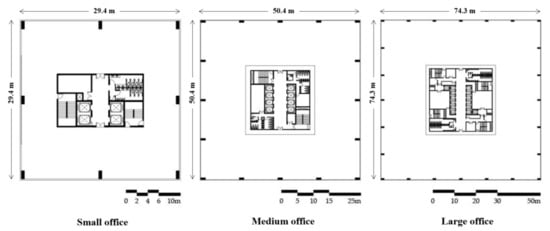
Figure 3.
The layout of the representative small, medium, and large office buildings.
Table 2.
Information of constructions, material properties, and systems used for the reference buildings.
2.2. Design Approaches towards ZEB
Two passive design techniques are integrated with two energy-efficiency systems to achieve the ZEB in the office building. This study tries to make significant energy reduction through passive approaches via using relative high-performance materials as much as possible. Then energy-efficient lighting and mechanical systems are implemented to increase more energy savings. The building materials and systems (shown in Table 3) are based on the recommended designs applied in the applicable energy-efficiency levels recommended by [50]. The first step is to reduce heat gain through windows and walls. Two glazed materials: green insulated glazed windows and the high-performance glazed windows with triple tinted glazing with Low-E film are used. The walls are treated with high thermal performance insulation, which has u-values of 0.13 and 0.24 W/m2K and solar absorptance of 0.5. The horizontal shading with 2 m in length is installed to prevent solar heat at the second step.
Table 3.
Passive and active design approaches towards ZEB.
For the active approach (Step 3 and 4), LED light bulbs (LPD of 5 W/m2) used in [51] are used for energy-efficient lighting systems in Step 3. For an energy-efficient cooling system (Step 4), the air conditioning unit in small and medium buildings is a split-type system and a central air conditioning unit for the large building. An inverter air conditioning system with a seasonal energy efficiency ratio (SEER) of 20.85 is chosen. The air temperature set-point of all energy-efficiency measures is 25.5 °C, which could provide comfortable conditions in office space. The split-type system installs evaporative pre-cooling at the air condenser side.
The energy reduction from each design measure is compared and used to access the significant design parameters on the ZEB. After applying all measures, the final energy consumptions are compared to the national ZEB goal and the actual rooftop PV energy generation capacity. If the final energy shows nearly zero consumption, the building height is decreased to increase the rooftop area for the PV installation. The energy production of the rooftop PV cell area is recalculated to assess the potential production capacity. A recommendation for the geometry of three-building scales achieving the ZEB is then used for the cost analysis.
2.3. Building Performance Simulation
2.3.1. Simulation of Lighting and Energy Performance
The variations in the design of WWRs, glass materials, and shading lengths could affect the lighting performance in office space. The small windows could reduce the amount of heat transfer through the glazed areas. However, it also lessens the benefit of natural light. Ref. [54] reviewed several indicators widely used to perform daylight simulation in Thailand. In this study, the static method is used. To maintain the illuminance level of 500 lx at the working plane as defined by the International Commission on Illumination (CIE), artificial light is designed in the office space to fulfill this requirement. However, Thailand’s building energy code [50] defines the lighting power density (LPD) not exceed 14 W/m2. Consequently, the design needs to compromise between lighting quality and energy efficiency.
The study uses DIALux evo software, developed by the German Institute for Applied Lighting Technology (DIAL), to perform daylight and artificial light in office space at 1 m high. The installation height of the artificial light lamps is 3 m. It is assumed that the simulation is performed under partly cloudy sky conditions. The reflectivity of wall and ceiling materials is 70%. The floor material has a reflectivity of 30%.
In the first two steps of energy-efficiency measures, the artificial light uses fluorescent lamps. In Step 3, considering more energy efficiency, the light lamps are replaced by the 16 watts LED T5. In the calculation process, the DAILux evo automatically arranges the lightbulb lamps, as shown in Figure 4a, and provides the results of illuminance levels in the working area (Figure 4b). However, some working areas show higher and lower illuminance levels. Consequently, the distance between the lamps and the lamp’s directions is manually adjusted to keep the illuminance level and LPD within the standard requirements. The calculated LPDs obtained from the lighting simulation are then used to calculate the investment cost.
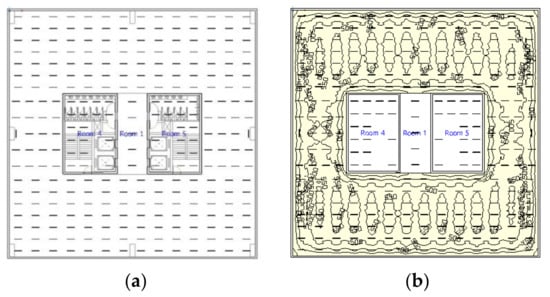
Figure 4.
(a) The planning layout of artificial light in office space. (b) A simulation of illuminance level at working plane using DIALux evo.
The energy consumption of the reference buildings, for typical construction and high energy-efficiency buildings, is calculated using eQuest 3.65 [55]. This energy model is widely used and can provide reliable results for building energy analysis. The energy simulation is performed under Bangkok/Don Muang weather station (13.913° N, 100.607° E). The model settings of the three reference buildings and higher-performance energy-efficient buildings are presented in Table 4 and Table 5, respectively. Figure 5 presents an example of the model buildings in the energy model. The energy simulation is performed in the lower neighborhood building density and low-rise constructions. Consequently, it does not account for the shading effect from trees and nearby buildings.
Table 4.
Investment cost of building materials and systems.
Table 5.
Calculations of energy production from rooftop PV systems facing different orientations.
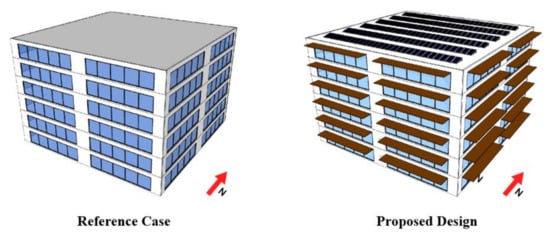
Figure 5.
Design characteristic of the reference office building and proposed design in the energy modeling.
2.3.2. Model Validation
Before evaluating the energy savings potential of different energy-efficiency measures, it is necessary to evaluate how the model setting is reliable for further predicting energy results as similar to those consumptions of the actual buildings. In previous work, Ref. [39] collected electricity bills from 81 office buildings in Bangkok areas. From their investigations, the total energy consumption in 81 office buildings ranged from 0.1 to 2.5 GWh/year (an average value of 0.5 GWh). The average energy use intensity (EUI) was 145 kWh/m2–year. The relationship between the building areas and energy consumptions is plotted to generate the predicted energy trend line. In this study, the occupancy load patterns are adjusted in the energy model in the calibration process. The simulated energy results of the three reference buildings, as in the existing designs, are compared with the predicted trend line established by previous works [39] using Equation (1).
However, the percentage error might not be the best indicator to measure the agreement between the simulation results and actual data. ASHRAE guideline 14 provides a calibration standard with several metrics for hourly and monthly calibrations. Two indices: Normalized Mean Bias Error (NMBE) (in Equation (2) and Coefficient of Variation of the Root Mean Square Error (CV(RMSE) (in Equation (3)), are widely used in energy model and optimization-based calibration as mentioned in [56]. Ref. [56] tested sixty optimization-based calibration approaches to assess the accuracy of the energy model using single-error functions and a combination of different error functions. The study revealed that NME, CV(RMSE), R2, Cχ2 could provide the model accuracy with the weekly and monthly dataset sizes of heating and cooling demand. The study revealed the limitations of the NMBE function and its relatively high errors for optimization-based calibration. Ref. [57] recommended not to use NMBE alone since this index depends on the cancellation errors.
To ensure that the energy model has a proper setting, as defined by the calibration standard, the study compares the simulation results (si) with the energy auditing data (mi) in a medium building investigated by [58]. The NMBE and CV(RMSE) are used as the calibration indices. The comparison is on a monthly basis, since we had only access to this data availability. In the equation, represents the number of data points, and is the number of parameters.
2.3.3. Renewable Energy Generation from the Rooftop PV Panels
Thailand is located 15 degrees above the equator, with high solar irradiation in the northeast and central parts [59]. The average global solar irradiation ranges from 4.7 to 5 kWh/m2–day, with a peak of 6.7 kWh/m2–day occurring in April. The average power potential from PV panels in this area was 1450 kWh/kWp [60,61].
Previous works [52,53] compared the potential of energy production of different PV cells for the rooftop installation systems. They recommended that the monocrystalline silicon solar cell could provide the maximum power production, while requiring less installation area than other types for the current economic solution. The lifespan is greater than 30 years; however, its cost is relatively high. Consequently, this study used a monocrystalline silicon solar cell because it could provide the highest capacity (250 Wp/cell).
This study assumes that the rooftop of small and medium office buildings is not available for use. The buildings have an underground water tank, and the supplied water is fed up to the occupied floors, and the machine-room-less elevator. elevators are machine rooms. The outside air condensing units are installed at a building’s sidewalls. For the large office building, 19% of the rooftop area prepares for a cooling tower installation, significantly reducing the number of PV panels installation.
The PV facing orientation is another important factor for solar power generation. In Thailand, the solar path moves towards the south for most of the year. Consequently, the planning layout of PV panels on the rooftop is arranged in five directions: E, W, S, SE, and SW, which could take maximum solar power from the south. The arrangement of the PV panels avoids shades from nearby PV panels, sidewalls, and existing A/C systems. The minimum space between the PV panels is 0.15 m and 2 m from the sidewalls. The tilt angle of the PV panels, which could provide maximum power capacity for Thailand, is 15 degrees [62]. The study uses PVSyst 7.0 software, widely and acceptably used for sizing, designing PV panels, and calculating PV energy generation. The calculation of PV panels installation at the rooftop of the small, medium, and large buildings with six stories are 384, 1296, and 2380 panels, respectively. The simulation does not account for the effect of nearby building’s shades and the effect of hot air on the energy production capacity. The performance ratio, representing actual to theoretical energy output from the PV system, ranges from 76.8 to 80.5%. The solar power simulation is performed under 10-year average weather conditions (2010–2020).
2.4. Cost-Benefit and Feasibility Analyses
In this section, the study aims to assess the cost-benefits of ZEB designs compared to the reference cases. The second purpose is to examine the alternative design solutions achieving the ZEB.
Ref. [43] did a comprehensive review of cost-optimal analyses in nearly zero projects and classified the optimal approaches into two groups. The manual method is the simple technique typically used with a few data of design measures. The more accurate approach is the simulated-based optimization method, in which the optimization algorithms for global cost minimization are performed using simulation software. The number of energy-efficiency measures for the simple manual approach was less than ten packages, and it could be up to 1000 packages. In comparison, the energy-efficiency measures analyzed in the simulated-base optimization method were more than 5000 packages. With this limited input data used in the manual approach, the cost optimization could show an error owing that the prediction does not cover all the designs in existing building retrofits. To reduce such an error, the use of presence design of existing-retrofit conditions is recommended. The plots of global costs and energy use intensity are widely used in the cost-optimal analysis to examine the lowest point, providing the minimum investment cost, while presenting high energy performance. In this study, the global cost of different design measures, including the rooftop PV system, accounting for the inflation rate, interest rate, and the escalation of energy cost, is calculated using Equation (4), defined by the Department of Alternative Energy Development and Efficiency, Ministry of Energy [63]. In the equation, is the initial investment cost. represents the replacement and operation cost for each component at the year . is the interest rate and is calculated using Equation (5), where is the costs at starting year 0. represents the discount rate, which this study uses 3% based on Thailand’s market prices, and the present energy cost is 0.13 USD/kWh. is the year of analysis. In this study, the period of analysis (n) is 20 years.
The calculated global cost in a unit of USD/m2 and energy consumption in different energy-efficiency measures are plotted and compared. In this study, the lowest point of the curve shows the optimal energy level that can be used for design decisions. Furthermore, The NPV (in Equation (6)) is used to filter out the economic solutions and examine projected investment opportunities. Negative NPV represents that investment is not attractive because its return is less than the present value of the project’s assets. It could be found that the cost-optimal measures might not provide benefits regarding better outside views and architectural aesthetics. Therefore, the calculated IRRs and discounted payback periods (DPB) are ranked to examine the alternative solutions, which provide a similar cost-benefit. The IRR is the discount rate that the project’s NPV equals zero, calculated using Equation (7). The design measures with higher IRR, representing the good investment, and the shorter discounted payback period (calculated using Equation (8))
where is the cash flow period in year and is the initial cost at year 0.
Table 4 provides the costs, including initial investment accounting for installation, replacement, maintenance and operation, and resident value of each design measure. The costs are based on Thailand’s market 2020 prices. It is assumed that, within the calculation period (20 years), there is no replacement for the building’s envelope components. The replacement of LED light bulbs and ventilation fans occurs every five years and ten years, respectively.
3. Results
In this section, the validation results and energy consumption of three reference buildings are presented. The energy-savings potentials of four design strategies are compared with the on-site PV energy generation, and the economic feasibility analyses are carried out. Finally, the limitations are discussed, and practical solutions for the ZEB design in Thai office buildings are proposed.
3.1. Energy Consumption in Reference Buildings and Model Validation
Before energy efficiency measures are implemented, the final energy consumptions of three reference buildings with applied different WWRs are carried out. The large buildings have the lowest energy use intensity ranging from 121.3 to 135.0 kWh/m2–year, followed by the medium building (125.0–137.8 kWh/m2–year) and small building (132.8–150.4 kWh/m2–year), as presented in Figure 6. All are site energy use with electricity purchased from the grid. For the model verification, the simulation results were relatively close to the trend line observed by [39]. The variance of errors ranges from 0.1 to 0.6%. Furthermore, the calculations of energy use in the model building are compared with the previous investigation [58]. The NMBE and CV (RMSE) show 4.3% and 14.7%, respectively, which are within the acceptable ranges (±5% for NMBE and ±15% for CV (RMSE)), as defined by ASHRAE 14-2002.
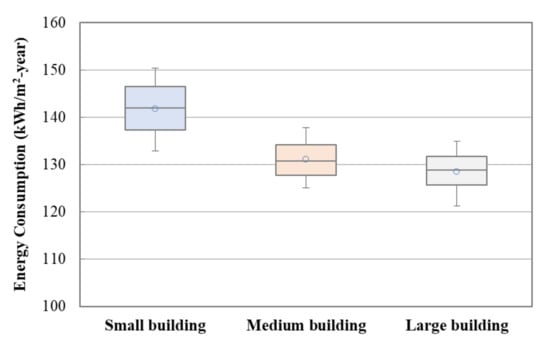
Figure 6.
Distributions of the site energy consumptions in three reference buildings.
3.2. Energy-Savings Potential and Power Generation from PV Panels
The on-site energy consumptions in the three reference buildings are mainly from the cooling load, accounting for 47–51%, followed by equipment load of 24–26%, and lighting load of 25–27% (shown in Figure 7). Regarding energy savings from passive design strategies, using the building envelope with high-performance windows and installation of wall insulation (Step 1) could reduce the cooling energy by an average of 12.4–15.1% from the on-site energy demand. The standard deviation (s.d.) of the savings, varying depending on WWRs, is 2.3. In Step 2, installed horizontal shading devices could slightly save the cooling energy by approximately 2.7% (s.d. = 1.1). From our investigation, the design through passive strategies alone could reach the HEPS level’s savings target. As expected by [2], the improvement shows that this saving level could be achieved via using the current technology.
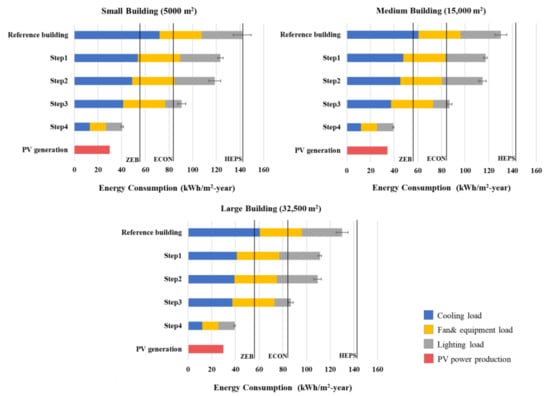
Figure 7.
Annual energy consumptions after implemented the highest performance measures compared to the on-site rooftop PV power production. The error bar represents the variations of energy demands varied depending on WWRs.
Significant energy reduction occurs when implementing active strategies. Replacing LED light bulbs (Step 3) could reduce the building’s energy use to 82 kWh/m2–year, close to the ECON level, which requires more energy-efficiency technologies and cost-effective systems. The savings level from changing the light bulbs accounted for 22.7% (s.d. = 1.9) of the energy use in reference buildings. High-performance air-conditioning systems with higher SEER could considerably decrease the energy use from Step 3 by 54.9% (s.d. = 0.4). A considerable reduction of 61–68% occurs in cooling load and fan and equipment load. Consequently, a combination of all design measures could reduce the total energy use to 38–40 kWh/m2–year, achieving the national energy efficiency goal of 57 kWh/m2–year for ZEB. The percentage savings account for 76.7–82.7% of the on-site energy use, considered a deep implementing level [64].
EPPO [2] defines the ZEB that the building consumes very low energy consumption, and the on-site energy generation is supplied from the renewable energy source. Then the PV power generation capacity needs to be accounted for in this savings level. From the solar power calculation, the maximum generation capacity occurs in those oriented to the west direction, shown in Table 5. The medium building could generate more capacity than the large building because the rooftop of the large building containing a cooling tower.
In Table 6, considering a relationship between the on-site energy generation from the rooftop PV system and final energy use, the PV production capacity of three buildings accounted for 64.5–83% of the final energy use. After deducting the on-site energy generation from the PV system, the final on-site energy demands range from 6.5 to 14.2 kWh/m2–year. Consequently, the actual performance could not reach the ZEB even though the building’s energy consumption lowers the national savings target. So, those energy performances are considered nearly zero consumption.
Table 6.
A comparison of final on-site energy consumption and on-site energy production from the rooftop PV system.
Figure 8 presents monthly energy consumption profiles in different design strategies and the rooftop PV power production profiles. The highest energy consumption occurs in the summer and rainy seasons (April to October), with a peak in April, due to high cooling demand in the hottest conditions. The lowest consumption occurs in November. Regarding the PV energy production, the high generating capacity occurs from November to March. An achievement of ZEB is found only in medium buildings, especially in November, when the PV production could equal the energy demand. The performance becomes nearly zero consumption in February and March. However, it is difficult to achieve the ZEB in the rainy season, where the PV production capacity is relatively low under cloudy sky conditions. Given opportunities to increase energy savings during this period, potential reductions from implementing other energy-efficiency measures, such as building operation to reduce the cooling energy demand, should be considered.
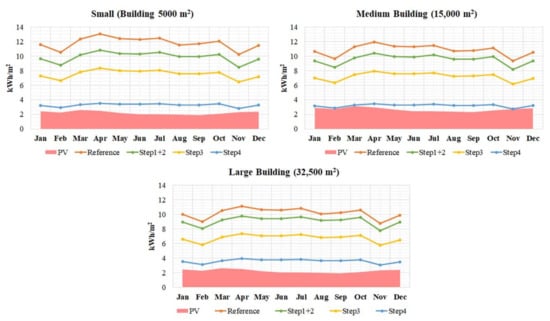
Figure 8.
A comparison between monthly energy consumption profiles and PV power generation profiles in three different building scales.
3.3. Building Geometry Design for ZEB in Thai Office Buildings
As presented before, the final energy consumptions of the six-story building do not reach the ZEB, due to low PV production capacity and inadequate installation area. In examining appropriate design solutions that give the opportunity to reach the ZEB, this study needs to reduce the building’s height and expand the rooftop area. The calculation of final energy use compared to the rooftop PV energy production is recalculated and plotted in Figure 9a. The plots are on the diagonal line when the energy production is equal to the building energy use. All above the line means the energy generation by PV systems is higher than the final energy demand. The red circle is the reference point of the ZEB national energy-efficiency plans of 57 kWh/m2–year. From our investigations, the maximum height for small, medium, and large buildings achieving the ZEB should be 4, 5, and 3 stories, respectively. Figure 9b presents the ratios of building width to building height (W/H) of three buildings. The higher building’s width represents the larger building rooftop area—the W/H above the dashed line represents the cases that provide enough rooftop area for PV energy production. To make the net-zero building consumption, the W/H for small, medium and large office buildings should be equal to or greater than 2.5, 3.1, and 10, respectively.
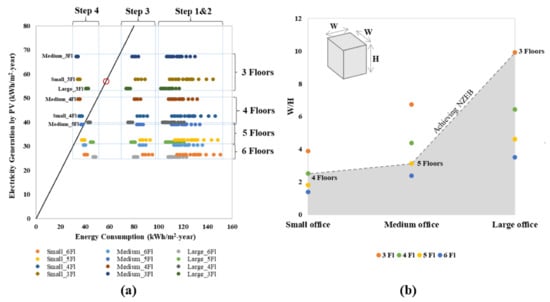
Figure 9.
The possible building height (a) and building geometry design (b) of office buildings to meet the ZEB goal.
3.4. Cost-Effective Solutions for ZEB Design
Figure 10 presents the plots of global cost ($/m2) and energy consumption (kWh/m2–year) of each design measure. The NPV values are calculated as labeled next to the symbols. The cost-optimal solutions are found in the scenarios with applied WWR of 20 and laminated glazed windows with horizontal shading from 1 to 2 m in length. The on-site energy demand for small, medium, and large buildings is 42.7, 40.6, and 47.2 kWh/m2–year, respectively. After adjusting the building’s height, some design measures in small and large buildings, especially the cases with 80%WWR (with the red label), do not achieve zero consumption. Considering the large building with three stories, the optimal designs could reach a net-plus energy building when the ratio of the on-site energy generation to the on-site energy demand (PV/ED) is greater than 1. All energy-efficiency measures could provide profitability (positive NPV), except for the cases (in the dashed line) in the small buildings. A high-performance glazed window (triple tinted glazing with Low-E film) is not cost-effective for small buildings with WWRs greater than 40%. From the investigations, the NPV values vary depending on the project’s investment, which is strongly affected by the glazed materials. The NPVs could be classified into two groups. Group 1 (in the shaded area) represents the scenarios with applied green insulated and laminated glazed windows.
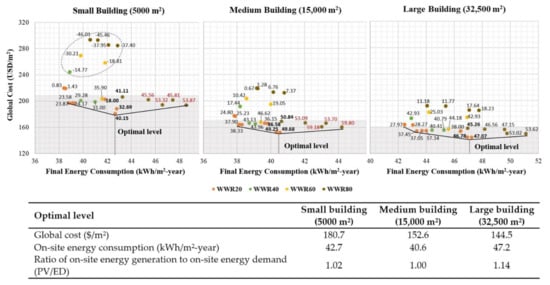
Figure 10.
Cost optimal level and energy savings of various energy-efficiency measures. The number labeled next to the symbols represents the NPV ($/m2). The scenarios in the shaded area use laminated and green insulated glazed windows with installed horizontal shading. The designs with the red label numbers are not zero consumption.
In contrast, the cases in group 2 (in the unshaded area) are applied with relatively high-cost glazed windows (triple tinted glass with Low-E film). For office buildings, the façade design with WWR of 20% could provide maximum benefit in energy savings; however, this design could make the room feel smaller and take fewer benefits from outside views. Consequently, the study also uses the IRR and DPB to examine the alternative solutions, which provide similar financial performance.
The study examines the potential ZEB designs with applied higher WWRs. In Table 7, the calculated IRRs of different energy-efficiency measures are ranked, and the DPBs are considered the cost-effectiveness of energy-efficiency investment. The maximum acceptable payback period should not exceed seven years as typically used for determining energy-efficiency investment in Thailand [65]. However, the DPB of all design measures slightly over the acceptable return time. The energy-efficiency measures with the three highest IRRs are proposed for the alternative façade designs, except for the large building providing five designs with the WWRs varying from 40%, 60%, and 80%. Making small buildings with zero consumption shows the lowest cost-effectiveness because it provides lower IRR values and the longest payback period up to 8.5 years.
Table 7.
Proposed design measures to achieve the ZEB national savings target in 2037.
From the investigations, either the design with WWR of 20% or 80% could provide similar energy-savings performance, while the DPBs are within a range of 7.2–8.5 years. Consequently, the façade design with WWR = 80 could be an economical option. It requires the insulated wall with a u-value of 0.26 W/m2K and green insulated glazed windows (u-value = 1.62 W/m2K) integrated with 2 m in length shading. The DPBs of the façade design of WWR = 80 in the medium and large buildings take 3–4 months higher than those of WWR = 20. However, the small building could take eight additional months to get the return. Suppose a few more months can be neglected; in that case, the façade design with WWR = 80 could be the optional solution for architects and property owners, who prefer the wider interior space with expanded open window views.
4. Discussion and Current Challenges
Investigating a potential ZEB design in three representative office buildings in Bangkok neighborhood areas has been carried out. Like other countries, increments of investment costs are a significant barrier to achieving the ZEB design for office buildings in Thailand. To achieve this goal, this study makes a deep improvement of building envelope and energy-efficiency systems. From our investigations, the additional investment cost for the ZEB design is 2.93 times of the reference building, which is considerably higher than those reviewed by [64]. Consequently, policy makers should further find strategies to reduce such a high cost or provide financial incentives to encourage property owner’s interest in this deep renovation.
From our investigations, using high-cost energy-efficiency measures for ZEB might not be the cost-benefit option, especially using the triple glass with Low-E film. Negative NPV occurs in all small buildings with applied the triple glass windows. The calculated NPVs for the medium and large buildings show positive values, but they provide the lowest profitability, compared to other measures. Similar savings performance could be found in the cases using the green insulated glazed window integrated with 2 m in length horizontal shading, which costs approximately 73% less than those of higher performance windows with the shading. The investment cost of the high-performance window depends mainly on the window area. For the triple glazed window with Low-E film, the larger the ratio of WWR is, the longer it takes property owners to get profitability from the initial investment. As compared to the cheaper windows (laminated glass and green insulated glass), the return periods of WWR of 20 and 80 have a slight difference.
As similar to previous works [44,46], the air-conditioning system plays a significant role in the building’s energy efficiency and shares a large portion of the global cost. Decreasing such a high cost with lower efficient A/C systems could be applied in the net-plus energy buildings (PV/ED ≥ 1). In this study, the large buildings with three stories consume less energy than their energy generation (PV/ED = 1.14). Consequently, the cheaper systems are replaced to meet the balance of PV power generation (PV/ED = 1). The SEER of 17.37 is applied in the cases with WWR of 20 and 80, while the SEER = 15.50 is used for 40%WWR. The final energy consumptions are increased to 53.9–54.2 kWh/m2–year, whereas the global costs are 21–27% lower than those of the higher SEERs. The property owners could get faster returns by 1.4–1.8 years.
Furthermore, the current investment costs of the small solar power plants in Thailand are relatively higher than other countries, which is less attractive for property owners [66]. Besides these economic challenges, the PV energy production capacity is a significant barrier to ZEB implementation in office buildings. Even if the building’s energy consumption lowers the national ZEB target, the energy demand is still higher than the renewable energy generation. This barrier is similar to those revealed in previous works [5,17,67]. Ref. [5] called those buildings as “net-zero energy ready buildings”, which might potentially become the ZEB in the future when some energy-efficiency measures are well implemented. This study suggests that either decreasing energy consumption or generating more renewable energy for office buildings in Thailand should be reconsidered to achieve the ZEB goal.
Making the nearly zero energy buildings to be zero consumption, higher energy-efficient designs and technologies should be applied. In this study, the recommended u-values of walls and glazed windows are relatively higher than those implemented in previous studies [3]. This envelope design could sufficiently prevent solar heat gain through the building envelope since the energy reduction is relatively low, even when the shading device is installed (Step 2). However, the energy-efficiency systems used in Steps 3 and 4 are not the highest performance available on the market. Consequently, one possibility for making a significant reduction is to use a higher efficiency lighting system and SEER for air conditioning systems. Regarding PV generation, several studies have proposed approaches to increase PV power generation capacity. Multiple-axis solar tracking systems could improve productivity by 24% [68]. Additional electricity production could gain from façade PV installation. Refs. [34,69] showed that façade PV system could generate power 400–900 kWh/kWp per year. However, the payback time for this system investment could be 2–4 times that of the rooftop systems [34], which needs to be considered.
According to the research’s results, the active approach makes a significant reduction of building energy use. Another significant design parameter to achieve the ZEB is the building geometry. In this study, the design guideline of the building’s width to height ratio reaching the ZEB is proposed for a square-shaped office building. The maximum height is up to five stories for a medium building, while the large building is up to three stories. Ref. [19] presented that the ZEB could be achieved in up to four-story office buildings in Brazil, whereas, in Florianopolis, a three-story building is a maximum height for ZEB design [37]. From our investigation and the reviews from other results, lessening energy consumption in a large and mid-rise building to meet renewable energy production is still a significant challenge.
5. Conclusions
This study investigated the potential implement of ZEB in three newly constructed office buildings in different scales: small (5000 m2), medium (15,000 m2), and large (32,500 m2), in Bangkok neighborhood areas. Energy simulations of different energy-efficiency measures, including two passive and two active strategies, were carried out to examine energy savings potential. Examining reasonable investment costs for the ZEB design, the study performed the cost-benefit analysis to determine the optimal solution with the lowest investment costs. The calculated NPVs, IRRs, and DPBs were used to examine the profitability and alternative energy-efficiency solutions for façade design.
From our investigations, the on-site energy demands of six-story office buildings after applied all energy-efficiency measures range from 38 to 40 kWh/m2–year, which could reach nearly zero energy building. The percentage savings from the proposed design accounts for 76.7–82.7% of the reference buildings. The on-site PV power generation accounts for 64.5–83% of the on-site energy demand. The envelope design using high-efficiency materials for walls and windows could save energy from 12.4–15.1%. The large contribution of energy reduction of 71.3–73.9% occurs when using high energy-efficient lighting and cooling systems.
Besides the envelope and system designs, this study also provides a guideline for building geometry design in achieving the ZEB. With a limited rooftop PV installation, it is hard to make the large and mid-rise buildings become the ZEB. In this study, achieving the ZEB required reducing the building’s floors and increasing the roof area. For the large office building to have zero energy consumption, the maximum building height should be three stories with W/H ≥ 10. Small and medium buildings could achieve the ZEB at the height of up to four floors with W/H ≥ 2.5 and five floors with W/H ≥ 3.1, respectively. It is suggested that a ratio of building rooftop area associated with the building height should be examined and integrated at the beginning of the design process.
The calculated IRRs and DPBs provide that the lowest cost-effectiveness for ZEB design occurs in small office buildings. The use of triple glass with Low-E film windows in the small office buildings is not profitable in the current economic condition (NPVs = −14.77–−46.01). The most cost-effective solutions (IRRs ranging from 12.34 to 13.85%) occur in the scenarios with applied WWR of 20, u-value of 0.26 W/m2K, and laminated glazed windows with horizontal shading from 1–2 m in length. The payback period of these designs ranges from 7.2 to 7.7 years. However, the envelope design of 80%WWR could become the cost-effective solution for ZEB when it integrates with a u-value of 0.26 W/m2K and green insulated glazed windows (u-value = 1.62 W/m2K) integrated with 2 m in length.
Some important topics are not considered in this analysis, which is discussed in the following:
Future studies should account for the practical implementation of ZEB in various building forms using façade PV systems and natural ventilation. In this study, a square-shaped building (low S/V) was used as a case study, which considered minimum heat gain through the building’s envelope. When additional PV energy generation from the façade is accounted for, optimal building form, which minimizes heat gain through envelope while increasing façade PV production performance, needs further investigation. In addition, in big cities, surrounded building shade considerably decreases heat gain through the building’s envelope and the PV power capacity. Encouraging more ZEB in the city areas, the effect of a complex environment on building energy use and PV production should be examined.
Regarding the passive design, natural ventilation causes a significant reduction in cooling energy use, giving more opportunities to achieve ZEB for mid-rise and large buildings. However, the square-shaped building has a limited natural ventilation application compared to other geometries with a larger surface area. Future investigations should consider the building design features supporting applied hybrid ventilation systems when the cool outside air is available.
With the limited input data used in the optimal analysis, the proposed designs might not be the best optimal solution. According to our findings, the A/C systems, and their sizes considerably impact global costs and energy savings. Consequently, future studies should account for the variations of A/C systems, which could significantly reduce the investment cost in the ZEB design. Furthermore, the sensitivity analysis should be performed to examine the effect of uncertainties and variations in the cost investment of different design measures on the project’s profitability. It will help decision makers to identify the risks and opportunities for the ZEB design shortly.
It is noted that the Ministry of Energy, Thailand has enforced the new version of “Ministerial Regulation Prescribing Type or Size of Building and Standard, Criteria and Procedure in Designing Building for Energy Conservation BE 2563 (2020). The newly constructed buildings, including offices, with a gross floor area greater than 10,000 m2 have to comply with the new BEC regulations. The regulation requires overall thermal transfer value (OTTV) and roof thermal transfer value (RTTV) for office buildings not exceeding 50 W/m2 and 15 W/m2, respectively. Since this research was conducted before the BEC announcement, the envelope designs and systems of the reference buildings (a new construction) were based on the typical designs of the buildings built before the regulation enforcement. Consequently, the energy savings performance and investment costs compared to the reference buildings might not represent those of the new buildings in compliance with the new BEC.
Author Contributions
Conceptualization, D.J. and K.L.; methodology, D.J. and K.L.; software, K.L.; validation, D.J.; formal analysis, D.J. and K.L.; investigation, D.J. and K.L.; resources, D.J.; data curation, D.J. and K.L.; writing—original draft preparation, K.L.; writing—review and editing, D.J.; visualization D.J. and K.L.; supervision, D.J.; funding acquisition, D.J.; Both authors have read and agreed to the published version of the manuscript.
Funding
The research is partially supported by Thammasat University Research Unit in Architecture for Sustainable Living and Environment.
Institutional Review Board Statement
Not applicable.
Informed Consent Statement
Not applicable.
Data Availability Statement
Not applicable.
Acknowledgments
The authors thank Pongpeera Saekow for providing technical data and giving assistance to mechanical ventilation systems in energy modeling and Chanikarn Yimprayoon for significant comments to improve the research methodology. We also thank Anake Suwanchaisakul and Sukulpat Khumpaisal for assistant in financial analysis. We are grateful for special support from the Faculty of Architecture and Planning, Thammasat University, to provide a laboratory and facilitate the research activities and research fund from Thammasat University Research Unit in Architecture for Sustainable Living and Environment.
Conflicts of Interest
The authors declare no conflict of interest.
References
- Pantong, K.; Chirarattananon, S.; Chaiwiwatworakul, P. Development of Energy Conservation Programs for Commercial Buildings based on Assessed Energy Saving Potentials. Energy Procedia 2011, 9, 70–83. [Google Scholar] [CrossRef][Green Version]
- Energy Policy & Planning Office. Thailand 20-Year Energy Efficiency Development Plan (2018–2038); Ministry of Energy: Bangkok, Thailand, 2018. [Google Scholar]
- Peterson, K.; Torcellini, P.; Grant, R. A Common Definition for Zero Energy Buildings; United States Department of Energy: Washington, DC, USA, 2015. [Google Scholar]
- D’Agostino, D.; Mazzarella, L. What is a Nearly zero energy building? Overview, implementation and comparison of definitions. J. Build. Eng. 2019, 21, 200–212. [Google Scholar] [CrossRef]
- Feng, W.; Zhang, Q.; Ji, H.; Wang, R.; Zhou, N.; Ye, Q.; Hao, B.; Li, Y.; Luo, D.; Lau, S.S.Y. A review of net zero energy buildings in hot and humid climates: Experience learned from 34 case study buildings. Renew. Sustain. Energy Rev. 2019, 114, 109303. [Google Scholar] [CrossRef]
- Yimprayoon, C. Zero Energy Building. J. Archit./Plan. Res. Stud. (JARS) 2016, 13, 1–30. [Google Scholar]
- Boonyaputthipong, C. Building envelope renovation for net zero energy building in hot humid climate. IOP Conf. Ser. Earth Environ. Sci. 2019, 257, 012031. [Google Scholar] [CrossRef]
- Wongwuttanasatian, T.; Soodphakdee, D.; Malasri, N.; Triratanasirichai, K. A Demonstrated Net Zero Energy Building in Thailand: The Way for Sustainable Development in Buildings. Adv. Mater. Res. 2015, 1119, 741–747. [Google Scholar] [CrossRef]
- Anusakdakul, W. Guidelines for Development of Net Zero Energy Buildings for Governmental Office Buildings in Thailand. Master’s Thesis, Silapakorn University, Bangkok, Thailand. Available online: http://ithesis-ir.su.ac.th/dspace/handle/123456789/898?mode=full (accessed on 18 August 2016).
- Department of Alternative Energy Development and Efficiency. The Study and Demonstration of Energy Efficient Standard from ECON Level toward Zero Energy Building. Available online: http://new.2e-building.com/content/%E0%B9%82%E0%B8%84%E0%B8%A3%E0%B8%87%E0%B8%81%E0%B8%B2%E0%B8%A3%E0%B8%A8%E0%B8%B6%E0%B8%81%E0%B8%A9%E0%B8%B2%E0%B9%81%E0%B8%A5%E0%B8%B0%E0%B8%AA%E0%B8%B2%E0%B8%98%E0%B8%B4%E0%B8%95%E0%B8%81%E0%B8%B2%E0%B8%A3%E0%B8%A2%E0%B8%81%E0%B8%A3%E0%B8%B0%E0%B8%94%E0%B8%B1%E0%B8%9A%E0%B9%80%E0%B8%81%E0%B8%93%E0%B8%91%E0%B9%8C%E0%B8%AD%E0%B8%B2%E0%B8%84%E0%B8%B2%E0%B8%A3-econ-%E0%B8%AA%E0%B8%B9%E0%B9%88%E0%B9%80%E0%B8%81%E0%B8%93%E0%B8%91%E0%B9%8C%E0%B8%AD%E0%B8%B2%E0%B8%84%E0%B8%B2%E0%B8%A3-zero-energy-building?fbclid=IwAR2UofMlMJsKZ7XCBBP1wXg4AzAH08r-2UnBSA7M9YnW0ztuxnBhVA9ZXmw (accessed on 1 April 2020).
- Yimprayoon, C. Energy Efficient Measures for Buildings with Grid-Connected Photovoltaic Systems Located in Bangkok, Thailand. Appl. Mech. Mater. 2013, 361–363, 224–230. [Google Scholar] [CrossRef]
- Dinkel, A.; Engelmann, P.; Köhler, B.; Hussain, M. Energy Efficient Buildings as Central Part of Integrated Resource Management in Asian Cities: The Urban Nexus II; Final Report 271810 PN: 15.2201.0-001.00, VN: 81200843; Fraunhofer Institute for Solar Energy Systems ISE: Freiburg, Germany, 2017; p. 432. [Google Scholar]
- He, Y.; Liu, M.; Kvan, T.; Peng, S. An enthalpy-based energy savings estimation method targeting thermal comfort level in naturally ventilated buildings in hot-humid summer zones. Appl. Energy 2017, 187, 717–731. [Google Scholar] [CrossRef]
- Xu, W.; Zhang, S. APEC Nearly (Net) Zero Energy Building Roadmap; Asia-Pacific Economic Cooperation: Singapore, 2018. [Google Scholar]
- El-Darwish, I.; Gomaa, M. Retrofitting strategy for building envelopes to achieve energy efficiency. Alex. Eng. J. 2017, 56, 579–589. [Google Scholar] [CrossRef]
- Ballarini, I.; De Luca, G.; Paragamyan, A.; Pellegrino, A.; Corrado, V. Transformation of an Office Building into a Nearly Zero Energy Building (nZEB): Implications for Thermal and Visual Comfort and Energy Performance. Energies 2019, 12, 895. [Google Scholar] [CrossRef]
- Costa, J.F.W.; Amorim, C.N.D.; Silva, J.C.R. Retrofit guidelines towards the achievement of net zero energy buildings for office buildings in Brasilia. J. Build. Eng. 2020, 32, 101680. [Google Scholar] [CrossRef]
- Magrini, A.; Lentini, G. NZEB Analyses by Means of Dynamic Simulation and Experimental Monitoring in Mediterranean Climate. Energies 2020, 13, 4784. [Google Scholar] [CrossRef]
- Guo, Y.; Bart, D. Optimization of Design Parameters for Office Buildings with Climatic Adaptability Based on Energy Demand and Thermal Comfort. Sustainability 2020, 12, 3540. [Google Scholar] [CrossRef]
- Hoque, S.; Iqbal, N. Building to Net Zero in the Developing World. Buildings 2015, 5, 56–68. [Google Scholar] [CrossRef]
- Khadraoui, M.A.; Sriti, L. The Effect of Cool Paints and Surface Properties of the Facade on the Thermal and Energy Effi-ciency of Buildings in a Hot and Arid Climate. Journal of Materials and Engineering Structures. JMES 2019, 6, 127–140. [Google Scholar]
- Zhang, J.; Xu, L.; Shabunko, V.; Tay, S.E.R.; Sun, H.; Lau, S.S.Y.; Reindl, T. Impact of urban block typology on building solar potential and energy use efficiency in tropical high-density city. Appl. Energy 2019, 240, 513–533. [Google Scholar] [CrossRef]
- Xue, P.; Li, Q.; Xie, J.; Zhao, M.; Liu, J. Optimization of window-to-wall ratio with sunshades in China low latitude region considering daylighting and energy saving requirements. Appl. Energy 2019, 233-234, 62–70. [Google Scholar] [CrossRef]
- Marino, C.; Nucara, A.; Pietrafesa, M. Does window-to-wall ratio have a significant effect on the energy consumption of buildings? A parametric analysis in Italian climate conditions. J. Build. Eng. 2017, 13, 169–183. [Google Scholar] [CrossRef]
- Al-Masrani, S.M.; Al-Obaidi, K.M.; Zalin, N.A.; Isma, M.A. Design optimisation of solar shading systems for tropical office buildings: Challenges and future trends. Sol. Energy 2018, 170, 849–872. [Google Scholar] [CrossRef]
- Jareemit, D.; Canyookt, P. Residential cluster design and potential improvement for maximum energy performance and outdoor thermal comfort on a hot summer in Thailand. Int. J. Low-Carbon Technol. 2020. [Google Scholar] [CrossRef]
- Gratia, E.; De Herde, A. Design of low energy office buildings. Energy Build. 2003, 35, 473–491. [Google Scholar] [CrossRef]
- Sreshthaputra, A.; Chindavanig, T. Development of minimum requirements of thermal property of building envelopes for single houses. In Proceedings of the 3rd Conference on Energy Network of Thailand, Bangkok, Thailand, 23–25 May 2007. [Google Scholar]
- Chang, W.-K.; Hong, T. Statistical analysis and modeling of occupancy patterns in open-plan offices using measured lighting-switch data. Build. Simul. 2013, 6, 23–32. [Google Scholar] [CrossRef]
- Lowry, G. Energy saving claims for lighting controls in commercial buildings. Energy Build. 2016, 133, 489–497. [Google Scholar] [CrossRef]
- Fabrizio, E.; Seguro, F.; Filippi, M. Integrated HVAC and DHW production systems for Zero Energy Buildings. Renew. Sustain. Energy Rev. 2014, 40, 515–541. [Google Scholar] [CrossRef]
- Belmonte, J.; Eguía, P.; Molina, A.E.; Almendros-Ibáñez, J.; Salgado, R. A simplified method for modeling the thermal performance of storage tanks containing PCMs. Appl. Therm. Eng. 2016, 95, 394–410. [Google Scholar] [CrossRef]
- Zhou, Y.; Wu, J.; Wang, R.; Shiochi, S. Energy simulation in the variable refrigerant flow air-conditioning system under cooling conditions. Energy Build. 2007, 39, 212–220. [Google Scholar] [CrossRef]
- Brito, M.; Freitas, S.; Guimarães, S.; Catita, C.; Redweik, P. The importance of facades for the solar PV potential of a Mediterranean city using LiDAR data. Renew. Energy 2017, 111, 85–94. [Google Scholar] [CrossRef]
- Pacheco-Torres, R.; López-Alonso, M.; Martínez, G.; Ordóñez, J. Efficient design of residential buildings geometry to optimize photovoltaic energy generation and energy demand in a warm Mediterranean climate. Energy Effic. 2014, 8, 65–84. [Google Scholar] [CrossRef]
- Atmaja, T.D. Façade and Rooftop PV Installation Strategy for Building Integrated Photo Voltaic Application. Energy Procedia 2013, 32, 105–114. [Google Scholar] [CrossRef][Green Version]
- Didoné, E.L. Parametric Study for Net Zero Energy Building Strategies in Brazil Considering Semi-Transparent PV Windows. Ph.D. Thesis, Karlsruhe Institute of Technology, Karlsruhe, Germany, 2014. [Google Scholar]
- Ghazi, S.; Ip, K. The effect of weather conditions on the efficiency of PV panels in the southeast of UK. Renew. Energy 2014, 69, 50–59. [Google Scholar] [CrossRef]
- Boonyong, S. Developing energy consumption model for office building in Thailand. Master’s Thesis, Faculty of Engineering Chulalongkorn University, Bangkok, Thailand, 2018. [Google Scholar]
- Zangheri, P.; Armani, R.; Pietrobon, M.; Pagliano, L. Identification of cost-optimal and NZEB refurbishment levels for representative climates and building typologies across Europe. Energy Effic. 2018, 11, 337–369. [Google Scholar] [CrossRef]
- Liu, Y.; Liu, T.; Ye, S.; Liu, Y. Cost-benefit analysis for Energy Efficiency Retrofit of existing buildings: A case study in China. J. Clean. Prod. 2018, 177, 493–506. [Google Scholar] [CrossRef]
- Pikas, E.; Thalfeldt, M.; Kurnitski, J. Cost optimal and nearly zero energy building solutions for office buildings. Energy Build. 2014, 74, 30–42. [Google Scholar] [CrossRef]
- Ferrara, M.; Monetti, V.; Fabrizio, E. Cost-Optimal Analysis for Nearly Zero Energy Buildings Design and Optimization: A Critical Review. Energies 2018, 11, 1478. [Google Scholar] [CrossRef]
- Hamdy, M.; Hasan, A.; Siren, K. A multi-stage optimization method for cost-optimal and nearly-zero-energy building solutions in line with the EPBD-recast 2010. Energy Build. 2013, 56, 189–203. [Google Scholar] [CrossRef]
- Hamdy, M.; Mauro, G.M. Multi-Objective Optimization of Building Energy Design to Reconcile Collective and Private Perspectives: CO2-eq vs. Discounted Payback Time. Energies 2017, 10, 1016. [Google Scholar] [CrossRef]
- Susorova, I.; Tabibzadeh, M.; Rahman, A.; Clack, H.L.; Elnimeiri, M. The effect of geometry factors on fenestration energy performance and energy savings in office buildings. Energy Build. 2013, 57, 6–13. [Google Scholar] [CrossRef]
- Daoprakaimongkol, S. Glass Selection Guide for Curtain Walls of Air-Conditioned Office Buildings in Accordance with Building Energy Code BE 2552. Master’s Thesis, Faculty of Architecture Chulalongkorn University, Bangkok, Thailand, 2009. [Google Scholar]
- Pattarakon, L. Design Guidelines for Enhancing and Energy Performance in Office Buildings by Using Electrochromic Glass. Master’s Thesis, Thammasat University, Bangkok, Thailand, 2018. [Google Scholar]
- Department of Alternative Energy Development and Efficiency. Ministerial Regulation Prescribing Type or Size of Building and Standard, Criteria and Procedure in Designing Building for Energy Conservation BE 2552; Department of Alternative Energy Development and Efficiency: Bangkok, Thailand, 2009. [Google Scholar]
- Bright management Consulting Co., Ltd. Promoting Energy Efficiency in Commercial Buildings; Progress report 2; Department of Alternative Energy Development and Efficiency: Bangkok, Thailand, 2013; p. 52. [Google Scholar]
- Lasternas, B. Net-Zero Energy Building in the Tropics School of Design and Environment SDE 4. In Proceedings of the International Urban Sustainability & Green Building Conference (IGEM-IUSGBC 2018), Kuala Lumpur, Malaysia, 17–20 November October 2018; p. 35. [Google Scholar]
- Department of Alternative Energy Development and Efficiency, Ministry of Energy. Development and Investment in Renewable Energy Source: Solar Power; Department of Alternative Energy Development and Efficiency, Ministry of Energy: Bangkok, Thailand, 2014. [Google Scholar]
- Department of Alternative Energy Development and Efficiency, Ministry of Energy. Handbook for Energy Production from Solar Power; Department of Alternative Energy Development and Efficiency, Ministry of Energy: Bangkok, Thailand, 2014. [Google Scholar]
- Srisutapan, A. Guidelines and Applications of Daylight Metrics for Buildings in Thailand. J. Archit./Plan. Res. Stud. (JARS) 2020, 17, 103–120. [Google Scholar] [CrossRef]
- Hirsch, J.J. EQuest Introductory Tutorial, Version 3.64. James J. Hirsch & Associated. Available online: https://doe2.com/Download/equest/eQ-v3-64_Introductory-Tutorial.pdf (accessed on 24 October 2018).
- Martínez, S.; Eguía, P.; Granada, E.; Moazami, A.; Hamdy, M. A performance comparison of multi-objective optimization-based approaches for calibrating white-box building energy models. Energy Build. 2020, 216, 109942. [Google Scholar] [CrossRef]
- Ruiz, G.R.; Bandera, C.F. Validation of Calibrated Energy Models: Common Errors. Energies 2017, 10, 1587. [Google Scholar] [CrossRef]
- Li, Y. Case Study: MEA Nonthaburi District Area (Bangkok, Thailand). In Advancing the Energy Management System in the East Asia Summit Region; ERIA Research Project Report 2014-39; ERIA: Jakarta, Indonesia, 2015; pp. 95–116. Available online: http://www.eria.org/RPR_FY2014_No.39_Chapter_4.pdf (accessed on 23 April 2020).
- IRENA. Renewable Energy Outlook: Thailand; International Renewable Energy Agency: Abu Dhabi, UAE, 2017; p. 104.
- SOLARGIS. Solar Resource Maps of Thailand. Available online: https://solargis.com/maps-and-gis-data/download/thailand (accessed on 26 January 2021).
- Department of Alternative Energy Development and Efficiency. Handbook for Development and Investment in Renewable Energy Production: Solar Cell; Department of Alternative Energy Development and Efficiency: Bangkok, Thailand, 2014. [Google Scholar]
- Chomnongde, J. Study of Building Proportion and PV Orientation for Energy Efficiency in Office Building. Master’s Thesis, Faculty of Architecture and Planning Thammasat University, Pathum Thani, Thailand, 2014. [Google Scholar]
- Charoenchatchai, J. Development Concept for Energy Efficiency and Green Buildings; Department of Alternative Energy Development and Efficiency: Bangkok, Thailand, 2018. [Google Scholar]
- D’Agostino, D.; Zangheri, P.; Castellazzi, L. Towards Nearly Zero Energy Buildings in Europe: A Focus on Retrofit in Non-Residential Buildings. Energies 2017, 10, 117. [Google Scholar] [CrossRef]
- Sutabutr, T. Renewable Energy and Energy Efficiency Development Plan and Accelerated Program; Department of Alternative Energy Development and Efficiency: Bangkok, Thailand, 2012. [Google Scholar]
- Iamtrakul, P.; Kritsanawonghong, S. Thailand’s Future Green Energy for Sustainable Urban Development. Int. J. Build. Urban Inter. Lands. Technol. (BUILT) 2019, 13, 7–18. [Google Scholar]
- Zhang, J.; Zhou, N.; Hinge, A.; Feng, W. Zero-Energy Buildings—An Overview of Terminology and Policies in Leading World Regions. In Policies and Programmes towards A Zero-Energy Building Stock; European Council for an Energy Efficient Economy (ECEEE): Paris, France, 2015; pp. 1299–1311. [Google Scholar]
- Laseinde, T.; Ramere, D. Low-cost automatic multi-axis solar tracking system for performance improvement in vertical support solar panels using Arduino board. Int. J. Low-Carbon Technol. 2019, 14, 76–82. [Google Scholar] [CrossRef]
- Renken, C. Strategies to Increase the Deployment of PV in Façades. In Proceedings of the 10th Conference on Advanced Building Skins, Bern, Switzerland, 3–4 November 2015; Economic Forum: Munich, Germany, 2015. [Google Scholar]


Publisher’s Note: MDPI stays neutral with regard to jurisdictional claims in published maps and institutional affiliations. |
© 2021 by the authors. Licensee MDPI, Basel, Switzerland. This article is an open access article distributed under the terms and conditions of the Creative Commons Attribution (CC BY) license (https://creativecommons.org/licenses/by/4.0/).