Abstract
In arid to semi-arid regions, vulnerability to climate change combined with the overexploitation of water resources is jeopardizing food security. In the Souss-Massa region in central Morocco, the rural population relies on growing olives for a living. The management of these orchards is mostly traditional under rainfed irrigation, which induces a high level of dependence on climate variability. In the present study, we investigate the long-term trends of the relationship between the observed olive yields and global climate patterns during the period 1973–2014. We apply lagged Spearman’s correlations and cross-wavelet analysis to detect the potential influence of El Niño-southern oscillation (ENSO), the Indian Ocean Dipole (IOD), North Atlantic oscillation (NAO) and Pacific decadal oscillation (PDO) on the yield variability of olive orchards. The results of a Mann-Kendall test show a statistically significant decreasing trend in olive yields during the studied period. Statistically significant negative correlations were observed for (lag = −1) with spring and summer NINO 3.4 and with summer and autumn PDO. No statistically significant correlations between olive yields and NAO and IOD were observed. The results of wavelet coherence between annual olive yields and PDO and ENSO revealed that the highest values of power spectrum coherence occurred during the (lag = 0) spring PDO and (lag = −1) spring ENSO, both with an antiphase relationship. During the studied period, the extreme events of El Niña and El Niño years corresponded to below average yields.
1. Introduction
Projections indicate that by 2050, the climate in Northwest Africa is likely to get warmer and dryer with a decrease in precipitation of about −10.6% and an increase in temperature of +1.2% °C [1]. Future projections for the same time horizon reveal that climate change will account for 22% of future water shortages in North Africa, while 78% of increased future water shortages could be attributed to socioeconomic factors [2,3]. Due to water resource scarcity and sensitivity to climate variability, in addition to a high population growth rate, the region is expected to face significant challenges to satisfy food demands. Furthermore, gross domestic product and employment in these countries are highly dependent on agriculture. Therefore, design and adaptation strategies should take into account long-term climate information.
The strong link between climate variability and crop yields has been reported in many global and local studies seeking to understand direct and combined seasonal influences of large-scale climate oscillations on annual crop production. In their work, Heino et al. [4] reported that from 1961–2010, crop productivity was significantly influenced by at least one large-scale climate oscillation in two-thirds of global cropland area. It was found that the regions in which El Niño-Southern oscillation (ENSO), the Indian Ocean Dipole (IOD) and North Atlantic oscillation (NAO) most influenced crop productivity were Northern and Southern Africa, as well as the Middle East [4]. El Niño-Southern oscillation (ENSO) is a significant driver for northern hemisphere interannual variability, especially during the winter months [5], and for rainfall in Africa [6]. Pacific decadal oscillation (PDO), i.e., a pattern of midlatitude climate variability on decadal to interdecadal time scales over the North Pacific, contributes to decadal variations in climate both locally and globally [7]. Also, in North Africa, the influence of the NAO, for example on winter wheat production variance, accounts for 64%, where a positive NAO phase results in decreased precipitation and soil moisture [8]. North Atlantic Oscillation is also found to be related to yields during the early stage of wheat growth in December [9]. A metadatabase of future yield change was built by compiling the results from 16 published works and assessing the negative impact on crop yield of an increase of temperature which would reduce the crop cycle duration and increase evapotranspiration demand in West Africa [10].
Over recent decades, agricultural systems in the semi-arid region of Souss-Massa have had to cope with many transformations driven by climate variability, such as changes in social and environmental contexts, as well as public policies. To ensure sustained agricultural production, the system has evolved from resource-based to demand-based agriculture. The subsistence of rural farmers, who are mainly dependent on agriculture outcomes, is weakened by the degradation of agricultural areas and scarcities of water resources, leading to the transition of farmers from small farm owners to agricultural workers [11]. On the other hand, the adoption of intensive practices and the expansion of urban areas have led to a decline in the quantity and quality of water and soil resources [12,13,14]. The situation of overexploitation and degradation of water resources has been exacerbated by successive drought events and climate change [15,16]. However, the high frequency of extreme events over the last few decades is the leading direct climate risk affecting rainfed crops.
Previous studies have shown that the phenology of the olive, especially at the flowering stage, is strongly affected by temperature and might represent a biological indicator of climate change in the Mediterranean [17,18]. It should be emphasized that the region of Souss-Massa is not considered one of the major production areas of olive, in comparison with other regions in Morocco [19]. For the last four decades, due to climate deregulation and the low productivity of some crops (e.g., olive, almonds and other crops cultivated in the area), agriculture has been shifting intensive practices.
In this work, we aim to evaluate the annual and decadal variabilities of olive yields and linkages with global climate oscillations in the semi-arid Souss-Massa basin in Northwestern Africa during the period from 1973–2014. The impact of global climate oscillations on olive orchards has been studied in Turkey [20] and Spain [21], while no works were found on this relationship in Northwestern Africa.
2. Materials and Methods
2.1. Study Area
Major geographic structures border the region of Souss-Massa, located in South Morocco: the Atlantic Ocean to the west, the Atlas Mountains to the north, the Anti-Atlas Mountains to the southeast and the Sahara to the south (Figure 1). Despite the presence of the Atlantic coast and the Atlas Mountains, the prevailing climate in the region is arid [14,22,23].
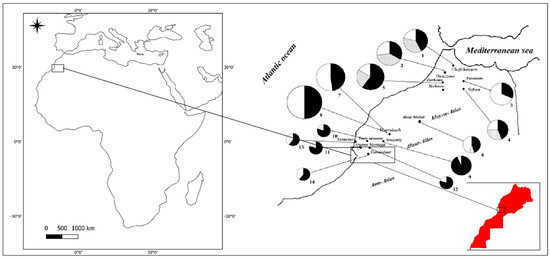
Figure 1.
Location of study area (in black box). Distribution of the Picholine marocaine cultivar (in black), local forms (in white) and minor cultivars (in grey) according to the 14 areas. The number in bold type indicate number of studied areas; after [19].
The traditional agrosystems in the region of Souss-Massa rely on crop mixing, where winter crops are cultivated underneath fruit trees. Texts from the 12th and 17th centuries [24] show a predominance of the date palm, the vine, almond and pomegranate in the Souss region, in addition to Argan trees, which were exported to other regions. Sugar cane was well developed and exported in North Africa and Europe, where the decay of these cultivars and the rise of olive oil prices led to increasing demand, encouraging the expansion of olive trees in the region in the 16th Century [24].
In the Souss Massa region, traditional management and dependency on both climatic conditions and the alternation phenomenon distinguish the olive production under rainfed conditions [25]. It should be noted that in this region, the Moroccan Picholine dominates its varietal profile [19].
2.2. Methods
Climatic patterns are nonstationary processes with time-varying properties (variance, frequency and duration) [26,27,28]. We applied Mann-Kendall [29,30] and Sen’s [31] tests to olive yields. We also applied Spearman rank correlation since it is capable of assessing both linear and nonlinear correlations between variables [32]. Furthermore, we performed a multitaper spectral analysis following the procedure outlined in [33]. We also analyzed continuous wavelet transformation (cwt) to assess the temporal variability of long-term olive yields [27,28]. The Morlet wavelet was selected for feature extraction purposes [26,34,35]. The cross wavelet transform (xwt) was applied to evaluate the covariance of olive and climate pattern signals, while wavelet coherence (wtc) was applied to analyze the coherence of the power spectrum [36].
2.3. Data
2.3.1. Crop Data
The archives under the authority of the agricultural department “Office de Mise en Valeur Agricole de Souss-Massa” (ORMVASM), reporting, since its establishment, the annual production in tons (T) and harvest areas in hectares (ha), were explored to calculate olive yields. To avoid technical improvements of influence over time, we applied linear trend removal. We distinguished the phenological stages of olive trees as described in [37]. The main phonological stages cultivated in the Mediterranean region were identified as follows: flowering period (April to late May), fruit growth (May to November), pit hardening (late June to August), fruit ripening (September to early December) and oil accumulation (August to late November).
2.3.2. Climate Oscillation Data
The Niño 3.4 index is the most commonly used index to represent El Niño-Southern oscillation [38]. The Niño 3.4 (5 N-5 S, 170 W-120 W) anomalies capture the average equatorial sea surface temperatures (SST) across the Pacific from about the dateline to the South American coast. The Niño 3.4 index typically uses a five-month running mean; El Niño or La Niña events are defined when the Niño 3.4 SSTs exceed +/− 0.4 °C for a period of six months or more [39,40,41]. The intensities of El Niño and El Niño years are defined from the Oceanic Niño Index (ONI).
North Atlantic oscillation (NAO) is considered one of the most important modes of variability in the atmosphere of the northern hemisphere [42]. It has been recognized that its impact on the climate of the northern hemisphere is more intense in winter [43]. The NAO index is defined as the difference between the normalized sea level pressure over Gibraltar and that over Southwest Iceland [44].
Pacific decadal oscillation (PDO) is defined by the leading pattern (EOF) of SST anomalies in the North Pacific basin (typically, polewards of 20° N) [45,46]. During the positive phase, the PDO pattern consists of negative SST anomalies in the central and western North Pacific, and positive SST anomalies in the eastern North Pacific (opposite signs obtained for the negative phase) [47].
The Indian Ocean dipole (IOD) is a coupled ocean-atmosphere phenomenon in the Indian Ocean. Its intensity is represented by the anomalous SST gradient between the western equatorial Indian Ocean (50 E-70 E and 10 S-10 N) and the southeastern equatorial Indian Ocean (90 E-110 E and 10 S-0 N) [48]. The Dipole Mode Index (DMI) represents the activity of the IOD.
The time series used in this work were obtained as three-month averages to represent meteorological seasons. The data used for the analyzed indexes are listed below:
3. Results
3.1. Interannual Variability of Olive Yields in Souss-Massa Region
In Figure 2, we represent olive harvested areas in hectares and production in tons during the period from 1973–2014. Globally, we noted that despite the increasing harvested area, the annual production was decreasing. We observed that the lowest yield occurred during the years 1980, 1983, 1992 and 2003. Meanwhile, the highest yields were obtained in 1985, 1978 and 1982. We noted that while high fluctuations were observed from the late 1970s to late 1980s, the period 1990–2003 recorded the lowest values of olive yields. Results of the Mann- Kendall test showed a statistically significant decreasing trend in Souss-Massa olive yields during the studied period. A Sens’s test indicated that during the period from 1973–2014, yields decreased by (−0.32 T/Ha/year) with α = 0.05. We observed that the average production decreased from about 21,000 tons in the period of 1973–1990 to 13,000 tons from 1990–2014.
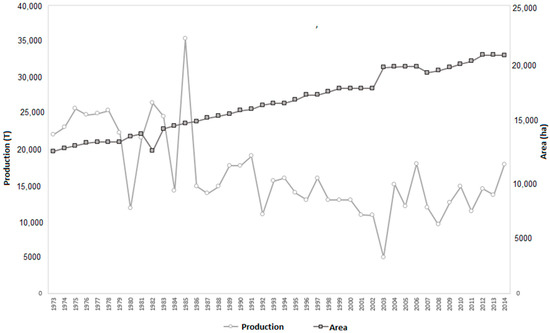
Figure 2.
Interannual evolution of olive orchard production and of harvested areas in Souss-Massa region during the period of 1973–2014.
Continuous wavelet transformation of olive yields displayed short-term variability of 2 to 7 years (Figure 3a), with statistically significant high-energy bands between the 1980s and 1993 (red to orange color with black line contour). We also applied spectral analysis of olive yields for the period of 1973–2014; a peak in the two to six year bands characterizes the result (Figure 3b).
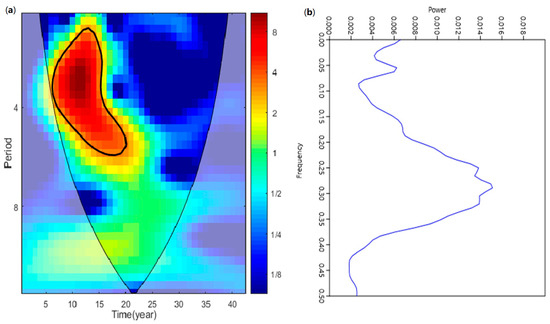
Figure 3.
(a) Continuous wavelet transform and (b) Multitaper Spectrum of Olive yields during the period of 1973–2014.
3.2. Relationship between Climate Oscillations and Olive Yield
The Spearman’s coefficient of correlations for (lag = −1) showed statistically significant negative correlations between olive yields and Nino 3.4 calculated for MAM (spring) and JJA (summer) months. Statistically significant correlations with PDO were also calculated for JJA and SON (autumn). Concerning the (lag = 0), olive yield was significantly correlated with PDO during DJF (winter) and MAM months (Table 1). No statistically significant correlations were calculated for NAO and IOD indexes.

Table 1.
Spearman rank correlation between Olive yields and lagged climate indices. Values with an asterisk (*) indicate 95% statistical significance.
We computed cross wavelet transform (xwt) and wavelet coherence (wtc) considering only statistically significant Spearman’s correlation results with olive yields. The results are shown in Figure 4 for (lag = −1), while in Figure 5, we represent the results for (lag = 0). Figure 4 displays statistically significant common high power between olive yields and NINO 3.4 during MAM and JJA at both high and low frequencies of, respectively, 2 to 4 years and 4 to 6 years from the late 1970s to the late 1990s. The results for XWT applied to olive yields, and PDO covariance during JJA and SON, showed the same high and low frequencies calculated for the NINO 3.4 index. However, the JJA PDO high frequency was extended from a one- to a four-year period. We noted that the cross-wavelet transform results for the PDO index showed a weaker signal compared to the NIÑO 3.4 index.
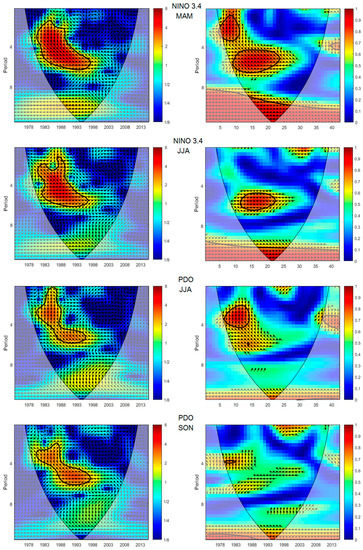
Figure 4.
Cross-wavelet transform (left) and wavelet coherence (right) for (lag = −1) between olive yields and climate patterns during the period of 1973–2014. The thick black contours highlight the 95% confidence level.
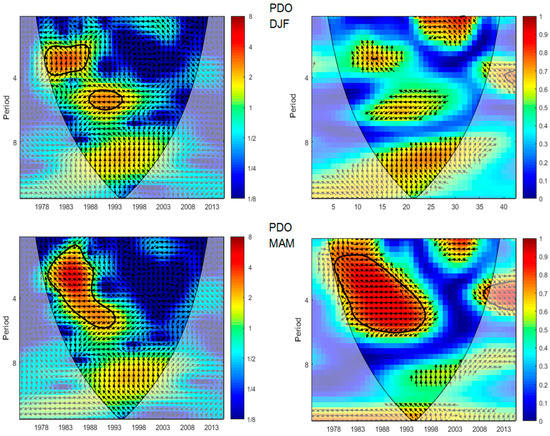
Figure 5.
Cross-wavelet transform (left) and wavelet coherence (right) for (lag = 0) between olive yields and climate patterns during the period of 1973–2014. The thick black contours highlight the 95% confidence level.
We applied a wavelet coherence analysis to assess the association between long-term olive yields and climate patterns. We found that the highest values of coherence were observed for the Niño 3.4 during spring and summer months in comparison with the PDO index calculated for summer and autumn months. Additionally, the results displayed a dominant antiphase asserting Spearman’s correlations. It can be noted that the arrows between Olive yields and Nino 3.4 during spring are pointing up along the period (1 to 4 years) showing that Nino leads Olive yields by 90°.
Concerning xwt of the lagged climate indexes for harvest year (lag = 0), the results presented in Figure 5 show a standard higher power of a two- to four-year period, and around a six-year period between PDO during winter months and olive yields. Meanwhile, the results for PDO during spring months highlight a common high power of one- to six-year period. The highest values of coherence for (lag = 0) were observed for PDO during the spring months with a dominance of antiphase arrows for the period (one- to six-years).
3.3. Impacts of El Niño and El Niña Events on Olive Yields
The results presented in the previous section demonstrate the influence of Enso activity on olive yields principally during the spring months. In this section, we investigate the response of olive yields to El Niño and El Niña events. The Oceanic Niño Index (ONI) is used to define El Niño and El Niña years and their intensities. We focus our analysis on running three-month mean Oni values calculated during MAM (spring) months. The obtained result was then applied to lagged olive yields during the period of 1973–2014; see Figure 6. The years 1983, 1992 and 2003 corresponded, respectively, to very strong, strong and moderate El Niño episodes, and a drop within the years with the lowest olive yields.
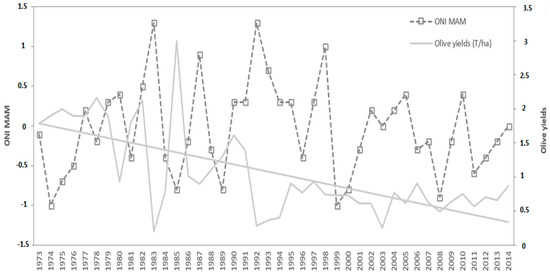
Figure 6.
Three-Month mean Oni values calculated during MAM (dashed line) and annual olive yields (solid line) during 1973–2014.
In most cases, the response of olive yields to abnormal conditions of the Enso revealed a decrease of yield values during El Niño years, while an increase was noted during El Niña years. Nevertheless, a strong El Niña led to below average values. The lowest values corresponded to very strong and strong El Niño years.
4. Discussion
The main climate variables, relevant at the seasonal timescale in the physiological development of the Olive fruits, are principally rainfall and temperature. In particular, Olive flowering dates depend strongly on spring temperatures [18]. Meanwhile, the opening of flowers is determined principally by the cultivar’s endogenous characteristics [49].
To better appreciate the influence of the variability of the climate oscillations on annual Olive yields, we focus on the correspondence of the results with regard to the phenological stages of the Olive trees. The results of wavelet coherence between annual crop yields and lagged climate indexes reveals that during the spring, the PDO with (lag = 0) and the ENSO with (lag = −1) are displaying high values of power spectrum coherence with an anti-phase relationship. During the period 1973–2014, corresponding periods are (1 to 6 years) and (2 to 4 and 4 to 6 years) respectively. The results obtained here are in accordance with previous works treating the influence of the ENSO and the NAO on Olive yields in Turkey [20] and in Spain [21], where no statistically significant correlations were found between olive yields and the NAO, while statistically significant negative correlations were observed with the ENSO. It worth noting that while ENSO is associated with inter-annual variability, the PDO is associated with inter-decadal variability [42].
The analysis of Enso events reveals that the lowest Olive yields are recorded during the strongest El Niño evens, that could be explained by the decline of spring months’ rainfall in Morocco during El Niño conditions [50]. It is worth noting that the extreme El Niño episode of 1997–1998 marked abnormal conditions, principally in the Northwestern parts of Morocco [50]. Thus, the investigation of annual reports from the “Office de Mise en Valeur Agricole de Souss-Massa” (ORMVASM) show that, during the years 1997–1998, the Olive tree suffered from unfavorable conditions in addition to damages due to Bactrocera oleae.
Still, several physical parameters are likely to intervene in the rainfed of Olive growth. In their work Xue et al. [51,52,53] suggest a new mechanism that may contribute to extreme events where land surface temperature variability in high elevation influences hydro-climate conditions in downstream areas. The analysis of soil moisture of the top vegetation/soil layer and its anomalies are to take into consideration as parameters of the underlying process, the obtained results from [54,55] indicate a negative linear relationship between soil moisture availability index and land surface temperature during periods of dry land surface anomalies. During events of heatwaves, the surface temperature and soil moisture are strongly influencing the atmosphere temperature and the yields consequently [56]. In the other hand, the works [57] point to a significant contribution to the effect of the vegetation dynamics, on the local to the regional water cycle, and temperature anomalies during heatwaves.
The diminution of the Olive production while the harvested areas are increasing despite the expansion of crops with higher economic value, points probably to the reduction of available water resources in addition to the decrease of annual precipitations since the 1970s [22].
The significant climate change impacts on Olive orchards in Northwestern Africa and Southern Iberia were some of the finding highlights of this work, as well as some parts of Italy where the negative impacts are assessed [58]. Furthermore, the sustainability of the Olive Sector is a tributary of adequate climate information. While several studies rely on simulated yield data, the work results are based on data obtained through observed yields, which emphasizes its importance. [59].
5. Conclusions
The influences of the ENSO, PDO, NAO and IOD on annual olive yield variability in Northwestern Africa have been investigated. We applied lagged Spearman’s correlations and wavelet analysis; both methods were chosen for their adequacy for nonlinear relationship detection.
As a result of this investigation, no statistically significant correlations were obtained between olive yields and with NAO and IOD. In contrast, statistically significant negative correlations were obtained for (lag = −1) with spring and summer NINO 3.4 and with summer and autumn PDO. Also, statistically significant negative correlations were observed during (lag = 0) winter and spring PDO.
The results of wavelet coherence between annual crop yields and PDO and ENSO revealed that the highest values of power spectrum coherence were observed during the (lag = 0) spring PDO and the (lag = −1) spring ENSO, both with an antiphase relationship. These findings highlight the vulnerability of olive cultivars to decadal variability of PDO and interannual variability of Enso activities in arid regions such as Souss-Massa.
The response of olive yields to abnormal conditions of the Enso revealed a decrease of yield values during El Niño years, while an increase was noted during El Niña years in most cases. However, strong El Niño and El Niña events manifest in low olive yields.
Author Contributions
Conceptualization, H.A., L.B. and A.C.; methodology, H.A.; software, H.A.; validation, H.A., L.B. and A.C.; resources, H.A.; data curation, H.A.; writing—original draft preparation, H.A.; writing—review and editing, H.A., L.B. and A.C.; visualization, H.A.; supervision, L.B. and A.C.; project administration, L.B. and A.C.; All authors have read and agreed to the published version of the manuscript.
Funding
This research received no external funding.
Acknowledgments
The authors express their gratitude to the ORMVASM “Office de mise en valeur agricole du Souss-Massa” for access to their data. This work was carried out within the CHARISMA Project with the assistance of the Hassan 2 Academy of Sciences and techniques.
Conflicts of Interest
The authors declare no conflict of interest.
References
- Milewski, A.; Seyoum, W.M.; El kadiri, R.; Durham, M. Multi-Scale Hydrologic Sensitivity to Climatic and Anthropogenic Changes in Northern Morocco. Geosciences 2020, 10, 13. [Google Scholar] [CrossRef]
- Droogers, P.; Immerzeel, W.W.; Terink, W.; Hoogeveen, J.; Bierkens, M.F.P.; Van Beek, L.P.H.; Debele, B. Water resources trends in Middle East and North Africa towards 2050. Hydrol. Earth Syst. Sci. 2012, 16, 3101–3114. [Google Scholar] [CrossRef]
- Niang, I.; Ruppel, O.C.; Abdrabo, M.A.; Essel, A.; Lennard, C.; Padgham, J.; Urquhart, P. Africa. In Climate Change: Impacts, Adaptation, and Vulnerability. Part B: Regional Aspects. Contribution of Working Group II to the Fifth Assessment Report of the Intergovernmental Panel on Climate Change; Barros, V.R., Field, C.B., Dokken, D.J., Mastrandrea, M.D., Mach, K.J., Bilir, T.E., Chatterjee, M., Ebi, K.L., Estrada, Y.O., Genova, R.C., et al., Eds.; Cambridge University Press: Cambridge, UK; New York, NY, USA, 2014; pp. 1199–1265. [Google Scholar]
- Heino, M.; Puma, M.J.; Ward, P.J.; Gerten, D.; Heck, V.; Siebert, S.; Kummu, M. Two-thirds of global cropland area impacted by climate oscillations. Nat. Commun. 2018, 9, 1257. [Google Scholar] [CrossRef] [PubMed]
- Soulard, N.; Lin, H.; Yu, B. The changing relationship between ENSO and its extratropical response patterns. Sci. Rep. 2019, 9, 6507. [Google Scholar] [CrossRef] [PubMed]
- Nicholson, S.E.; Kim, J. The Relationship of the El Niño–Southern Oscillation to African rainfall. Int. J. Climatol. 1997, 17, 117–135. [Google Scholar] [CrossRef]
- Luo, H.; Fei, Z.; Keenlyside, N.; Zhu, J. Ocean–atmosphere coupled Pacific Decadal variability simulated by a climate model. Clim. Dyn. 2020, 54, 4759–4773. [Google Scholar] [CrossRef]
- Anderson, W.B.; Seager, R.; Baethgen, W.; Cane, M.; You, L. Synchronous crop failures and climate-forced production variability. Sci. Adv. 2019, 5, eaaw1976. [Google Scholar] [CrossRef]
- Jarlan, L.; Abaoui, J.; Duchemin, B.; Ouldbba, A.; Tourre, Y.M.; Khabba, S.; Le Page, M.; Balaghi, R.; Mokssit, A.; Chehbouni, A. Linkages between common wheat yields and climate in Morocco (1982–2008). Int. J. Biometeorol. 2013. [Google Scholar] [CrossRef]
- Roudier, P.; Sultan, B.; Quirion, P.; Berg, A. The impact of future climate change on West African crop yields: What does the recent literature say? Glob. Environ. Chang. 2011, 21, 1073–1083. [Google Scholar] [CrossRef]
- Bouchelkha, M. Stress hydrique et crises socio-spatiales dans les campagnes du Souss Massa. In Eaux, Pauvreté et Crises Sociales [en ligne]; IRD Éditions: Marseille, France, 2009. [Google Scholar]
- Bouchaou, L.; Michelot, J.L.; Qurtobi, M.; Zine, N.; Gaye, C.B.; Aggarwal, P.K.; Marah, H.; Zerouali, A.; Taleb, H.; Vengosh, A. Origin and Residence Time of Groundwater in the Tadla Basin (Morocco) Using Multiple Isotopic and Geochemical Tools. J. Hydrol. 2009, 379, 323–338. [Google Scholar] [CrossRef]
- Bouchaou, L.; Tagma, T.; Boutaleb, S.; Hssaisoune, M.; El Morjani, Z. Climate Change and Its Impacts on Groundwater Resources in Morocco: The Case of the Souss- Massa Basin. International Contributions to Hydrogeology. In Climate Change Effects on Groundwater Resources: A Global Synthesis of Findings and Recommendations; IAH Book Series; Treidel, H., Martin-Bordes, J.L., Eds.; CRC Press Taylor & Francis Group: Boca Raton, FL, USA, 2011; Chapter 8; Volume 27, pp. 129–144, 414. ISBN 978-0-415-68936-6. [Google Scholar]
- Hssaisoune, M.; Bouchaou, L.; Sifeddine, A.; Bouimetarhan, I.; Chehbouni, A. Moroccan Groundwater Resources and Evolution with Global Climate Changes. Geosciences 2020, 10, 81. [Google Scholar] [CrossRef]
- Bouchaou, L.; Choukr-Allah, R.; Hirich, A.; Seif-Ennasr, M.; Malki, M.; Abahous, H.; Bouaakaz, B.; Nghira, A. Climate Change and Water Valuation in Souss-Massa Region: Management and Adaptive Measures. Eur. Water 2017, 60, 203–209. [Google Scholar]
- Seif-Ennasr, M.; Zaaboul, R.; Hirich, A.; Caroletti, G.N.; Bouchaou, L.; El Morjani, Z.A.; Beraaouz, E.L.; McDonnell, R.A.; Choukr-Allah, R. Climate change and adaptive water management measures in Chtouka Aït Baha region (Morocco). Sci. Total Environ. 2016, 573, 862–875. [Google Scholar] [CrossRef] [PubMed]
- Mancuso, S.; Pasquali, G.; Fiorino, P. Phenology Modelling and Forecasting in Olive (Olea Europaea, L.) Using Artificial Neural Networks. Adv. Hortic. Sci. 2002, 16, 155–164. Available online: www.jstor.org/stable/42883319 (accessed on 13 December 2020).
- Osborne, C.P.; Chuine, I.; Viner, D.; Woodward, F.I. Olive phenology as a sensitive indicator of future climatic warming in the Mediterranean. Plant Cell Environ. 2000, 23, 701–710. [Google Scholar] [CrossRef]
- Khadari, B.; Charafi, J.; Moukhli, A.; Ater, M. Substantial genetic diversity in cultivated Moroccan olive despite a single major cultivar: A paradoxical situation evidenced by the use of SSR loci. Tree Genet. Genomes 2008, 4, 213–221. [Google Scholar] [CrossRef]
- Uzun, A.; Ustaoğlu, B. Impacts of El Nino Southern Oscillation (ENSO) and North Atlantic Oscillation (NAO) on the Olive Yield in the Mediterranean Region, Turkey. In Proceedings of the 8th International Conference on Agro-Geoinformatics (Agro-Geoinformatics), Istanbul, Turkey, 26–29 July 2019; pp. 1–6. [Google Scholar]
- Gimeno, L.; Ribera, P.; Iglesias, R.; De la Torre, L.; Garcia, R.; Hernandez, E. Identification of empirical relationships between indices of ENSO and NAO and agricultural yields in Spain. Clim. Res. 2002, 21, 165–172. [Google Scholar] [CrossRef]
- Abahous, H.; Guijarro, J.A.; Sifeddine, A.; Chehbouni, A.; Ouazar, D.; Bouchaou, L. Monthly precipitations over semi-arid basins in Northern Africa: Homogenization and trends. Int. J. Climatol. 2020. [Google Scholar] [CrossRef]
- Ait Brahim, Y.; Seif-Ennasr, M.; Malki, M.; N’da, B.; Choukrallah, R.; El Morjani, Z.A.; Sifeddine, A.; Abahous, H.; Bouchaou, L. Assessment of Climate and Land Use Changes: Impacts on Groundwater Resources in the Souss-Massa River Basin. The Souss-Massa River Basin, Morocco. In The Handbook of Environmental Chemistry; Choukr-Allah, L., Bouchaou, R., Ragab, D.B., Eds.; Springer International Publishing Switzerland: Cham, Switzerland, 2016. [Google Scholar] [CrossRef]
- Moukhli, A.; Haouane, H.; El Modafar, C.; Khadari, B. Histoire de l’introduction et de la diffusion de l’oléiculture au Maroc. In Indications Géographiques, Dynamiques Socio-économiques et Patrimoine Bio-culturel en Turquie et dans les Pays Méditerranéens; Ilbert, H., Tekelioglu, Y., Çagatay, S., Tozanli, S., Eds.; CIHEAM: Montpellier, France, 2013; pp. 169–196. [Google Scholar]
- Hadiddou, A.; Oukabli, A.; Moudaffar, C.; Mamouni, A.; Gaboun, F.; Mekaoui, A.; H’ssaini, L.; El Fechtali, M. Evaluation des Performances de Production de14 Varietes d’olivier (olea Europaea L.) Nationales et Méditerranéennes dans deux Systèmes Contrastés de Culture (Pluvial et Irrigué) au Maroc; Revue AL AWAMIA: Rabat, Morocco, 2013; pp. 21–43. ISSN 0572-2721. [Google Scholar]
- Tian, D.; Asseng, S.; Martinez, C.J.; Misra, V.; Cammarano, D.; Ortiz, B.V. Does decadal climate variation influence wheat and maize production in the southeast USA. Agric. For. Meteorol. 2015, 204, 1–9. [Google Scholar] [CrossRef]
- Grinsted, A.; Moore, J.C.; Jevrejeva, S. Application of the cross wavelet transform and wavelet coherence to geophysical time series. Nonlinear Process. Geophys. 2004, 11, 561–566. [Google Scholar] [CrossRef]
- Torrence, C.; Compo, G.P. A practical guide to wavelet analysis. Bull. Am. Meteorol. Soc. 1998, 79, 61–78. [Google Scholar] [CrossRef]
- Hipel, K.W.; McLeod, A.I. Time Series Modelling of Water Resources and Environmental Systems; Elsevier Science: New York, NY, USA, 1994. [Google Scholar]
- Libiseller, C.; Grimvall, A. Performance of partial Mann-Kendall tests for trend detection in the presence of covariates. Environmetrics 2002, 13, 71–84. [Google Scholar] [CrossRef]
- Sen, P.K. Estimates of the regression coefficient based on Kendall’s tau. J. Am. Stat. Assoc. 1968, 63, 1379–1389. [Google Scholar] [CrossRef]
- Wilks, D.S. Statistical Methods in the Atmospheric Sciences; Academic Press: Burlington, MA, USA; Elsevier: Amsterdam, The Netherlands, 2006. [Google Scholar]
- Lees, J.M.; Park, J. Multiple-taper spectral analysis: A stand-alone C-subroutine. Comput. Geosci. 1995, 21, 199–236. [Google Scholar] [CrossRef]
- Altunkaynak, A.; Ozger, M. Comparison of discrete and continuous wavelet multilayer perceptron methods for daily precipitation prediction. J. Hydrol. Eng. 2016, 21, 04016014. [Google Scholar] [CrossRef]
- Najmi, A.H.; Sadowsky, J. The continuous wavelet transform and variable resolution time frequency analysis. Johns Hopkins APL Tech. Dig. 1997, 18, 134–140. [Google Scholar]
- Labat, D. Cross wavelet analyses of annual continental freshwater discharge and selected climate indices. J. Hydrol. 2010, 385, 269–278. [Google Scholar] [CrossRef]
- Torres, M.; Pierantozzi, P.; Searles, P.; Rousseaux, M.C.; García-Inza, G.; Miserere, A.; Bodoira, R.; Contreras, C.; Maestri, D. Olive Cultivation in the Southern Hemisphere: Flowering, Water Requirements and Oil Quality Responses to New Crop Environments. Front. Plant Sci. 2017, 8, 1830. [Google Scholar] [CrossRef]
- Rayner, N.A.; Parker, D.E.; Horton, E.B.; Folland, C.K.; Alexander, L.V.; Rowell, D.P.; Kent, E.C.; Kaplan, A. Global analyses of sea surface temperature, sea ice, and night marine air temperature since the late nineteenth century. J. Geophys. Res. 2003, 108, 4407. [Google Scholar] [CrossRef]
- Rasmusson, E.M.; Thomas, H.C. Variations in Tropical Sea Surface Temperature and Surface Wind Fields Associated with the Southern Oscillation/El Niño. Mon. Weather Rev. 1982, 110, 354–384. [Google Scholar] [CrossRef]
- Trenberth, K.E. The Definition of El Niño. Bull. Am. Meteorol. Soc. 1997, 78, 2771–2777. [Google Scholar] [CrossRef]
- Trenberth, K.E.; Stepaniak, D.P. Indices of El Niño evolution. J. Clim. 2001, 14, 1697–1701. [Google Scholar] [CrossRef]
- Hurrell, J.W. Decadal trends in the North Atlantic Oscillation and relationships to regional temperature and precipitation. Science 1995, 269, 676–679. [Google Scholar] [CrossRef]
- Osborn, T.J. Winter 2009/2010 temperatures and a record-breaking North Atlantic Oscillation index. Weather 2011, 66, 19–21. [Google Scholar] [CrossRef]
- Jones, P.D.; Jónsson, T.; Wheeler, D. Extension to the North Atlantic Oscillation using early instrumental pressure observations from Gibraltar and South-West Iceland. Int. J. Climatol. 1997, 17, 1433–1450. [Google Scholar] [CrossRef]
- Zhang, Y.; Wallace, J.M.; Battisti, D.S. ENSO-like interdecadal variability: 1900–1993. J. Clim. 1997, 10, 1004–1020. [Google Scholar] [CrossRef]
- Mantua, N.J.; Hare, S.R.; Zhang, Y.; Wallace, J.M.; Francis, R.C. A Pacific interdecadal climate oscillation with impacts on salmon production. Bull. Am. Meteorol. Soc. 1997, 78, 1069–1079. [Google Scholar] [CrossRef]
- Deser, C.; Trenberth, K.; National Center for Atmospheric Research Staff. Last modified 06 Jan 2016. “The Climate Data Guide: Pacific Decadal Oscillation (PDO): Definition and Indices”. Available online: https://climatedataguide.ucar.edu/climate-data/pacific-decadal-oscillation-pdo-definition-and-indices (accessed on 2 December 2020).
- Saji, N.H.; Yamagata, T. Possible impacts of Indian Ocean Dipole mode events on global climate. Clim. Res. 2003, 25, 151–169. [Google Scholar] [CrossRef]
- Bonofiglio, T.; Orlandi, F.; Sgromo, C.; Romano, B.; Fornaciari, M. Influence of temperature and rainfall on timing of olive (Olea europaea) flowering in southern Italy. N. Z. J. Crop Hortic. Sci. 2008, 36, 59–69. [Google Scholar] [CrossRef]
- Driouech, F. Distribution des Précipitations Hivernales sur le Maroc Dans le Cadre d’un Changement Climatique: Descente D’échelle et Incertitudes. Ph.D. Thesis, University of Toulouse, Toulouse, France, 2010; p. 13. [Google Scholar]
- Xue, Y.; Vasic, R.; Janjic, Z.; Liu, Y.M.; Chu, P.C. The impact of spring subsurface soil temperature anomaly in the western U.S. on North American summer precipitation—A case study using regional climate model downscaling. J. Geophys. Res. 2012, 117. [Google Scholar] [CrossRef]
- Xue, Y.; Oaida, C.M.; Diallo, I.; Neelin, J.D.; Li, S.; De Sales, F.; Gu, Y.; Robinson, D.A.; Vasic, R.; Yi, L. Spring land temperature anomalies in northwestern US and the summer drought over Southern Plains and adjacent areas. Environ. Res. Lett. 2016, 11, 044018. [Google Scholar] [CrossRef]
- Xue, Y.; Diallo, I.; Li, W.; Neelin, J.D.; Chu, P.C.; Vasic, R.; Guo, W.; Li, Q.; Robinson, D.A.; Zhu, Y.; et al. Spring land surface and subsurface temperature anomalies and subsequent downstream late spring-summer droughts/floods in North America and East Asia. J. Geophys. Res. Atmos. 2018, 123, 5001–5019. [Google Scholar] [CrossRef]
- Stoyanova, J.S.; Georgiev, C.G. SVAT modelling in support to flood risk assessment in Bulgaria. Atmos. Res. 2013, 123, 384–399. [Google Scholar] [CrossRef]
- Stoyanova, J.; Georgiev, C.; Neytchev, P.; Kulishev, A. Spatial-Temporal Variability of Land Surface Dry Anomalies in Climatic Aspect: Biogeophysical Insight by Meteosat Observations and SVAT Modeling. Atmosphere 2019, 10, 636. [Google Scholar] [CrossRef]
- Stoyanova, J.; Georgiev, C.; Neytchev, P. Using land surface analyses to assess weather extremes: Heat waves and drought effects. In Proceedings of the 5th SALGEE Workshop, ‘MSG Land Surface Applications: Heat Waves, Drought Hazard and Fire Monitoring’, EUMETSAT, Yerevan, Armenia, 18–20 September 2017; Available online: https://training.eumetsat.int/mod/folder/view.php?id=12706 (accessed on 2 December 2020).
- Stéfanon, M.; Drobinski, P.; d’Andrea, F.; de Noblet-Ducoudré, N. Effects of interactive vegetation phenology on the 2003 summer heat waves. J. Geophys. Res. Atmos. Am. Geophys. Union 2012, 117, D24103. [Google Scholar] [CrossRef]
- Fraga, H.; Pinto, J.G.; Viola, F.; Santos, J.A. Climate change projections for olive yields in the Mediterranean Basin. Int. J. Climatol. 2020, 40, 769–781. [Google Scholar] [CrossRef]
- Ubilava, D.; Abdolrahimi, M. The El Niño impact on maize yields is amplified in lower income teleconnected countries. Environ. Res. Lett. 2019, 14, 054008. [Google Scholar] [CrossRef]
Publisher’s Note: MDPI stays neutral with regard to jurisdictional claims in published maps and institutional affiliations. |
© 2021 by the authors. Licensee MDPI, Basel, Switzerland. This article is an open access article distributed under the terms and conditions of the Creative Commons Attribution (CC BY) license (http://creativecommons.org/licenses/by/4.0/).