1. Introduction
When disasters such as earthquakes, typhoons, and floods occur, appropriate evacuation methods for evacuees are crucial to keep evacuees safe. Various factors can determine the specific situations of evacuees. These include the physical features of individuals, population distributions, and the environment of the disaster areas. Thus, analyzing the factors that characterize the particular situations of disaster evacuees can provide a solution for developing evacuation strategies.
Some evacuees, such as the elderly, children, pregnant women, the injured, and disabled people are regarded as the “
disaster weak” [
1,
2]. Due to their limited physical abilities, they are assumed to have more difficulty evacuating than healthy people. As the population of elderly people is dramatically increasing in developed countries, especially in Japan, burdens in disaster situations cannot be ignored. For example, the statistics of the East Japan earthquake in 2011 by the National Police Agency reported that the death toll of people who were aged 60 and over accounted for more than 60% of the total deaths in three prefectures, i.e., Iwate, Miyagi, and Fukushima [
3]. In addition, according to the annual report on the aging society by the Cabinet Office, Japan (
https://www8.cao.go.jp/kourei/english/annualreport/2019/pdf/2019.pdf (accessed on 30 April 2021)), the population of elderly people aged 65 and above is estimated to reach over 38% of Japan’s total population by 2065. As the number of elderly people significantly increases, there will also be more vulnerable people in disaster situations. Hence, it is necessary to develop evacuation strategies from the perspective of alleviating the burdens and realizing the immediate evacuation for the disaster weak.
Traditional evacuation strategies generally guide evacuees to the closest shelter from their locations [
4,
5,
6]. However, if many evacuees are localized to a certain area and all move to the closest shelter, then some of the evacuees may be refused access because the shelter is not able to accommodate all the incoming evacuees. This forces evacuees to look for other shelters and delays evacuation. To solve such a problem, Umeki et al. have developed an evacuation shelter decision method that considers the bias of congestion of evacuees in a disaster area [
7]. They defined the combinatorial optimization problem of evacuees and shelters. This method decides destinations for each evacuee depending on the predicted evacuation time and capacities of shelters. Therefore, the method can reduce overall evacuation time compared to the traditional methods such as the short-path selection and the random selection methods because it can assign evacuees to suitable shelters in advance so that evacuees will not be rejected by shelters. However, the disaster weak are not considered in our previous research.
Giving priority to the disaster weak for shelter decision, to minimize their evacuation time, would be a simple and reasonable idea. However, even if an evacuation system decides the destination for each evacuee, some evacuees may ignore the guidance. Although an evacuee arrives at the shelter that is decided by the system, the evacuee may not be able to enter the shelter because it is filled. When the disaster weak are refused access by shelters, the delay will be further increased. Thus, the behavior of evacuees can also cause delays, so we must consider these behaviors when we develop evacuation strategies.
In this paper, we newly propose two evacuation methods that consider the disaster weak and evacuee behavior: (1) Fixed-rate Reduction Method (FRM) and (2) Simulation-based Reduction Method (SRM). To be specific, the first method sets the assignment number at the same percentage for all shelters, and the second method conducts simulations of evacuation scenarios before setting the assignment numbers. The challenge in this study is how we should assign evacuees quickly to shelters, easing burdens on the disaster weak even if some evacuees are not cooperative with evacuation instructions. We adopt the key approach that decides destinations for each evacuee depending on predicted evacuation time and capacities of shelters in order to solve the challenge. The major contributions of this paper are summarized as follows:
First, we focus on the issues of the disaster weak and critical support for their quick evacuation. To support the disaster weak, our strategy not only gives priority to them but also tries to avoid burdening them further due to evacuees’ selfish behaviors. To achieve this, we extend the procedure of limiting the assignment number of each shelter to the method by Umeki et al. [
7], and the disaster weak are also given priority in the shelter decision procedure.
Second, we further propose a unique method for assigning evacuees to shelters. We conduct simulations of evacuation behavior to estimate how the disaster weak will be affected when evacuees ignore evacuation instructions. The estimation determines how to assign evacuees to shelters. We estimate which shelters get crowded and how many evacuees will be rejected in advance. Based on the estimation result, we set the maximum number of evacuees to assign to each shelter.
Finally, we evaluate our methods using multi-agent system simulations for the scenario of evacuation of 30,000 visitors for Gion Festival to show the effectiveness of the proposed methods. As a result, our methods can reduce the average evacuation time of the disaster weak and evacuate more of the disaster weak in a shorter time compared with the existing methods when the number of evacuees who are non-cooperative is less than the expected number.
The rest of this paper is organized as follows.
Section 2 explains the existing related work.
Section 3 describes the previous research that is the basis of the proposed methods.
Section 4 describes the details of the proposed methods.
Section 5 describes the performance evaluations using multi-agent simulations, and
Section 6 discusses simulation results. Finally,
Section 7 concludes this paper.
2. Related Work
In this section, we first describe the existing work for disaster events and evacuation strategies including those that address the disaster weak. Then, we highlight the shortcomings of the existing work, and we state the research goal of this study.
2.1. Studies for Disaster Events
A number of studies have approached the evacuation problem in a disaster situation from various perspectives. These approaches include evacuation-route guidance [
5,
6,
8,
9,
10], disaster-map generation [
11] and the distribution of non-internet-based disaster communication system applications [
12].
Sbayti et al. [
13] have proposed the modified system-optimal dynamic traffic assignment formulation to minimize network clearance time. Their scheduling evacuation operation recommends departure time, destinations, and routes for each evacuee and showed significant improvement over the simultaneous case. In their experiments, all evacuees and vehicles follow the system, thus they did not consider evacuees ignoring evacuation instructions. Chanta et al. [
4] have proposed the optimization model to find appropriate shelter locations during flood situations. They attempted to maximize the number of victims that can be covered and reach a shelter within a fixed distance and minimize the total distance of all victims to their closest shelters. This study did not consider how victims are distributed in disaster areas and evacuation behaviors of evacuees.
Multi-agent systems and simulation techniques are widely used for researching disaster events. Chen et al. [
14] have investigated the effectiveness of simultaneous and staged evacuation strategies using agent-based simulation. In this study, they stated that there is no evacuation strategy that can be considered as the best strategy because the performance of the strategies depends on road network structure and population density. In their experiments, the population density of each block is the same. This means the bias of congestion is not considered in the study. Mas et al. [
15] have introduced an evacuation model integrated with a numerical simulation of a tsunami and a casualty estimation evaluation. They use tsunami modeling and developed an evacuation model considering human behavior from questionnaires. Furthermore, they stated that their evacuation model allows one to study the behavior of individuals during the complex process of evacuation. However, this study did not propose an evacuation strategy for each individual.
Bangate et al. [
16] have proposed a multi-agent model approach integrating social attachment and spatial elements of evacuation behaviour in simulating seismic crises. They provided realistic models of human behavior in evacuation scenarios; however, they did not show the specific evacuation strategies in the study. Sharbini et al. [
17] have shown the impact of obstacles in crowd evacuation. They referred to the “faster is slower” theory and stated that obstacles make evacuees move faster while going through an exit. Makinoshima et al. [
18] have proposed the evacuation simulation model using parallel computing to achieve an urban-scale microscopic evacuation simulation. The model they developed is capable of evaluating evacuee congestions in small environments and decreases calculating costs in urban-scale characterization.
Various problems in disaster situations and methods by which to cope with these problems have been discussed so far. However, these existing studies do not consider supporting the disaster weak. Furthermore, many evacuation strategies adopt the shortest path algorithm or guide evacuees to the nearest destinations from their present locations. Therefore, these studies do not consider the distribution and congestion of evacuees in disaster areas with the existence of both the disaster weak and healthy people.
2.2. Studies on People with Disabilities in Disaster Situations
Several studies have addressed evacuees with disabilities in disaster situations so far. McGuire et al. [
19] have explored how the behavioral risk factor surveillance system can be used to estimate the number of community-dwelling older adults who have a disability for use in disaster planning and preparation. Arai et al. [
20] have proposed the rescue model for disabled people. This method decides which volunteers should help disabled people considering the complexity of the road network, the panic level of volunteers, the disability level of victims, and the disconnectivity between the agent and the emergency center. A number of studies [
21,
22,
23] have developed the Exitus system considering individuals with disabilities for evacuation in high-rising buildings. Christensen et al. [
24,
25] also have evaluated how effectively the built environment accommodates the needs of individuals with disabilities during emergency evacuations by using agent-model. The results of the experiments conducted show that there is a significant difference in mean evacuation between populations with disabled people and population without them, and the difference becomes larger as the population size increases. Furthermore, they emphasized how vulnerable physically impaired people are during evacuation and the importance of considering individuals with disabilities in evacuation planning. Still, these studies are for in-building evacuation situations and do not cover outdoor evacuation situations.
2.3. Our Approach
To the best of our knowledge, not much work has been done on outdoor evacuation strategies that support the disaster weak as well as situations where a large number of evacuees are distributed in specific areas. Our study focuses on the disaster weak in crowded areas. Thus, we propose evacuation methods to evacuate a large number of evacuees, including the disaster weak, quickly. To develop our proposed methods, we build upon the previous work that considers the bias of congestion of evacuees by Umeki et al. [
7]. In the next section, as the preliminary work, we explain the details of this existing method and its problems related to the disaster weak.
3. Preliminary Work
In this section, we describe the existing work [
7], the shelter determination method, which is the basic concept for developing our proposed methods.
3.1. Outline and Prerequisite
In the existing work, they supposed a situation where disaster areas are crowded with evacuees who are incapable of going home. Evacuees have to evacuate to places in which people can stay for at least one day. In such a situation, “shelters” refers to buildings that are able to accommodate several people for a certain period of time. Each shelter has its own capacity limit. If all evacuees move to the nearest shelters in the disaster situation, some of them are rejected because it is filled. This causes delays in evacuation. To deal with this problem, we attempted to minimize evacuation time considering the bias of congestion and capacities of shelters. The evacuation system collects the location data of evacuees and shelters and information on whether each evacuee is the disaster weak from sensors in the city and the evacuees’ devices. Then, the system estimates evacuation time from these information. Evacuees obtain evacuation instructions on the applications installed in their devices and evacuate following the instructions. In the scenarios in their work, they assume that such an evacuation shelter decision system is widespread, and all of the evacuees have devices that this application is installed in.
3.2. Method by Solving Combinatorial Optimization Problem
Common evacuation strategies guide evacuees to the nearest destinations. Evacuees can move to the nearest shelters when evacuees are evenly distributed. However, in crowded areas, such as cities with a high population density or sightseeing spots, the distribution of people is uneven. In such cases, if evacuees go to the closest shelters, some shelters may not be able to accommodate all incoming evacuees because the number of the evacuees may exceed the capacities of shelters. Then, some evacuees may be turned away by the nearest shelters upon arrival. To tackle this, Umeki et al. proposed a method involving solving the combinatorial optimization problem [
7] (hereinafter referred to as COP). This method considers the congestion of evacuees and capacities of shelters.
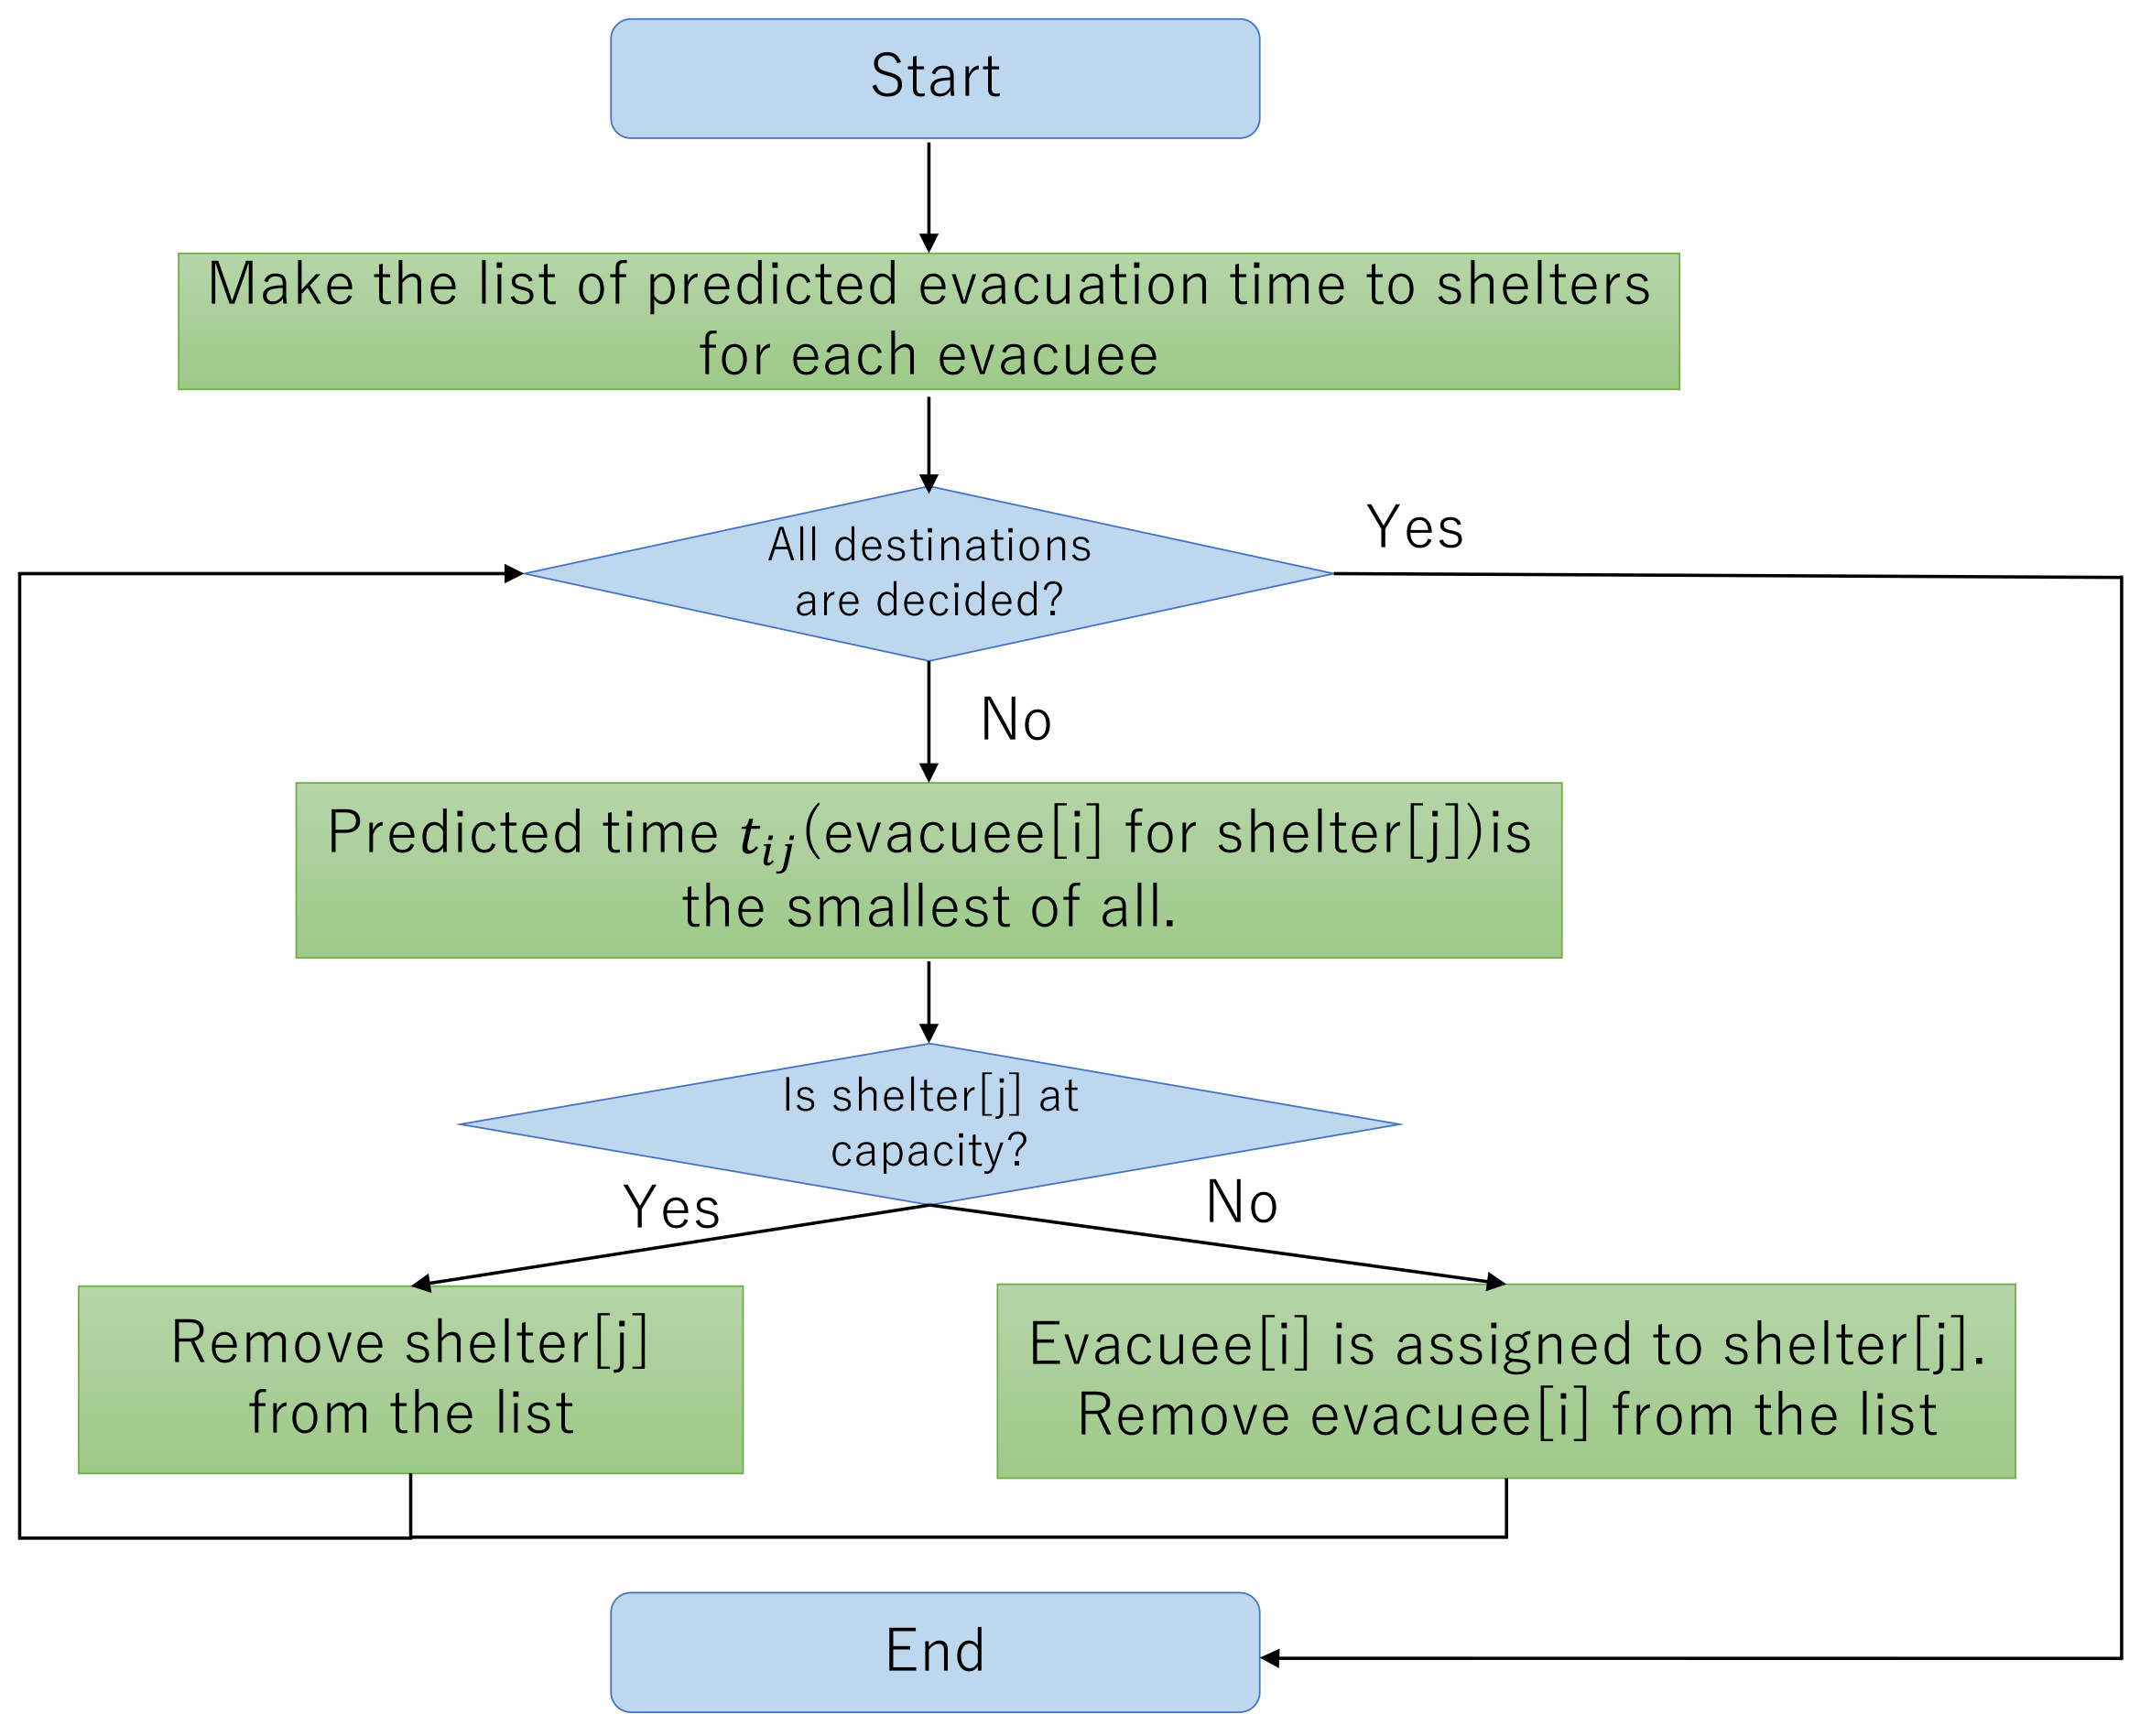
Figure 1 shows the flowchart of COP. The details of COP are as follows. First, the system calculates the estimated evacuation time based on the location of each evacuee to each shelter and makes an evacuation time list.
Table 1 is one example of an evacuation time list involving five evacuees and three shelters. Then, for each shelter, we sort the evacuation time elements in increasing order. A sorting algorithm is applied to
Table 1, resulting in
Table 2. Based on the sorted evacuation time list, destinations for each evacuee are decided. In emergent disaster situations, quick guidance for evacuees is required. Thus, an evacuation method should be a method with less complexity and less computational time. In addition, it is desirable that decisions are acceptable to evacuees. Considering these requirements, the method preferentially decides the shortest evacuation time set. Taking
Table 2 for example, Evacuee_1 is firstly chosen to evacuate to Shelter 0 because the evacuation time for Evacuee_1 to Shelter 0 is the shortest (shown in bold in
Table 2). Secondly, Evacuee_2 is chosen for Shelter 1. Next, Evacuee_3 is chosen for Shelter 2 and Evacuee_4 is chosen for Shelter 2. Finally, Shelter 2 is chosen as the destination for Evacuee_5, and the method ends. Compared to the shortest-route-selection method, the average evacuation time of evacuees is shortened by using COP. COP exhibits better performance than the shortest-route selection method.
3.3. Problems with COP Involving Disaster Weak
Now, we explain the problem of COP in situations in which the disaster weak are present. The disaster weak, such as the elderly and disabled people, will take more time to evacuate than healthy people because of limitation in their physical skills, as well as other reasons.
Table 3 is an example of an evacuation time list that includes the disaster weak. In this case, Evacuees 4 and 5 are the disaster weak. Since COP sorts the list in increasing order, elements with a long evacuation time are placed on the bottom of the list.
Table 3 is reordered as
Table 4.
As explained above, sets of an evacuee and a shelter with a shorter evacuation time have high priority for decisions. Therefore evacuees who require a lot of time to evacuate, such as the disaster weak, have a tendency to be assigned later. Destinations for the disaster weak will thus tend to be farther than the nearest shelter, which is burdensome for them. Giving priority to the disaster weak in shelter decisions is assumed to help the disaster weak evacuate to the nearest shelters in a short time. Furthermore, this idea will be effective when all evacuees follow the guidance. However, in reality, there is a possibility that some evacuees will not take action as the system recommends. If an evacuee arrives late at the assigned shelter, he or she may be refused because the shelter has reached capacity. When the disaster weak are refused, they will be further burdened, and evacuation delays will become greater.
In consideration of these serious problems, when we develop evacuation strategies, we must consider how evacuees act and how to bridge the gap between healthy people and the disaster weak. In the next section, we explain novel two proposed methods considering the disaster weak and evacuee behavior in order to tackle these problems.
4. Proposed Methods
In this section, we propose evacuation shelter determination methods which attempts to minimize evacuation time of all evacuees. To be specific, we focus on shortening evacuation time of the disaster weak, who have limited physical abilities.
4.1. Outline
As explained in
Section 3, due to lack of consideration of the disaster weak, COP can be burdensome for the disaster weak. Furthermore, evacuees will get a greater burdens if non-cooperative evacuees do not follow or miss seeing evacuation instructions. To deal with these serious problems, we introduce two key methods for assigning evacuees to shelters. These methods set the number of evacuees who are assigned to shelters to be less than their capacities, assuming that more people will come to shelters than the assigned numbers. After setting the assignment numbers, the methods assign the destinations of the disaster weak in the procedure of COP prior to healthy people. To be specific, the first method, which is called Fixed-rate Reduction Method (hereinafter referred to as FRM), sets the assignment number at the same percentage for all shelters. The second one, Simulation-based Reduction Method (hereinafter, referred to as SRM), conducts simulations of evacuation scenarios before setting the assignment numbers. The objective of simulations is to see how shelters will be crowded and how many evacuees will be rejected by shelters. Then, the method sets the assignment number of evacuees to shelters based on the estimation results of the simulations. To describe in detail our methods, we set variable definitions as shown in
Table 5.
4.2. Fixed-Rate Reduction Method (FRM)
In this section, we describe the Fixed-rate Reduction Method (FRM). Considering evacuees who do not follow evacuation instructions, we have to expect that more evacuees than the number assigned by the evacuation system will arrive at shelters to make some room and limit the numbers of evacuees assigned to shelters instead of assigning the same numbers of evacuees as the capacities.
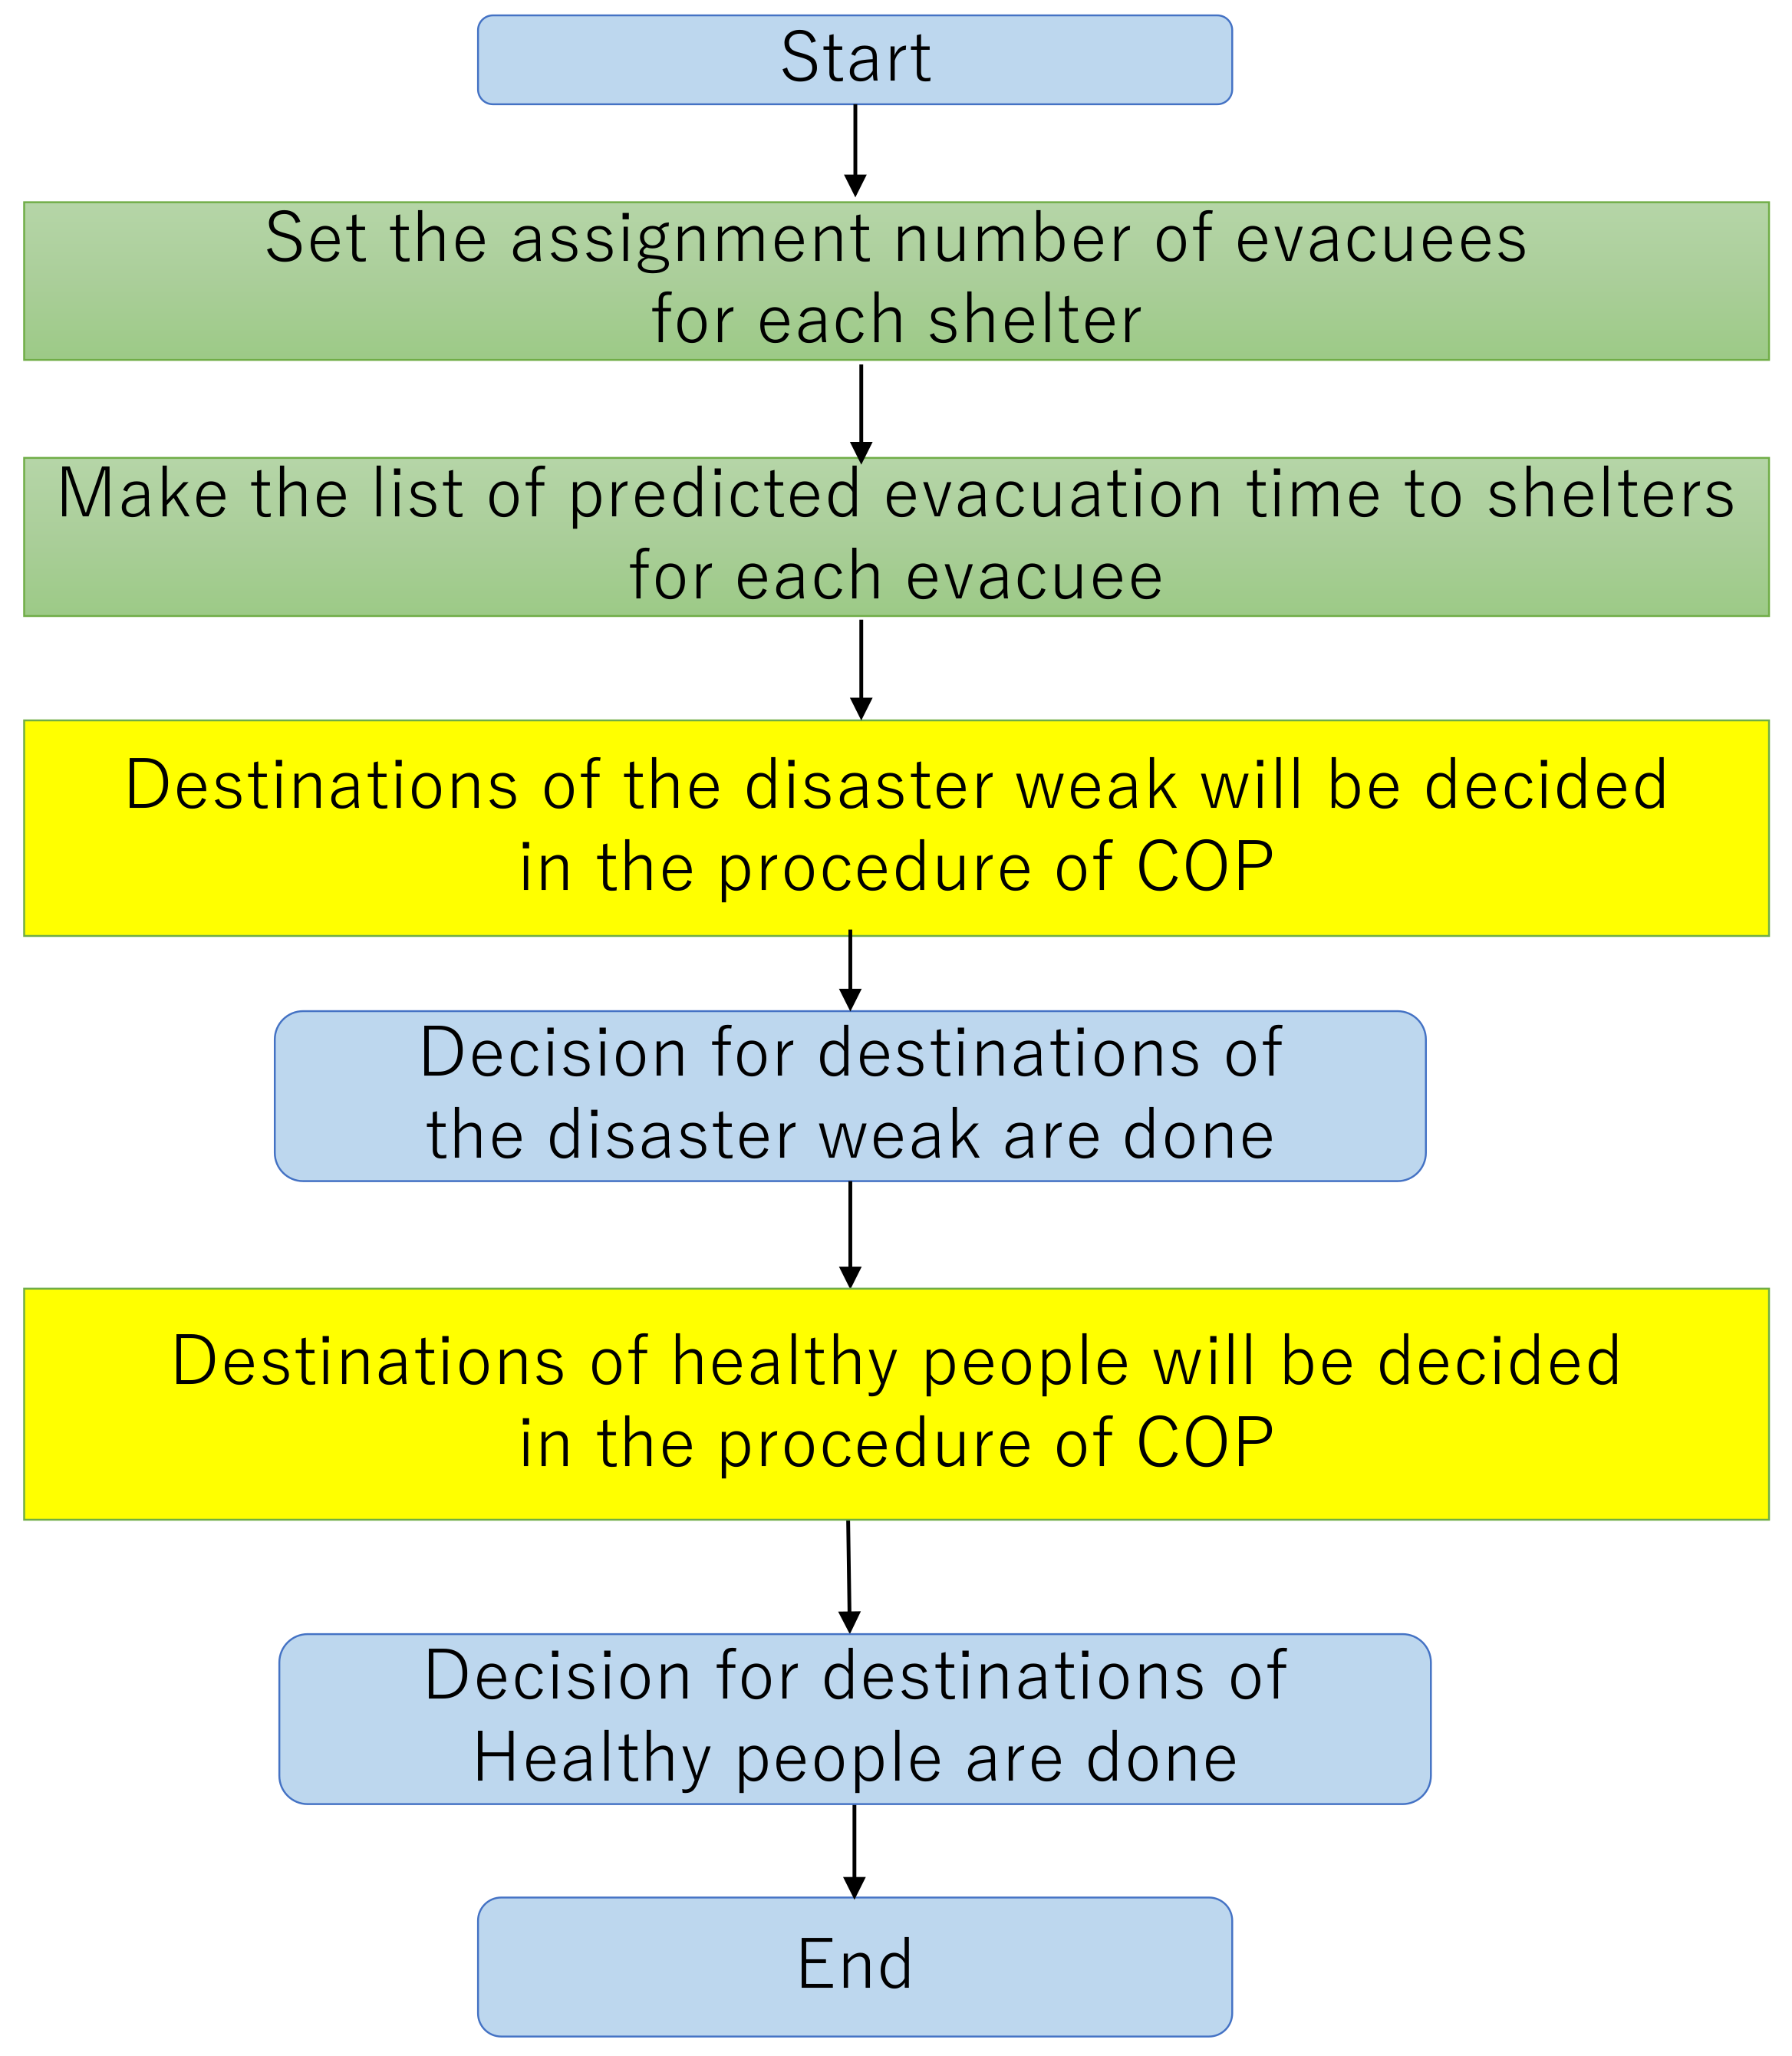
Figure 2 shows a flowchart of FRM. The number of evacuees assigned to each shelter, denoted
, is defined as:
where
is the capacity of Shelter
i and
r is the margin rate for shelters (0 ≤
r < 1). When we set the assigning number, the following condition must be satisfied:
where
s is the number of all shelters and
E is the number of all evacuees. Next, we apply COP with priority for the disaster weak to evacuees. In this step, we decide destinations for the disaster weak first. Then, we decide shelters for healthy people after deciding shelters for all of the disaster weak. Taking
Table 3 for example, this table is reordered as in
Table 6. The method initially decides Shelter 1 as the destination for Evacuee_5 because the evacuation time of Evacuee_5 to Shelter 1, 50 min, is the shortest time for the disaster weak. Then, Shelter 0 is decided as the destination for Evacuee_4. After deciding all destinations of the disaster weak, decisions will be performed as follows. Evacuee_2 is assigned to Shelter 1, Evacuee_3 is assigned to Shelter 2, and Evacuee_1 is assigned to Shelter 2.
4.3. Simulation-Based Reduction Method (SRM)
In this section, we describe the Simulation-based Reduction Method (SRM). In FRM, as the value of margin rate
r increases, the condition equation is not satisfied and it is impossible to decide the destinations of all evacuees due to the lack of decision slots. To solve this problem, we propose a method for limiting the number of evacuees assigned to shelters based on the results of simulations to predict congestion in the entire disaster area.
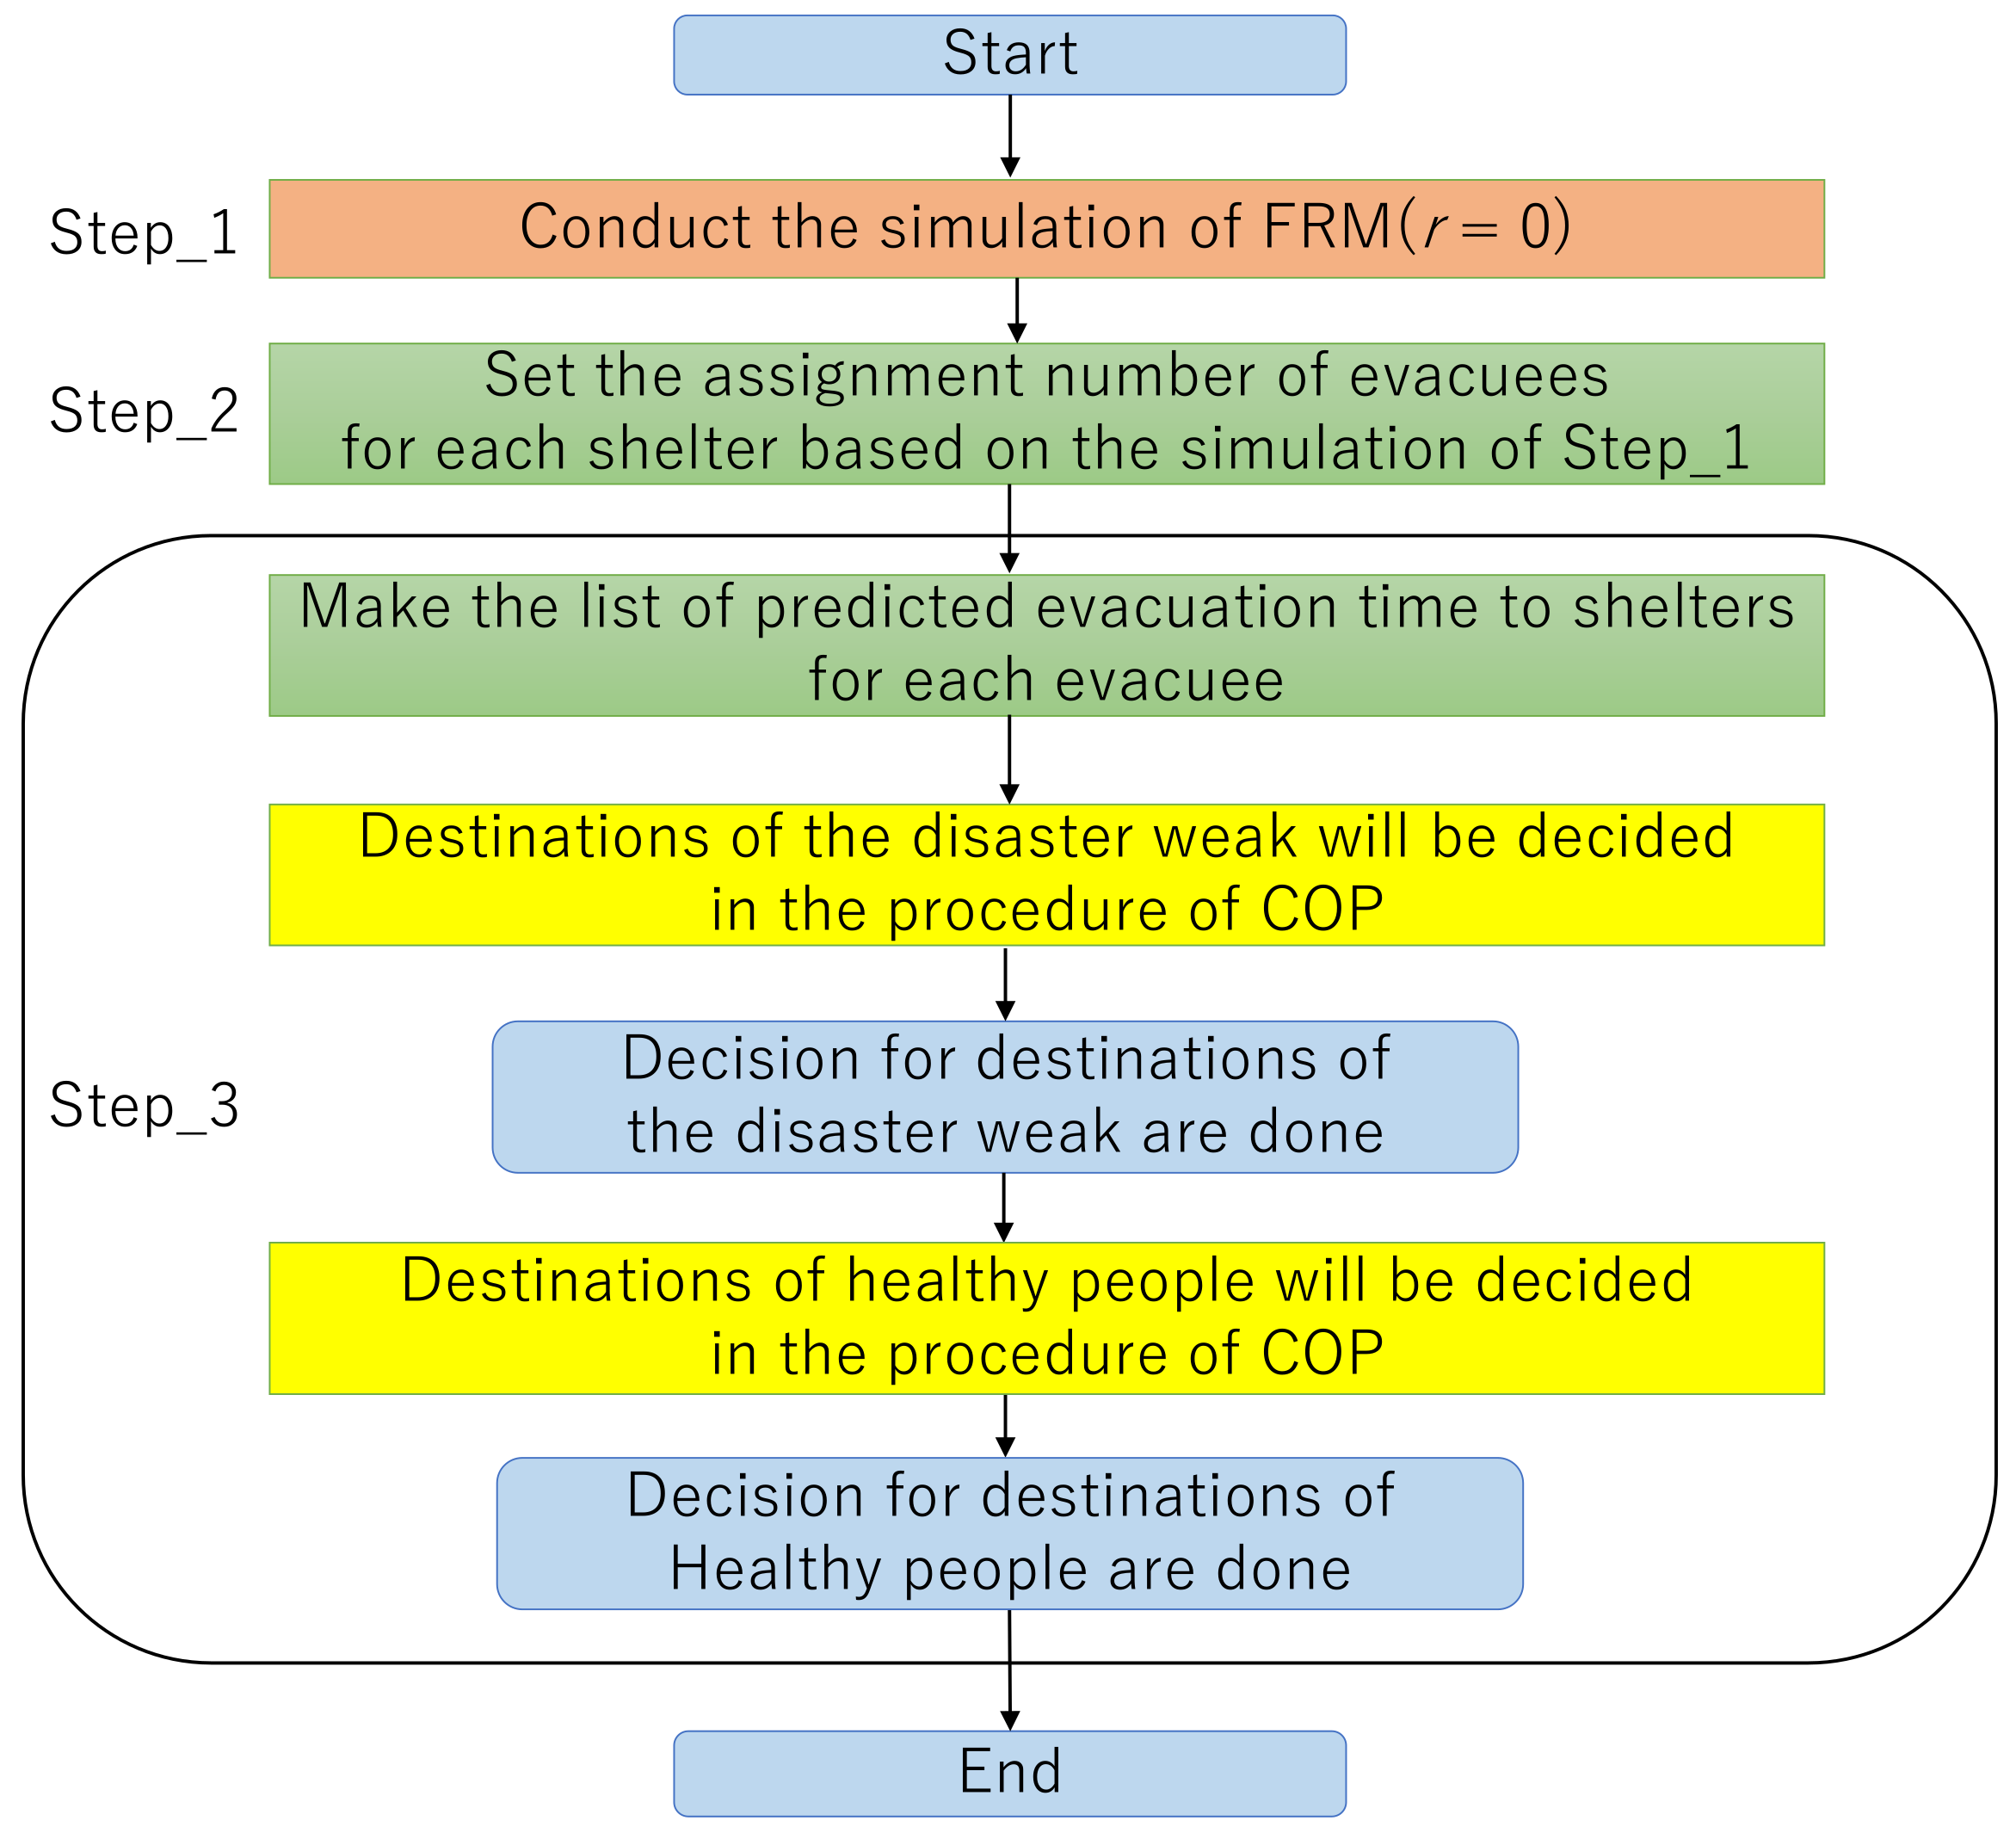
Figure 3 shows a flowchart of SRM. This method is composed of the following three steps.
Step_1: Detecting which shelters will be crowded by simulation
For Step_1, we simulate the following scenario: “FRM with a margin rate r = 0 is applied to evacuees. However, all healthy people head to their nearest shelters in spite of the evacuation instructions.” The scenario we simulate in this step assumes that the disaster weak are burdened because all healthy people are not cooperative with the evacuation instructions, although the disaster weak are given the priority for shelter decision. The objective of this step is to detect which shelters will be crowded and how many evacuees will be rejected by shelters due to non-cooperative evacuees’ behavior and no limitation on the assigning numbers of evacuees to shelters. To be specific, the results the simulation outputs include the following:
Step_2: Setting the number of evacuees to assign
For Step_2, we use results from the simulation to set assignment numbers for shelters. Our proposed method attempts to minimize refusal from shelters and the burdens on the disaster weak. We arrange the assignment numbers for the shelters where the disaster weak will be refused. Limiting the number of evacuees assigned to shelters to less than the total capacity of shelter can increase the number of evacuees who will take more time to evacuate and may not follow the instructions from the system. The variable
, which denotes the decreased number of evacuees to assign to shelter
i, can be defined as follows:
At the same time,
represents the number of healthy people who will arrive at shelter
i regardless of evacuation instructions.
The capacity of the number denoted as
will be used for these non-cooperative healthy people. From variables
,
and the margin rate denoted as
r, the following equation can be defined as:
From Equations (
3) and (
4),
is defined as:
In some cases,
can be negative. However, as shown in
Table 5,
must be greater than or equal to 0. Therefore, if
is negative,
will be 0. Of course, when we set the assigning number, the following condition must be satisfied:
Step_3: Combinatorial optimization problem method with priority for disaster weak
For Step_3, similarly to FRM, the disaster weak will be given the priority for shelter decisions.
5. Performance Evaluations
In this section, to show the effectiveness of the proposed methods, we conducted the performance evaluations by utilizing multi-agent system simulation.
Table 7 shows the parameter setting of the simulation. We first describe the evaluation environments in this simulation. Then, we describe the simulation parameters and the comparison methods. Finally, we describe the results obtained from the simulation.
5.1. Evaluation Environments
In the evaluation, we used Scenargie, the simulation framework and Scenargie Multi-Agent Extension Module produced by Space-Time Engineering Japan Inc. (
https://www.spacetime-eng.com/en/ (accessed on 30 April 2021)). The computer specs used in this evaluation have the following performance:
As an example of crowded sightseeing areas, we used the Kyoto Gion Festival, which is one of the most famous festivals in Japan, as the evaluation scenario. Geographic information system (GIS) data were taken from OpenStreetMap (
https://www.openstreetmap.org/ (accessed on 30 April 2021)). The map for the simulation has an area of 2.5 km × 2.5 km. Furthermore, several articles [
26,
27,
28,
29] reported that the festival had approximately 150,000 visitors in two days in 2019: 17th July, Sakimatsuri, and 24th July, Atomatsuri. A total of 120,000 of the people visited on 17th, and the remaining, 30,000 of them on 24th. Based on these reports, we set 30,000 agents as evacuees. We set the percentage of the disaster weak based on the surveys of sightseeing in Kyoto city [
30] and population estimation by Statistics Bureau of Japan [
31]. To be specific, the survey of Kyoto city [
30] reported that approximately 44% of the visitors are aged 60 and over. Furthermore, Statistics Bureau of Japan [
31] reported that the population of Japan aged 75 and over is around 18 million, accounting for approximately 40% of the population aged 60 and over. Considering the surveys, we assume that 40% of the visitors aged 60 and over are over 75 years old; that is, they make up 17% of all of the visitors. Moreover, taking into account children under 10 years old and people with disabilities, we set the percentage of the disaster weak at 20% in this scenario, therefore, 6000 agents (20% of the agents) were set as the disaster weak.
5.2. Parameters
In this section, we describe the following simulation parameters: (1) walking speed; (2) initial locations; (3) shelter capacity; (4) evacuees behavior.
5.2.1. Walking Speed
Due to their physical abilities, the walking speed of the disaster weak differs from that of healthy people. We define
v which is the standard walking speed of an evacuee as the following equation:
Here, the standard walking speed means the walking speed of a person at which he/she freely walks on a road without any obstacles. However, the actual walking speed of an evacuee in the event of disasters dynamically changes due to road situations such as the population density on the road (the congestion level). Thus, referring to the Cabinet Office’s document (
http://www.bousai.go.jp/kaigirep/chuobou/senmon/shutohinan/pdf/081027/sanko03.pdf (accessed on 30 April 2021)) and Dr. Fruin’s article (
https://www.gkstill.com/Support/crowd-flow/fruin/Fruin3.html (accessed on 30 April 2021)), we define
, which is the actual walking speed of evacuee
i as the following equation:
where
is the standard walking speed of evacuee
i. Here,
p is the population density on the road which is defined as follows:
where
is the number of people on the road, while
[m] is the road width and
[m] is the road length. Both values of
and
are obtained from road objects in the OpenStreetMap.
5.2.2. Initial Locations
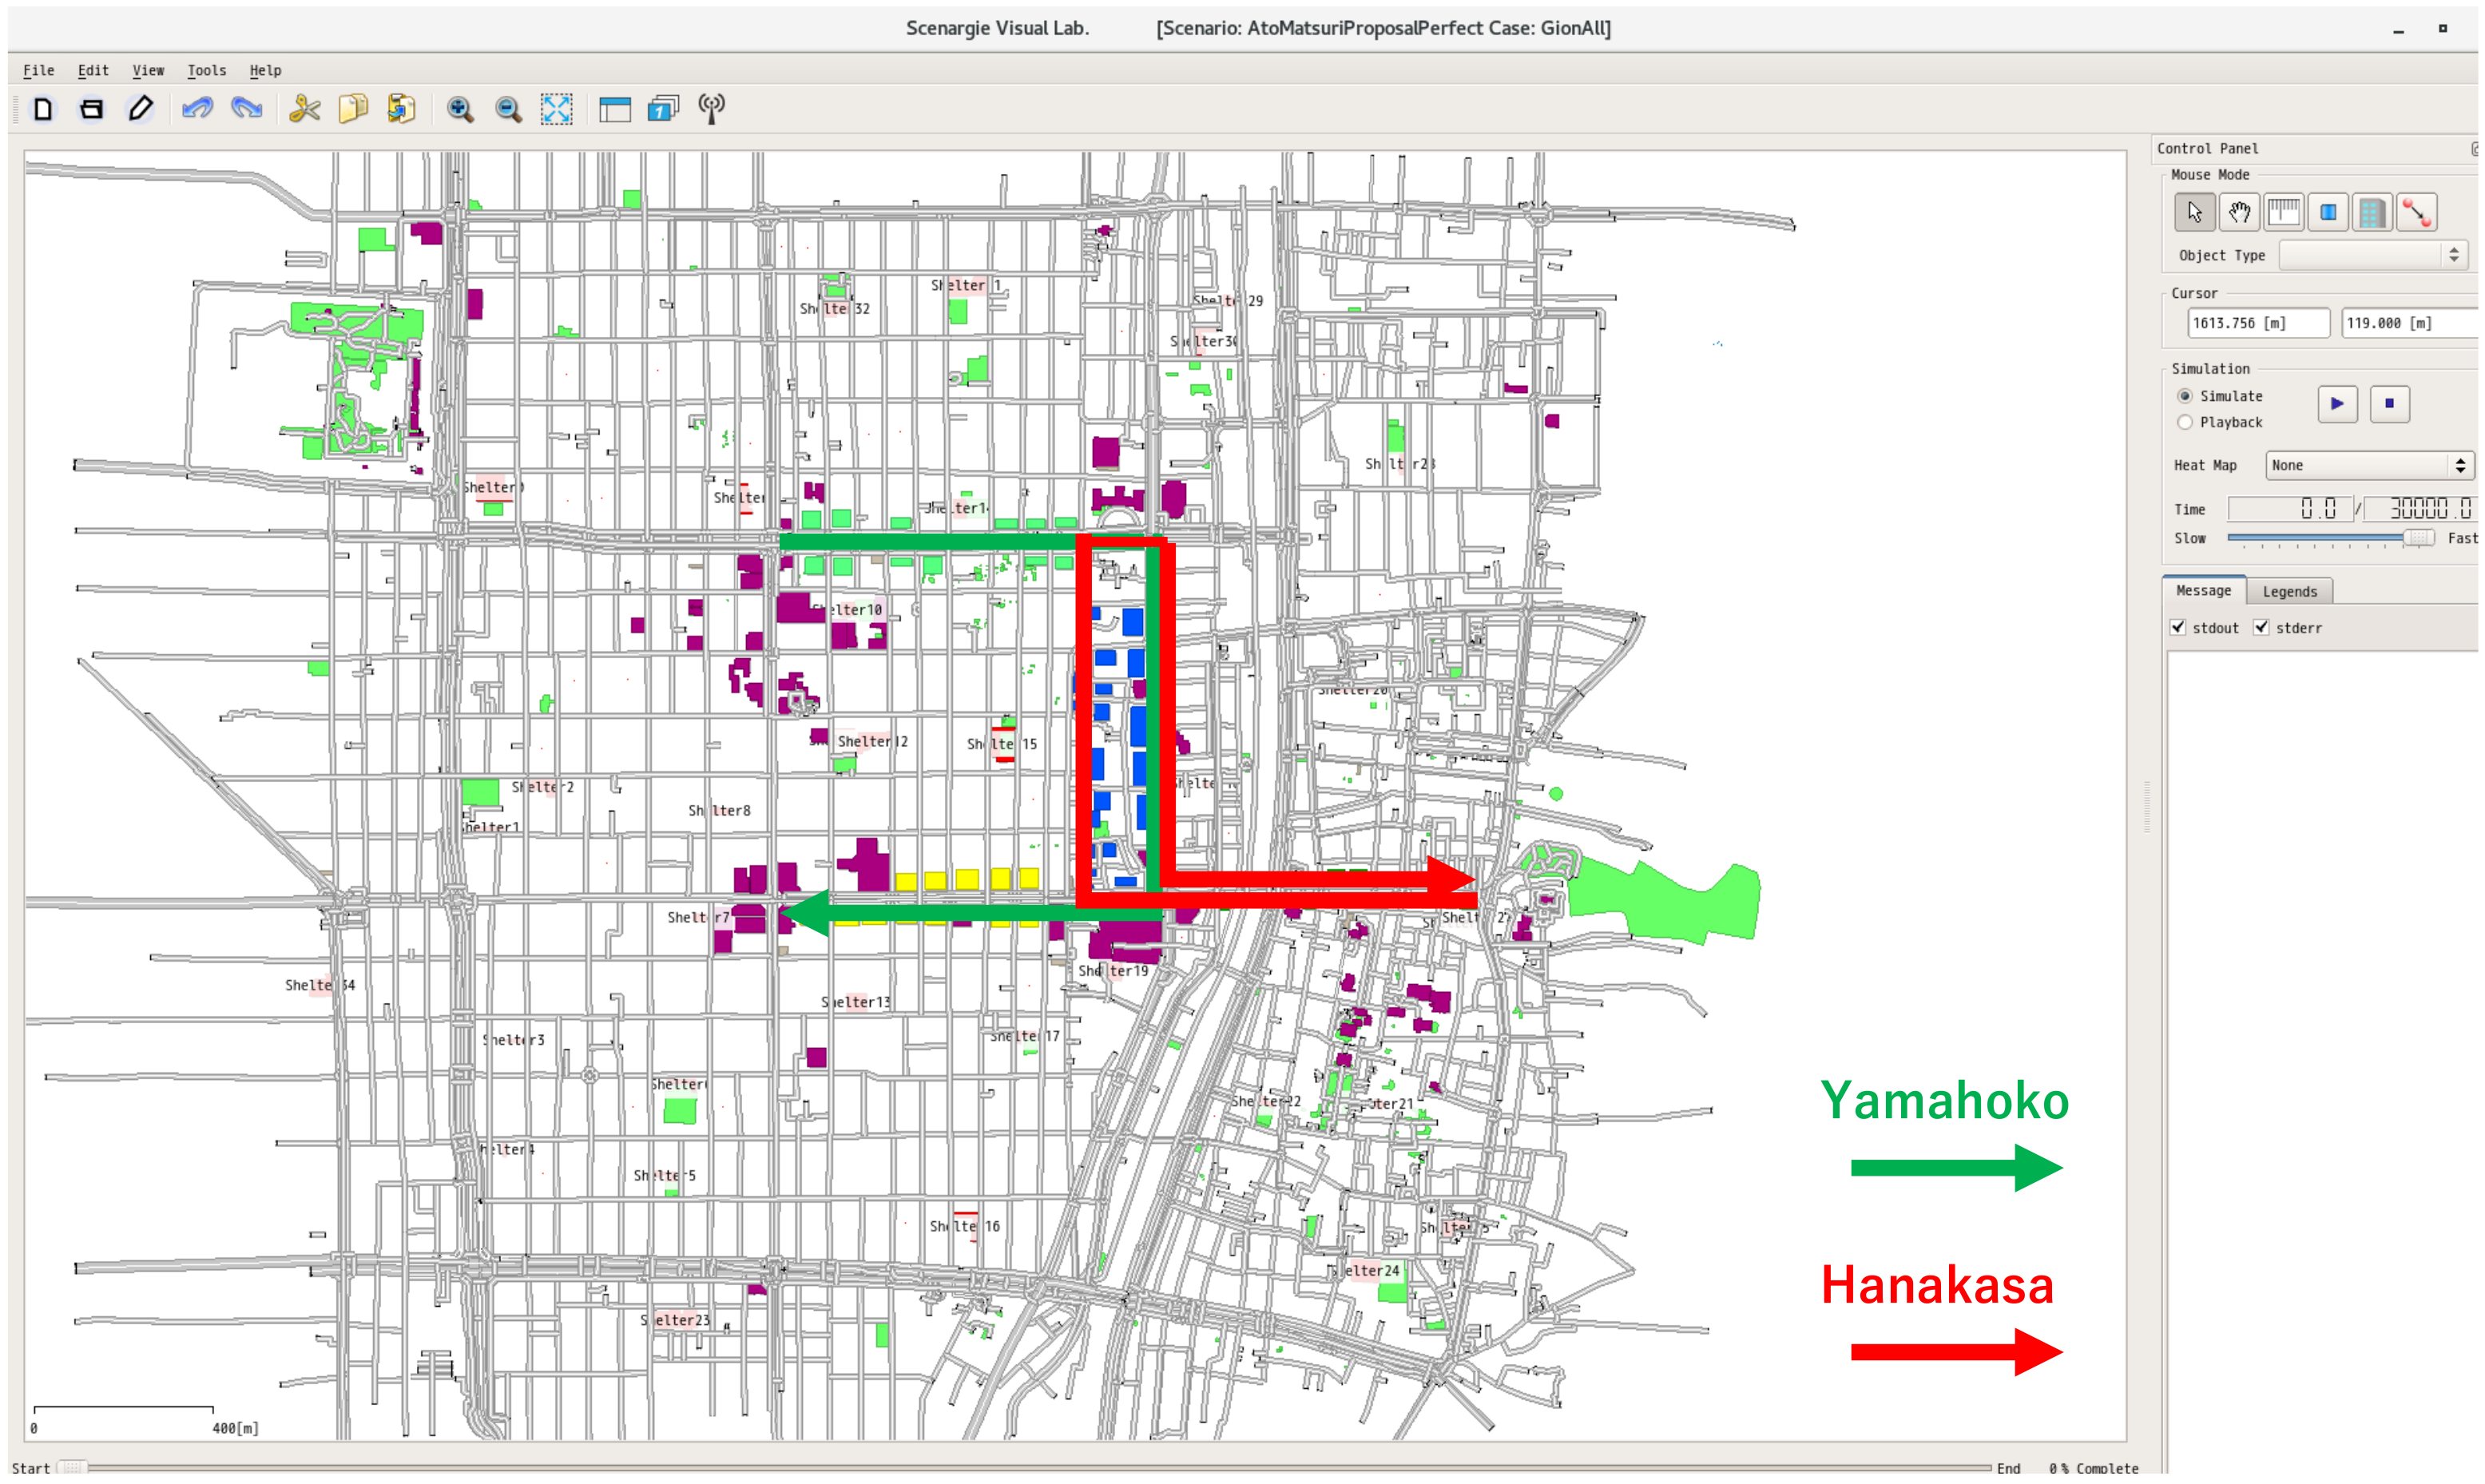
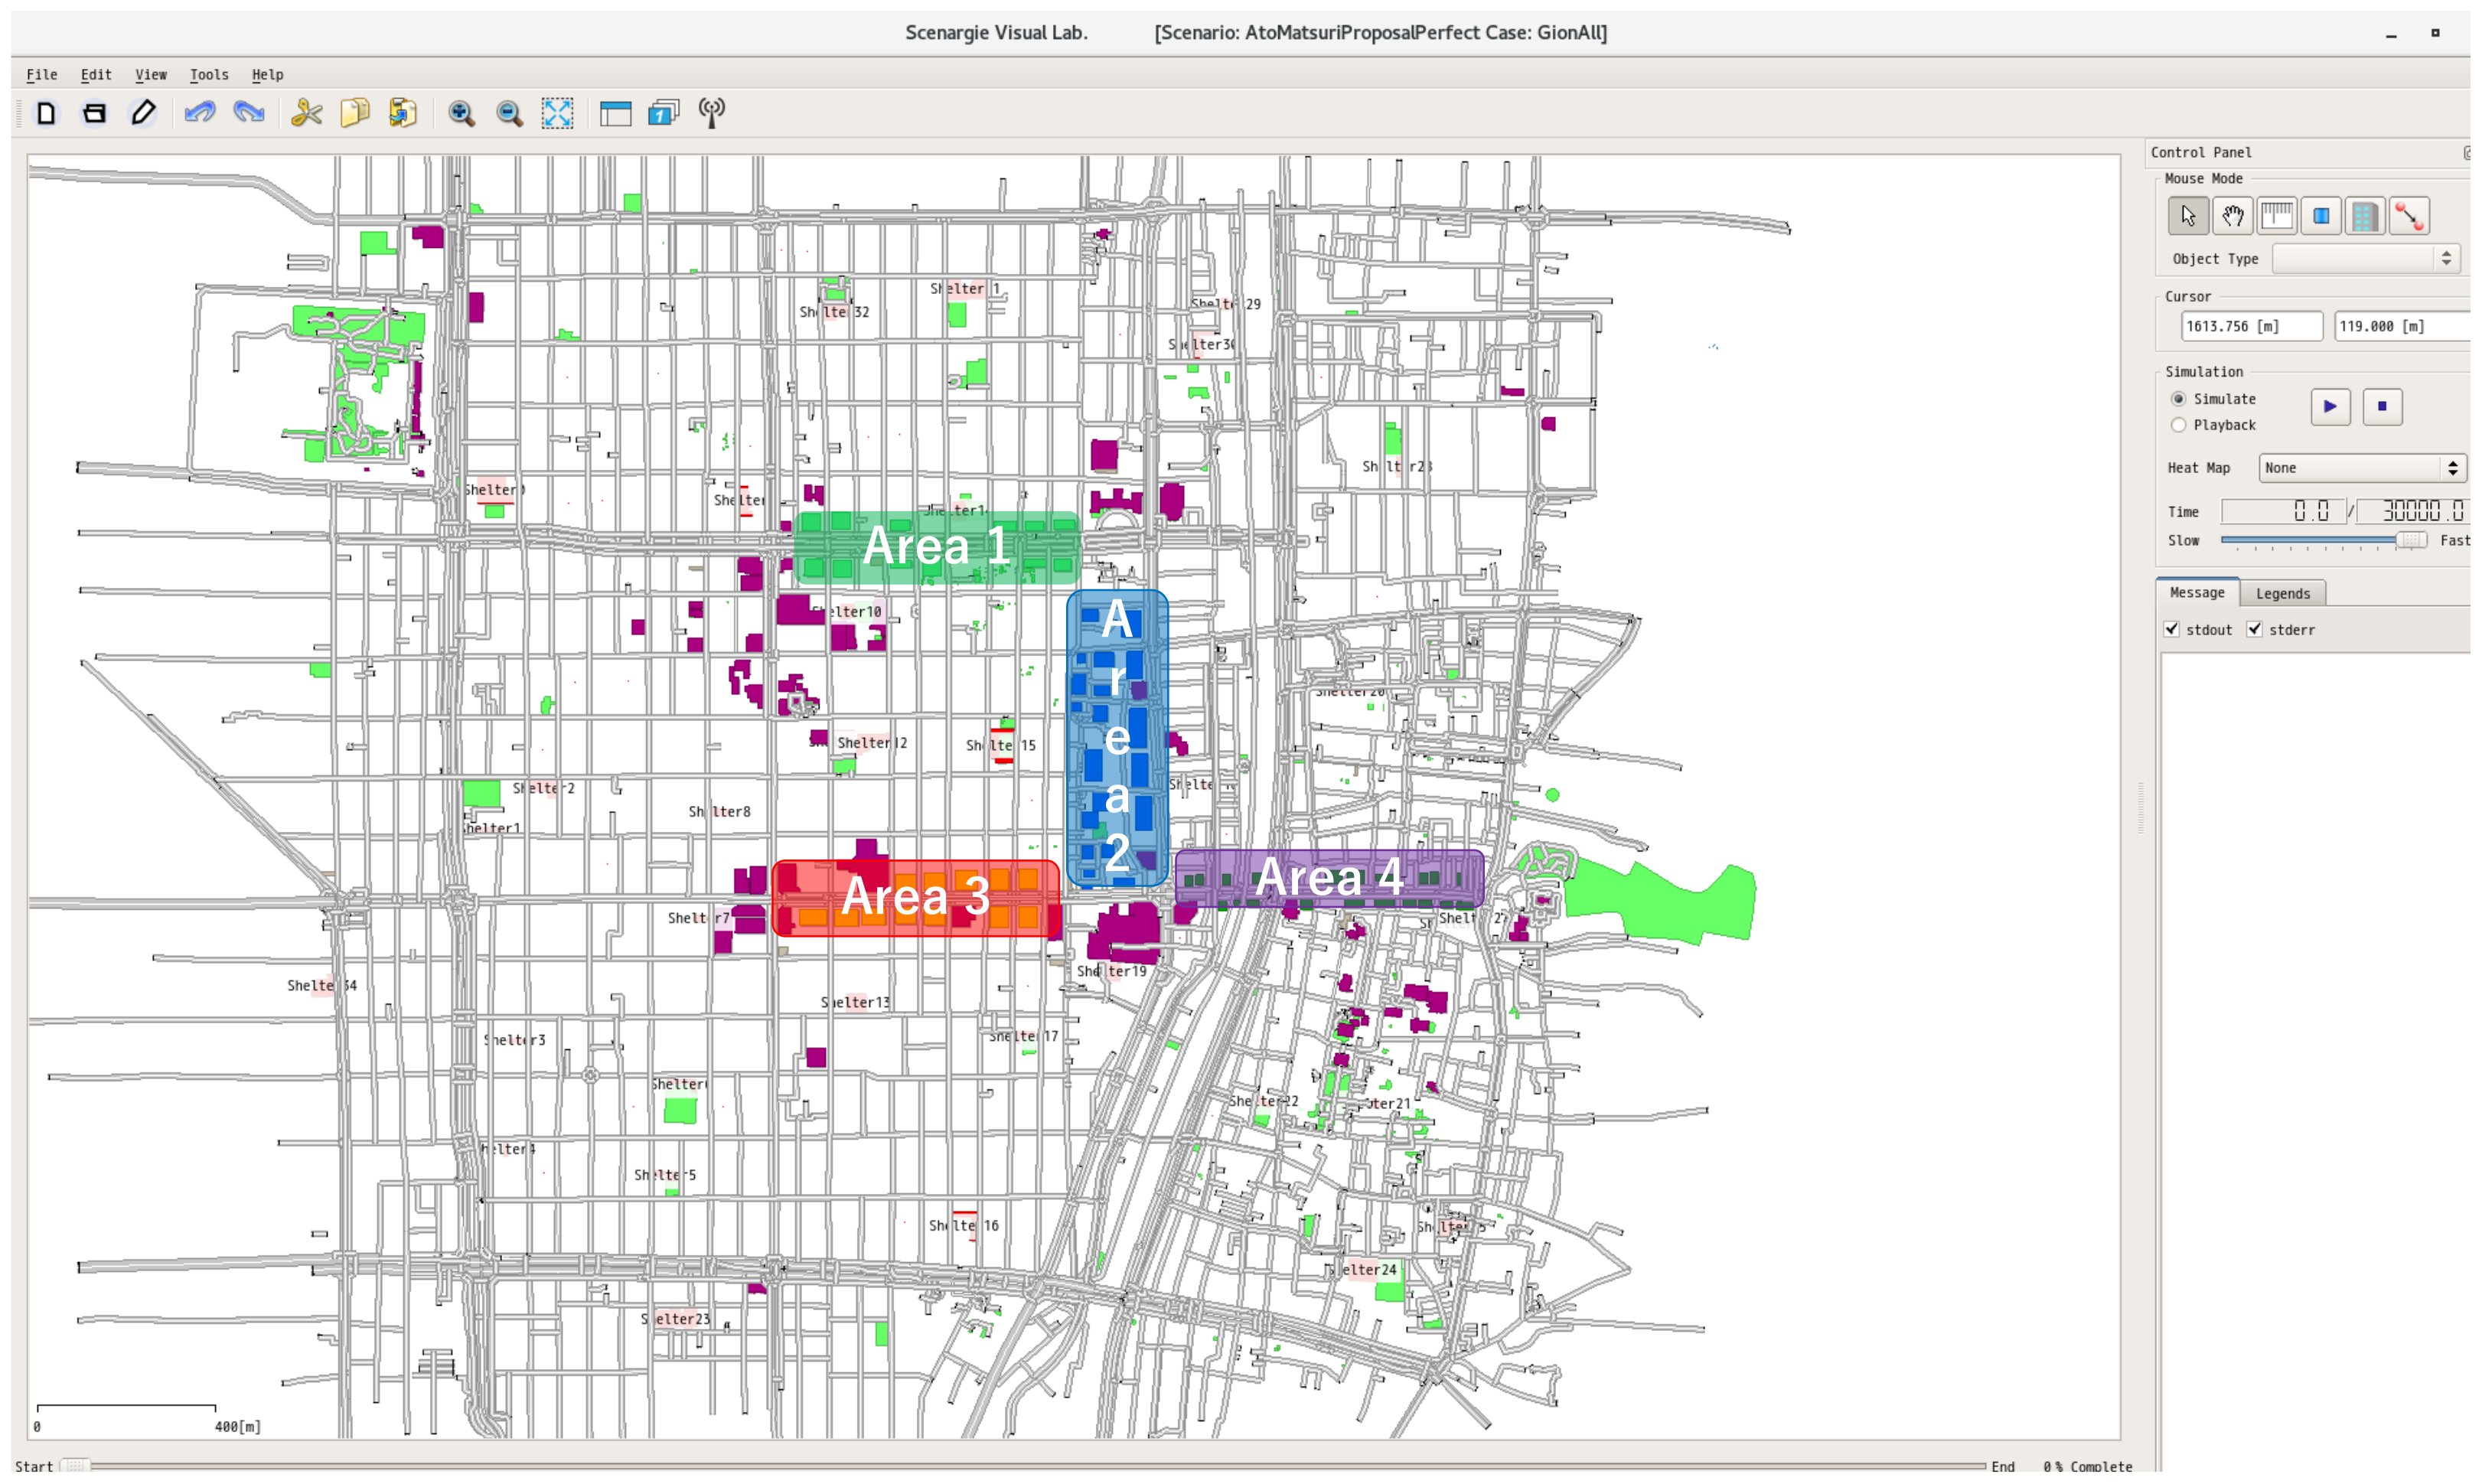
On 24th July, the Day of Atomatsuri, the Yamahoko float parade is the highlight of the festival. The two groups of parades pass through the streets of Gion.
Figure 4 shows the routes of each group (Yamahoko and Hanakasa). Most of the visitors are assumed to gather alongside the routes. Therefore, we divide the evacuees into five groups. Areas 1, 2, 3, and 4 are shown in
Figure 5. Furthermore, the number of members and the initial location of each group are as follows:
Group 1: 4000 evacuees start from Area 1.
Group 2: 8000 evacuees start from Area 2.
Group 3: 4000 evacuees start from Area 3.
Group 4: 4000 evacuees start from Area 4.
Group 5: 10,000 evacuees start from random points on the map.
5.2.3. Shelter Capacity
We set 32 shelters as destinations in the map based on actual shelters in Gion (
http://www.bousai-kyoto-city.jp/bousai/map/sheltermap.htm (accessed on 30 April 2021)). When the East-Japan earthquake occurred, shelters in Tokyo held 5 to 10 times the number of evacuees compared to shelter capacities. Based on this fact, we set the capacities of shelters to five times the original capacities, making the total capacity of all shelters 54,385.
5.2.4. Evacuees Behavior
The system assigns the shelters to evacuees, and evacuees head to their destinations along the shortest path. If evacuees are refused at shelters, then they restart evacuation actions and head to the nearest shelter from their position at that point. Evacuees who do not follow evacuation instructions will randomly come from groups of healthy people, the destination of which, as decided by the system, is not the nearest shelter.
5.3. Comparison Methods
In this simulation, to evaluate the performance of the proposed methods, we compare our methods to traditional methods: (1) Nearest-shelter selection method, (2) COP, (3) FRM, (4) SRM. We also evaluate how evacuees’ behavior affects evacuation. We set the percentage of evacuees who do not follow evacuation instructions to be 0, 20, 40, 60, 80, and 100%. Each pattern of the method is simulated 20 times. We briefly describe each method and scenario in the following sections.
5.3.1. Nearest-Shelter Selection Method
All evacuees head to their nearest shelters by taking the shortest route. If a shelter that an evacuee reaches is filled to capacity, the evacuee resumes moving to the nearest shelter from that point. If a shelter has space to accommodate people, the evacuee succeeds in entering the shelter. This indicates that the evacuee has finished evacuation. When all evacuees finish evacuation, the simulation will end.
5.3.2. COP
Destinations of each evacuee are decided by the method as explained in
Section 3. Evacuees take the shortest route to the shelter. Evacuation time will be calculated from the standard walking speed of an evacuee and movable road distance, which starts from the location of an evacuee and ends at the location of a shelter. As in the Nearest-shelter Selection Method, if an evacuee fails to enter a shelter that is filled, the evacuee will head to the nearest shelter from that point. When all evacuees finish evacuation, the simulation will end.
5.3.3. FRM
The value of margin rate
r will be set at 0, 0.2, 0.4, 0.6, and 0.8. As explained in
Section 4.2, the assigning numbers of evacuees to each shelter will be set by the margin rate
r; then destinations of each evacuee will be decided in the procedure of COP with priority to the disaster weak. If an evacuee failed to enter a shelter that is filled, the evacuee will head to the nearest shelter from that point. When all evacuees finish evacuation, the simulation will end.
5.3.4. SRM
In this method, we set the variable
r to refer to the percentage of evacuees who are assumed not to follow evacuation instructions. The values of
r are set at 0.2, 0.4, 0.6, and 0.8. As explained in
Section 4.3, the assigning numbers of evacuees to the specific shelters will be rearranged based on the simulation results and the variable
r. Then, as in FRM, destinations of each evacuee will be decided in the procedure of COP with priority to the disaster weak. If an evacuee failed to enter a shelter that is filled, the evacuee will head to the nearest shelter from that point. When all evacuees finish evacuation, the simulation will end.
5.4. Results
In this section, we describe the evaluation results. In the simulations, we set the following evaluation indicators: (1) the average evacuation time and (2) the completed evacuation rate. In the disaster situations, as delays in evacuation time increase, evacuees will be more at risk of harm. Thus, evacuees had better evacuation in a shorter time, so we evaluate these two indicators. Each simulation outputs results of the average evacuation time and the completed evacuation rate.
5.4.1. Average Evacuation Time
Figure 6 shows changes in the average evacuation time of all evacuees. The average evacuation time becomes 1103.2 s, the highest value, when the nearest shelter selection method was applied to evacuees. When all evacuees follow FRM with a margin rate 0, which only gives priority to the disaster weak for shelter decisions, the average evacuation time of all evacuees becomes 513.7 s, the minimum value. However, the average evacuation time increases sharply as a result of the behavior of non-cooperative evacuees. When the rate of healthy people who did not follow evacuation instructions is 20%, the average evacuation time increases by 28%. If all healthy people are non-cooperative, the average evacuation time, which is 1060 s, becomes closer to that of the nearest route-selection method. Regarding COP, the average evacuation time increases gradually with the increase in the number of non-cooperative healthy people. If all evacuees are cooperative to the evacuation instructions, the average evacuation time is 590.5 s. When all healthy people are non-cooperative, average evacuation time is 858.1 s.
If FRM with a margin rate 0.4 or SRM is applied to evacuees, changes in the average evacuation time of evacuees are quite different from those for the case in which COP is applied. Increases in the rate of healthy people who did not follow evacuation instructions mean that more healthy people will arrive at the nearest shelters. Thus, decreases in the average evacuation time have been observed. From the point at which the rate of non-cooperative healthy people is 20% or 40%, the average evacuation time starts to rise again. SRM with high assumed rate values (r = 0.6 or 0.8) sets the assignment number of the specific shelters, which will be too crowded, to much lower values than the capacities. Compared to COP, SRM with a high assumed rate shows a shorter average evacuation time when several healthy people do not follow evacuation instructions. Results of FRM with a margin rate 0.6 or 0.8 are not able to be output because the condition of the assigning number of shelters and the number of evacuees is not satisfied. The same thing will happen regarding to the other evaluation results we explain later in this section.
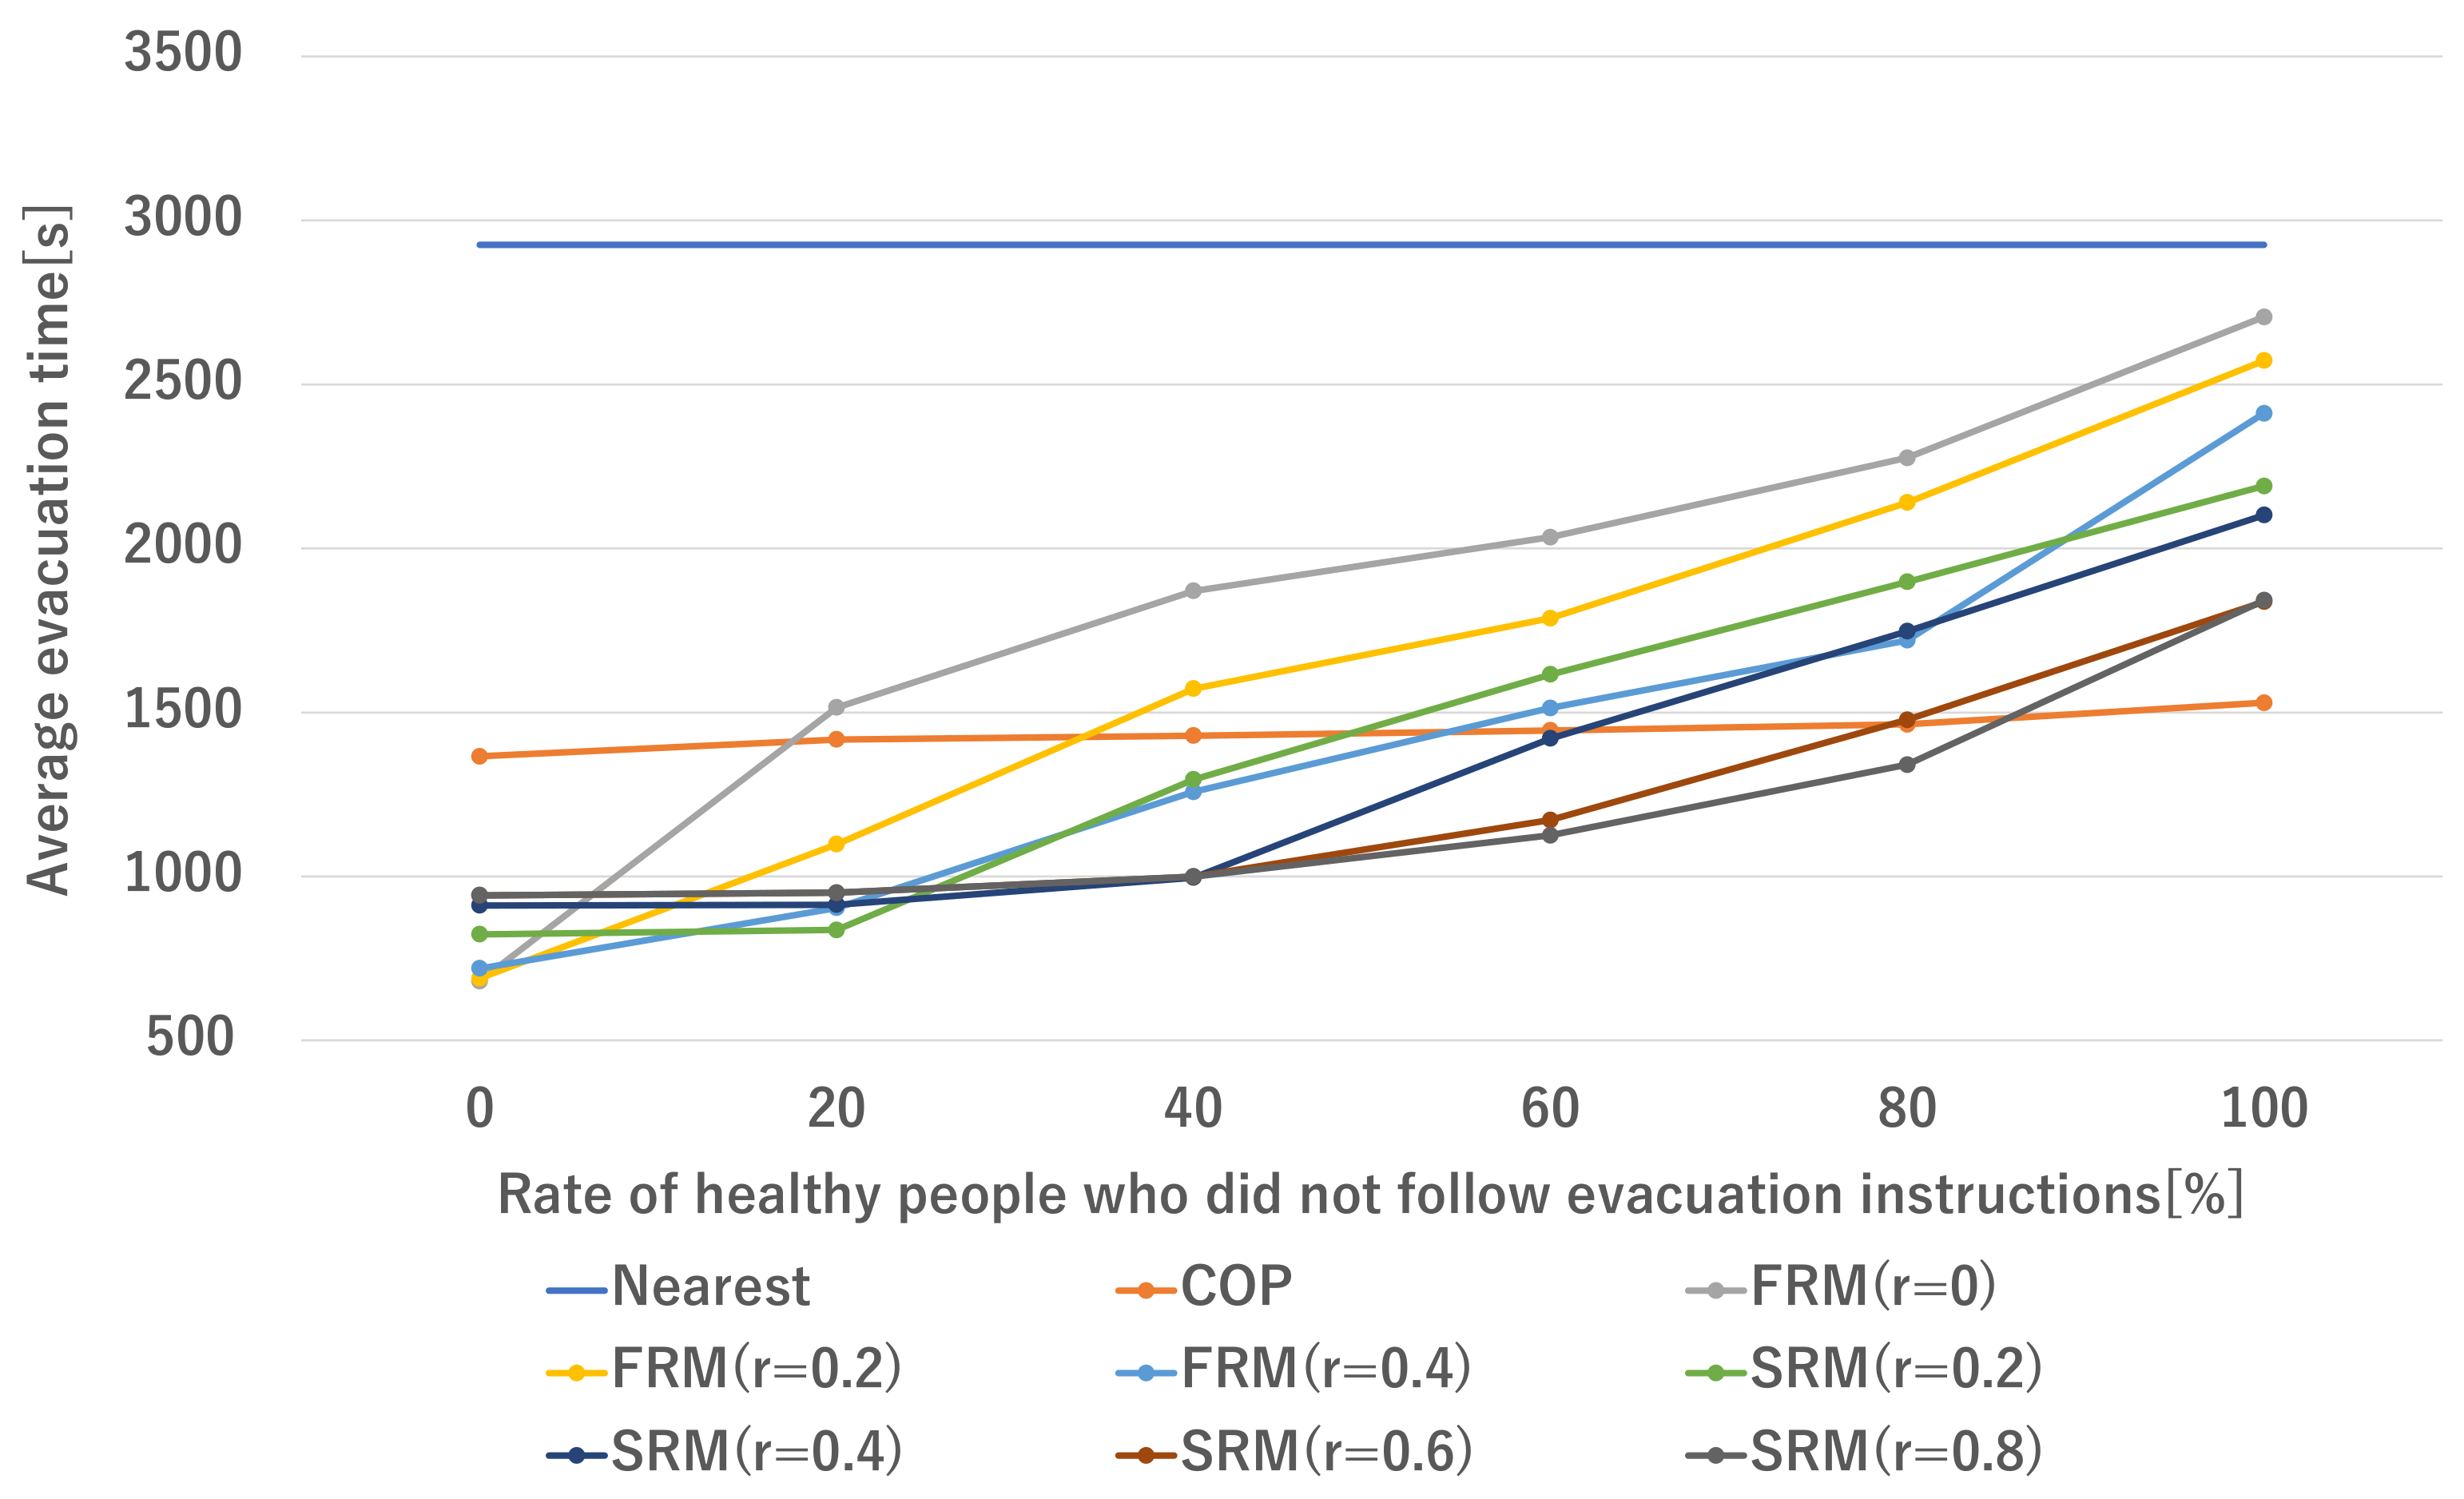
Figure 7 shows changes in the average evacuation time of healthy people. By applying COP to evacuees, the average evacuation time of healthy people is the lowest value, 396.6 s, when all evacuees are cooperative. As an increasing number of evacuees become non-cooperative, the average evacuation time increases. When the proposed method is applied, changes in the average evacuation time of healthy people are similar to those for all evacuees.
Figure 8 shows changes in the average evacuation time of the disaster weak. When all evacuees follow evacuation instructions, the average evacuation time of the disaster weak becomes shortest, 681.1 s, by FRM with a margin rate 0. However, without limiting the number of evacuees assigned to shelters, evacuation time sharply increases when the rate of non-cooperative healthy people is more than 20%. Gradual changes in average evacuation time of the disaster weak are observed when COP is applied. If all evacuees follow COP, the average evacuation time is 1366.1 s. On the other hand, when all healthy people are non-cooperative, it becomes 1529.8 s. When we try to evacuate the disaster weak earlier compared to COP, limiting the assignment numbers of shelters has a positive effect. Gradual changes in the average evacuation time of the disaster weak are shown by the proposed method as compared to the method without limitations on the assignment numbers of shelters. When the assumed rate
r is 0.2, the average evacuation time is 823.8 s when all healthy people follow, while the average evacuation time is 837.2 s when the rate of non-cooperative healthy people is 20%, an increase of only approximately 1%. However, when the rate of non-cooperative healthy people is 40%, the average evacuation time is 1295.8 s. When all healthy people are non-cooperative, the average evacuation time is 2190.6 s. When we apply SRM with a high assumed rate, the effect is remarkable. The value of the average evacuation time of the disaster weak becomes shorter by SRM as compared to COP, even if some healthy people do not follow evacuation instructions. When the value
r is assumed to be 0.6, earlier evacuation of the disaster weak is anticipated if the rate of healthy people who did not follow evacuation instructions is less than 80%. When the assumed rate
r is 0.8, the average evacuation time is 942.7 s when all evacuees follow the evacuation instructions. Although the average evacuation time increases as the percentage of healthy people who did not follow the instructions increases, the average evacuation time is 1125.4 s at 60% and 1340.8 s at 80%.
5.4.2. Total Evacuation Rate
We also compared changes in the total evacuation rate of each method. As explained above, we set the percentage of evacuees who do not follow evacuation instructions to be 0, 20, 40, 60, 80, and 100%. We compare the methods under the condition of the same percentage of non-cooperative healthy people.
Figure 9,
Figure 10 and
Figure 11 show the results for each percentage value.
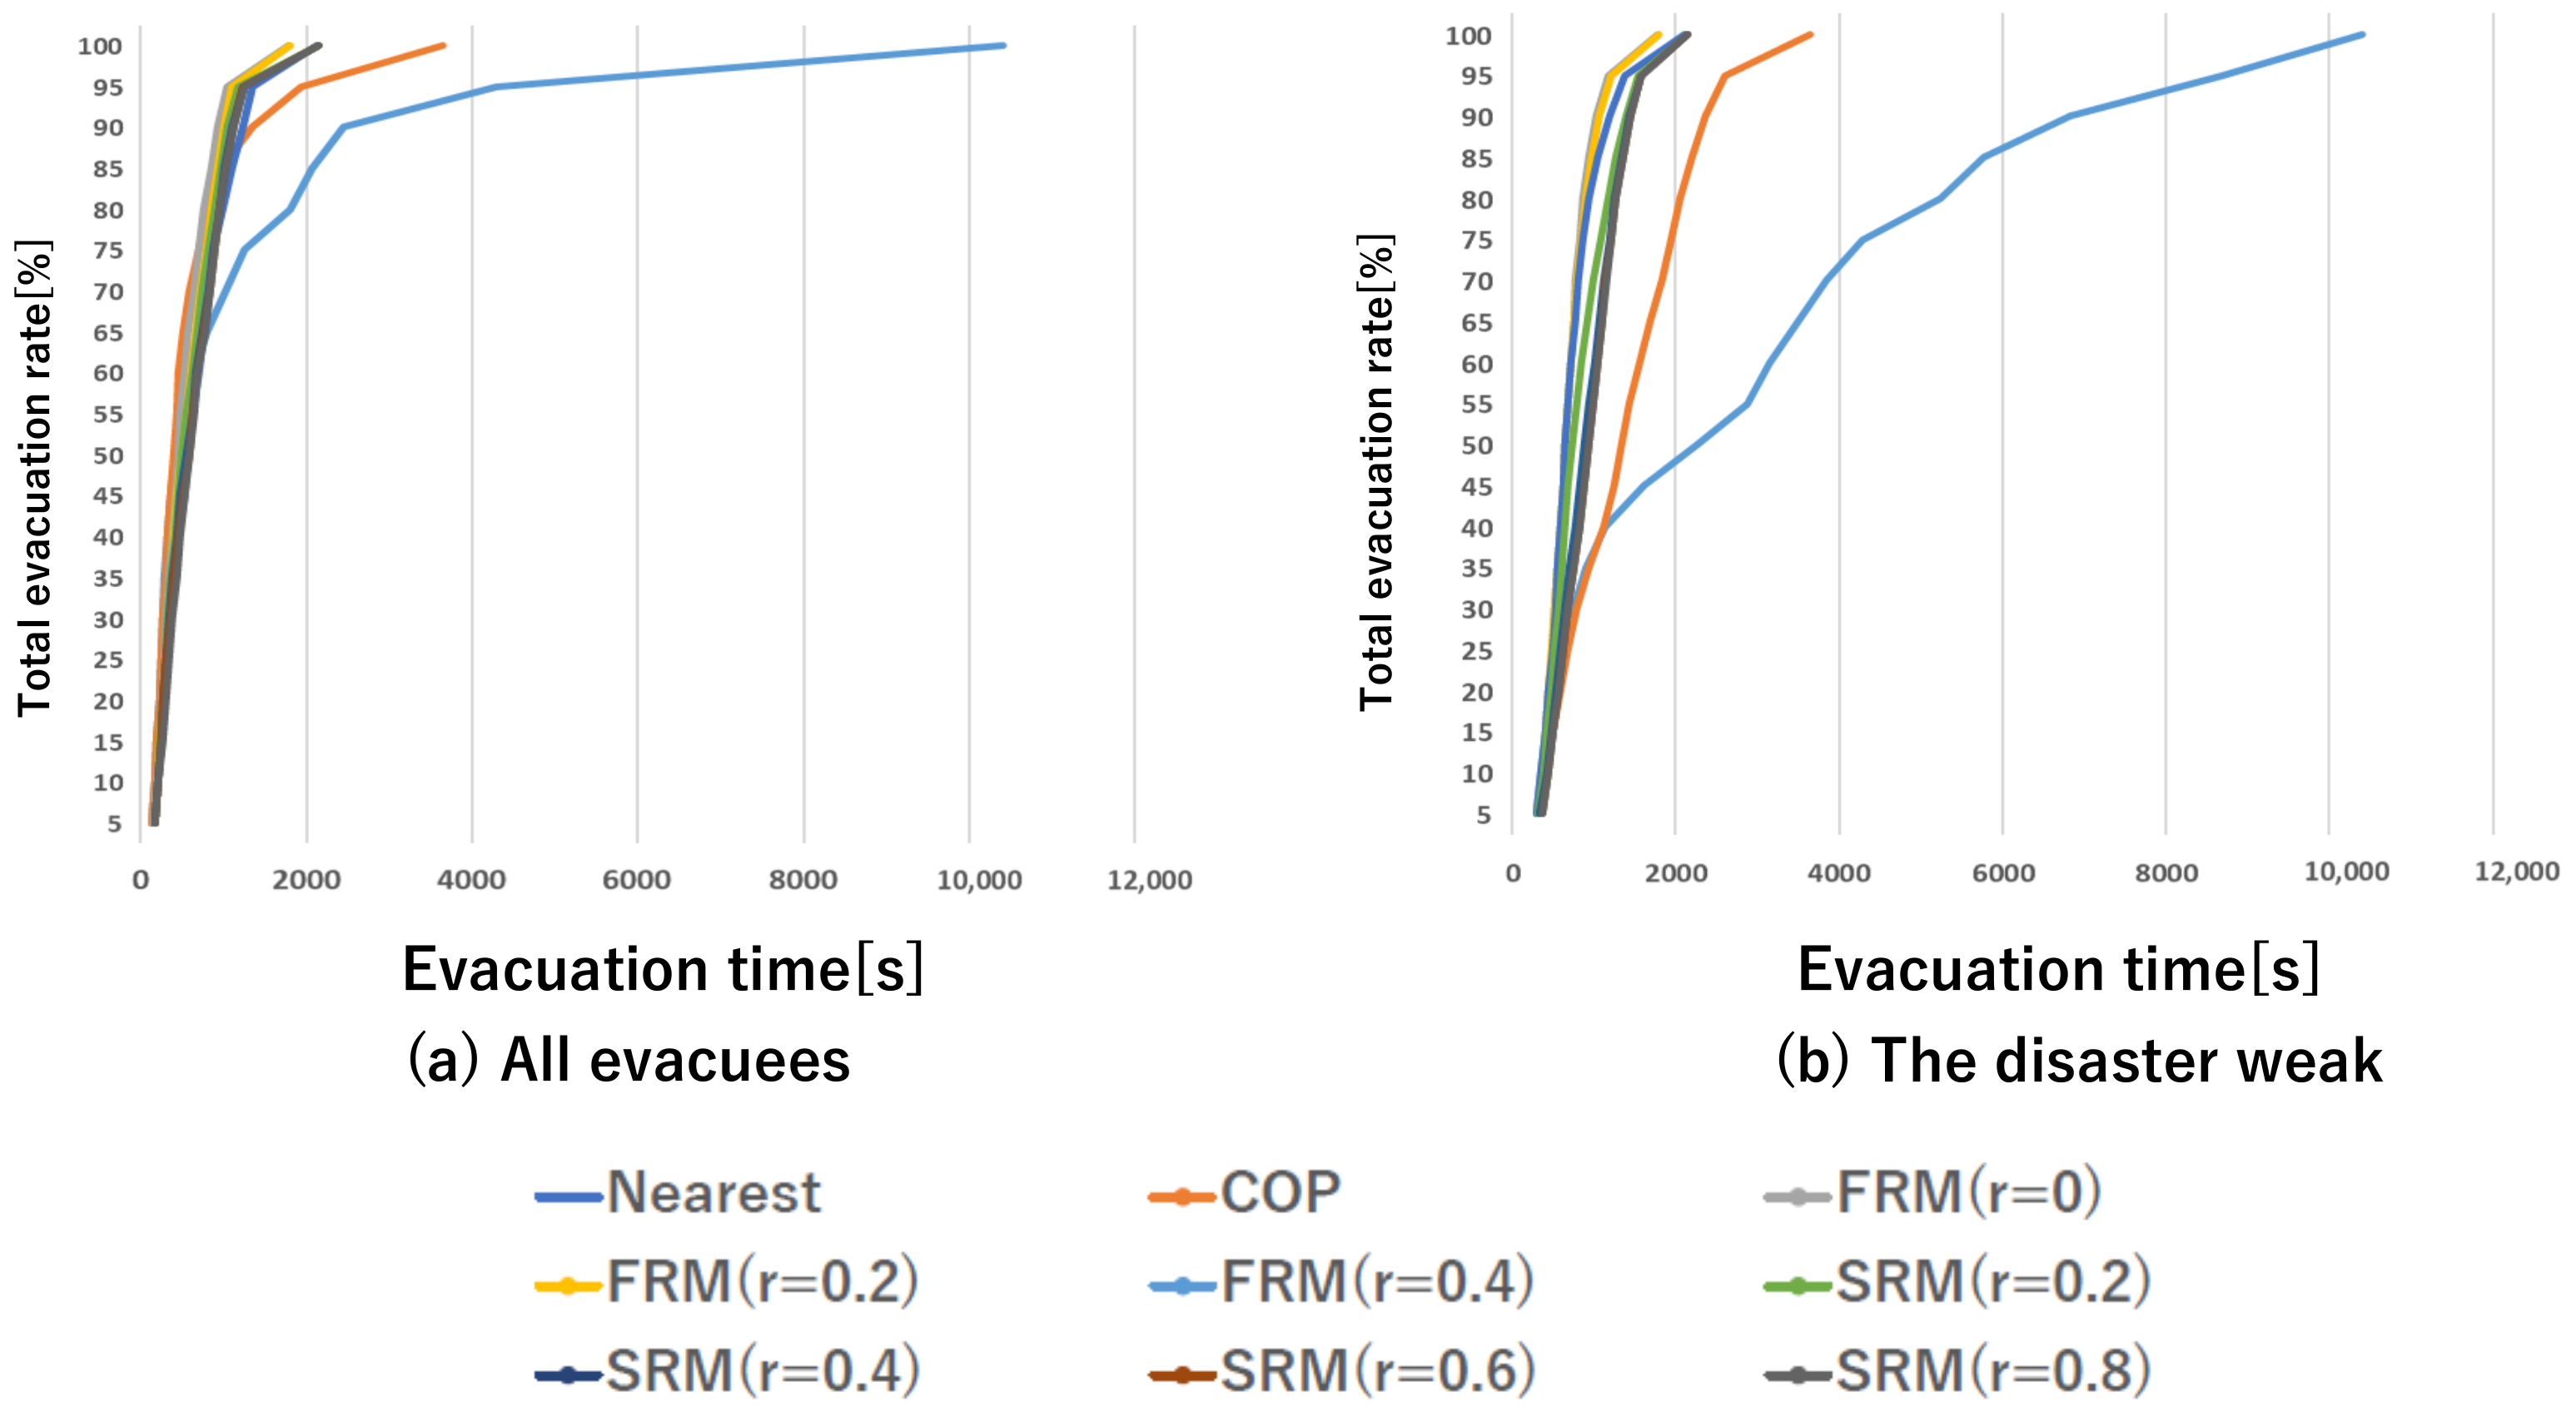
As shown in
Figure 9, methods that give priority to the disaster weak has a great effect on quick evacuation for all evacuees when all evacuees follow the instructions. The proposed method apparently evacuates all people earlier than COP and the nearest shelter selection method. While COP evacuates all people in 3646 s, FRM and SRM complete evacuation in between 1780 and 2150 s.
However, if some evacuees do not follow evacuation instructions, the results are different. In
Figure 10, delay in evacuation of a large number of the disaster weak is observed. Concerning FRM and SRM, the method with a smaller value of the margin rate, the number of the disaster weak who can evacuate earlier than COP decreases.
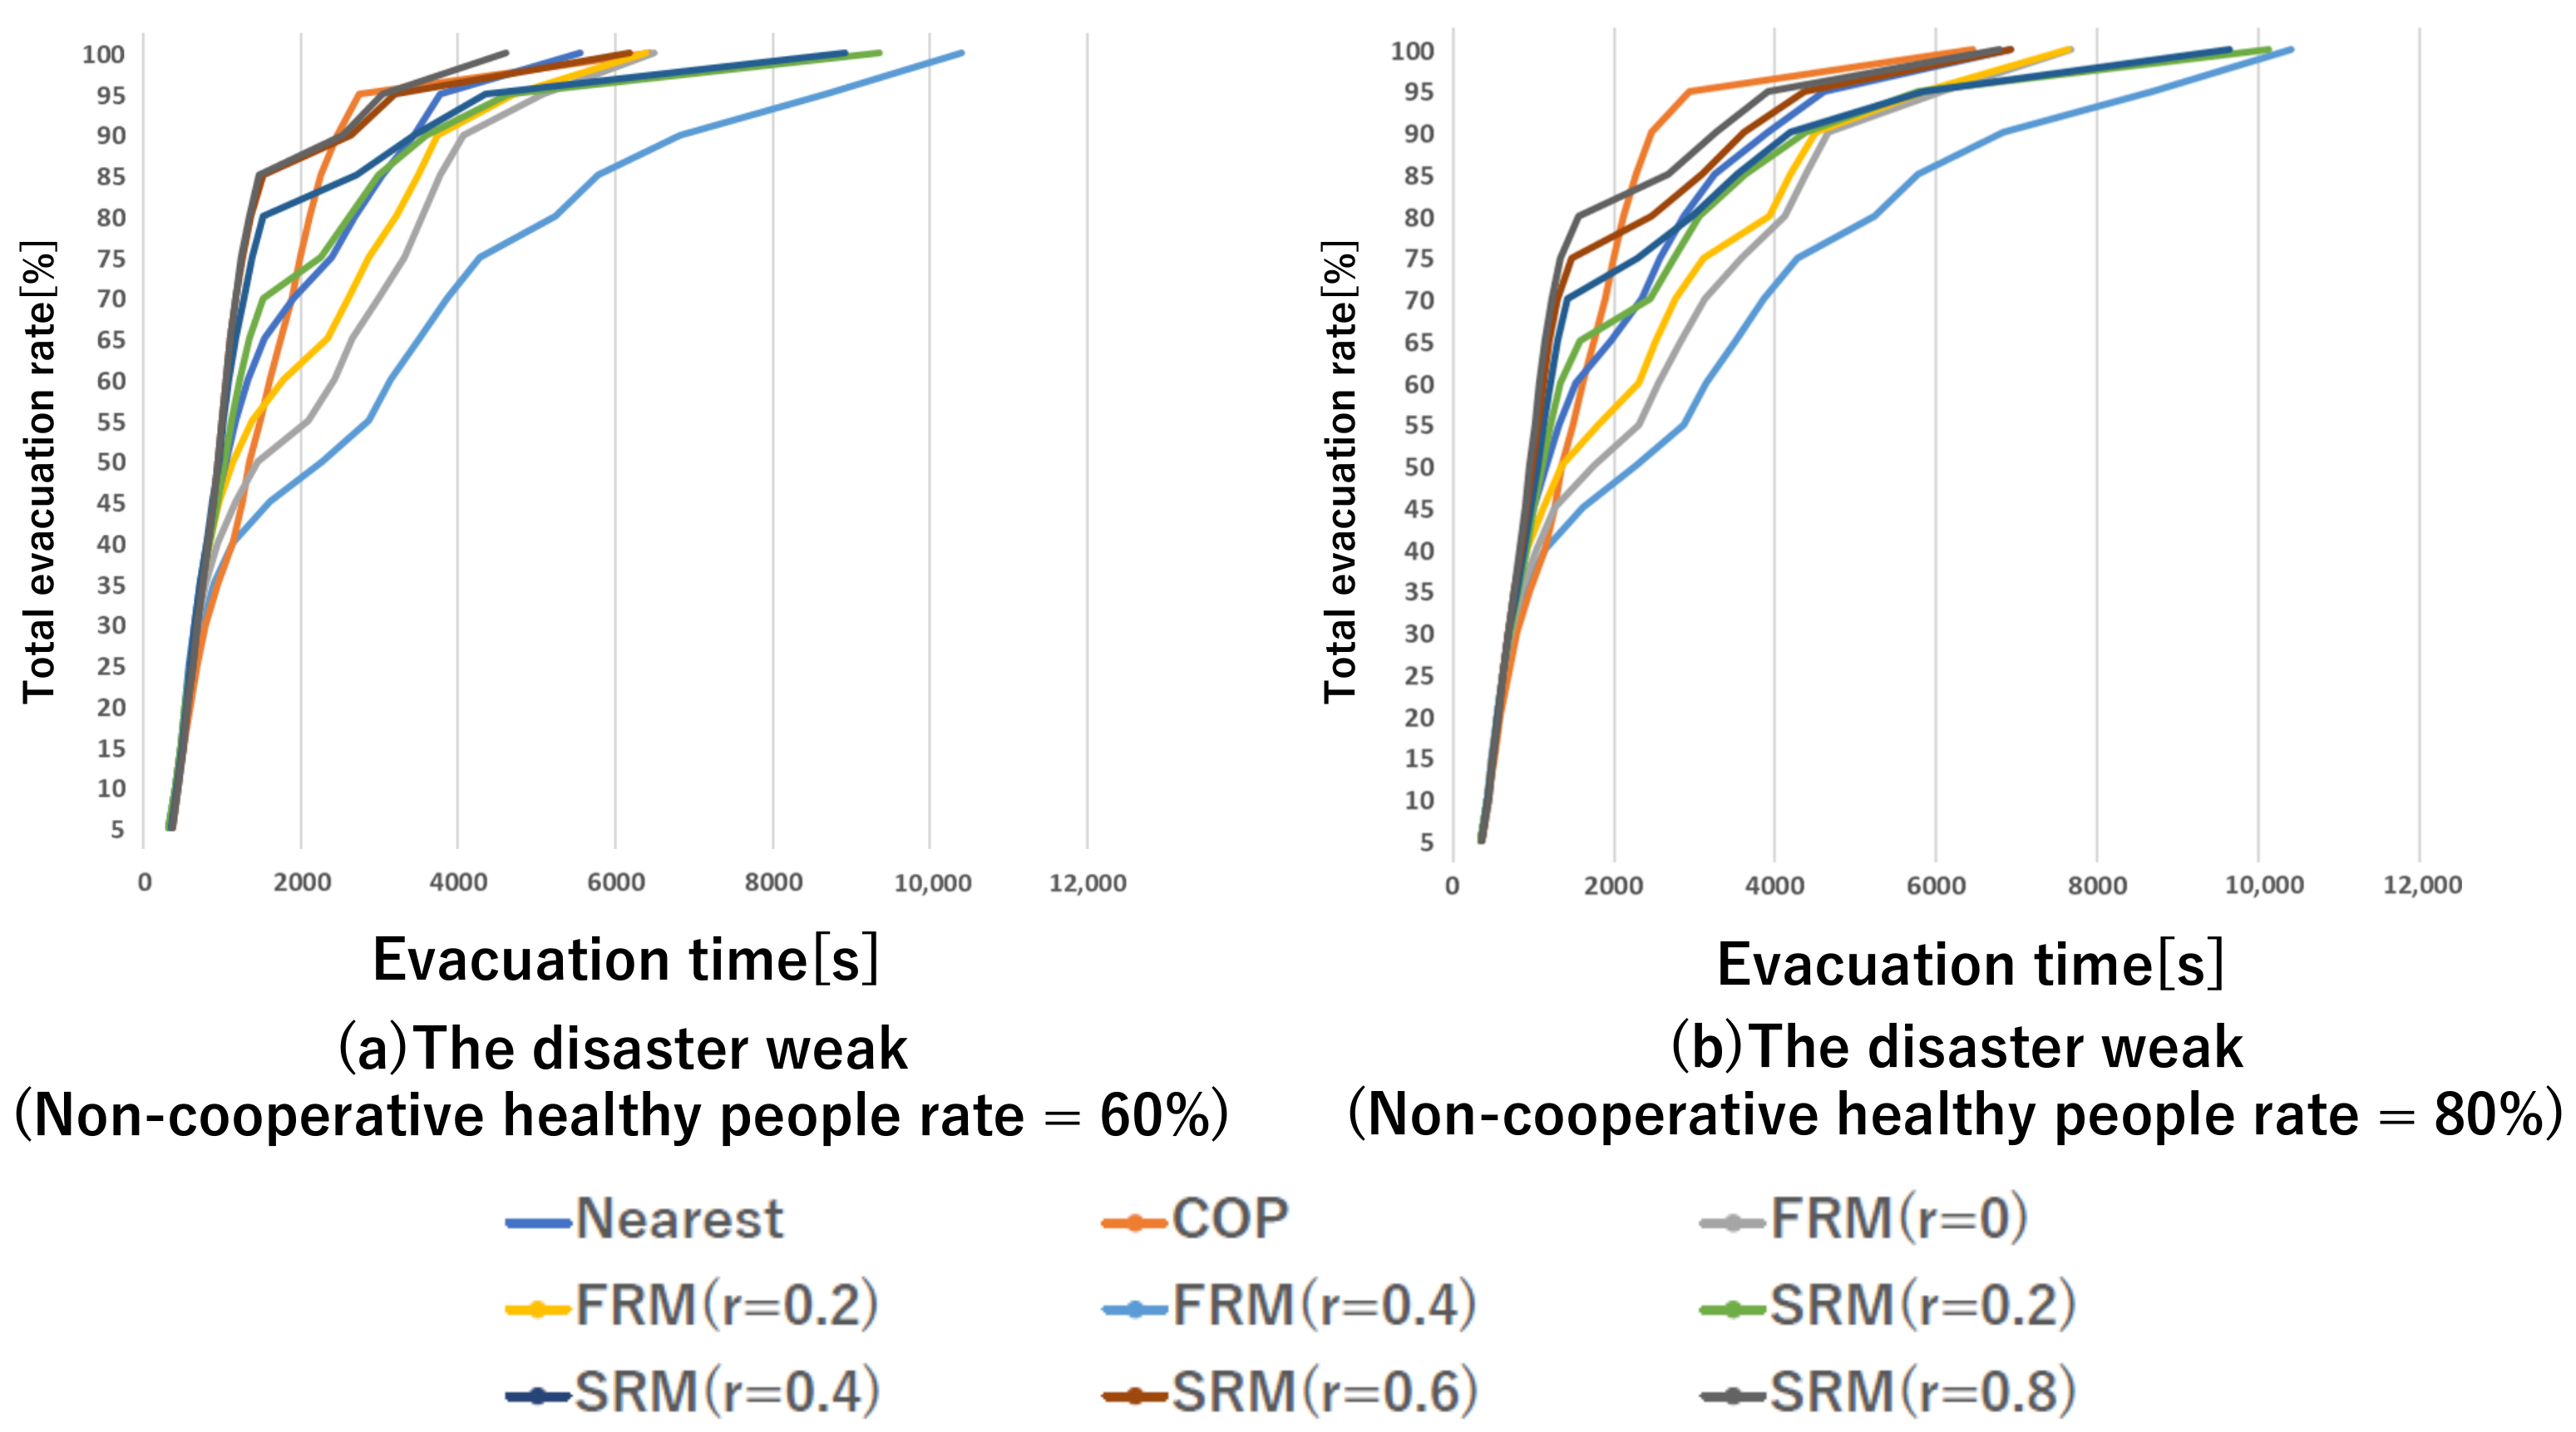
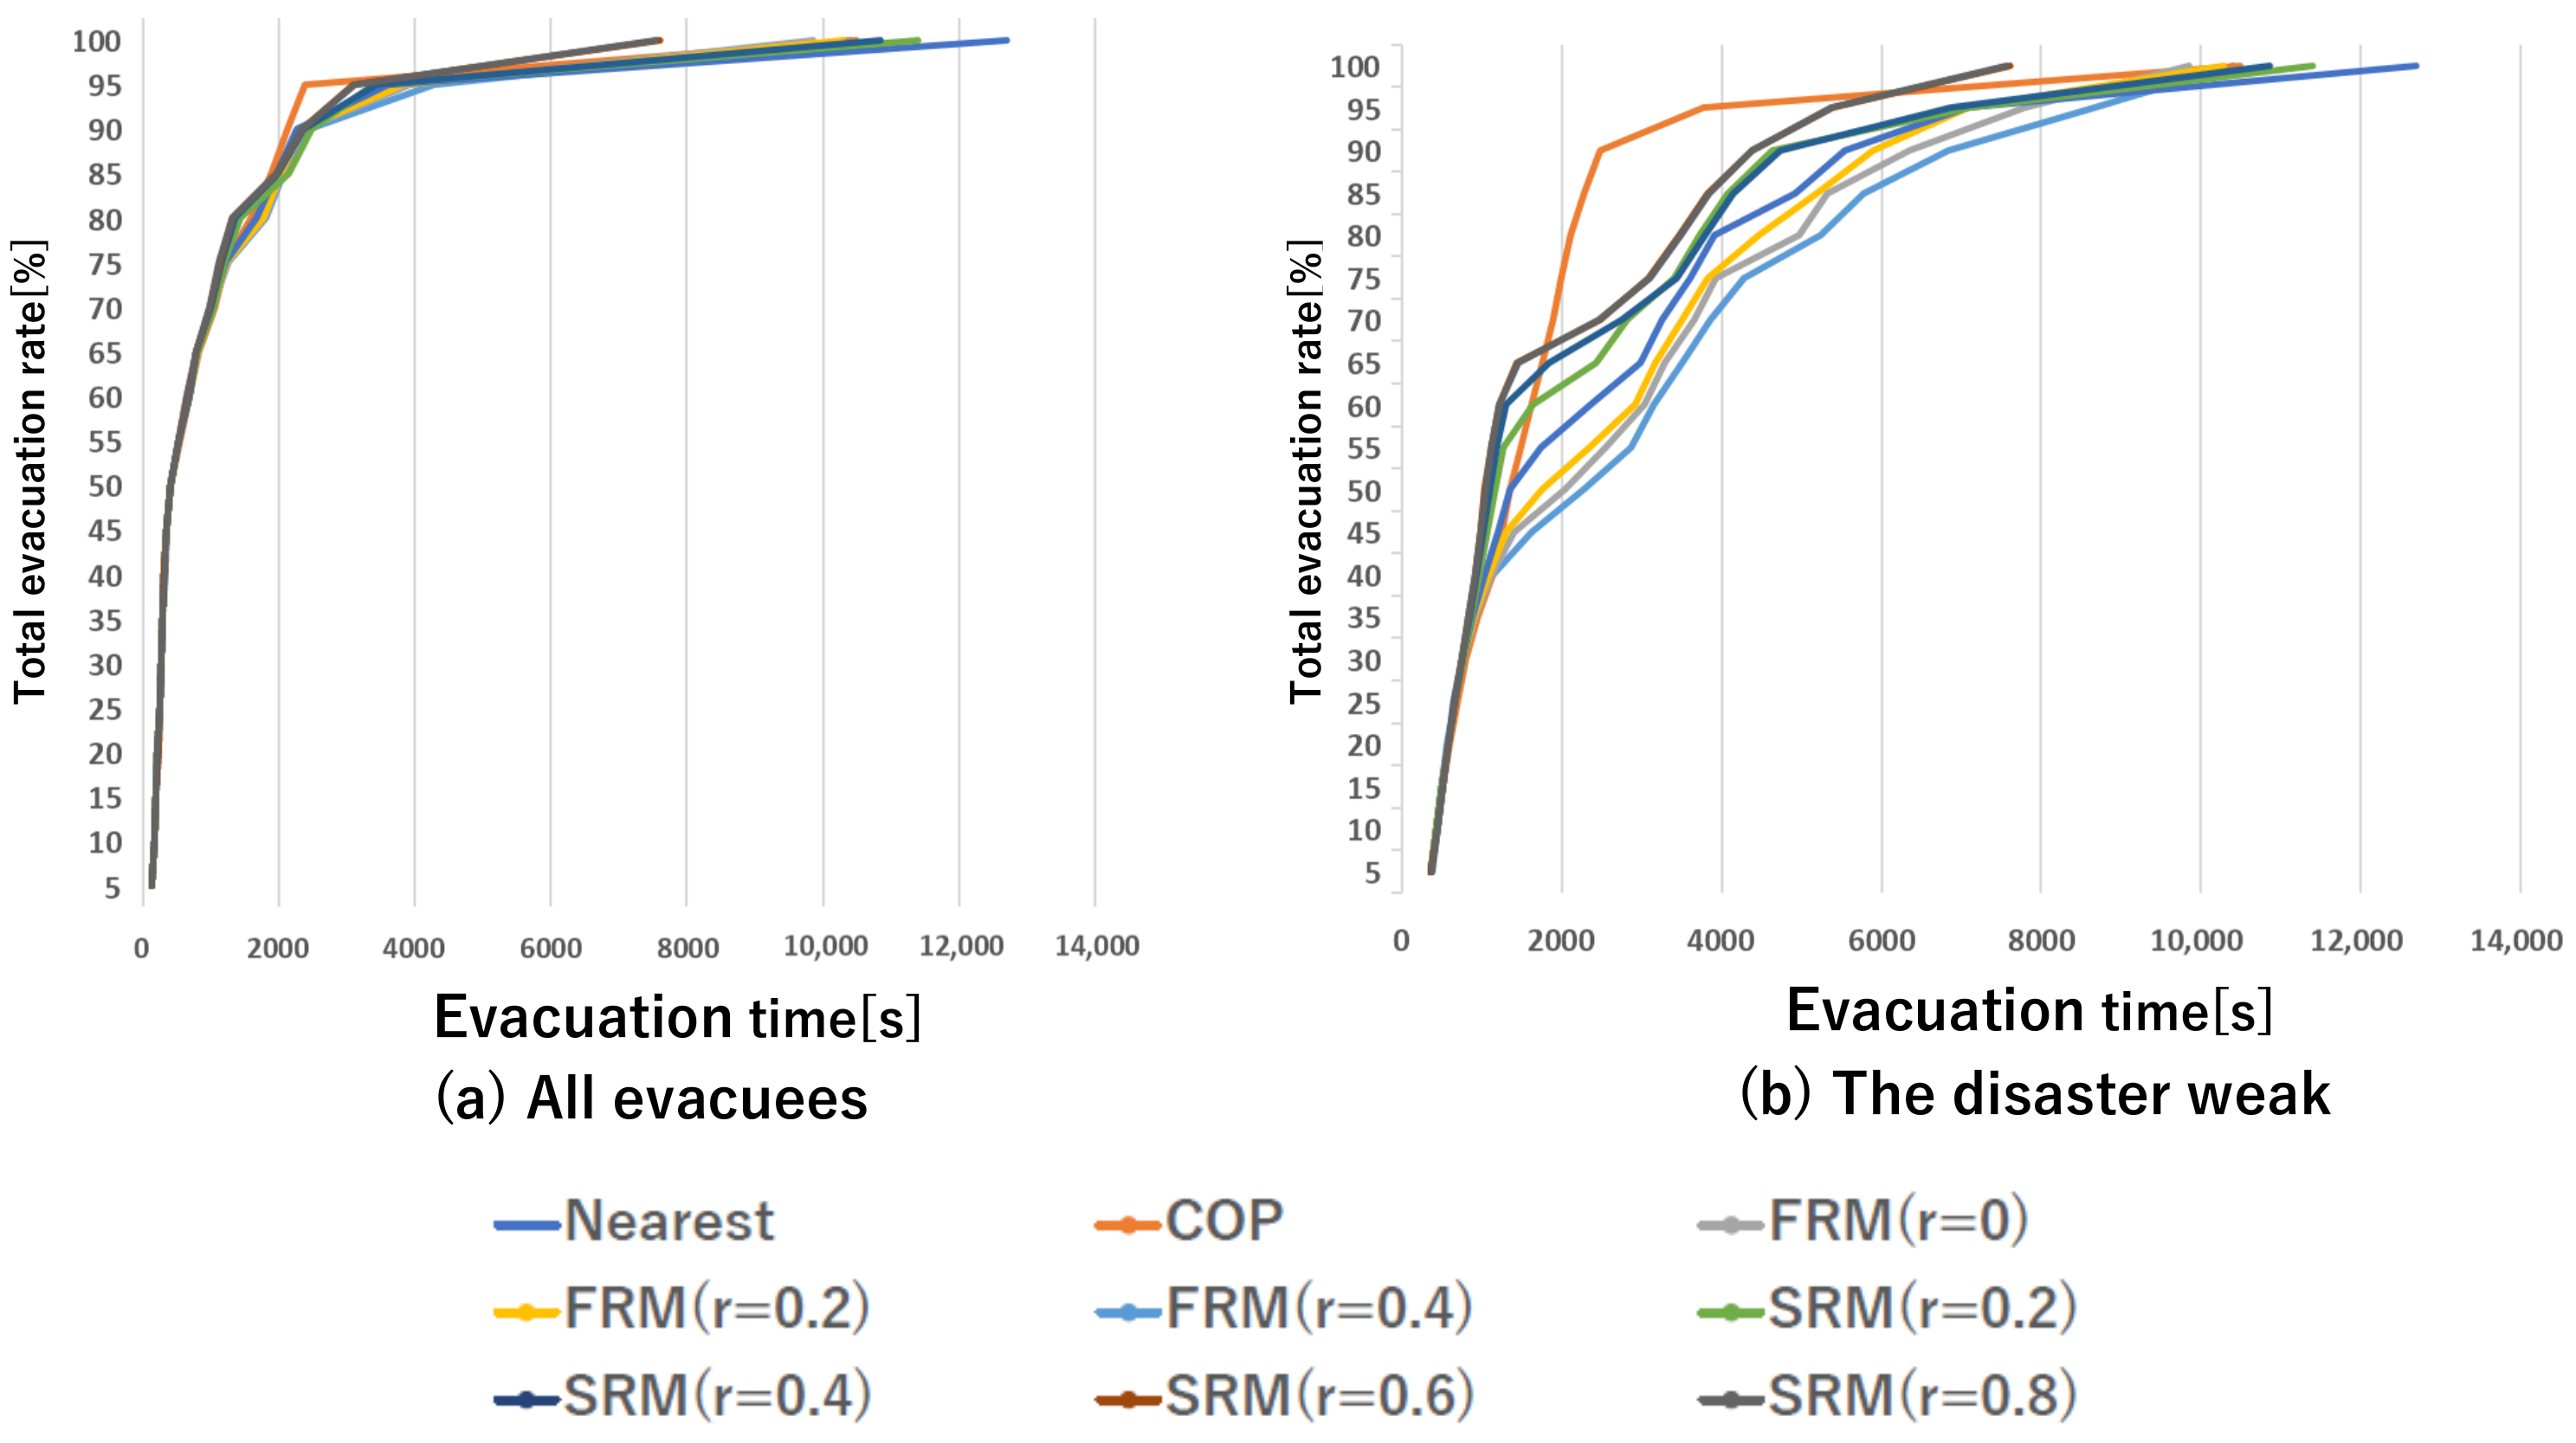
Figure 10a shows changes in total evacuation time when the percentage of evacuees who do not follow evacuation instructions is 60%. When FRM with a margin rate 0 is applied, evacuation for around 50% of the disaster weak is delayed compared to COP Method. When FRM with a margin rate 0.2 or 0.4 is applied, more of the disaster weak can evacuate early. However, more than 30% of them arrive later. About SRM, as the values of the margin rate increases, more of the disaster weak can arrive earlier compared to COP or FRM in 2000 s. If the value of the margin rate is 0.2, 70% of the disaster weak evacuate in shorter time. Furthermore, if the rate is 0.4, early evacuation of 80% of the disaster weak is possible. When SRM with a margin rate 0.6 or 0.8 is applied, 85% of the disaster weak can evacuate earlier than COP. Furthermore, SRM with a margin rate 0.8 evacuate all evacuees in the shortest time, 4617 s.
In
Figure 10b, increased delay in evacuation of several number of the disaster weak is observed in the case of both FRM and SRM. When FRM is applied, evacuation of more than 40% of the disaster weak is delayed compared to COP. When SRM with a margin rate 0.2 or 0.4 is applied, around 30% of the disaster weak have longer evacuation time. If the margin rate is 0.6, 75% of the disaster weak can evacuate in a shorter time. SRM with a margin rate 0.8 evacuate 80% of the disaster weak earlier than COP; however, the remaining 20% of them arrive later. As shown in
Figure 10b, COP evacuate all of the disaster weak in 6461 s, the earliest of all.
Figure 11 shows changes in total evacuation time when all healthy people are non-cooperative. When we apply a method without limitations on the assignment numbers of shelter, more than 50% of the disaster weak get refusal from shelters and lower values of total evacuation rate are observed at the same evacuation time compared to COP. A method that sets the assignment number of the specific shelters to much lower values than the capacities, as does SRM with a high assumed rate, can evacuate all evacuees earlier than COP.
6. Discussion
The proposed method is an attempt to support the disaster weak in crowded areas and in situations in which some evacuees do not follow evacuation instructions. Our research takes notice of the fact that there are different types of evacuees, including the disaster weak, in real disaster situations. It also discusses how quick evacuation, specifically that of the disaster weak, is affected by evacuees’ behavior assuming that they are not always cooperative in actual fact. Considering the existence of evacuees with non-cooperative behavior, we have proposed two different ways to limit the assignment numbers of shelters. FRM limits the assignment numbers for all shelters uniformly. On the other hand, SRM limits the number of evacuees assigned to shelters based on the results from simulations of evacuee flow. SRM detects shelters that are expected to be crowded and limit the assignment numbers for specific shelters. The method predicts how congestion will occur in the whole areas and properly disperse evacuees based on the prediction. Thus, as shown in
Figure 9,
Figure 10 and
Figure 11, SRM can evacuate more of the disaster weak in a shorter time than FRM.
Figure 8 shows that the proposed method has a positive effect on evacuation of the disaster weak if the number of non-cooperative healthy people is in the range of the number of evacuees assumed. Estimating that more evacuees do not follow evacuation instructions can control the increase in evacuation time of the disaster weak, even if many evacuees do not act as per instructions. SRM with a margin rate 0.8 can keep average evacuation time of the disaster weak lower than that of the COP, and 80% of the disaster weak can evacuate earlier when the non-cooperative healthy people rate is 80% (
Figure 10b). However, evacuation of the remaining 20% of them is delayed, and the value of total evacuation time of all evacuees is higher than that of COP. The results indicate that smooth evacuation of the disaster weak can be achieved with help of a certain number of cooperative evacuees.
Evacuation simulations are effectively utilized for predicting evacuation time and developing disaster management plans [
15,
32]. Mas et al. [
15] have proposed a simulation using tsunami and evacuation model that enables observation of complex human behavior in evacuation. Chu et al. [
32] have proposed the simulation framework for evacuation of residents community to create emergency management. The target of these studies is mainly local residents in disaster areas, while flows of visitors in unusual situations like festivals are not considered. These visitors are unfamiliar with the areas and can act against evacuation instructions. Thus, how cooperative they are will depend on who the visitors are (the elderly, children or the disabled, etc.) and how many people possess devices in which applications to get instructions are installed. Through the simulations, we have shown how much time is required to evacuate, how many of the disaster weak are refused by shelters, and how we should assign evacuees to shelters in every pattern of settings of shelter margin and the rate of non-cooperative healthy people. Providing security organizations these results can help them develop plans of disaster management for evacuees including the disaster weak and guards arrangement in situations of crowded evacuees like festivals. Considering this, our methods have potential to be useful in real disaster situations.
The average evacuation time of healthy people is longer when using the proposed method than COP. This is due to the fact that the proposed method assigns some healthy people to shelters other than those located nearest to their position. In future work, we must consider how giving priority to the disaster weak imposes burdens on healthy people and propose a better method in order to bridge the gap between the disaster weak and healthy people.
In the simulation conducted in this paper, the behavior patterns of agents that represent evacuees are quite simple. There are only two choices for the first destination that can be selected by agents, namely the nearest shelter or the shelter decided by the evacuation system. In order to achieve more realistic simulations, introducing a complex evacuation behavior model of both healthy people and the disaster weak into simulations is required. Developing a method to predict evacuees’ behavior and decisions based on realistic evidence, such as statics or surveys, is also a challenge for more effective evacuation support.
7. Conclusions
In this paper, we have proposed two evacuation shelter decision methods to provide the disaster weak with support: (1) FRM and (2) SRM. The first method sets the assignment number at the same percentage for all shelters, and the second method decides the destination for each evacuee based on the simulation results of several scenarios. In this study, we investigated via multi-agent simulations the evacuation behavior of both healthy and vulnerable individuals, with a particular focus on the disaster weak. The proposed methods limited the numbers of evacuees assigned to a given shelter in order to give priority to the disaster weak when selecting shelter destinations for all evacuees. Therefore, our methods have a positive effect on reducing evacuation times of all evacuees. To be specific, the following are primary the findings of this study:
Giving priority to the disaster weak can make healthy people take longer time for evacuation. When some healthy people are non-cooperative with evacuation instructions, the disaster weak can be turned away by shelters. Thus, it is important to assume non-cooperative evacuees’ behavior for strategies that attempt to ease burdens on the disaster weak.
FRM with a margin rate, which sets the assignment number at the same percentage for all shelters, can reduce the evacuation time of the disaster weak compared to the method that only gives priority to them. However, if the value of the margin rate is too high, FRM is not able to decide the destinations of evacuees.
SRM, which estimates how congestion in disaster areas occurs by simulations, sets the assignment number for shelters based on estimation instead of limiting the assignment numbers for all shelters uniformly like FRM. Compared to FRM, SRM can evacuate more of the disaster weak earlier.
SRM can reduce the average evacuation time of the disaster weak and evacuate more of the disaster weak compared to COP when the number of non-cooperative evacuees is less than the assumed number.
In the future, we will plan to investigate how the proposed methods work in other scenarios and to develop better methods to bridge the gap between healthy people and the disaster weak.
Author Contributions
Conceptualization, T.T.; methodology, T.T.; software, T.T.; validation, T.T.; formal analysis, T.T.; investigation, T.T.; resources, T.T.; data collection, T.T. and Y.M.; writing—original draft preparation, T.T., Y.M., and M.F.; writing—review and editing, M.F., H.S., and K.Y.; visualization, T.T.; supervision, Y.M., M.F., H.S., and K.Y.; project administration, Y.M., M.F., H.S., and K.Y.; funding acquisition, H.S. and K.Y. All authors have read and agreed to the published version of the manuscript.
Funding
This study was supported in part by the Japan Society for the Promotion of Science, Grants-in-Aid for Scientific Research Number JP19H01139.
Conflicts of Interest
The authors declare no conflict of interest.
References
- Namba, Y.; Furukawa, Y. Present condition grasp of the disaster weak and evacuation at the time of disaster: Case study on Higashihiroshima City. In Research Reports of the School of Engineering; Kinki University: Osaka, Japan, 2006; pp. 41–46. (In Japanese) [Google Scholar]
- Kawata, Y.; Tsuji, Y.; Syamsudin, A.; Matsuyama, M.; Matsutomi, H.; Imamura, F.; Takahashi, T. Response of residents at the moment of tsunamis-The 1992 Flores Island earthquake tsunami, Indonesia. In Tsunami: Progress in Prediction, Disaster Prevention and Warning; Springer: Berlin/Heidelberg, Germany, 1995; pp. 173–185. [Google Scholar]
- Tatsuki, S. Old Age, Disability, and the Tohoku-Oki Earthquake. Earthq. Spectra 2013, 29, S403–S432. [Google Scholar] [CrossRef]
- Chanta, S.; Sangsawang, O. Shelter-site selection during flood disaster. Lect. Notes Manag. Sci. 2012, 4, 282–288. [Google Scholar]
- Kasai, Y.; Sasabe, M.; Kasahara, S. Congestion-aware route selection in automatic evacuation guiding based on cooperation between evacuees and their mobile nodes. EURASIP J. Wirel. Commun. Netw. 2017, 2017, 1–11. [Google Scholar] [CrossRef][Green Version]
- Komatsu, N.; Sasabe, M.; Kawahara, J.; Kasahara, S. Automatic evacuation guiding scheme based on implicit interactions between evacuees and their mobile nodes. GeoInformatica 2018, 22, 127–141. [Google Scholar] [CrossRef]
- Umeki, K.; Nakamura, Y.; Fujimoto, M.; Mizumoto, T.; Suwa, H.; Arakawa, Y.; Yasumoto, K. Evacuation Center Determination Method Considering Bias of Congestion Degree on Areas. J. Inf. Process. 2019, 60, 608–616. (In Japanese) [Google Scholar]
- Fitrianie, S.; Rothkrantz, L. Dynamic routing during disaster events. In Proceedings of the 12th International Conference on Information Systems for Crisis Response and Management, Kristiansand, Norway, 24–27 May 2015; pp. 1–9. [Google Scholar]
- Murotsu, H.; Fujimoto, M.; Suzuki, T.; Ebara, H.; Wada, T.; Okada, H. A novel evacuation route search algorithm for route distribution of evacuees groups in fire disasters. In Proceedings of the 2014 Australasian Telecommunication Networks and Applications Conference (ATNAC), Southbank, Australia, 26–28 November 2014; IEEE: New York, NY, USA, 2014; pp. 182–188. [Google Scholar]
- Tsunemine, T.; Kadokawa, E.; Ueda, Y.; Fukumoto, J.; Wada, T.; Ohtsuki, K.; Okada, H. Emergency urgent communications for searching evacuation route in a local disaster. In Proceedings of the 2008 5th IEEE Consumer Communications and Networking Conference, Las Vegas, NV, USA, 10–12 January 2008; IEEE: New York, NY, USA, 2008; pp. 1196–1200. [Google Scholar]
- Trono, E.M.; Fujimoto, M.; Suwa, H.; Arakawa, Y.; Yasumoto, K. Generating pedestrian maps of disaster areas through ad hoc deployment of computing resources across a DTN. Comput. Commun. 2017, 100, 129–142. [Google Scholar] [CrossRef]
- Fujimoto, M.; Matsumoto, S.; Trono, E.M.; Arakawa, Y.; Yasumoto, K. Effective application distribution system for internet-less communication during disasters. Sens. Mater. 2020, 32, 79–95. [Google Scholar] [CrossRef]
- Sbayti, H.; Mahmassani, H.S. Optimal scheduling of evacuation operations. Transp. Res. Rec. 2006, 1964, 238–246. [Google Scholar] [CrossRef]
- Chen, X.; Zhan, F.B. Agent-based modeling and simulation of urban evacuation: Relative effectiveness of simultaneous and staged evacuation strategies. In Agent-Based Modeling and Simulation; Springer: Berlin/Heidelberg, Germany, 2014; pp. 78–96. [Google Scholar]
- Mas, E.; Suppasri, A.; Imamura, F.; Koshimura, S. Agent-based simulation of the 2011 great east japan earthquake/tsunami evacuation: An integrated model of tsunami inundation and evacuation. J. Nat. Disaster Sci. 2012, 34, 41–57. [Google Scholar] [CrossRef]
- Bangate, J.; Dugdale, J.; Beck, E.; Adam, C. A multi-agent system approach in evaluating human spatio-temporal vulnerability to seismic risk using social attachment. WIT Trans. Eng. Sci. 2018, 121, 47–58. [Google Scholar]
- Sharbini, H.; Sallehuddin, R.; Haron, H. An Analysis of a Modified Social Force Model in Crowd Emergency Evacuation Simulation. Appl. Model. Simul. 2019, 3, 135–144. [Google Scholar]
- Makinoshima, F.; Imamura, F.; Abe, Y. Enhancing a tsunami evacuation simulation for a multi-scenario analysis using parallel computing. Simul. Model. Pract. Theory 2018, 83, 36–50. [Google Scholar] [CrossRef]
- McGuire, L.C.; Ford, E.S.; Okoro, C.A. Natural disasters and older US adults with disabilities: Implications for evacuation. Disasters 2007, 31, 49–56. [Google Scholar] [CrossRef] [PubMed]
- Arai, K.; Sang, T.X. Decision making and emergency communication system in rescue simulation for people with disabilities. Int. J. Adv. Res. Artif. Intell. 2013, 2, 77–85. [Google Scholar] [CrossRef]
- Koo, J.; Kim, Y.S.; Kim, B.I.; Christensen, K.M. A comparative study of evacuation strategies for people with disabilities in high-rise building evacuation. Expert Syst. Appl. 2013, 40, 408–417. [Google Scholar] [CrossRef]
- Manley, M.; Kim, Y.S. Modeling emergency evacuation of individuals with disabilities (exitus): An agent-based public decision support system. Expert Syst. Appl. 2012, 39, 8300–8311. [Google Scholar] [CrossRef]
- Koo, J.; Kim, Y.S.; Kim, B.I. Estimating the impact of residents with disabilities on the evacuation in a high-rise building: A simulation study. Simul. Model. Pract. Theory 2012, 24, 71–83. [Google Scholar] [CrossRef]
- Christensen, K.; Sharifi, M.S.; Chen, A. Considering individuals with disabilities in a building evacuation: An agent-based simulation study. In Proceedings of the 92nd Annual Meeting of the Transportation Research Board, Washington, DC, USA, 13–17 January 2013; pp. 11–13. [Google Scholar]
- Christensen, K.; Sasaki, Y. Agent-based emergency evacuation simulation with individuals with disabilities in the population. J. Artif. Soc. Soc. Simul. 2008, 11, 9. [Google Scholar]
- Kyoto Shimbun. Available online: https://www.kyoto-np.co.jp/articles/-/228391 (accessed on 30 April 2021).
- Mainichi Shimbun. Available online: https://mainichi.jp/articles/20200420/k00/00m/040/125000c (accessed on 30 April 2021).
- Asahi Shimbun. Available online: https://www.asahi.com/articles/ASN4K413KN4KPLZB00B.html (accessed on 30 April 2021).
- The Nikkei. Available online: https://www.nikkei.com/article/DGXMZO58168340X10C20A4000000 (accessed on 30 April 2021).
- Kyoto City Official Website. Available online: https://www.city.kyoto.lg.jp/sankan/cmsfiles/contents/0000271/271655/honsatu.pdf (accessed on 30 April 2021). (In Japanese).
- Statistics Bureau of Japan. Available online: https://www.stat.go.jp/data/jinsui/pdf/202001.pdf (accessed on 30 April 2021). (In Japanese)
- Chu, H.; Yu, J.; Wen, J.; Yi, M.; Chen, Y. Emergency Evacuation Simulation and Management Optimization in Urban Residential Communities. Sustainability 2019, 11, 795. [Google Scholar] [CrossRef]
| Publisher’s Note: MDPI stays neutral with regard to jurisdictional claims in published maps and institutional affiliations. |
© 2021 by the authors. Licensee MDPI, Basel, Switzerland. This article is an open access article distributed under the terms and conditions of the Creative Commons Attribution (CC BY) license (https://creativecommons.org/licenses/by/4.0/).


