Article

The Imperativeness of Environmental Quality in China Amidst Renewable Energy Consumption and Trade Openness

by
Özgür Bayram Soylu
1,
Tomiwa Sunday Adebayo
2 and
Dervis Kirikkaleli
3,*
1
Department of Economics, Faculty of Economics and Administrative Sciences, Kocaeli University, Kocaeli 41001, Turkey
2
Department of Business Administration, Faculty of Economics and Administrative Science, Cyprus International University, Nicosia 99258, Turkey
3
Department of Banking and Finance, Faculty of Economics and Administrative Sciences, European University of Lefke, Lefke 99010, Turkey
*
Author to whom correspondence should be addressed.
Sustainability 2021, 13(9), 5054; https://doi.org/10.3390/su13095054
Submission received: 30 March 2021 / Revised: 23 April 2021 / Accepted: 24 April 2021 / Published: 30 April 2021
(This article belongs to the Section Economic and Business Aspects of Sustainability)

Abstract

:
It is widely accepted that CO2 emissions are the primary cause of climate change and environmental destruction. China, the world’s biggest carbon emitter, is the subject of this research. Utilizing the wavelet tools (wavelet correlation, wavelet coherence, multiple wavelet coherence, and partial wavelet coherence), the present study intends to capture the time-frequency dependence between CO2 emissions and renewable energy, economic growth, trade openness, and energy usage in China between 1965 and 2019. The advantage of the wavelet tools is that they can differentiate between short, medium, and long-run dynamics over the period of study. Furthermore, the study utilized the gradual shift causality test to capture the causal interconnection between CO2 emissions and the regressors. The findings from Bayer and Hanck showed a long-run relationship among the variables of interest. Furthermore, the findings from the wavelet coherence test revealed a positive relationship between CO2 emissions and economic growth and energy usage at all frequencies. Although there is a weak negative relationship between renewable energy and CO2 emissions in the short run, there is no significant co-movement between CO2 emissions and trade openness. The outcomes of the partial and multiple wavelet coherence also give credence to the outcomes of the wavelet coherence test. Lastly, the gradual shift causality test revealed a one-way causality from energy usage and economic growth to CO2 emissions. Based on the findings, suitable policy suggestions were proposed.

1. Introduction

Carbon emissions are one of the greenhouse gases (GHGs) that are generally recognized as the key cause of global change and ecological pollution. Environmental mitigation and climate change are two of the most pressing ecological concerns on the global agenda, and they have prompted scholars to investigate the relationship between economic growth and CO2 pollution. It is well understood that the combustion of fossil fuels, oil, natural gas, and coal is the primary cause of increasing CO2 emissions and, as a result, the degradation of the natural habitat [1]. Likewise, Kirikkaleli [2] reported that considering the significant effect of economic growth on both industrialized and emerging countries’ living conditions, the tripling of the global economy in the last two decades is blamed for environmental degradation. Over the years, China has been witnessing an increase in economic growth, which has come at the expense of environmental quality. Figure 1 depicts the increasing trend of both economic growth and CO2 emissions in China from 1965 to 2019. China also replaced the United States as the world’s biggest carbon emitter.
China’s key goal in its 13th Five-Year Plan is to reduce CO2 emissions per unit of GDP by 18% by 2020 compared to 2015. Similar to other developing countries, policymakers in China must curb CO2 pollution in order to reach the national sustainability goals at the minimum cost. To counter climate change and its harmful effects, nations must effectively collaborate. As a consequence, the 196 countries that met in Paris in December 2015 for the Conference of the Parties (COP21) plan to play a key role in combating climate change and reducing greenhouse gas emissions. The landmark Paris Agreement’s main goal is to hold global warming below 2 °C over pre-industrial levels, with a goal of 1.5 °C [3]. China’s emissions are expected to plateau in the first half of the 2020s, with 13 to 16 gigatons of CO2 emissions [4]. According to this prediction, China is nearly five years ahead of the new Paris goal of 2030. The Paris climate goals are intended to enable both developed and developing countries to focus on a single core policy of decreasing CO2 intensity of GDP over time.
Recent scholars have examined the association between economic growth and CO2 emissions in the related environmental literature. There is, however, no agreement this association [2,4]. Hence, this study employed the time-frequency dependency approach to examine the relationship between CO2 emissions and renewable energy, economic growth, trade openness, and energy use in China covering the period between 1965–2019, which has not yet been explored using the wavelet tools (wavelet correlation, wavelet coherence, multiple wavelet coherence, and partial wavelet coherence). Since Grossman and Krueger’s innovative research [5], the effect of economic growth, energy use, and trade openness has been assessed by numerous scholars in the empirical literature. In the studies assessing the determinants of CO2 emissions, it seems that the impacts of GDP growth [4,6,7,8,9], energy consumption [10,11,12,13], trade openness [14,15,16,17,18,19,20,21], and renewable energy consumption [1,21,22,23,24] have been examined.
The mixed results of previous studies on the linkage between CO2 emissions and economic growth, energy usage, renewable energy use, and trade openness shows that this topic needs further investigation. All of the mixed findings, i.e., the lack of a scientific agreement, drive our research in this study. The decision to concentrate on China stems from the reality that it is the world’s largest carbon emitter, and research in this area has been limited thus far. China is the biggest contributor to CO2 emissions with a GDP per capita of US$10,261.68 and a population of 1.408 billion respectively. As a result, one of the contributions of this paper is that it provides valuable policy guidance on CO2 emissions mitigation in China, as well as a useful lesson for others in the global sense.
This study is different from prior studies [7,11,13,25] that have analyzed these associations using time-domain analyses such as ARDL, VECM, FMOLS, DOLS, OLS, CCR, GMM, and PVAR to investigate the impact of economic growth, trade openness, and energy consumption and renewable energy use on CO2 emissions. In the economic literature, time-domain analysis is the most widely used method for studying time series. Individual parameter evolution is constructed, and multivariate associations are measured over time using this method. Another body of study concentrates on frequency-domain analysis. In the context where all time and frequency domains are taken into account, the wavelet approach (WA) reconciles both approaches. This approach differentiates between short, medium, and long-run dynamics over the entire sampling period. The wavelet transformation is an effective method for signal analysis and processing that is incredibly useful in a variety of areas, including denoising and compression, as well as working with non-stationary signals as pictures. Long-term dynamics at low frequencies (backgrounds) are referred to as patterns, whereas short-term dynamics at high frequencies (discontinuity, edges) are referred to as anomalies. There are several fascinating features attached with the wavelet transform: (i) it has strong time–frequency localization capabilities; (ii) it can analyze signals with features that change over time; (iii) it gives a depiction on various scales (multi-resolution representation); and (iv) it can be achieved via a filter bank.
Although several papers have assessed the impact of renewable energy consumption, energy use, economic growth, and trade openness on environmental degradation, to the best of our knowledge, the present paper is the first paper to apply wavelet tools (wavelet correlation, partial wavelet coherence, and multiple wavelet coherence and wavelet coherence) to investigate this analysis by incorporating agriculture into the model as a determinant of environmental degradation. Table 1 presents a summary of prior studies. The remaining section of this research is compiled as follows: the data and methodology are illustrated in Section 2. The data analysis and discussion are portrayed in Section 3 and the conclusion is presented in Section 4.

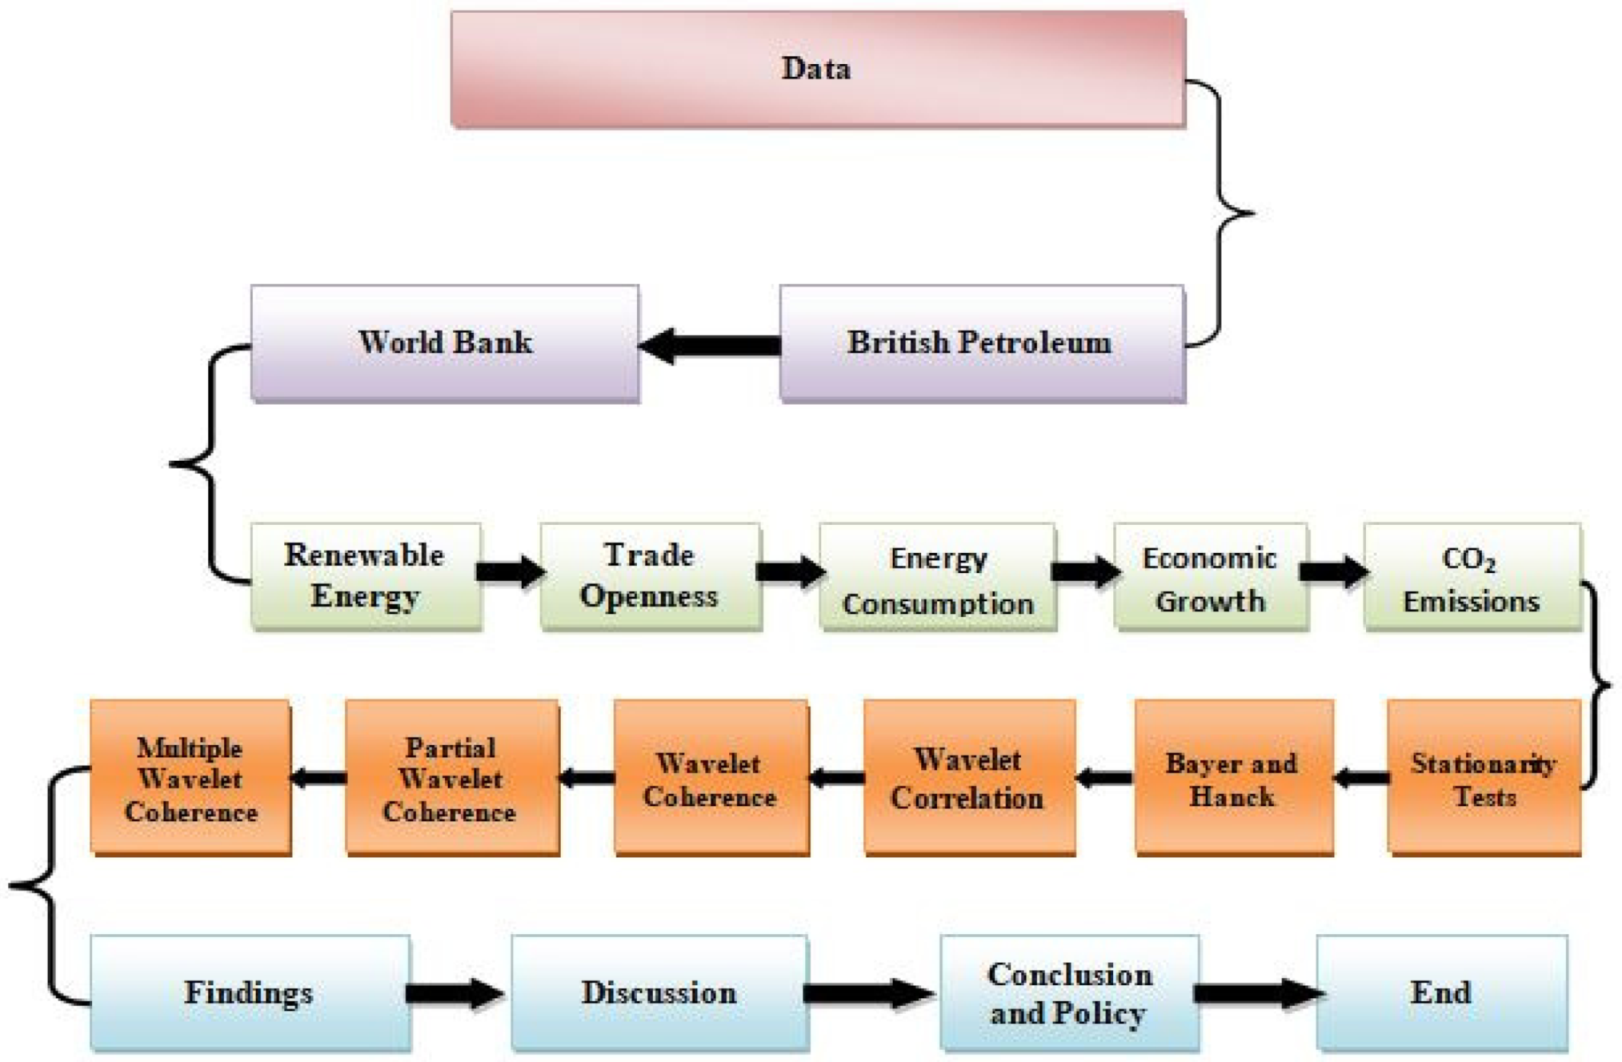
2. Data and Methodology

This segment describes the data and analytical methodology used in modelling, the correlation and causal relationship between CO2 emissions and trade openness, economic development, renewable energy use, and energy use in China. Since China is still the world’s largest carbon emitter, several studies have been conducted to study the impact and determinants of CO2 emissions. That being said, to the best of the authors’ knowledge, no research has been undertaken to utilize wavelet tools (wavelet correlation, partial wavelet coherence, wavelet correlation, and multiple wavelet coherence) to catch the time–frequency dependency between CO2 pollution and trade openness, economic development, renewable energy use, and energy consumption in China.

2.1. Data

This empirical analysis investigates the influence of energy consumption, trade openness, economic growth, and renewable energy consumption on CO2 emissions in China, utilizing data spanning from the period 1965 and 2019 for all indicators. The data description, source, and unit of measurement are depicted in Table 2. Furthermore, all the variables of interest are transformed into their natural log. This is done to ensure data are conformed to normal distribution [2,7]. Figure 2 depicts the flow of analysis, and Figure 2 shows the trends of CO2 emissions, energy consumption, economic growth, renewable energy consumption, and trade openness. The study functional form is depicted in Equation (1) as follows
CO 2 = f ( GDP ,   EC ,   TO ,   REC )
In Equation (1), CO2 stands for carbon emissions, GDP represents economic growth, EC is energy consumption, TO illustrate trade openness, and REC signifies renewable energy consumption.

2.2. Methodology

2.2.1. Stationarity Tests

Stationarity testing is important in this empirical analysis to avoid the issue of erroneous analysis. Econometric literature has a number of unit root test methods, including KPSS proposed by Kwiatkowski et al. [46], augmented Dickey–Fuller (ADF) suggested by Dickey and Fuller [47], and PP initiated by Phillips and Perron [48]. Nevertheless, all of the tests referred to above do not account for the break(s) in series, which are known to affect economic indicators. As stated by Rjoub et al. [7], if there is proof of a break-in parameter, the aforementioned unit root tests (ADF, PP, KPSS, and ER) can provide biased estimates. Therefore, to determine the asymptotic characteristics and the indicators’ integration order, the stability test is essential. The Zivot and Andrews [49] test bypass the above-identified problems by adjusting for one structural break. The null and alternatives hypothesis of the ZA unit root test states unit root (H0: θ = 0) and no unit root (H1: θ < 0). Failure to reject H0, therefore, means the existence of unit roots, whereas rejection is a sign of stationarity. The only drawback of the ZA root test is that it can only catch one break in series. Therefore, the Lee and Strazicich (LS) [50] unit root test was included in the analysis. The benefit of LS is that it can capture both two breaks and stationarity characteristics of a variable. The null and alternatives hypothesis of the LS unit root test states unit root (H0: θ = 0) and no unit root (H1: θ < 0). There is proof of unit root if H0 is not rejected, whereas rejection is a sign of stationarity.

2.2.2. Bayer and Hanck Cointegration Test

It is important to consider the long-run linkage between CO2 emissions and its determinants (economic growth, trade openness, and renewable energy use). As a consequence, the integrated cointegration of Johansen [51], Engle and Granger [52], Banerjee et al. [53], and Boswijk [54] was included in this empirical analysis. According to Kirikkaleli and Adebayo [44] the test eliminates the needless comprehensive cointegration methods produced by other cointegration tests. Moreover, this test utilized the Fisher formula. The Equations below depict the Bayer and Hanck (2013) cointegration test.
EG JOH   = 2 [ ln ( PEG ) + ln ( PJOH ) ]
EG JOH BO BD = 2 [ ln   ( PEG ) + ln   ( PJOH ) + ln ( PBO ) + ln ( PBDM ) ]
where PEG represents the level of significance for Engle and Granger (1987), PJOH represents the level of significance for Johansen [51]. The level of significance for Banerjee et al. [53] and Boswijk’s [54] cointegration tests are expressed by PBDM and PBO, collectively.

2.2.3. Wavelet Coherence Test

The present research utilized the novel wavelet coherence test to assess the time-frequency dependence of carbon emissions (CO2), and energy consumption (EC), renewable energy use (REC), trade openness (TO), and economic growth (GDP) in China. With a wavelet analysis, a time series could be separated into frequency elements. Although the Fourier analysis has a full ability of representation and decomposition of stationary time-series, the research could be conducted with a nonstationary time-series through wavelets. Furthermore, wavelets promote the conservation of time for localized information, enabling comovement to be measured in the time–frequency space. Wavelet coherence analysis is mainly time series analysis. The cross wavelet transform is defined by two-time series x(t) and y(t) with the continuous transforms of wx(u,s) and wy(u,s). Where u is the position index, s is the scale, the complex conjugate is depicted by *. Finally, to test the coherence of the cross wavelet transform in the time–frequency space, and following Torrence and Webster [55] and Grinsted et al. [56], we apply the wavelet squared coherence called wavelet coherence that can be defined as
R 2 ( s ) = | S ( s 1 w t xy ( s ) ) | 2 S ( s 1 | w t x ( s ) | 2 ) S ( s 1 | w t y ( s ) | 2 )
The wavelet coherence can be interpreted as a correlation coefficient with a value range between 0 and 1, s denotes the smoothing parameter. In the no smoothing case, the wavelet coherence will be equal to 1. The squared wavelet coherence coefficient varies from 0 ≤ R2(k,f) ≤ 1, with values close to 0 suggesting poor correlation and values close to 1 confirming strong correlation. As a consequence, wavelet coherence can be regarded as a valuable method for evaluating the association of chosen parameters over time. Following Torrence and Compo [55] and Grinsted et al. [56], we applied the smoothing operator S as
S ( W ) = S scale ( S time ( W n ( S ) ) )
Smoothing along the wavelet scale axis is denoted by Sscale, and smoothing in time is denoted by Stime. It is only normal to build the smoothing operator to have a footprint identical to the wavelet in use. Torrence and Webster [55] proposed a fitting smoothing operator for the Morlet wavelet.
S time ( W ) s =   W n ( s )     x 2 Π ( 0.6 s ) ) n ,
S time ( W ) s = ( W n ( s )     1 2 x 1 2 s 2 ) S  
where Stime represents time smoothing, frequency (bandwidth) is depicted by W, x1, and x2 represent normalization constants, and rectangle function is depicted by П. Also, dimensionless time is represented by n. The scale decorrelation length for the Morlet wavelet has been empirically calculated at 0.6. [57]. Both convolutions are implemented discretely in practice, so the normalization coefficients are measured numerically.

2.2.4. Partial Wavelet Coherence

Partial wavelet coherence (PWC) is an approach that is close to partial correlation (PC). The wavelet transformation technique is used to compute PWC. The technique captures wavelet coherence for two series x1 and x2 after the third series x3 effect is canceled. As a consequence, the coherence between x1 and x2, x1 and x3, and x1 and x3 are modified as
R ( x 1 ,   x 2 ) = S [ W ( x 1 , x 2 ) ] S [ W ( x 1 ) ] ,   S [ W ( x 2 ) ] ;
R 2 ( x 1 ,   x 2 ) = R ( x 1 ,   x 2 ) · R ( x 1 ,   x 2 ) ;
R ( x 1 ,   x 3 ) = S [ W ( x 1 , x 2 ) ] S [ W ( x 1 ) ] ,   S [ W ( x 3 ) ] ;
R 2 ( x 1 ,   x 3 ) = R ( x 1 ,   x 3 ) · R ( x 1 ,   x 3 ) ;
R ( x 2 ,   x 3 ) = S [ W ( x 2 , x 2 ) ] S [ W ( x 2 ) ] ,   S [ W ( x 3 ) ] ;
R 2 ( x 2 ,   x 3 ) = R ( x 2 ,   x 3 ) · R ( x 2 ,   x 3 ) ;
Mihanovi et al. (2009) suggested that the PWC be developed on linear association theory (by annulling the influence of x3). As a result, Equation (13) portrays the partial correlation square as
RP 2 ( x 1 ,   x 2 ,   x 3 ) = | R ( x 1 ,   x 2 ) R ( x 1 ,   x 2 ) · R ( x 1 ,   x 2 ) * | [ 1 R ( x 1 x 3 ) ] 2 [ 1 ( x 3 x 2 ) ] 2
Furthermore, as Kristoufek (2016) reported, PWC ranges from 0 to 1 and is specified as a square of the PC between series x1 and x2 after eliminating the influence of x3. A low PWC suggests that when the impact of x3 is excluded, series x2 has no effect on x1 [1,58].

2.2.5. Multiple Wavelet Coherence

As stated by Adebayo and Kirikkaleli [1] and Mishra et al. [58], the multiple wavelet coherence (MWC) approach is adequate for examining the coherence of a wide range of parameters with other control parameters. For the presentation of MWC, the following equation can be written
RM 2 ( x 1 ,   x 2 ,   x 3 ) = R 2 ( x 1 , x 2 ) +   R 2 ( x 1 , x 3 ) 2 Re [ R ( x 1 , x 3 ) R ( x 3 ,   x 2 ) * ] 1 R 2 ( x 3 ,   x 2 )

3. Findings

3.1. Pre-Estimation Tests

Despite the fact that countless studies have been undertaken to investigate the relationship between CO2 emissions and economic growth, trade openness, renewable energy, and energy use, no research has been conducted to capture the time–frequency dependence of CO2 emissions and economic growth, trade openness, renewable energy, and energy use in China utilizing combined wavelet tools. The present study assesses brief information of the variables of interest, which is depicted in Table 3. The minimum and maximum CO2 emissions range from 0.5667 to 7.0963, renewable energy consumption from 70.606 to 3476.8, energy use from 1929.1 to 27,452.4, and economic growth 173.06 to 8254.5 and trade openness range from 4.9208 to 64.478. Moreover, the outcomes of the Jarque-Bera show that CO2 emissions, energy use, renewable energy, and GDP growth do not conform to normal distribution while trade openness is normally distributed. Therefore, the application of linear techniques—such as ARDL, DOLS, FMOLS, CCR, VECM, OLS, etc.—will yield misleading outcomes. The current study used the wavelet tools to assess the linkage between CO2 and GDP, TO, EC, and REC.
We proceed to examine the stationarity features of the parameters of concern by utilizing ADF and PP unit root tests. The outcomes of both PP and ADF are depicted in Table 4, and the outcomes show that all the series are stationary at first difference as revealed in Table 4. Furthermore, as it is widely known if there is proof of break(s) in series, the conventional unit root tests (ADF, PP, KPSS) will yield misleading outcomes [10,11,14]. As a result, we employed both Zivot-Andrews (ZA) and Lee and Strachwich (LS) unit root tests. Both ZA and LS’s uniqueness is that they can both capture unit root and break(s) in series concurrently. The outcomes of these tests are depicted in Table 5 and the results show that all the series are stationary at first difference as revealed by both ZA and LS unit root tests. After confirming the series’s stationarity features, the present research applied the Bayer and Hanck cointegration test to capture the long-run association between CO2 emissions and the regressors. The outcome of the Bayer and Hanck cointegration test is depicted in Table 6. The outcome shows that there is cointegration amongst the series in the long-run. Thus, the null hypothesis of no cointegration was rejected at a significance level of 5%.

3.2. Wavelet Correlation (WC) Results

Figure 3a–d describes the wavelet correlations between the CO2 emissions and the regressors (EC, GDP, REC, and TO). Figure 3a–d illustrate the wavelet correlation between CO2 emissions and energy use, trade openness, renewable energy, and economic growth at short-term, medium-term, and long term, respectively. If the correlation value is near 0, there is no association between the variables. Nevertheless, if the correlation value is near one, it indicates that the two parameters depend on one another. Furthermore, a negative correlation value indicates that the series move in the opposite direction, while a positive correlation means that the variables move together. The wavelet correlation test’s major advantage is that it can catch the correlation between two-time series at different scales. The wavelet correlation outcomes showed that: (a) At scale 1–8, there is evidence of a strong and positive correlation between CO2 emissions and energy consumption as revealed by Figure 3a. (b) There is proof of a positive correlation between CO2 emissions and economic growth at a scale 1–8 as revealed by Figure 3b. (c) There is a weak and negative correlation between renewable energy use and CO2 emissions at a scale 1–8 as disclosed by Figure 3c. (d) At a scale 1–8, there is proof of a positive correlation between CO2 emissions and trade openness. As a result, we infer that there is a proof correlation between CO2 emissions and the independent variables (renewable energy consumption, economic growth, trade openness, and energy consumption).

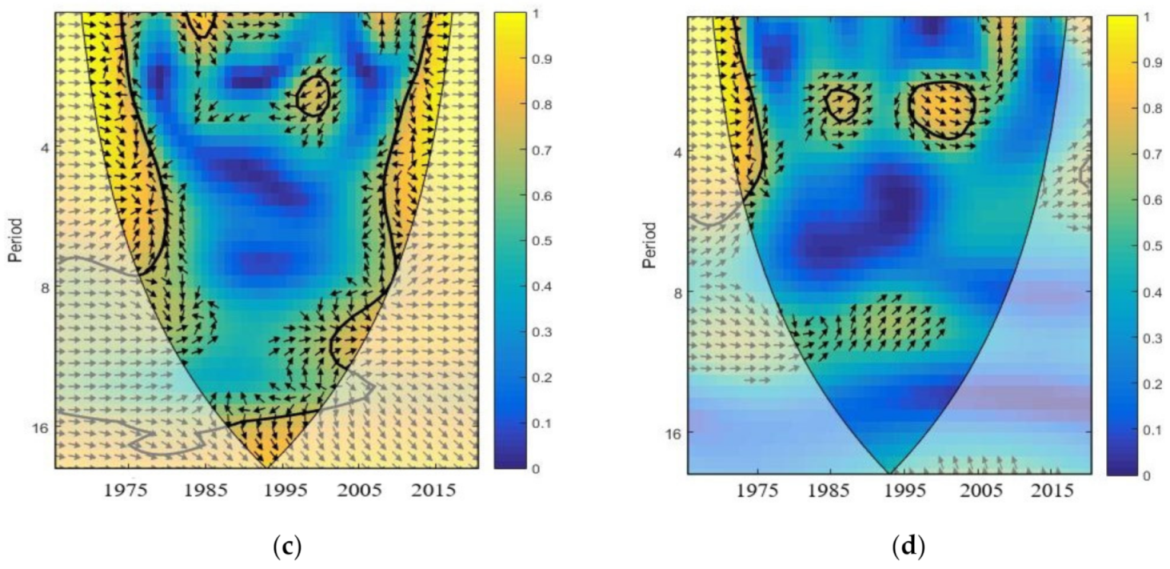
3.3. Wavelet Coherence Results

The study utilized the wavelet coherence (WTC) test to assess the correlation CO2 emissions and energy consumption, trade openness, and renewable energy consumption in China between 1965 and 2019. This approach is adopted from physics and engineering, and it is used to extract previously unknown information. As a result, the paper investigates the relationship between GDP and EC, REC, and TO in the short, medium, and long term. Discussion is done inside the cone of influence (COI). The thick black contour illustrates a level of significance based on simulations of Monte Carlo. Furthermore, the vertical and horizontal axis in Figure 4a–d depicts frequency and time, respectively. The blue and yellow colors represent low and high dependence between the series. The rightward and leftward arrows illustrate positive and negative connections. Moreover, the right and down (leftward and up) illustrates that the first parameter lead (cause) the second parameter while the rightward and up (leftward and down) depict that second parameter lead (cause) the first parameter.
As clearly seen in Figure 3a, the majority of the arrows are rightward in the short, medium, and long-term from 1965 to 1984 and from 2000 to 2019 which signifies positive correlation between CO2 emissions and economic growth with GDP leading. Figure 3b illustrates the energy consumption in China from 1965 to 2019. As clearly seen, energy consumption and CO2 emissions are in-phase (positive correlation) between 1965 and 2019 at different frequencies (different scales). Furthermore, the majority of the arrows are rightward-up, which implies that energy consumption leads to CO2 emissions. Furthermore, in Figure 3c, in the short and medium terms, between 1965 and 1976, there is evidence of an in-phase association (positive correlation) between renewable energy and CO2 emissions in China. However, in the short-run—between 1995 and 2001—there is a negative comovement between CO2 emissions and renewable energy in China, which implies that a decrease follows an increase in renewable energy consumption in CO2 emissions. That being said, at different frequencies (different scales) between 2005 and 2019, there is evidence of a positive correlation between renewable energy and CO2 emissions in China. Moreover, during these periods, there is evidence of rightward-up and rightward-down arrows suggesting bidirectional causality between renewable energy and CO2 emissions. Lastly, Figure 3d illustrates the WTC between CO2 emissions and trade openness in China between 1965 and 2019. In the short- and medium-term (high and medium frequencies) from the period 1965 to 1975. Also, in the short-term between 1995 and 2005, there is evidence of a positive correlation between trade openness and CO2 emissions. In the long term, nevertheless, there is no evidence of a significant relationship between CO2 emissions and trade openness.

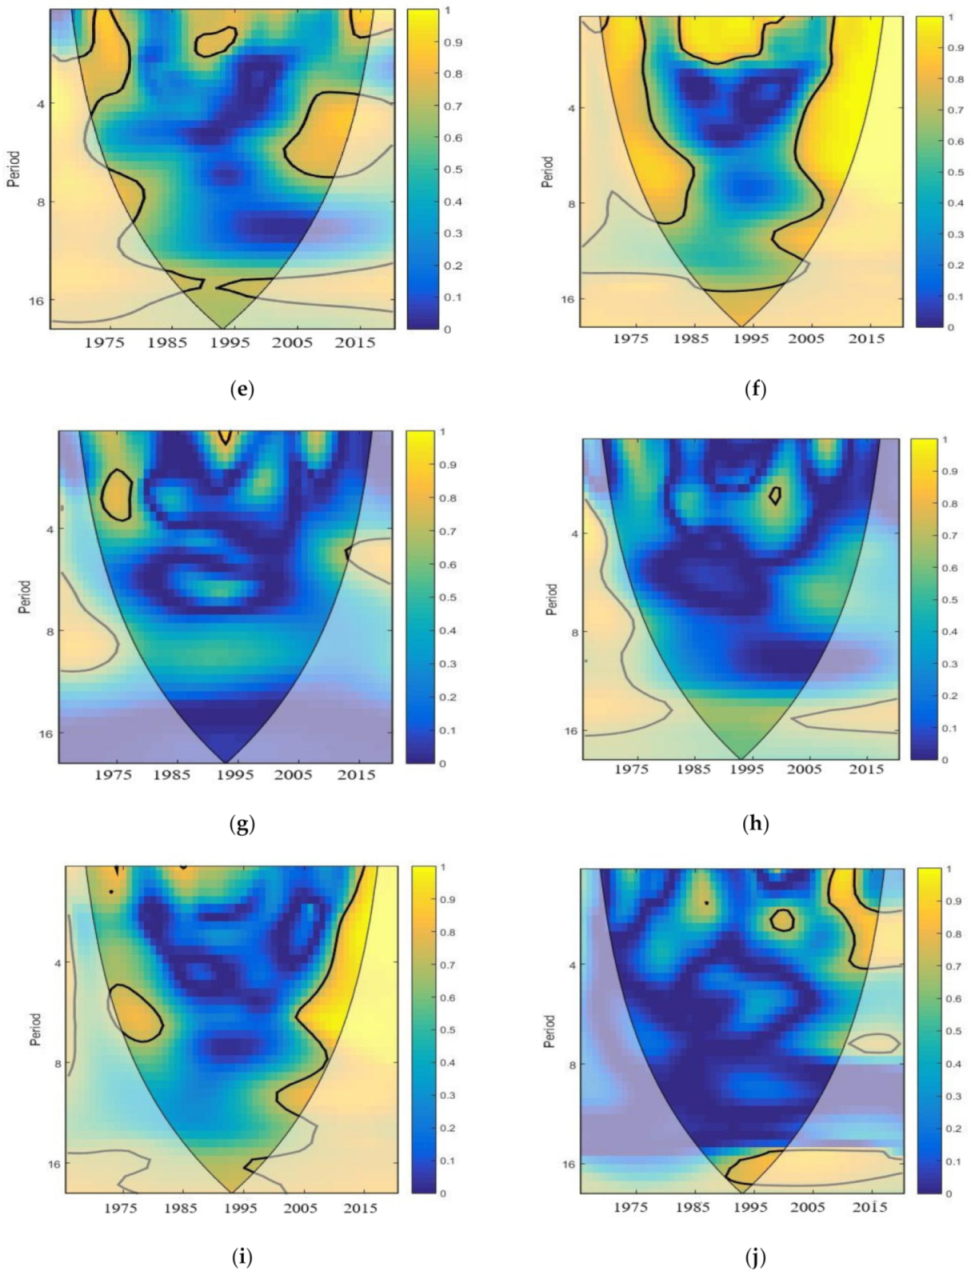
3.4. Partial Wavelet Coherence Test

Partial wavelet coherence (PWC) is a technique close to partial correlation in that it seeks to differentiate the results of wavelet coherence between two-time series after eliminating the influence of their shared dependency. Interpretation is conducted inside the cone of impact. The yellow color represents a good correlation, while the blue color represents weak to no coherence. Figure 5a displays the PWC between energy use and CO2 emissions after canceling the GDP effect. In the short-run, from 1965 to 1975 and from 2005 to 2019, there is proof of strong comovement between CO2 and energy use after canceling the effect of GDP. Furthermore, in the medium and long-run, there is evidence of significant comovement between energy use and CO2 emissions after canceling the GDP effect from 1965 and 2019. In Figure 5b, there is significant comovement between CO2 emissions and energy use from 1965 to 2019, with the effect of renewable energy being canceled in the medium and long-term.
Figure 5c portrays the PWC between energy use and CO2 emissions with the influence of trade openness canceled. In the short-run from 1965 to 1976 and from 2000 to 2019, there is a strong coherence between CO2 emissions and energy use with the effect of trade openness canceled. Moreover, at different frequencies, there is proof of significant coherence between CO2 emissions and energy use between 1965 and 2019. Figure 5d illustrates the PWC between CO2 emissions and GDP after annulling the effect of energy use. It is clear from Figure 5d that there is significant coherence between CO2 emissions and GDP after annulling the effect of energy use from 2015–2016. Figure 5e shows the PWC between renewable energy and CO2 emissions after the effect of trade openness is eliminated. At different frequencies from 1965 to 1985 and from 2000 to 2019 after annulling the influence of trade openness. Figure 5f portrays the PWC between GDP and CO2 emissions after the influence of trade openness is canceled. At different frequencies, from 1965 to 1985 and from 2005 to 2019, there is a strong coherence between GDP and CO2 emissions after the effect of trade openness is eradicated. Figure 5g depicts the PWC between renewable energy and CO2 emissions after the canceled energy use effect. In the short-term, there is evidence of comovement between CO2 emissions and renewable energy use after canceling the influence of energy use.
Figure 5h shows the PWC between CO2 and renewable energy use after the influence of GDP is canceled. The outcome shows that there is no significant comovement between CO2 emissions and renewable energy use after the effect of GDP is annulled. Figure 5i shows the PWC between renewable energy use and CO2 emissions after trade openness influence is eradicated. At medium frequency, between 1975 and 1983, there is a strong coherence between CO2 emissions and renewable energy after the effect of trade openness is canceled. Moreover, at different frequencies, between 1998 and 2019, there is a strong coherence between renewable energy and CO2 emissions after the effect of trade openness is canceled. Figure 5j shows the PWC between CO2 emissions and trade openness after canceling the influence of energy consumption. In the short-run between 2005 and 2019, there is evidence of comovement between trade openness and CO2 emissions after canceling the effect of energy use. Furthermore, there is significant comovement between CO2 emissions and trade openness between 1993 and 1998 after canceling the influence of energy use in the long-run. Figure 5k illustrates the PWC between CO2 emissions and trade openness after the influence of renewable energy is canceled. In the medium-term between 2003 and 2019, there is significant coherence between CO2 emissions and trade openness after annulling the influence of renewable energy. Figure 5l depicts the PWC between CO2 emissions and trade openness after eradicating GDP influence. In the short and medium-term, between 1985 and 2019, there is evidence of strong coherence between CO2 emissions and trade openness after canceling GDP influence.

3.5. Multiple Wavelet Coherence (MWC) Test Results

The multiple wavelet coherence (MWC) between CO2 emissions and energy use, trade openness, economic growth, and renewable energy for China between 1965 and 2019 is illustrated in Figure 6a–f. Figure 6a depicts the MWC between energy use and CO2 emissions when the influence of trade openness is considered. At different frequencies, between 1965 and 2019, there is significant comovement between energy use and CO2 emissions when the effect of trade openness is considered. Figure 6b depicts the MWC between CO2 emissions and GDP when energy use influence is considered. In the short, medium, and long-term, there is evidence of strong comovement between CO2 emissions and GDP when the influence of energy use is taking into account. Figure 6c depicts the MWC between CO2 emissions and renewable energy use when energy use influence is considered. There is evidence of strong comovement between CO2 emissions and GDP at different frequencies when the influence of energy use is considered.
Figure 6d discloses the MWC between CO2 emissions and renewable energy use when the effect of GDP is considered. At different frequencies from 1965 to 1985 and from 2005 to 2019, there is a strong coherence between CO2 emissions and renewable energy use when the effect of GDP is taken into account. Figure 6e illustrates the MWC between CO2 emissions and renewable energy use when the effect of trade openness is taken into account. At different frequencies from 1965 to 1985 and from 1995 to 2019, there is proof of significant coherence between CO2 emissions and renewable energy use with the effect of trade openness considered. Figure 6f illustrates the MWC between CO2 emissions and trade openness when the effect of GDP is taken into account. At different frequencies between 1965 and 2019, there is evidence of strong comovement between CO2 emissions and trade openness when the effect of GDP is considered.

3.6. Gradual Shift Causality Test Results

The present research captures the causal impact of energy use, trade openness, renewable energy consumption, and economic growth on CO2 emissions by employing the gradual shift causality test. The outcomes of the gradual shift causality test are presented in Table 7. The outcomes of the gradual shift causality test reveal: (i) there is one-way causality from economic growth to CO2 emissions in China. Thus, we reject the null hypothesis. This infers that economic growth can predict a significant variable of CO2 emissions. This outcome corroborates the findings of 1. Sebri and Ben-Salha [59] for BRICS nations, Oh and Bhuyan [60] for Bangladesh, Saidi and Mbarek [61] for 19 emerging nations, Zhang et al. [62] for Malaysia, Kirikkaleli, and Adebayo [22] for the global economy and Awosusi et al. [63] for South Korea. (ii) There is unidirectional causality from energy use to CO2 emissions, demonstrating that energy consumption can predict CO2 emissions. This finding is in line with the studies of He et al. [6] for Mexico, Olanrewaju et al. [11] for Thailand, and Akinsola and Adebayo [12] for Thailand. (iii) There is evidence of feedback causality between renewable energy and CO2 emissions, which implies that both renewable energy and CO2 emissions can predict each other in China. The outcomes of the gradual shift causality test provide policy implication for policymakers in China on determinants of environmental degradation.

4. Discussion

This section of the study discusses in detail the findings based on the methodologies employed. The study commenced the analysis by conducting several stationarity tests, which revealed that the variables are stationary at level I(0) and 1(1). The study employed the Bayer and Hanck cointegration and the outcomes revealed a long-run association between CO2 emissions, economic growth, trade openness, energy consumption, and renewable energy. This was followed by the wavelet correlation between the CO2 emissions and trade openness, economic growth, energy consumption, and renewable energy in China. The outcomes from the wavelet coherence revealed that energy consumption, economic growth, and trade openness have a positive correlation with CO2 emissions in China at different scales, which implies that an increase in energy consumption, economic growth, and trade openness is accompanied by an increase in CO2 emissions.
Furthermore, the study applied the wavelet coherence test to investigate this association. The advantage of the wavelet coherence test is that it can capture both correlation and causality between variables at different frequencies and time periods. The outcomes of the wavelet coherence test revealed a positive correlation between CO2 emissions and economic growth in the short, medium, and longterm. This implies that an increase in CO2 emissions is accompanied by an upsurge in economic growth in China. Furthermore, the majority of the arrows are rightward-up, indicating that economic growth leads CO2 emissions. Thus, economic growth can predict a significant variation in CO2 emissions in China. The consequence of this finding is that China’s economic growth direction is powered by CO2 emissions, which is prudent considering the country’s position as the largest global emitter. This result demonstrates that China is indeed in the scale effect period. This result validates the EKC hypothesis, since an increase in economic expansion increases CO2 emissions. This outcome is consistent with the studies of Rjoub et al. [7] for Turkey, Adebayo, and Kirikkaleli [1] for Japan; Olanrewaju et al. [11] for Thailand; Kirikkaleli et al. [2] for Turkey; and Oluwajana et al. [6] for South Africa.
Also, there is evidence of a positive correlation between CO2 emissions and energy consumption, which implies that an increase in energy consumption is accompanied by an upsurge in CO2 emissions. The probable reason for the positive correlation between energy consumption and CO2 emissions is that energy consumption from non-renewable sources is high in China. Furthermore, this result is not unexpected given that consumption of coal is the nation’s main energy source, accounting for 58% of overall energy consumption in 2020 (EIA, 2021). This finding complies with the studies of He et al. (2021) for Mexico; Rjoub et al. [7] for Turkey; Mishra et al. [58]; Odugbesan and Rjoub [26] for the MINT nations. At different frequencies, there is evidence of a positive correlation between renewable energy and CO2 emissions in China between 1965 and 1976 and between 2005 and 2019. This implies that during these periods, an upsurge in renewable energy consumption leads to an increase in CO2 emissions. However, in the shortrun—between 1995 and 2001—there is evidence of a negative correlation between renewable energy use and CO2 emissions, which suggests that an increase in renewable energy consumption decreases CO2 emissions. Moreover, during these periods, there is evidence of rightward-up and rightward-down arrows suggesting a bidirectional causality between renewable energy and CO2 emissions.
Also, there is evidence of a weak and positive correlation between trade openness and CO2 in the short and medium term. Nevertheless, in the long term, there is no evidence of a significant relationship between CO2 and trade openness. These mixed results on the relationship between trade openness and CO2 can be interpreted as follows: until the mid-1980s, a clear correlation between CO2 emissions and trade openness is supported at low and medium scales, but then the association becomes less robust, gradually being negligible in recent years. It may be argued that the relationship between CO2 pollution and trade openness is fragile and cannot explain long-term trends. This result is consistent with the findings of Mahmoud et al. [35] for Saudi Arabia, Mishra et al. [58] for United State and Mutascu [37] for France, who established a positive interconnection between trade openness and CO2 emissions in the short and medium term but found an insignificant correlation in the long run. However, this calls into question the conclusions of Sebri and Ben-Salha [59], who discovered that international trade facilitates the transition of clean energy, assisting in the decarbonization of the power sector. Since there is no evidence of such a connection most of the time, it is reasonable to conclude that trade openness has a very weak positive relationship with CO2 emissions. As a consequence of our conflicting results, we cannot confirm the existence of a stable connection between CO2 emissions and trade openness in China. This outcome contradicts the findings of Oh and Bhuyan [60] for Bangladesh, Saidi, and Mbarek [61] for 19 developing nations, Sebri et al. [59] for the BRICS, and Adebayo [14] for Thailand.
The study also employed the partial wavelet coherence and multiple wavelet coherence techniques to capture the relationship between CO2 emissions and trade openness, economic growth, and renewable energy in China. The partial wavelet coherence technique captures the impact of x1 on x2 with the effect of x3 not considered, while the multiple wavelet coherence test captures the effect of x1 on x2 with the influence of x3 considered. The outcomes of the partial wavelet coherence test showed that all the variables have strong coherence with CO2 emissions when the effect of the third variable is not considered, with the exemption of Figure 5d,g and h that represent the PWC of CO2-GDP-EC, CO2-REN-GDP, and CO2-TO-REN, respectively. Furthermore, the outcomes of the multiple wavelet coherence technique reveal that all the variables have a significant coherence with CO2 emissions with the effect of the third variable considered.
Lastly, the present study employed the Gradual shift causality test to capture the causal interconnection between CO2 emissions and economic growth, trade openness, renewable energy use and energy consumption in China. The outcomes of the gradual shift causality test disclosed that both energy consumption and economic growth can predict CO2 emissions in China. This outcome complies with prior studies [7,11,12,62,63], which established that there is a one-way causality from energy consumption and economic growth to CO2 emissions. Also, there is a feedback causality between renewable energy use and CO2 emissions.

5. Conclusions and Policy Direction

Sustainable economic growth is the major target for most nations while it may cause more emissions in a given region. Global warming and climate change have already raised many concerns among policymakers and political elites, particularly for China which has the highest CO2 emission ranking across nations. Prior studies in the literature have also studied the determinants of CO2 emissions using panel and time series-based models. Nevertheless, no prior studies have directly analyzed the time–frequency dependency of CO2 pollution and economic development, trade openness, renewable energy usage, and energy use in China utilizing wavelet tools. Using the wavelet approach, the current research assesses the correlation and causal linkage between environmental sustainability and renewable energy consumption in China while taking into account the role of energy consumption, trade openness, and economic growth in China between 1965 and 2019. No prior studies have investigated these connections utilizing the novel wavelet tools (wavelet correlation, multiple wavelet coherence, and partial wavelet coherence) to the best of the investigators’ understanding. The novelty behind wavelet tools is that they can decompose time-series into different time scales and therefore illustrate the connection between parameters. Inversely, simply analyzing the data with linear instruments may provide misleading results as this hides the confounded factors, which might influence the observed relationships. Although this empirical strategy has not been applied to this topic thus far, it brings consistent correlating evidence with far-reaching policy implications for China. Finally, we employed the gradual shift causality test to capture the causal linkage between CO2 emissions and energy use, economic growth, renewable energy consumption, and trade openness. The main innovation behind this test is that it can capture a causal linkage between series in the presence of structural break(s).
The wavelet correlation findings showed a positive correlation across time between CO2 emissions and trade openness, economic growth, and energy consumption. Nonetheless, there is evidence of a weak and negative correlation between renewable energy use and CO2 emissions in China. Furthermore, to establish the correlation and causal linkage between CO2 emissions and the independent variables, the present study used the wavelet coherence test. As anticipated, this test’s findings showed a positive correlation between CO2 emissions and energy consumption and economic growth, which implies that an increase in CO2 emissions is accompanied by an increase in energy consumption and economic growth. Furthermore, there is no significant correlation between trade openness and CO2 emissions. Although there is evidence of positive coherence between CO2 emissions and renewable energy use between 1995 and 1998 in the short-run, there is evidence of a negative correlation between CO2 emissions and renewable energy. In addition, the study also utilized the PWC and MWC to capture the interconnection between CO2 emissions and GDP, energy use, trade openness, renewable energy, and energy. The outcomes of the PWC and MWC also revealed the association between CO2 emissions and energy use, renewable energy use, trade openness, and economic growth. Lastly, the current study also used the gradual shift causality test to capture the causality between CO2 emissions and the variables of interest. The outcomes showed a unidirectional causality from energy consumption and economic growth to CO2 emissions, which implies that both energy use and economic growth can predict significant variations in CO2 emissions. Also, there is evidence of a bidirectional causal linkage between CO2 emissions and renewable energy use in China.
Based on these results, the current study makes many innovative and valuable additions to the literature, which is critical for potential sustainable development in China. Furthermore, since China is the world’s biggest carbon emitter and has ratified the COP21 obligation to maintain the increase in the global average temperatures below 2 °C, with a goal of 1.5 °C, Chinese governments and investors should invest in environmentally sustainable and renewable energy sources to boost anticipated economic development whilst constantly reducing the CO2 emissions intensity of GDP. Furthermore, China could rapidly replace fossil fuels with clean and modern energy sources in order to achieve the key aim of COP21, which is to reach peak emissions faster than the current Paris deadline of 2030. Additionally, the Chinese government can exercise caution when developing economic growth strategies that jeopardize environmental sustainability, since the findings revealed that at all frequencies, there is a positive correlation between CO2 emissions and economic growth. Moreover, there is evidence of a positive correlation between renewable energy consumption and CO2 emissions at different frequencies between 1965 and 1985 and between 2005 and 2017. Therefore, the Chinese government should pay particular attention to a variety of critical problems that have hindered renewable energy production, particularly wind, hydro, and PV generation. These issues can be effectively tackled by strengthening the mechanisms for renewable energy generation and use and fostering market structures and cross-sector and cross-regional policy cooperation. The ultimate goal is to expand the renewable energy market’s reach, boost the technological innovation capacity of renewable energy companies, and increase and utilize R&D investment for the Chinese energy industry in a responsible manner. Moreover, trade openness is significant in the short and medium term between 1965 and 1973 and in the short term between 1997 and 2005. Therefore, at low and medium frequencies and only under the business cycle rule, the Chinese policymakers should decrease trade openness in order to curtail environmental degradation due to the trading of dirty goods. Although the current research has provided significant empirical findings in the case of China, one of the main limitations of this study is that CO2 emissions are viewed as the only form of environmental degradation. Thus, further studies should examine other determinants of environmental degradation in both developing and developing countries.

Author Contributions

Conceptualization, T.S.A.; Methodology, D.K.; Software, T.S.A.; Validation, Ö.B.S.; Formal analysis, Ö.B.S.; Investigation, T.S.A.; Resources, T.S.A.; Data curation, Ö.B.S.; Writing—original draft preparation, D.K. and T.S.A.; Writing—review and editing, Ö.B.S.; Visualization, D.K.; Supervision, Ö.B.S.; Project administration, Ö.B.S. and D.K. All authors have read and agreed to the published version of the manuscript.

Funding

This research received no external funding.

Institutional Review Board Statement

Not applicable.

Informed Consent Statement

Not applicable.

Data Availability Statement

The study was conducted according to the research guidelines approved by the Ethics Committees of Authors Institutions.

Conflicts of Interest

The authors declare no conflict of interest.

References

  1. Adebayo, T.S.; Kirikkaleli, D. Impact of renewable energy consumption, globalization, and technological innovation on environmental degradation in Japan: Application of wavelet tools. Environ. Dev. Sustain. 2021, 1–26. [Google Scholar] [CrossRef]
  2. Kirikkaleli, D. New insights into an old issue: Exploring the nexus between economic growth and CO2 emissions in China. Environ. Sci. Pollut. Res. 2020, 27, 1–10. [Google Scholar] [CrossRef]
  3. UNFCCC. UNFCCC United Nations Framework Convention on Climate Change Second Biennial Report of the United States of America. 2016. Available online: http://unfccc.int/files/national_reports/biennial_reports_and_iar/submitted_biennial_reports/application/pdf/2016_second_biennial_report_of_the_united_states_.pdf (accessed on 23 February 2021).
  4. Wang, L.; Vo, X.V.; Shahbaz, M.; Ak, A. Globalization and carbon emissions: Is there any role of agriculture value-added, financial development, and natural resource rent in the aftermath of COP21? J. Environ. Manag. 2020, 268, 110712. [Google Scholar] [CrossRef]
  5. Grossman, G.M.; Krueger, A.B. Environmental Impacts of a North. American Free Trade Agreement; National Bureau of economic research: Cambridge, MA, USA, 1991. [Google Scholar]
  6. Oluwajana, D.; Adebayo, T.S.; Kirikkaleli, D.; Adeshola, I.; Akinsola, G.D.; Osemeahon, O.S. Coal Consumption and Environmental Sustainability in South Africa: The role of Financial Development and Globalization. Int. J. Renew. Energy Dev. 2021, 10, 527–536. [Google Scholar]
  7. Rjoub, H.; Odugbesan, J.A.; Adebayo, T.S.; Wong, W.K. Sustainability of the moderating role of financial devel-opment in the determinants of environmental degradation: Evidence from Turkey. Sustainability 2021, 13, 1844. [Google Scholar] [CrossRef]
  8. Odugbesan, J.A.; Adebayo, T.S. The symmetrical and asymmetrical effects of foreign direct investment and finan-cial development on carbon emission: Evidence from Nigeria. SN Appl. Sci. 2020, 2, 1–15. [Google Scholar] [CrossRef]
  9. Kirikkaleli, D.; Adebayo, T.S. Do public-private partnerships in energy and renewable energy consumption matter for consumption-based carbon dioxide emissions in India? Environ. Sci. Pollut. Res. 2021, 1–14. [Google Scholar] [CrossRef]
  10. He, X.; Adebayo, T.S.; Kirikkaleli, D.; Umar, M. Consumption-based carbon emissions in Mexico: An analysis using the dual adjustment approach. Sustain. Prod. Consum. 2021, 27, 947–957. [Google Scholar] [CrossRef]
  11. Olanrewaju, V.O.; Adebayo, T.S.; Akinsola, G.D.; Odugbesan, J.A. Determinants of Environmental Degradation in Thailand: Empirical Evidence from ARDL and Wavelet Coherence Approaches. Pollution 2021, 7, 181–196. [Google Scholar]
  12. Adebayo, T.S.; Akinsola, G.D. Investigating the Causal Linkage among Economic Growth, Energy Consumption and CO2 Emissions in Thailand: An Application of the Wavelet Coherence Approach. Int. J. Renew. Energy Dev. 2021, 10, 17–26. [Google Scholar] [CrossRef]
  13. Bekun, F.V.; Udi, J.; Adedoyin, F.F. Modeling the nexus between coal consumption, FDI inflow and economic ex-pansion: Does industrialization matter in South Africa? Environ. Sci. Pollut. Res. 2020, 12, 1–12. [Google Scholar]
  14. Adebayo, T.S. Testing the EKC hypothesis in Indonesia: Empirical evidence from the ARDL-based bounds and wave-let coherence approaches. Appl. Econ. 2021, 28, 1–23. [Google Scholar]
  15. Mutascu, M. A time-frequency analysis of trade openness and CO2 emissions in France. Energy Policy 2018, 115, 443–455. [Google Scholar] [CrossRef]
  16. Dauda, L.; Long, X.; Mensah, C.N.; Salman, M.; Boamah, K.B.; Ampon-Wireko, S.; Dogbe, C.S.K. Innovation, trade openness and CO2 emissions in selected countries in Africa. J. Clean. Prod. 2021, 281, 125143. [Google Scholar] [CrossRef]
  17. Ansari, M.A.; Haider, S.; Khan, N. Does trade openness affects global carbon dioxide emissions. Manag. Environ. Qual. Int. J. 2020, 31, 32–53. [Google Scholar] [CrossRef]
  18. Chen, F.; Jiang, G.; Kitila, G. Trade Openness and CO2 Emissions: The Heterogeneous and Mediating Effects for the Belt and Road Countries. Sustainability 2021, 13, 1958. [Google Scholar] [CrossRef]
  19. Pata, U.K.; Caglar, A.E. Investigating the EKC hypothesis with renewable energy consumption, human capital, globalization and trade openness for China: Evidence from augmented ARDL approach with a structural break. Energy 2021, 216, 119220. [Google Scholar] [CrossRef]
  20. Koc, S.; Bulus, G.C. Testing validity of the EKC hypothesis in South Korea: Role of renewable energy and trade openness. Environ. Sci. Pollut. Res. 2020, 27, 29043–29054. [Google Scholar] [CrossRef] [PubMed]
  21. Zeren, F.; Akkuş, H.T. The relationship between renewable energy consumption and trade openness: New evidence from emerging economies. Renew. Energy 2020, 147, 322–329. [Google Scholar] [CrossRef]
  22. Kirikkaleli, D.; Adebayo, T.S. Do renewable energy consumption and financial development matter for environ-mental sustainability? New Glob. Evid. Sustain. Dev. 2020, 6, 23–36. [Google Scholar]
  23. Khattak, S.I.; Ahmad, M.; Khan, Z.U.; Khan, A. Exploring the impact of innovation, renewable energy consumption, and income on CO2 emissions: New evidence from the BRICS economies. Environ. Sci. Pollut. Res. 2020, 27, 13866–13881. [Google Scholar] [CrossRef] [PubMed]
  24. Erdogan, S.; Okumus, I.; Guzel, A.E. Revisiting the Environmental Kuznets Curve hypothesis in OECD countries: The role of renewable, non-renewable energy, and oil prices. Environ. Sci. Pollut. Res. 2020, 27, 23655–23663. [Google Scholar] [CrossRef] [PubMed]
  25. Alola, A.A.; Arikewuyo, A.O.; Ozad, B.; Alola, U.V.; Arikewuyo, H.O. A drain or drench on biocapacity? Envi-ronmental account of fertility, marriage, and ICT in the USA and Canada. Environ. Sci. Pollut. Res. 2020, 27, 4032–4043. [Google Scholar] [CrossRef] [PubMed]
  26. Odugbesan, J.A.; Rjoub, H. Relationship among economic growth, energy consumption, CO2 emission, and urbanization: Evidence from MINT countries. Sage Open 2020, 10, 2158244020914648. [Google Scholar] [CrossRef] [Green Version]
  27. Adedoyin, F.F.; Gumede, M.I.; Bekun, F.V.; Etokakpan, M.U.; Balsalobre-Lorente, D. Modelling coal rent, economic growth and CO2 emissions: Does regulatory quality matter in BRICS economies? Sci. Total. Environ. 2020, 710, 136284. [Google Scholar] [CrossRef]
  28. Piłatowska, M.; Geise, A.; Włodarczyk, A. The Effect of Renewable and Nuclear Energy Consumption on Decoupling Economic Growth from CO2 Emissions in Spain. Energies 2020, 13, 2124. [Google Scholar] [CrossRef]
  29. Xu, B.; Zhong, R.; Qiao, H. The impact of biofuel consumption on CO2 emissions: A panel data analysis for seven selected G20 countries. Energy Environ. 2020, 31, 1498–1514. [Google Scholar] [CrossRef]
  30. Awodumi, O.B.; Adewuyi, A.O. The role of non-renewable energy consumption in economic growth and carbon emission: Evidence from oil producing economies in Africa. Energy Strat. Rev. 2020, 27, 100434. [Google Scholar] [CrossRef]
  31. Alam, M.S.; Apergis, N.; Paramati, S.R.; Fang, J. The impacts of R&D investment and stock markets on clean-energy consumption and CO2 emissions in OECD economies. Int. J. Financ. Econ. 2020, 4, 68–81. [Google Scholar]
  32. Adebayo, T.S. Revisiting the EKC hypothesis in an emerging market: An application of ARDL-based bounds and wavelet coherence approaches. SN Appl. Sci. 2020, 2, 1–15. [Google Scholar] [CrossRef]
  33. Siddique, H.M.A.; Majeed, D.M.T.; Ahmad, D.H.K. The impact of urbanization and energy consumption on CO2 emissions in South Asia. South Asian Stud. 2020, 31, 321–334. [Google Scholar]
  34. Gardiner, R.; Hajek, P. Interactions among energy consumption, CO2, and economic development in European Union countries. Sustain. Dev. 2020, 28, 723–740. [Google Scholar] [CrossRef]
  35. Mahmood, H.; Maalel, N.; Zarrad, O. Trade Openness and CO2 Emissions: Evidence from Tunisia. Sustainability 2019, 11, 3295. [Google Scholar] [CrossRef] [Green Version]
  36. Amin, A.; Aziz, B.; Liu, X.-H. The relationship between urbanization, technology innovation, trade openness, and CO2 emissions: Evidence from a panel of Asian countries. Environ. Sci. Pollut. Res. 2020, 27, 1–15. [Google Scholar] [CrossRef] [PubMed]
  37. Mutascu, M.; Sokic, A. Trade Openness—CO2 Emissions Nexus: A Wavelet Evidence from EU. Environ. Model. Assess. 2020, 25, 411–428. [Google Scholar] [CrossRef]
  38. Tachie, A.K.; Xingle, L.; Dauda, L.; Mensah, C.N.; Appiah-Twum, F.; Mensah, I.A. The influence of trade open-ness on environmental pollution in EU-18 countries. Environ. Sci. Pollut. Res. 2020, 27, 35535–35555. [Google Scholar] [CrossRef]
  39. Destek, M.A.; Sinha, A. Renewable, non-renewable energy consumption, economic growth, trade openness and ecological footprint: Evidence from organisation for economic Co-operation and development countries. J. Clean. Prod. 2020, 242, 118537. [Google Scholar] [CrossRef]
  40. Leitão, N.C.; Lorente, D.B. The Linkage between Economic Growth, Renewable Energy, Tourism, CO2 Emissions, and International Trade: The Evidence for the European Union. Energies 2020, 13, 4838. [Google Scholar] [CrossRef]
  41. Kirikkaleli, D.; Bekun, F.V.; Adebayo, T.S.; Akinsola, G.D.; Sukru, U.; Oseyenbhin, S.U. Economic performance of Indonesia amidst CO2 emissions and agriculture: A time series analysis. Environ. Sci. Pollut. Res. 2021, 2, 1–15. [Google Scholar] [CrossRef]
  42. Saidi, K.; Omri, A. Reducing CO2 emissions in OECD countries: Do renewable and nuclear energy matter? Prog. Nucl. Energy 2020, 126, 103425. [Google Scholar] [CrossRef]
  43. Ben Jebli, M.; Farhani, S.; Guesmi, K. Renewable energy, CO2 emissions and value added: Empirical evidence from countries with different income levels. Struct. Chang. Econ. Dyn. 2020, 53, 402–410. [Google Scholar] [CrossRef]
  44. Busu, M.; Nedelcu, A.C. Analyzing the Renewable Energy and CO2 Emission Levels Nexus at an EU Level: A Panel Data Regression Approach. Processes 2021, 9, 130. [Google Scholar] [CrossRef]
  45. Namahoro, J.P.; Wu, Q.; Xiao, H.; Zhou, N. The Impact of Renewable Energy, Economic and Population Growth on CO2 Emissions in the East African Region: Evidence from Common Correlated Effect Means Group and Asymmetric Analysis. Energies 2021, 14, 312. [Google Scholar] [CrossRef]
  46. Kwiatkowski, D.; Phillips, P.C.; Schmidt, P.; Shin, Y. Testing the null hypothesis of stationarity against the alterna-tive of a unit root: How sure are we that economic time series have a unit root? J. Econom. 1992, 54, 159–178. [Google Scholar] [CrossRef]
  47. Dickey, D.A.; Fuller, W.A. Likelihood Ratio Statistics for Autoregressive Time Series with a Unit Root. Economics 1981, 49, 1057. [Google Scholar] [CrossRef]
  48. Phillips, P.C.; Perron, P. Testing for a unit root in time series regression. Biometrika 1988, 75, 335–346. [Google Scholar] [CrossRef]
  49. Zivot, E.; Andrews, D.W.K. Further Evidence on the Great Crash, the Oil-Price Shock, and the Unit-Root Hypothesis. J. Bus. Econ. Stat. 2002, 20, 25–44. [Google Scholar] [CrossRef]
  50. Lee, J.; Strazicich, M.C. Minimum Lagrange Multiplier Unit Root Test with Two Structural Breaks. Rev. Econ. Stat. 2003, 85, 1082–1089. [Google Scholar] [CrossRef]
  51. Johansen, S. Estimation and Hypothesis Testing of Cointegration Vectors in Gaussian Vector Autoregressive Models. Econometrica 1991, 59, 1551–1580. [Google Scholar] [CrossRef]
  52. Engle, R.F.; Granger, C.W.J. Co-Integration and Error Correction: Representation, Estimation, and Testing. Economics 1987, 55, 251. [Google Scholar] [CrossRef]
  53. Banerjee, A.; Dolado, J.; Mestre, R. Error-correction mechanism tests for cointegration in a single-equation frame-work. J. Time Ser. Anal. 1998, 19, 267–283. [Google Scholar] [CrossRef] [Green Version]
  54. Boswijk, H.P. Unit Roots and Cointegration; Lecture Notes; Universiteit van Amsterdam: Amsterdam, The Netherland, 1998. [Google Scholar]
  55. Torrence, C.; Webster, P.J. Interdecadal changes in the ENSO–monsoon system. J. Clim. 1999, 12, 2679–2690. [Google Scholar] [CrossRef] [Green Version]
  56. Grinsted, A.; Moore, J.C.; Jevrejeva, S. Application of the cross wavelet transform and wavelet coherence to geo-physical time series. Nonlinear Process. Geophys. 2004, 11, 561–566. [Google Scholar] [CrossRef]
  57. Torrence, C.; Compo, G.P. A practical guide to wavelet analysis. Bull. Am. Meteorol. Soc. 1998, 79, 61–78. [Google Scholar] [CrossRef] [Green Version]
  58. Mishra, S.; Sinha, A.; Sharif, A.; Suki, N.M. Dynamic linkages between tourism, transportation, growth and carbon emission in the USA: Evidence from partial and multiple wavelet coherence. Curr. Issues Tour. 2020, 23, 2733–2755. [Google Scholar] [CrossRef]
  59. Sebri, M.; Ben-Salha, O. On the causal dynamics between economic growth, renewable energy consumption, CO2 emissions and trade openness: Fresh evidence from BRICS countries. Renew. Sustain. Energy Rev. 2014, 39, 14–23. [Google Scholar] [CrossRef] [Green Version]
  60. Oh, K.Y.; Bhuyan, M.I. Trade openness and CO2 emissions: Evidence of Bangladesh. Asian J. Atmos. Environ. 2018, 12, 30–36. [Google Scholar] [CrossRef]
  61. Saidi, K.; Mbarek, M.B. The impact of income, trade, urbanization, and financial development on CO2 emissions in 19 emerging economies. Environ. Sci. Pollut. Res. 2017, 24, 12748–12757. [Google Scholar] [CrossRef]
  62. Zhang, L.; Li, Z.; Kirikkaleli, D.; Adebayo, T.S.; Adeshola, I.; Akinsola, G.D. Modeling CO2 emissions in Malaysia: An application of Maki cointegration and wavelet coherence tests. Environ. Sci. Pollut. Res. 2021, 1–15. [Google Scholar] [CrossRef]
  63. Awosusi, A.A.; Adebayo, T.S.; Kirikkaleli, D.; Akinsola, G.D.; Mwamba, M.N. Can CO2 emissiovns and energy consumption determine the economic performance of South Korea? A time series analysis. Environ. Sci. Pollut. Res. 2021, 4, 1–16. [Google Scholar]
Figure 1. GDP and CO2 emission trends between 1965 and 2019 in China.
Sustainability 13 05054 g001
Figure 2. Analysis flowchart.
Sustainability 13 05054 g002
Figure 3. (a) WC between CO2 and EC. (b) WC between CO2 and GDP. (c) WC between CO2 and REN. (d) WC between CO2 and TO.
Sustainability 13 05054 g003
Figure 4. (a) WTC between CO2 emissions and economic growth. (b) WTC between CO2 emissions and energy use. (c) WTC between CO2 emissions and renewable energy. (d) WTC between CO2 emissions and trade openness.
Sustainability 13 05054 g004aSustainability 13 05054 g004b
Figure 5. (a) PWC: CO2-EC-GDP. (b) PWC: CO2-EC-REN. (c) PWC: CO2-EC-TO. (d) PWC: CO2-GDP-EC. (e) PWC: CO2-REN-TO. (f) PWC: CO2-GDP-TO. (g) PWC: CO2-REN-EC. (h) PWC: CO2-RENGDP. (i) PWC: CO2-REN-TO. (j) PWC: CO2-TO-EC. (k) PWC: CO2-TO-REN. (l) PWC:CO2-TO-GDP.
Sustainability 13 05054 g005aSustainability 13 05054 g005bSustainability 13 05054 g005c
Figure 6. (a) MWC: CO2-EC-TO. (b) MWC: CO2-GDP-EC. (c) MWC: CO2-REN-EC. (d) MWC: CO2-REN-GDP. (e) MWC: CO2-REN-TO. (f) MWC: CO2-TO-GDP.
Sustainability 13 05054 g006
Table 1. Summary of past studies.
Author (s)Time-FrameCountry(s)TechniquesFindings
Impact of Economic Growth on CO2 Emissions
Kirikkaleli& Adebayo [22]1980–2017GlobalFMOLS, DOLS, Frequency Causality TestGDP ⇨ CO2 (+)
GDP ⇨ CO2
Oluwajana et al. [11]1980–2017South AfricaARDL, FMOLS, DOLS, BH Cointegration, and Frequency Domain causalityGDP ⇨ CO2 (+)
GDP ⇨ CO2
Rjoub et al. [7]1960–2018TurkeyFMOLS, DOLS, CCRGDP ⇨ CO2 (+)
Odugebesan and Rjoub [26]1992–2018MINTARDL, Granger CausalityGDP ⇨ CO2
Adedoyin et al. [27]1990–2014BRICSPMG-ARDLGDP ⇨ CO2 (+)
Piłatowska et al. [28]1970Q1–2017Q4SpainTVARGDP ⇨ CO2 (+)
GDP ⇨ CO2
Xu et al. [29]2001–2017G20FMOLS GDP 2 = CO2 (–)
GDP ⇨ CO2 (+)
Awodumi & Adewuyi [30]1980–2015Top oil producing economies in AfricaNARDL GDP 2 = CO2 (–)
GDP ⇨ CO2 (+)
Alam et al. [31]1996–201330 OECD economiesPanel techniquesGDP ⇨ CO2 (+)
Impact of Energy Consumption on CO2 Emissions
He et al. [10]1990–2018MexicoARDL, FMOLS, DOLSEC ⇨ CO2 (+)
EC ⇨ CO2
Adebayo [14]1981–2018IndonesiaARDL, FMOLS, DOLSEC ⇨ CO2 (+)
EC ⇨ CO2
Olanrewaju et al. [11]1980–2016ThailandARDL, FMOLS, DOLSEC ⇨ CO2 (+)
EC ⇨ CO2
Adebayo [32]1980–2016MexicoWavelet Coherence, ARDL, FMOLS, DOLSEC ⇨ CO2 (+)
EC ⇨ CO2
Siddique et al. [33]1983–2013South AsiaPanel co-integration and Granger causality approachEC ⇨ CO2
Gardiner & Hajek [34]1990–2015Eight new and 15 old EU countriesPanel TechniquesEC ⇨ CO2 (+)
EC ⇔ CO2
Impact of Trade Openness on CO2 Emissions
Mutascu [15]1960–2013FranceWavelet Tools TO   CO2
Mahmood et al. [35]1971–2014TunisiaNARD TO + CO2
Amin et al. [36]1980–201913 Asian countriesFMOLS, VECMTO⇨ CO2 (+)
TO ⇔ CO2
Mutascu&Sokic [37]1960–2014European Union NationsWavelet ToolsTO⇨ CO2 (+)
Tachie et al. [38]1990–2015EU-18 economies.MG, AMG, D-H Granger causality testTO ⇨ CO2 (+)
TO ⇨ CO2
Destek& Sinha [39]1980–201424 OECDMG, FMOLS, CCE-MGTO ⇨ CO2 (–)
TO ⇨ CO2
Impact of Renewable Energy on CO2 Emissions
Adebayo & Kirikkaleli [1]1990Q1–2015Q4JapanWavelet ToolsREC ⇨ CO2 (–)
Leitão & Lorente [40]1995–2015European Union (EU-28)FMOLS, DOLS, GMMREC ⇨ CO2 (–)
Kirikkaleli and Adebayo [41]1990Q1–2016Q4IndiaFMOLS, DOLS, BC causalityREC ⇨ CO2 (–)
REC ⇨ CO2
Saidi & Omri [42]1990–201815 OECD countriesFMOLS, VECMMixed Findings
Jebli et al. [43]1990–2015102countriesGMM, Granger causalityMixed Findings
Busu & Nedelcu, [44]2000–2019European Union (EU) countriesPanel TechniquesREC ⇨ CO2 (–)
Namahoro et al. [45]1980–2016East African RegionCCEMGREC ⇨ CO2 (–)
Table 2. Variables units and sources.
VariableDescriptionUnitsSources
GDP Economic GrowthGDP Per Capita Constant $US, 2010WDI
TO Trade OpennessTrade % of GDPWDI
RECRenewable Energy ConsumptionRenewables per capita (kWh)BP
CO2CO2 emissionsPer capita emissionsBP
EC Energy UseEnergy consumption per capita (kWh)BP
Table 3. Descriptive statistics.
CO2ECGDPRENTO
Mean3.02639810,494.822028.750730.634728.91803
Median2.1986977309.315886.9094301.401030.14572
Maximum7.09638327,452.488254.5333476.80164.47888
Minimum0.5667901929.150173.063470.606004.920835
Std.Dev.2.1673437959.0542321.965895.702417.64324
Skewness0.8535580.8929101.3051891.6835210.244964
Kurtosis2.2557572.3290293.4579634.7335911.995945
Jarque-Bera7.9478238.34018716.0962232.867802.860356
Probability0.0188000.0154510.0003200.0000000.239266
Observations5555555555
Table 4. Traditional unit root tests.
ADFPP
VariablesAt LevelFirst DifferenceAt LevelFirst Difference
CO2−2.0886−4.7485 *−2.1608 *−4.3761 *
GDP−3.9752 ***−5.0661 *−3.3334 ***−4.8793 *
EC−3.1857 ***−3.9878 **−1.6539−3.3875 ***
REN−1.8005−7.9409 *−1.7612−7.9535 *
TO−0.2464−5.2111 *−0.5951−4.9299 *
Note: 1%, 5%, and 10% level of significance are depicted by *, **, and *** respectively.
Table 5. ZA and LS unit root tests.
ZALS
VariablesAt LevelBreak-DateAt LevelBreak-Dates
CO2−3.6921979−5.7241988 and 2001
GDP−5.841 *1976−6.500 **1978 and 2007
EC−4.3492003−6.035 **1975 and 2001
REN−5.129 **1998−5.2091983 and 2002
TO−3.5902003−5.24071981 and 2002
First DifferenceBreak−DateFirst DifferenceBreak−Dates
CO2−5.930 *2002−9.968 *1999 and 2009
GDP−7.436 *2006−7.570 *1980 and 2007
EC−6.501 *2003−9.037 *2000 and 2009
REN−5.804 *2002−10.480 *2001 and 2006
TO−5.1995 **2009−6.666 *1980 and 1999
Note: 1% and 5% level of significance are depicted by * and ** respectively.
Table 6. Bayer–Hanch cointegration test.
ModelFisher StatisticsFisher StatisticsCointegration
Decision
CO2 = f(GDP, EC, TO, REC)EG-JOHEG-JOH-BAN-BOS
32.59 **56.154 **Yes
CVCV
5%10.57620.143
Note: 5% significance level is depicted by **. EG, JOH, BAN and BOS illustrates Engle-Granger Johansen, Banerjee, and Boswijk.
Table 7. Gradual shift causality test
Causality PathWald-StatNo. of Fourierp-ValueDecision
CO2⇨GDP6.225020.5173Do not Reject Ho
GDP ⇨ CO218.112 **20.0114Reject Ho
CO2⇨ TO11.30330.1258Do not Reject Ho
TO⇨CO210.48630.1626Reject Ho
EC ⇨ CO221.257 **30.0025Reject Ho
CO2⇨EC6.329130.5018Do not Reject Ho
GDP ⇨ REN15.388 **30.0313Reject Ho
REN ⇨GDP16.528 **30.0304Reject Ho
Note: 5% level of significance is depicted by **.
Publisher’s Note: MDPI stays neutral with regard to jurisdictional claims in published maps and institutional affiliations.

