
Assessing Public Open Spaces: A Case of City Nagpur, India


Abstract
1. Introduction
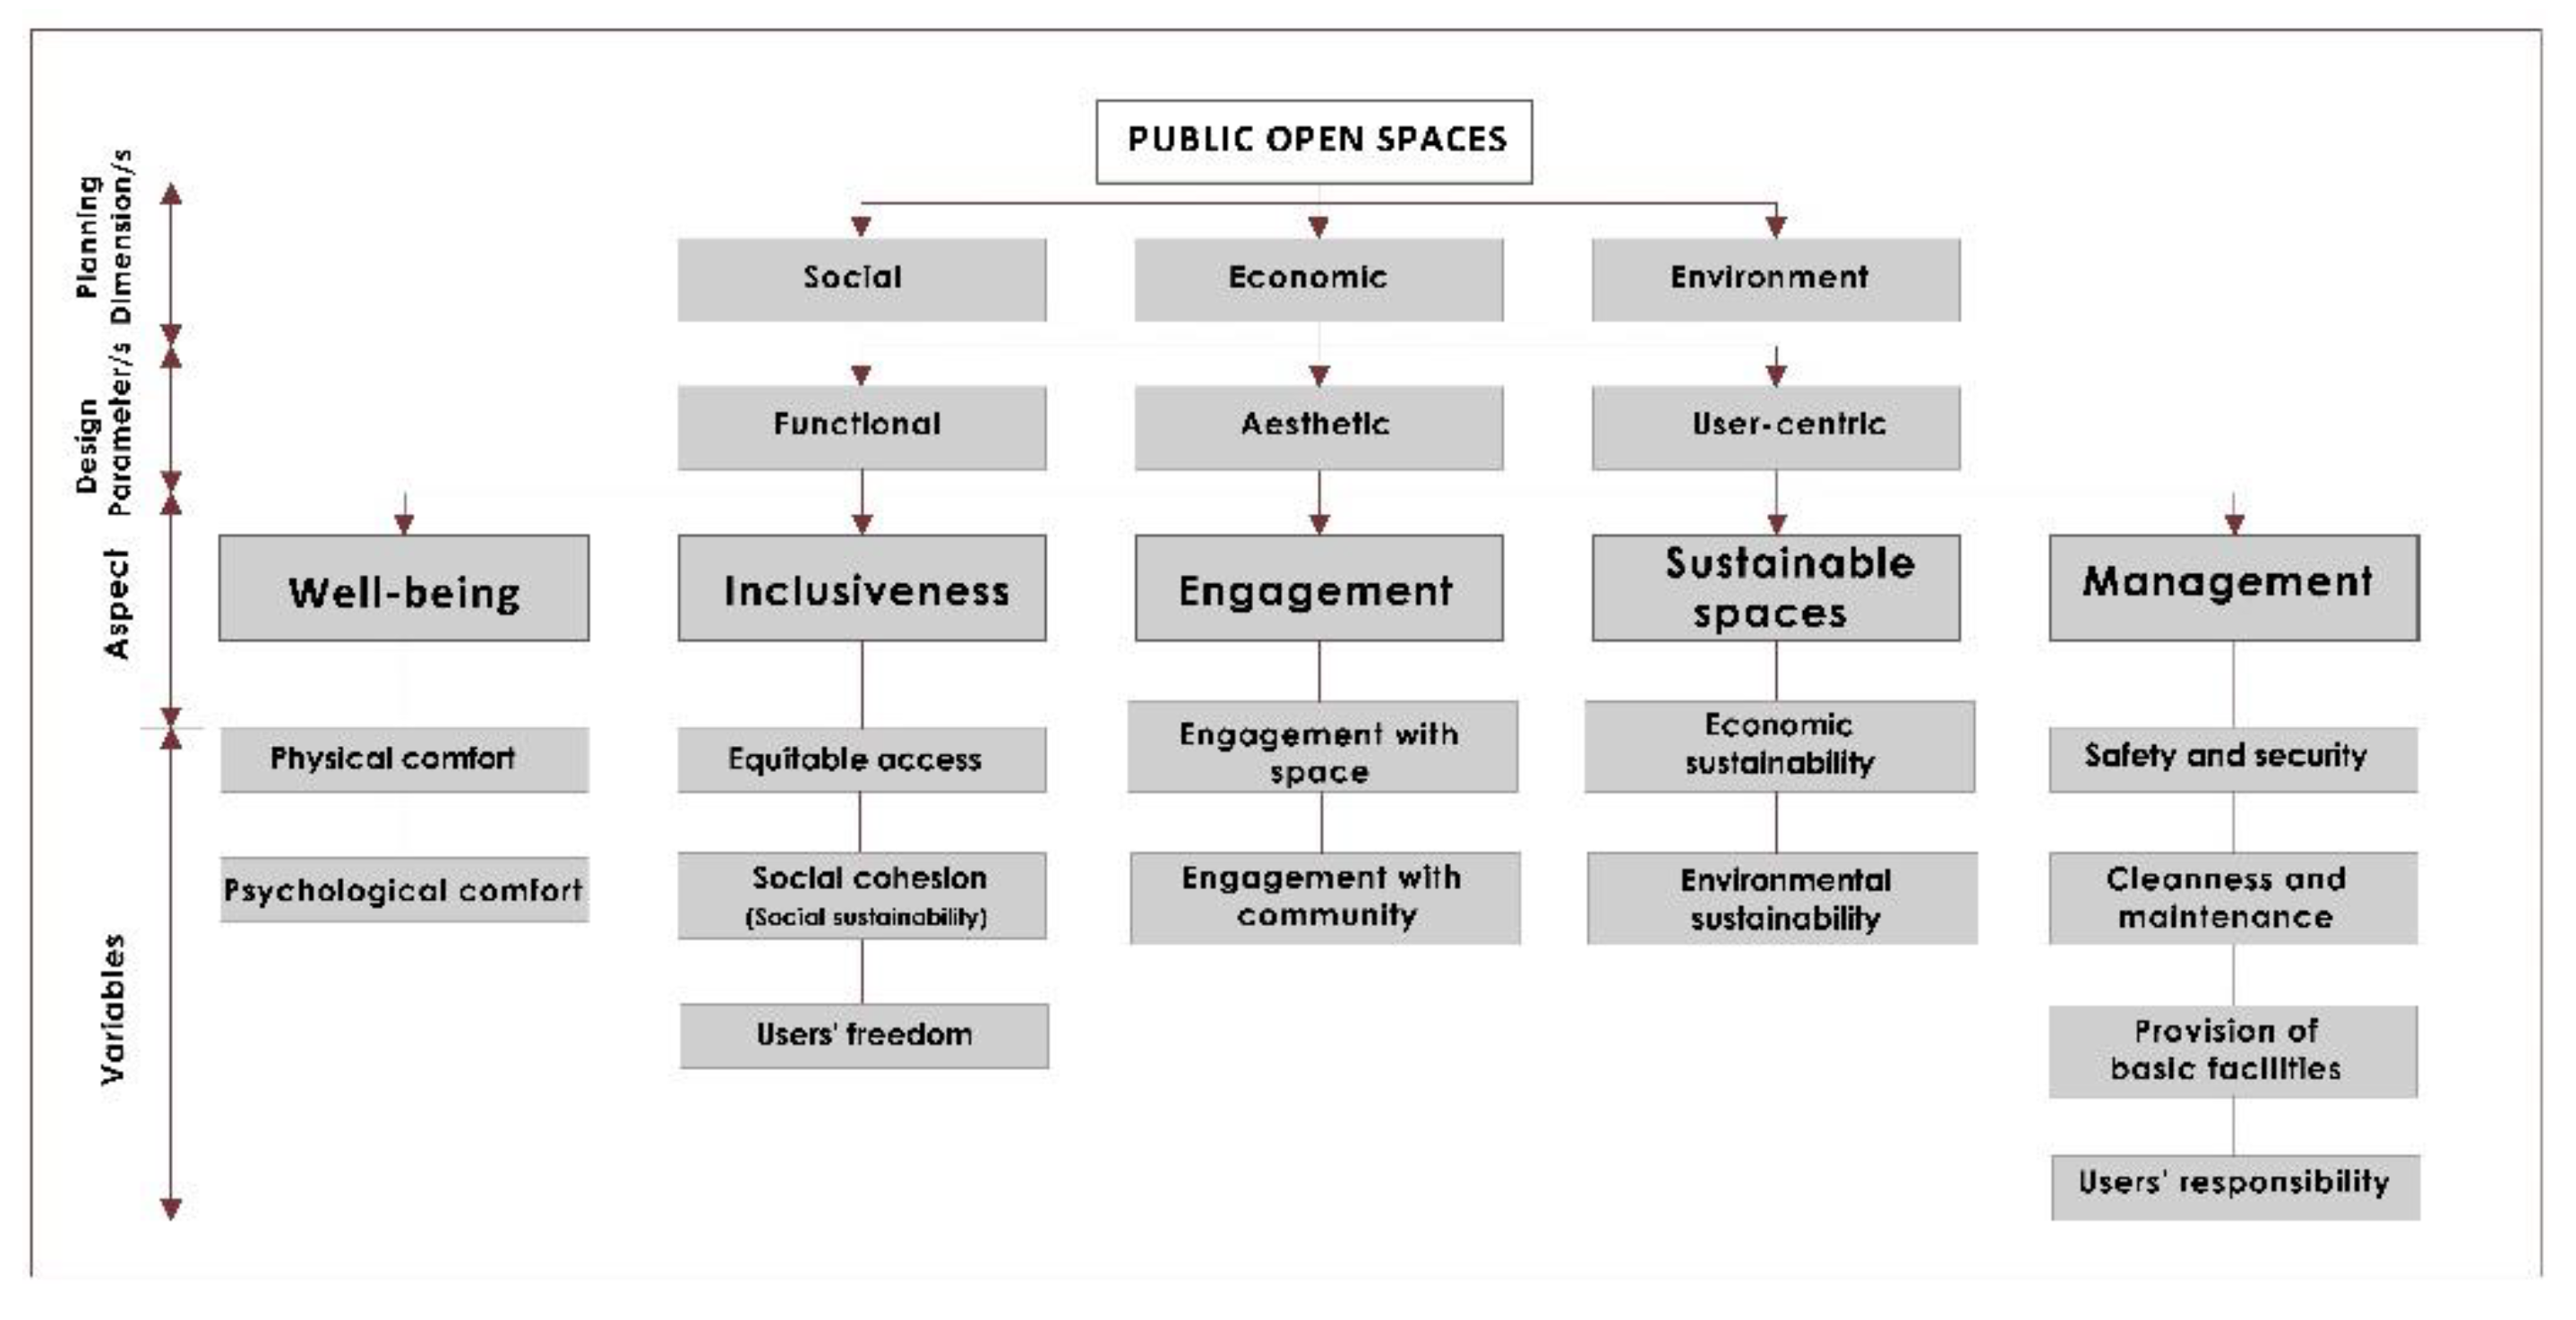
2. Literature Review
2.1. Public Open Space (POS)
2.2. Public Open Space Index (POSI)
3. Methods
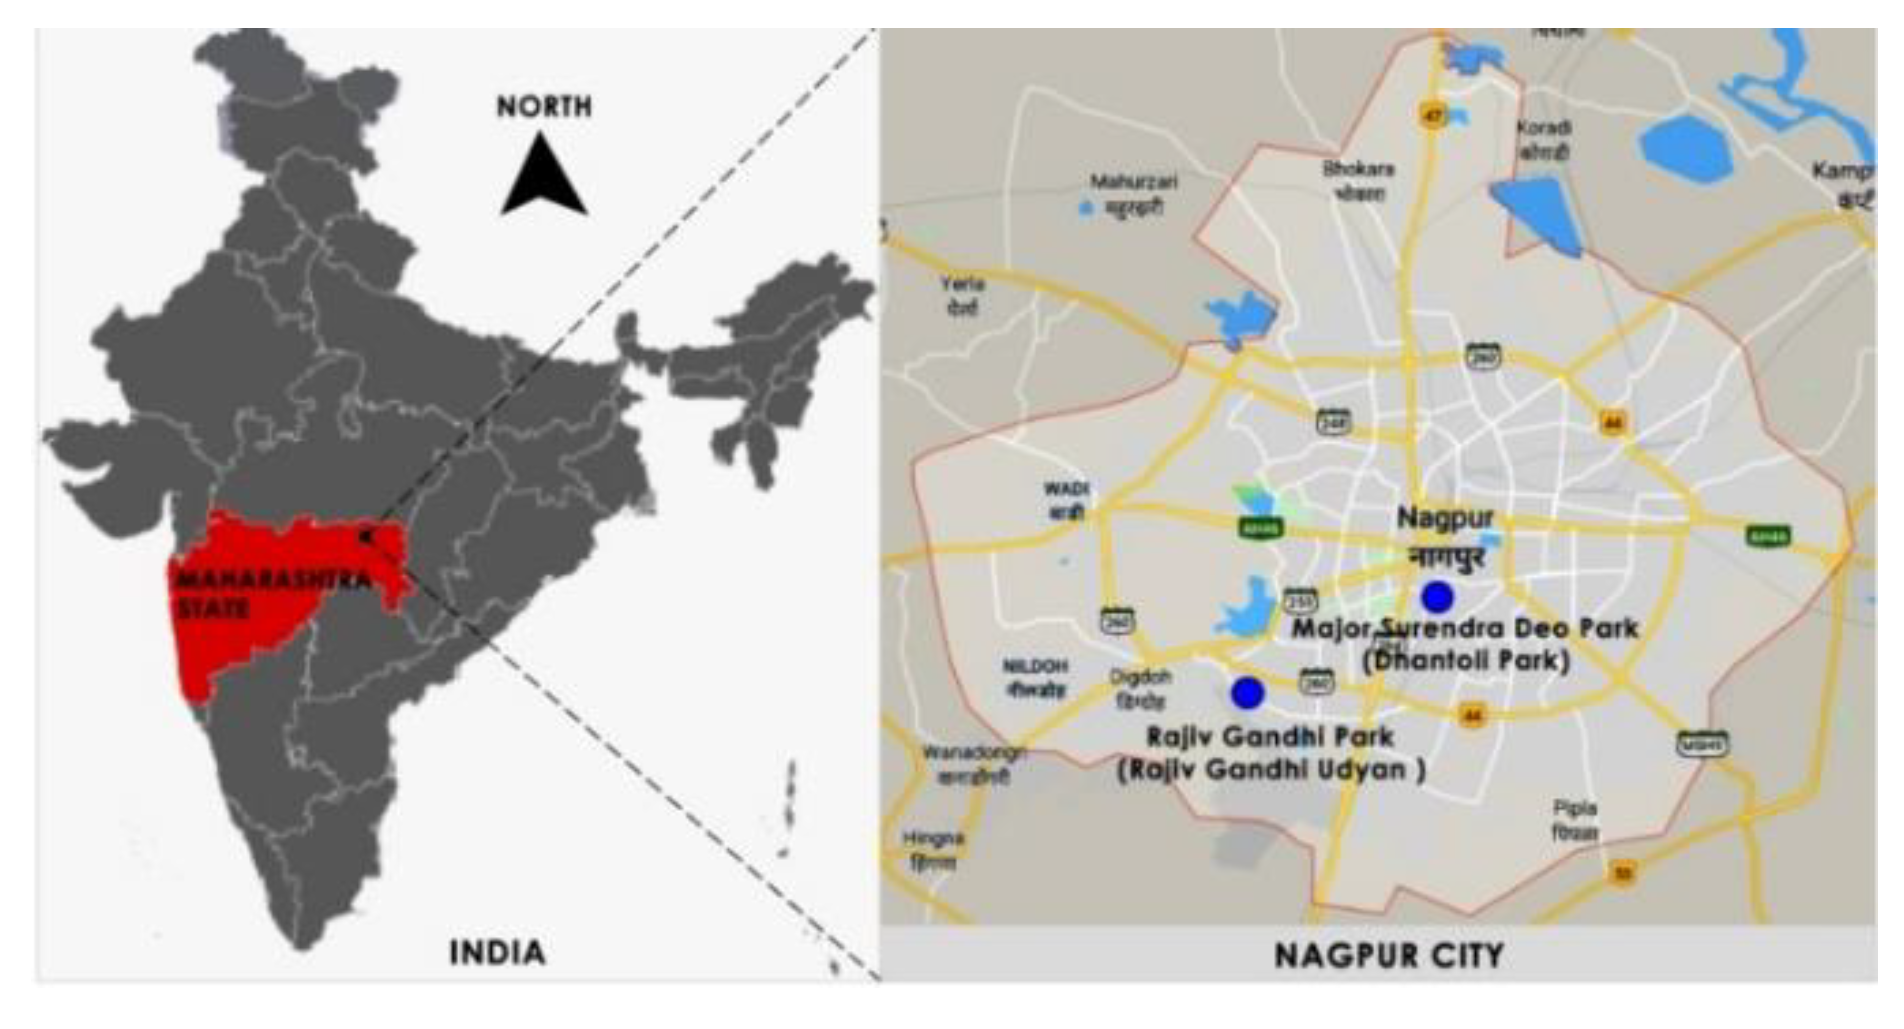
3.1. Study Area
3.2. Data Collection
4. Results
4.1. Respondent Characteristics and POSs Visitation
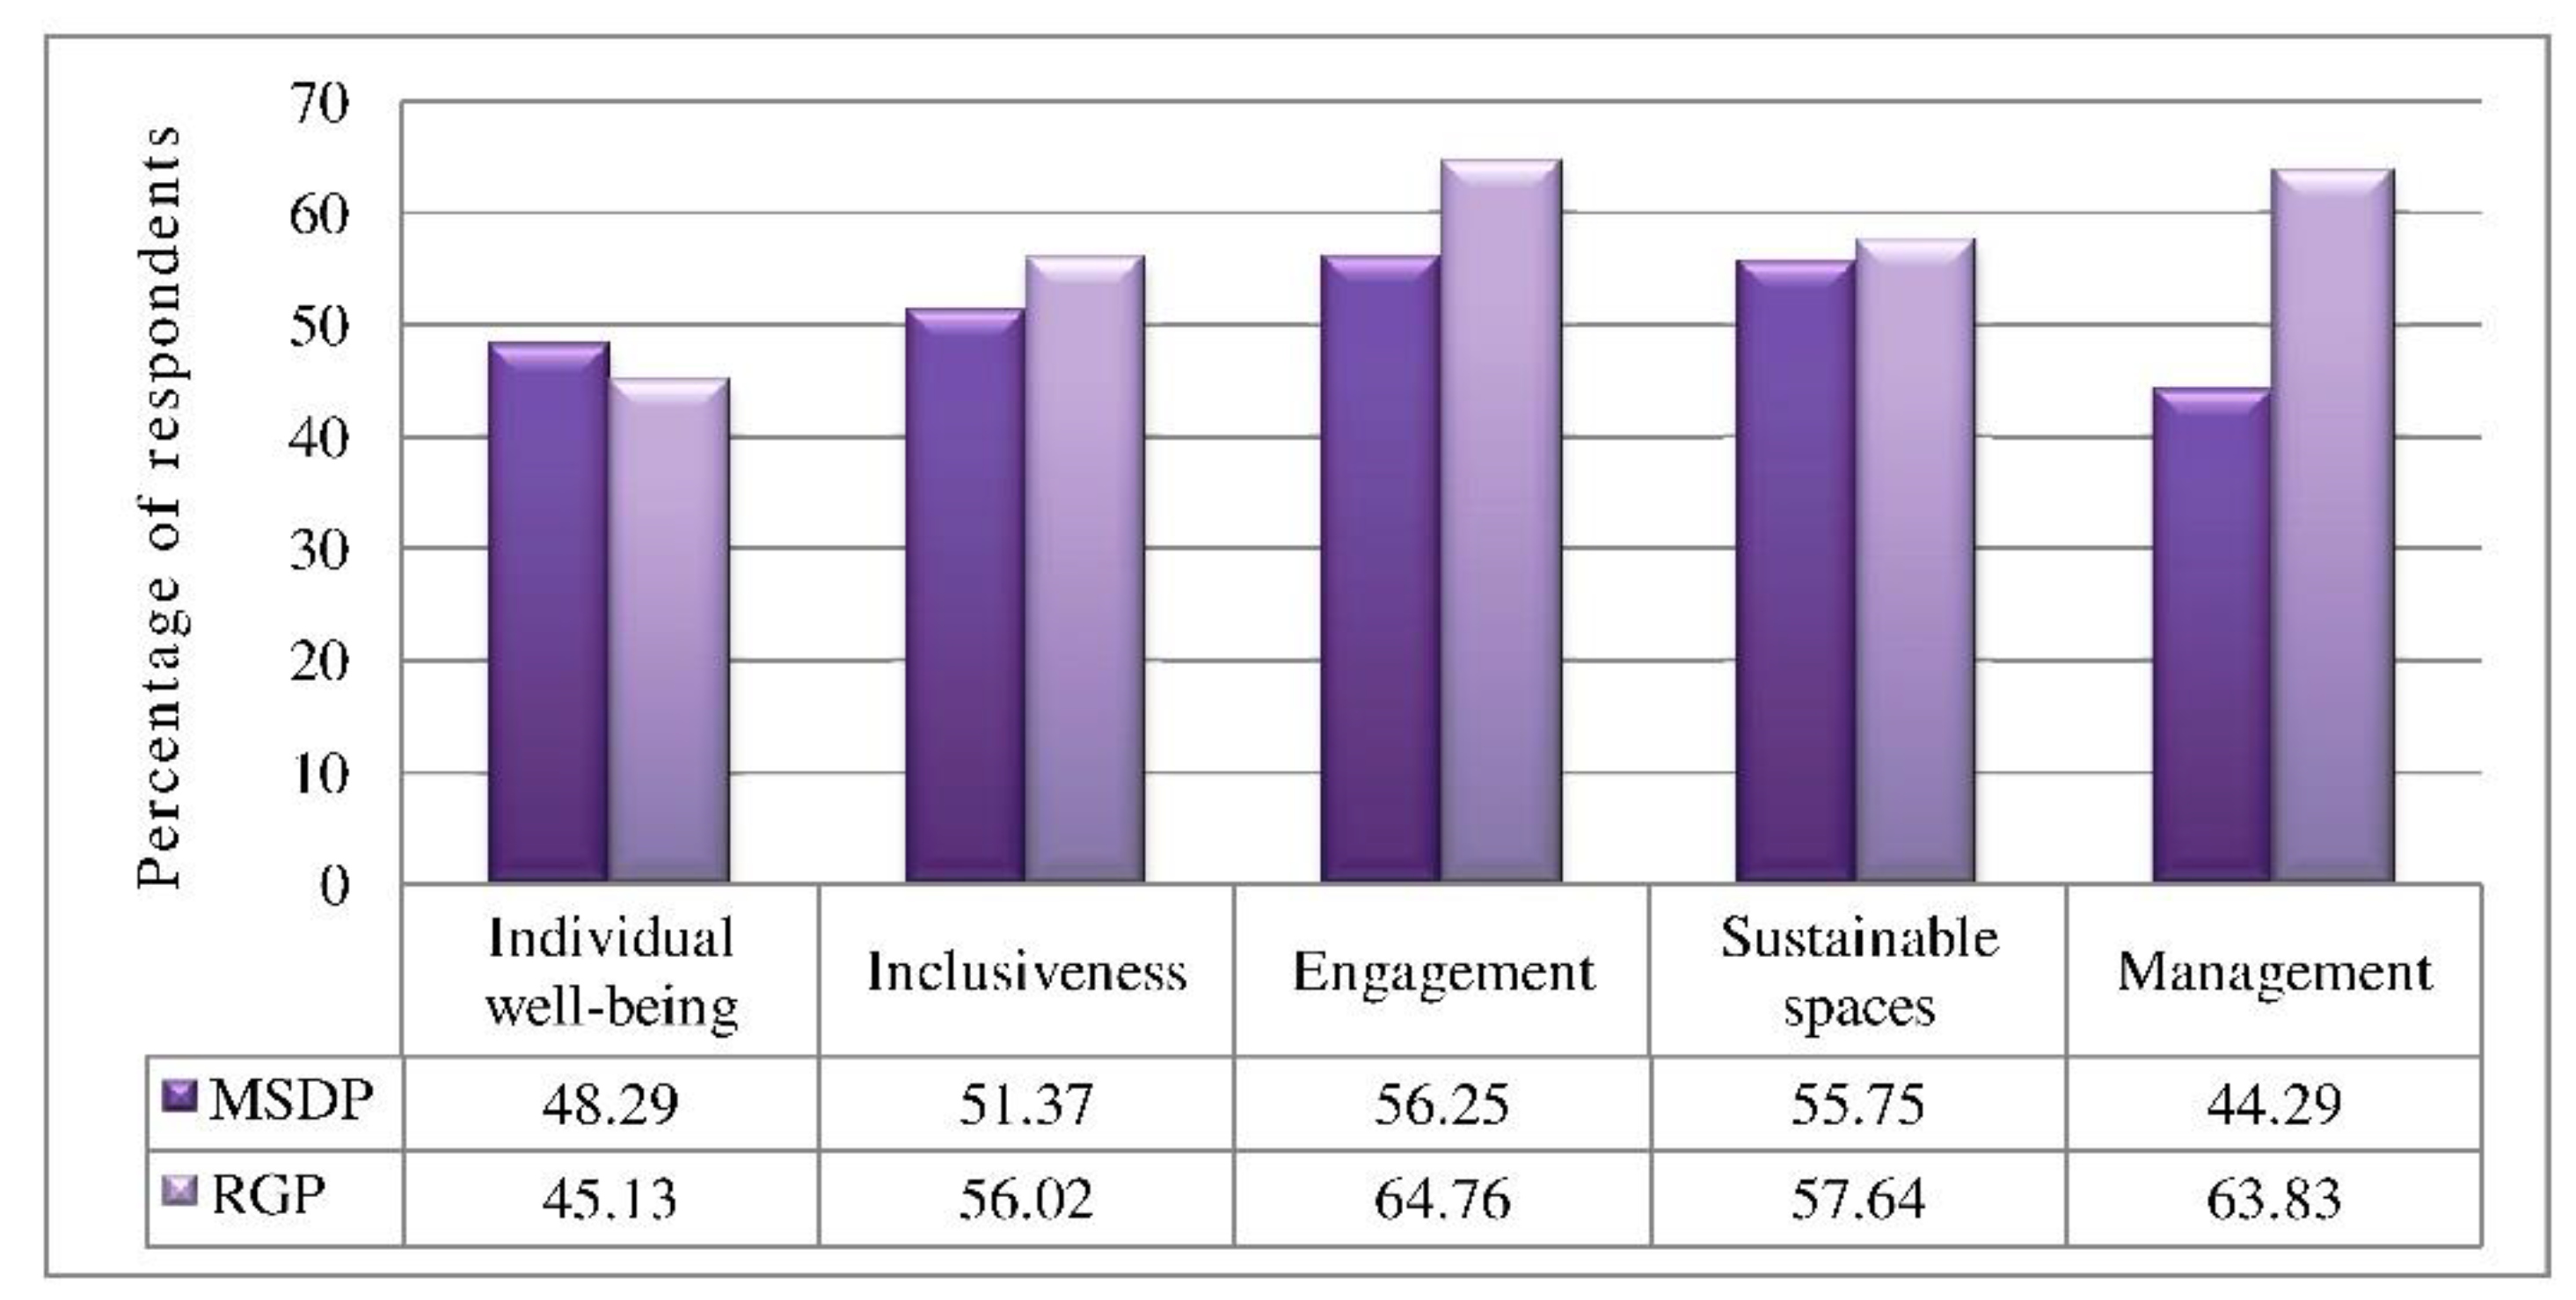
4.2. Public Open Space Index [POSI] Score Received by POSs
4.3. Reliability Analysis and a Correlation between Measuring Items
5. Discussion
6. Conclusions
Author Contributions
Funding
Institutional Review Board Statement
Informed Consent Statement
Data Availability Statement
Acknowledgments
Conflicts of Interest
Appendix A

| Variable No. | Variable | Measuring Item No. | Measuring Item | Score (Maximum) | MSDP (POS-1) n = 290 | RGP (POS-2) n = 263 | ||
| Mean Score | Standard Deviation | Mean Score | StandardDeviation | |||||
| Aspect 1: Individual well-being | ||||||||
| 1 | Physical comfort | 1 | POSoffers barrier-free and convenient entry | 5 | 3.88 | 0.864 | 1.29 | 0.454 |
| 2 | Convenient walkway surface for multiple users | 5 | 1.81 | 0.686 | 1.43 | 0.619 | ||
| 3 | POS includes open and shaded walkways and seating arrangements to provide convenience to users in all climate seasons (Climate responsive design) | 5 | 1.72 | 0.722 | 1.29 | 0.452 | ||
| 4 | Availability of open and shaded areas, semi-covered seating arrangements, and shelter within POS | 5 | 2.16 | 0.821 | 2.14 | 0.910 | ||
| 5 | POS is being used by all age groups effectively | 5 | 3.21 | 0.986 | 1.79 | 0.675 | ||
| 2 | Psychological comfort | 6 | Presence of elegant architecture and landscape features that enhance user experience in space | 5 | 3.94 | 0.825 | 1.64 | 0.717 |
| 7 | POS offers attractive and pleasant views that gives users a visual pleasure | 5 | 2.37 | 0.970 | 3.78 | 0.862 | ||
| 8 | POS makes a perceivable and positive image between users | 5 | 1.81 | 0.686 | 3.64 | 0.816 | ||
| 9 | Users can hear outside noise while roaming within POS | 5 | 1.82 | 0.683 | 1.72 | 0.702 | ||
| 10 | POS brings users peace, ease and pleasure | 5 | 1.42 | 0.495 | 3.86 | 0.917 | ||
| Total Measuring Items 10 | 50 | 24.14 | 22.57 | |||||
| Index Score (Percentage) | 48.29 | 45.13 | ||||||
| Ranking | Poor | Poor | ||||||
| Aspect 2: Inclusiveness | ||||||||
| 3 | Equitable access | 11 | POS provides equitable access to all people, regardless of age, gender, religion or social economic status (Promotes Diversity) | 5 | 3.86 | 0.960 | 4.29 | 0.699 |
| 12 | Availability of ramp, and tactile flooringprovide convenience to users with physical disabilities ( Promotes Universal Design) | 5 | 1.34 | 0.474 | 1.14 | 0.352 | ||
| 4 | Social cohesion (Social sustainability) | 13 | POS provides an opportunity to participate in events and programmes | 5 | 3.62 | 0.912 | 4.00 | 0.929 |
| 14 | User feels like a part of the POS community (Sense of community) | 5 | 2.30 | 0.874 | 3.64 | 1.113 | ||
| 15 | POS has a fun atmosphere for social networking, positive conversation and sharing experiences | 5 | 2.54 | 1.497 | 3.71 | 1.034 | ||
| 16 | People are proud to have such space in their neighbourhood (Sense of Pride) | 5 | 2.89 | 1.570 | 3.79 | 1.012 | ||
| 5 | Users’ freedom | 17 | User feel free about his/her behaviour in space | 5 | 2.63 | 0.879 | 1.57 | 0.625 |
| 18 | Space enables users to freely roam without restrictions | 5 | 2.87 | 0.809 | 1.93 | 0.706 | ||
| 19 | Surveillance cameras, security guards, etc. infringe the privacy of users | 5 | 2.31 | 0.853 | 2.72 | 1.161 | ||
| 20 | Users are pleased with the opening hours of space | 5 | 1.32 | 0.469 | 1.22 | 0.413 | ||
| Total Measuring Items 10 | 50 | 25.69 | 28.01 | |||||
| Index Score (Percentage) | 51.37 | 56.02 | ||||||
| Ranking | Fair | Fair | ||||||
| Aspect 3: Engagement | ||||||||
| 6 | Engagement with space | 21 | Space is capable of fulfilling people’s needs (Local needs) | 5 | 2.31 | 1.385 | 2.22 | 1.325 |
| 22 | Space versatility to adapt changes to the needs of users | 5 | 2.57 | 1.064 | 4.44 | 0.620 | ||
| 23 | Space encourages a variety of activities: active, passive and other | 5 | 4.27 | 0.774 | 3.28 | 0.885 | ||
| 24 | Design and layout of space appropriate for users | 5 | 2.24 | 1.093 | 3.06 | 1.032 | ||
| 25 | More activities are required in this space | 5 | 3.79 | 0.986 | 4.15 | 0.739 | ||
| 26 | Space has active and vibrant edges to encourage food, shopping and entertainment | 5 | 1.26 | 0.437 | 1.14 | 0.352 | ||
| 7 | Engagement withcommunity | 27 | Space encourages social activities and interaction | 5 | 3.03 | 1.149 | 3.28 | 1.029 |
| 28 | Space encourage local culture and arts | 5 | 3.05 | 1.143 | 3.93 | 0.703 | ||
| 29 | User spends quality time in this space | 5 | 2.79 | 1.244 | 3.63 | 1.237 | ||
| Total Measuring Items 9 | 45 | 25.31 | 29.14 | |||||
| Index Score (Percentage) | 56.25 | 64.76 | ||||||
| Ranking | Fair | Average | ||||||
| Aspect 4: Sustainable spaces | ||||||||
| 8 | Economic Sustainability | 30 | Space contributes to enhance surrounding businesses such as shopping, hotels, and street foods | 5 | 4.12 | 0.819 | 2.80 | 1.205 |
| 31 | Space provides access to community services, utilities and leisure facilities to minimise the overall cost of living | 5 | 3.44 | 1.018 | 4.14 | 0.743 | ||
| 32 | Space leads to the reduction of health expenditure for users | 5 | 3.48 | 1.229 | 3.99 | 0.929 | ||
| 9 | Environmental Sustainability | 33 | Space encourage sustainable practice such as the use of renewable resources for power, rainwater harvesting, waste management and a water-efficient irrigation system | 5 | 1.17 | 0.372 | 1.22 | 0.413 |
| 34 | Space encourage sustainable landscape practice, such as the use of native species, xeriscaping, and the preservation of natural topography | 5 | 1.23 | 0.424 | 1.14 | 0.348 | ||
| 35 | Space is well connected to other areas with wide walkways and public transport (Promote walk ability and public transport) | 5 | 3.29 | 1.211 | 4.00 | 0.929 | ||
| Total Measuring Items 6 | 30 | 16.72 | 17.29 | |||||
| Index Score (Percentage) | 55.75 | 57.64 | ||||||
| Ranking | Fair | Fair | ||||||
| Aspect 5: Management | ||||||||
| 10 | Safety and Security | 36 | User feels safe within space | 5 | 1.17 | 0.372 | 4.07 | 0.967 |
| 37 | Space promote natural and artificial surveillance | 5 | 1.57 | 0.642 | 4.57 | 0.905 | ||
| 38 | Space needs more safety arrangements: Security guards, Lights and CCTV | 5 | 3.76 | 0.906 | 4.07 | 0.888 | ||
| 39 | Display of helpline numbers near the entrance: Police station, woman and child care, and medical | 5 | 1.25 | 0.433 | 1.21 | 0.410 | ||
| 40 | Availability of display board that shows ‘Behaviour instructions for users within the space’ to maintain law and order | 5 | 1.08 | 0.276 | 1.14 | 0.352 | ||
| 11 | Cleanness and maintenance | 41 | Space is clean, neat and well—maintained | 5 | 2.31 | .861 | 2.51 | 1.553 |
| 42 | Space requires more cleanliness and maintenance | 5 | 3.20 | 1.197 | 2.84 | 1.184 | ||
| 12 | Provision of basic facilities | 43 | Availability of basic facilities: Drinking water, washrooms and first aid | 5 | 2.39 | 1.117 | 3.35 | 0.900 |
| 13 | Users’ responsibility | 44 | Users are behaving ina civil, appropriate, and responsible manner (People to People) | 5 | 2.81 | 1.230 | 4.00 | 0.929 |
| 45 | Users show respect for public / national property (People to space) | 5 | 2.61 | 1.178 | 4.15 | 0.911 | ||
| Total Measuring Items 10 | 50 | 22.14 | 31.92 | |||||
| Index Score (Percentage) | 44.29 | 63.83 | ||||||
| Ranking | Poor | Average | ||||||
| Total score of all five aspects (out of 225) | 114.01 | 128.93 | ||||||
| Total score of all five aspects (out of 100) i.e. Percentage | 50.67 | 57.30 | ||||||
| Ranking for percentage score of all five aspects | Fair | Fair | ||||||
| Below 50 %—Poor50 % to 59 %—Fair60 % to 69 %—Average70 % to 79 %—Good80 % to 100 %—Excellent | ||||||||
| Sr.No | Strength/s | Affect on POS Character | Affect on POSs Use | Deficiency/ies | Affect on POSs Character | Affect on POS Use |
|---|---|---|---|---|---|---|
| Aspect 1: Individual well-being | ||||||
| 1 | POSs offer barrier-free and convenient access | User friendly POSs | 1. Promote physical comfort. 2. Attract users toward POSs. | Inadequate semi-covered seating and shelter arrangements. | Poor climate-responsive design. | 1. Inability to use POSs in all climate seasons 2. Provides users with inconvenience. |
| 2 | POSs include elegant architectural elements such as sculpture, water fountain, beautiful landscape and aesthetically rich furniture. | Create a good image of space between users. | 1. Promots psychological comfort. 3. Enhance space experience. | Users could hear the noise from outside traffic. | Poor noise-reduction design. | 1. There is no noise buffer zone within POSs 2. POSs are unable to provide users with peace and comfort. |
| 3 | POSs include attractive focal points and vistas | Make a strong identity | 1. Provide visual pleasure. | |||
| 4 | All age groups have effectively used POSs. | Inclusive POSs | 1. POSs for all. 2. Contribute to well- being. | |||
| 5 | Wide and single levelled walkways. | User friendly POSs. | 1. Allow people of all ages to walk conveniently. | |||
| Aspect 2: Individual well-being | ||||||
| 1 | POSs allow all people to enter. | Equitable POSs | 1. Convince everybody that POSs are a form of entertainment. 2. People regard POSs as a part of their daily lives. | Absence of tactile flooring ramp and walkway. | Poorly adopted Universal Design practice. | 1. Parks do not offer convenience for people with physical disabilities. |
| 2 | POSs provide users with opportunities to participate in various events and programmes | Socially cohesion POSs | 1. Preservation of social values among citizens 2.Create socially healthy societies within cities | Short opening hours of POSs. | Time restriction for recreation. | 1. Users cannot use space throughout day. |
| 3 | POSs have a fun atmosphere for social networking, positive conversation, and experience sharing. | Create a forum where people can strengthen their social connections. | 1.Promote a sense of belonging, trust, and acceptancebetween people | |||
| Aspect 3: Engagement | ||||||
| 1 | POSs promote active and passive activities | Promote effective engagement | 1. Users have a variety of recreation options. | Absence of active and vibrant edges that would encourage food, shopping, and entertainment. | Poorly supportive edges | 1. Edges do not contribute to recreation. |
| 2 | POSs have to ability to adapt changes to the needs of users. | POSs promote versatility | 1. POS layouts can be modified to meet the diverse needs of users. | |||
| 3 | POSs provide opportunity for interaction | Promote sustainable community | 1. POSs aid in the preservation of social values and beliefs. 2. POSs allow people to share their thoughts, feelings, ideas, and opinions with others. | |||
| Aspect 4: Sustainable spaces | ||||||
| 1 | POSs provide common access to community services, utilities, and leisure facilities. | Spaces for recreation and celebration. | 1. Help to reduce the overall cost of living 2. Improve people’s quality of life | POSs do not encourage sustainable practice | POSs do not help to preserve the environment. | 1. Increase energy and water consumption 2. Produce solid waste |
| 2 | POSs contributes to the improvement of local businesses that located around them | Act a source of livelihood | 1. Improve the economic status of those who rely on these businesses. | POSs do not encourage sustainable landscape practice | POSs do not help to preserve the environment. | 1. Increases water consumption and soil degradation |
| 3 | POSs are well connected to other areas with wide walkways and public transport. | Approachable POSs | 1. Reduce the use of private vehicles, which use fossil fuels and pollute the environment. 2. Help to reduce traffic congestion within the city. | |||
| Aspect 5: Management | ||||||
| 1 | POSs offer safety, and Basic facilities | Safe POSs | 1. Women, children, and the elderly feel safe visiting POSs. 2. Make users’ lives easier. | POSs do notinclude written or symbolic instructions to prevent unwanted activities | Lack of passive control | 1. Users would be unaware of an etiquette describing POS behaviour. |
| 2 | Users perceived POS as clean, neat, and well maintained. | Clean and well-maintained POSs | 1. Users will visit POSs more frequently 2. POSs can improve their and the surrounding neighborhood’s image. | POSs do notinclude display of helpline numbers | Lack of passive control | 1. In an emergency, needy users will not receive support or assistance. |
| 3 | Users are showing respect toward POSs as a national property. | Responsible users | 1.Prevent vandalism, littering, and negligence. | |||
References
- Aram, F.; Solgi, E.; Holden, G. The role of green spaces in increasing social interactions in neighbourhoods with periodic markets. Habitat Int. 2019, 84, 24–32. [Google Scholar] [CrossRef]
- Marcus, C.C.; Francis, C. (Eds.) People Places: Design Guidlines for Urban Open Space; John Wiley and Sons: Hoboken, NJ, USA, 1997. [Google Scholar]
- Chaudhry, P.; Bagra, K.; Singh, B. Urban greenery status of some Indian cities: A short communication. Int. J. Environ. Sci. Dev. 2011, 2, 98. [Google Scholar] [CrossRef]
- Amritsar Municipal Corporation. Available online: https://www.amritsarcorp.com/ (accessed on 2 August 2019).
- Bangalore Municipal Corporation. Available online: http://bbmp.gov.in/home (accessed on 2 August 2019).
- Chennai Municipal Corporation. Available online: http://www.chennaicorporation.gov.in/ (accessed on 2 August 2019).
- Nagpur Municipal Corporation. Available online: https://www.nmcnagpur.gov.in/assets/250/2018/10/.../Final_CDP_Nagpur_-Mar_15.pdf (accessed on 5 August 2019).
- Mumbai Municipal Corporation. Available online: https://portal.mcgm.gov.in/irj/portal/anonymous (accessed on 6 August 2019).
- Pune Municipal Corporation. Available online: https://pmc.gov.in/en (accessed on 6 August 2019).
- URDPFI. Available online: http://mohua.gov.in/link/urdpfi-guidelines.php (accessed on 9 August 2019).
- World Health Organisation. Available online: www.euro.who.int (accessed on 9 August 2019).
- Subramanian, D.; Jana, A. Assessing urban recreational open spaces for the elderly: A case of three Indian cities. Urban For. Urban Green. 2018, 35, 115–128. [Google Scholar] [CrossRef]
- Sundaram, A.M. Urban green-cover and the environmental performance of Chennai city. Environ. Dev. Sustain. 2011, 13, 107–119. [Google Scholar] [CrossRef]
- Budruk, M.; Thomas, H.; Tyrrell, T. Urban green spaces: A study of place attachment and environmental attitudes in India. Soc. Nat. Resour. 2009, 22, 824–839. [Google Scholar] [CrossRef]
- Bharath, H.A.; Vinay, S.; Chandan, M.C.; Gouri, B.A.; Ramachandra, T.V. Green to gray: Silicon valley of India. J. Environ. Manag. 2018, 206, 1287–1295. [Google Scholar] [CrossRef] [PubMed]
- Nagendra, H.; Nagendran, S.; Paul, S.; Pareeth, S. Graying, greening and fragmentation in the rapidly expanding Indian city of Bangalore. Landsc. Urban Plan. 2012, 105, 400–406. [Google Scholar] [CrossRef]
- Rahman, K.M.; Zhang, D. Analyzing the level of accessibility of public urban green spaces to different socially vulnerable groups of people. Sustainability 2018, 10, 3917. [Google Scholar] [CrossRef]
- Kuhlman, T.; Farrington, J. What is sustainability? Sustainability 2010, 2, 3436–3448. [Google Scholar] [CrossRef]
- Paul, S.; Nagendra, H. Factors influencing perceptions and use of urban nature: Surveys of park visitors in Delhi. Land 2017, 6, 27. [Google Scholar] [CrossRef]
- Douglas, O.; Russell, P.; Scott, M. Positive perceptions of green and open space as predictors of neighbourhood quality of life: Implications for urban planning across the city region. J. Environ. Plan. Manag. 2019, 62, 626–646. [Google Scholar] [CrossRef]
- Dennis, W. Cultural and Developmental Factors in Perception; Ronald Press: New York, NY, USA, 1951. [Google Scholar]
- D’Souza, L.V. Public Perceptions of Urban Community Park Benefits: A Study in Arlington, Texas; Landscape Architecture: London, UK, 2013. [Google Scholar]
- Cilliers, E.J.; Timmermans, W.; Van den Goorbergh, F.; Slijkhuis, J.S.A. Designing public spaces through the lively planning integrative perspective. Environ. Dev. Sustain. 2015, 17, 1367–1380. [Google Scholar] [CrossRef]
- Carr, S.; Francis, M.; Rivlin, L.G.; Stone, A.M. Public Space; Cambridge University Press: Cambridge, UK, 1992. [Google Scholar]
- Woolley, H. Urban Open Spaces; Taylor and Francis: Abingdon, UK, 2003. [Google Scholar]
- Parra-Saldívar, A.; Abades, S.; Celis-Diez, J.L.; Gelcich, S. Exploring Perceived Well-Being from Urban Parks: Insights from a Megacity in Latin America. Sustainability 2020, 12, 7586. [Google Scholar] [CrossRef]
- Bahriny, F.; Bell, S. Traditional versus Modern? Perceptions and Preferences of Urban Park Users in Iran. Sustainability 2021, 13, 2036. [Google Scholar] [CrossRef]
- Whyte, W.H. The Social Life of Small Urban Spaces; The Conservation Foundation: Washington, DC, USA, 1980. [Google Scholar]
- Nadarajah, M.; Yamamoto, A. Urban Crisis: Culture and the Sustainability of Cities; Whiley-Bacjwell: Hoboken, NJ, USA, 2006; pp. 1–79. [Google Scholar]
- El Din, H.S.; Shalaby, A.; Farouh, H.E.; Elariane, S.A. Principles of urban quality of life for a neighborhood. Hbrc J. 2013, 9, 86–92. [Google Scholar] [CrossRef]
- Mitlin, D.; Satterthwaite, D. Sustainable development and cities. Sustain. Environ. Urban. 1996, 4, 23–62. [Google Scholar]
- Goosen, Z.; Cilliers, E.J. Enhancing social sustainability through the planning of third places: A theory-based framework. Soc. Indic. Res. 2020, 150, 835–866. [Google Scholar] [CrossRef]
- Manzi, T.; Lucas, K.; Jones, T.L. Social Sustainability in Urban Areas: Communities, Connectivity and the Urban Fabric; Taylor and Francis: Oxfordshire, UK, 2010; pp. 105–159. [Google Scholar]
- Back, S. A Study on the Design Checklist for Ecologically Sustainable Public Space. Available online: http://www.kisd.or.kr (accessed on 12 December 2020).
- Wiryomartono, B. Urban Design and Urbanism. In Livability and Sustainability of Urbanism; Palgrave Macmillan: Singapore, 2020; pp. 101–123. [Google Scholar]
- Macdonald, E. Urban design for sustainable and livable communities: The case of Vancouver. In Transportation, Land Use, and Environmental Planning; Elsevier: Amsterdam, The Netherlands, 2020; pp. 83–104. [Google Scholar]
- Nasar, J.L. The evaluative image of the city. J. Am. Plan. Assoc. 1990, 56, 41–53. [Google Scholar] [CrossRef]
- Carmona, M.; Heath, T.; Oc, T.; Tiesdell, S. Urban Spaces-Public Places: The Dimensions of Urban Design; Elsevier: Oxford, England, 2003. [Google Scholar]
- Shaftoe, H. Convivial Urban Spaces: Creating Effective Public Places; Earthscan: London, UK, 2012. [Google Scholar]
- Weijs-Perrée, M.; Dane, G.; van den Berg, P. Analyzing the Relationships between Citizens’ Emotions and their Momentary Satisfaction in Urban Public Spaces. Sustainability 2020, 12, 7921. [Google Scholar] [CrossRef]
- Mensah, C.A.; Andres, L.; Perera, U.; Roji, A. Enhancing quality of life through the lens of green spaces: A systematic review approach. Int. J. Wellbeing 2016, 6. [Google Scholar] [CrossRef]
- Kothencz, G.; Kolcsár, R.; Cabrera-Barona, P.; Szilassi, P. Urban green space perception and its contribution to well-being. Int. J. Environ. Res. Public Health 2017, 14, 766. [Google Scholar] [CrossRef] [PubMed]
- Mehta, V. Evaluating public space. J. Urban Des. 2014, 19, 53–88. [Google Scholar] [CrossRef]
- PPS. What Makes a Successful Space? 2019. Available online: https://www.pps.org/article/grplacefeat (accessed on 15 September 2019).
- Peng, Y.; Peng, Z.; Feng, T.; Zhong, C.; Wang, W. Assessing comfort in urban public spaces: A structural equation model involving environmental attitude and perception. Int. J. Environ. Res. Public Health 2021, 18, 1287. [Google Scholar] [CrossRef] [PubMed]
- Chen, C.; Luo, W.; Li, H.; Zhang, D.; Kang, N.; Yang, X.; Xia, Y. Impact of perception of green space for health promotion on willingness to use parks and actual use among young urban residents. Int. J. Environ. Res. Public Health 2020, 17, 5560. [Google Scholar] [CrossRef] [PubMed]
- Zhou, Z.; Xu, Z. Detecting the pedestrian shed and walking route environment of urban parks with open-source data: A case study in Nanjing, China. Int. J. Environ. Res. Public Health 2020, 17, 4826. [Google Scholar] [CrossRef]
- Krishan, A. (Ed.) Climate Responsive Architecture: A Design Handbook for Energy Efficient Buildings; Tata McGraw-Hill Education: Noida, India, 2001. [Google Scholar]
- Gautam, A. Climate Responsive Vernacular Architecture: Jharkhand, India. Ph.D. Thesis, Kansas State University, Manhattan, KS, USA, 2008. [Google Scholar]
- Wood, L.; Hooper, P.; Foster, S.; Bull, F. Public green spaces and positive mental health–investigating the relationship between access, quantity and types of parks and mental wellbeing. Health Place 2017, 48, 63–71. [Google Scholar] [CrossRef] [PubMed]
- Charkhchian, M.; Daneshpour, S.A. Interactions among different dimensions of a responsive public space: Case study in Iran. In Review of Urban and Regional Development Studies: Journal of the Applied Regional Science Conference; Blackwell Publishing Asia: Melbourne, Australia, 2009; Volume 21, pp. 14–36. [Google Scholar]
- Jacobs, J. The Death and Life of Great American Cities; Random House: New York, NY, USA, 1961; pp. 321–325. [Google Scholar]
- Lynch, K. The Image of the City; MIT Press: Cambridge, MA, USA, 1960; Volume 11. [Google Scholar]
- Holland, C.; Clark, A.; Katz, J.; Peace, S. Social Interactions in Urban Public Places; Policy Press: Bristol, UK, 2007. [Google Scholar]
- Moulay, A.; Ujang, N.; Said, I. Legibility of neighborhood parks as a predicator for enhanced social interaction towards social sustainability. Cities 2017, 61, 58–64. [Google Scholar] [CrossRef]
- Wolfgang, F.P.; Ostroff, E. Universal Design Handbook; Nova: New York, NY, USA, 2001. [Google Scholar]
- Jennings, V.; Bamkole, O. The relationship between social cohesion and urban green space: An avenue for health promotion. Int. J. Environ. Res. Public Health 2019, 16, 452. [Google Scholar] [CrossRef]
- Enssle, F.; Kabisch, N. Urban green spaces for the social interaction, health and well-being of older people—An integrated view of urban ecosystem services and socio-environmental justice. Environ. Sci. Policy 2020, 109, 36–44. [Google Scholar] [CrossRef]
- Zamanifard, H.; Alizadeh, T.; Bosman, C.; Coiacetto, E. Measuring experiential qualities of urban public spaces: Users’ perspective. J. Urban Des. 2019, 24, 340–364. [Google Scholar] [CrossRef]
- Francis, M. Urban Open Space: Designing for User Needs; Island Press: Washington, DC, USA, 2003. [Google Scholar]
- Ujang, N. Place attachment and continuity of urban place identity. Procedia Soc. Behav. Sci. 2012, 49, 156–167. [Google Scholar] [CrossRef]
- Gehl, J. Life between Buildings: Using Public Space; Island Press: Washington, DC, USA, 2011. [Google Scholar]
- Askari, A.H.; Soltani, S.; Mohd, I. Engagement in public open spaces across age groups: The case of Merdeka Square in Kuala Lumpur city, Malaysia. Urban Des. Int. 2015, 20, 93–106. [Google Scholar] [CrossRef]
- Eizenberg, E.; Jabareen, Y. Social sustainability: A new conceptual framework. Sustainability 2017, 9, 68. [Google Scholar] [CrossRef]
- UN World Commission on Environment and Development. Our Common Future; Oxford University Press: Oxford, UK, 1987. [Google Scholar]
- Sugiyama, T.; Carver, A.; Koohsari, M.J.; Veitch, J. Advantages of public green spaces in enhancing population health. Landsc. Urban Plan. 2018, 178, 12–17. [Google Scholar] [CrossRef]
- Financial Times. Definition of Environmental Sustainability. 2018. Available online: http://lexicon.ft.com/Term?term=environmental-sustainability (accessed on 6 August 2019).
- Blowers, A. (Ed.) Planning for a Sustainable Environment; Routledge: London, UK, 2013. [Google Scholar]
- Selman, P. What do we mean by sustainable landscape? Sustain. Sci. Pract. Policy 2008, 4, 23–28. [Google Scholar]
- VanDerZanden, A.M.; Cook, T.W. Sustainable Landscape Management: Design, Construction, and Maintenance; John Wiley and Sons: Hoboken, NJ, USA, 2010. [Google Scholar]
- Williams, T.G.; Logan, T.M.; Zuo, C.T.; Liberman, K.D.; Guikema, S.D. Parks and safety: A comparative study of green space access and inequity in five US cities. Landsc. Urban Plan. 2020, 201, 103841. [Google Scholar] [CrossRef]
- Oc, T.; Tiesdell, S. Safer City Centres: Reviving the Public Realm; Paul Chapman Publishing: London, UK, 1997. [Google Scholar]
- Lang, J.; Marshall, N. Urban Squares as Places, Links and Displays: Successes and Failures; Routledge: London, UK, 2016. [Google Scholar]
- Carmona, M. Principles for public space design, planning to do better. Urban Des. Int. 2019, 24, 47–59. [Google Scholar] [CrossRef]
- Lahoti, S.; Kefi, M.; Lahoti, A.; Saito, O. Mapping methodology of public urban green spaces using GIS: An example of Nagpur City, India. Sustainability 2019, 11, 2166. [Google Scholar] [CrossRef]
- Tashakkori, A.; Teddlie, C. (Eds.) Sage Handbook of Mixed Methods in Social & Behavioral Research; Sage: New York, NY, USA, 2010. [Google Scholar]
- Creswell, J.W.; Clark, V.L.P. Designing and Conducting Mixed Methods Research; Sage publications: Thousand Oaks, CA, USA, 2017. [Google Scholar]
- Kothari, C.R. Research Methodology: Methods and Techniques; New Age International: Mumbai, India, 2004. [Google Scholar]
- Fink, A. The Survey Handbook; Sage: Thousand Oaks, CA, USA, 2003. [Google Scholar]
- Barlett, J.E.; Kotrlik, J.W.; Higgins, C.C. Organizational research: Determining appropriate sample size in survey research. Inf. Technol. Learn. Perform. J. 2001, 19, 43. [Google Scholar]
- Hazelrigg, L. Inference. In The Handbook of Data Analysis; Hardy, M., Bryman, A., Eds.; Sage: London, UK, 2009. [Google Scholar]
- Sreetheran, M. Exploring the urban park use, preference and behaviours among the residents of Kuala Lumpur, Malaysia. Urban For. Urban Green. 2017, 25, 85–93. [Google Scholar] [CrossRef]
- Gaikwad, A.; Shinde, K. Use of parks by older persons and perceived health benefits: A developing country context. Cities 2019, 84, 134–142. [Google Scholar] [CrossRef]
- Ryan, R.L. Exploring the effects of environmental experience on attachment to urban natural areas. Environ. Behav. 2005, 37, 3–42. [Google Scholar] [CrossRef]


| Sr.No. | Characteristics | MSDP ( POS-1) | RGP (POS-2) | ||
|---|---|---|---|---|---|
| (n = 290) | (n = 263) | ||||
| Count | Percentage | Count | Percentage | ||
| 1 | Gender | ||||
| Male | 165 | 56.89 | 166 | 63.11 | |
| Female | 125 | 43.1 | 97 | 36.88 | |
| 2 | Age group | ||||
| 18-24 years | 51 | 17.6 | 55 | 20.9 | |
| 25-39 years | 101 | 34.8 | 99 | 37.6 | |
| 40-59 years | 78 | 26.9 | 66 | 25.1 | |
| 60 years and older | 60 | 20.7 | 43 | 16.3 | |
| 3 | Education level | ||||
| School | 13 | 4.5 | 8 | 3.0 | |
| Junior College | 55 | 19.0 | 42 | 16.0 | |
| Degree | 133 | 45.9 | 128 | 48.7 | |
| Post graduation | 61 | 21.0 | 52 | 19.8 | |
| Doctorate | 21 | 7.2 | 22 | 8.4 | |
| Post Doctorate | 7 | 2.4 | 11 | 4.2 | |
| Not visited school | 0 | 0.0 | 0 | 0.0 | |
| 4 | Occupation | ||||
| Government servant | 48 | 16.6 | 24 | 9.1 | |
| Private Sector | 112 | 38.6 | 96 | 36.5 | |
| Self Employed | 67 | 23.1 | 52 | 19.8 | |
| Retired | 9 | 3.1 | 26 | 9.9 | |
| Student | 24 | 8.3 | 31 | 11.8 | |
| Housewife | 21 | 7.2 | 17 | 6.5 | |
| Not working/Searching for Job | 9 | 3.1 | 17 | 6.5 | |
| 5 | Footfall measured in one week | 1172 | 852 | ||
| Sr.No. | POSs Name | Sample Size (n) | Number of Measuring Items | Cronbach’s Alpha (α) |
|---|---|---|---|---|
| 1 | MSDP | 290 | 45 | 0.730 |
| 2 | RGP | 263 | 45 | 0.776 |
| Sr.No | Space Facilities, Services, and Aesthetic Appearance (Independent Variable) | Respondents’ Perception (Dependent Variable) | MSDP (POS-1)(n = 290) | RGP (POS-2)(n = 263) | ||
|---|---|---|---|---|---|---|
| Pearson Correlation | Sig.(2-Tailed) | Pearson Correlation | Sig.(2-Tailed) | |||
| 1 | POS offers attractive and pleasant views | POS makes a perceivable and positive image | 0.240 ** | 000 | 405 ** | 000 |
| 2 | Space encourages a variety of activities: active, passive and other | User spends quality time in this space | 0.525 ** | 0.000 | 0.266 ** | 0.000 |
| 3 | Space needs more safety arrangements: Security guards, Lights and CCTV | Users feel safe within space | −0.133 * | 0.024 | −0.343 ** | 0.000 |
| 4 | Design and layout of space appropriate for users | Space is capable of fulfilling people’s needs | 0.513 ** | 0.000 | 0.186 ** | 0.003 |
| 5 | Space provides access to community services, amenities, and leisure facilities. | Space leads to the reduction of health expenditure | −0.495 ** | 0.000 | −0.125 * | 0.034 |
Publisher’s Note: MDPI stays neutral with regard to jurisdictional claims in published maps and institutional affiliations. |
© 2021 by the authors. Licensee MDPI, Basel, Switzerland. This article is an open access article distributed under the terms and conditions of the Creative Commons Attribution (CC BY) license (https://creativecommons.org/licenses/by/4.0/).
Share and Cite
Ahirrao, P.; Khan, S. Assessing Public Open Spaces: A Case of City Nagpur, India. Sustainability 2021, 13, 4997. https://doi.org/10.3390/su13094997
Ahirrao P, Khan S. Assessing Public Open Spaces: A Case of City Nagpur, India. Sustainability. 2021; 13(9):4997. https://doi.org/10.3390/su13094997
Chicago/Turabian StyleAhirrao, Pritam, and Smita Khan. 2021. "Assessing Public Open Spaces: A Case of City Nagpur, India" Sustainability 13, no. 9: 4997. https://doi.org/10.3390/su13094997
APA StyleAhirrao, P., & Khan, S. (2021). Assessing Public Open Spaces: A Case of City Nagpur, India. Sustainability, 13(9), 4997. https://doi.org/10.3390/su13094997