Article

Development of an Agent-Based Model for Weather Forecast Information Exchange in Rural Area of Bahir Dar, Ethiopia

1
Department of Civil and Environmental Engineering, University of Connecticut, Storrs, CT 06268, USA
2
Department of Civil and Environmental Engineering, University of Massachusetts Dartmouth, Dartmouth, MA 02747, USA
*
Author to whom correspondence should be addressed.
Sustainability 2021, 13(9), 4936; https://doi.org/10.3390/su13094936
Submission received: 1 March 2021 / Revised: 20 April 2021 / Accepted: 26 April 2021 / Published: 28 April 2021

Abstract

:
Smallholder farmers in Ethiopia are vulnerable to climate change impacts due to their low adaptive capacity and dependence on rainfed agriculture. Thus, a successful weather forecast system may bring significant economic and social value to the community. The main objectives of this study were to identify the key information exchange agents, understand the information flow path, rank the relative importance of the different information dissemination pathways, and determine weather forecast adoption. We conducted a household survey in five villages of Rim Kebele in Bahir Dar area and found that farmers communicate with four main agents with regard to information exchange. We developed an agent-based model to learn the adoption rates of weather forecast information. Agriculture extension agents were found to be the most influential members of the community. Farmers’ communicating with neighboring village farmers showed higher adoption. Our results show at least twice that improvements in communication network attain higher adoption rates. Radio has also demonstrated positive uptake of information. We also found that forecast accuracy of 70% is sufficient to achieve high adoption rates. Our findings might help decision-makers recognize critical information flow pathways and their relative importance, and identify barriers to disseminating weather forecast information in the community.

1. Introduction

Water resources management needs improvement to alleviate poverty, food insecurity, and socioeconomic development in Africa [1]. Ethiopia is often considered as East Africa’s water tower [2] within the Blue Nile Basin, which provides about 62% of Nile river flow (50 km3/year) but only utilizes under 1 km3/year. Underuse of its total generated water flows offers potential for additional water resources development and utilization [1]. Climate change is escalating the country’s vulnerability to drought and flood as the temperature increases and rainfall becomes more erratic [3]. Smallholder farmers are sensitive to climate variability and are among the worst hit due to their low adaptive capacity to climate change and dependence on rainfed agriculture [4]. There is a link between rainfall and agricultural productivity in Ethiopia [5]. For this reason, a successful seasonal forecast system may bring significant economic and social value to the rural community of Ethiopia [3]. Seasonal forecasts are suited for rainfed farming systems [6,7] and can improve the livelihoods of farmers in regions of high inter-annual rainfall variability [8,9], improve agricultural productivity [10], and sustain rural competitiveness and development [11,12].
Seasonal forecasts are available for temperature and rainfall in a number of regions developed by National Meteorological Agencies or Services. Each country adjusts these regional forecasts based on their local data to create their own climate forecasts [13]. Followed by frequent droughts during the 1970s and 1980s in Ethiopia, the Ethiopian National Meteorological Services Agency (NMSA) has developed various seasonal forecasts [3]. This has enabled farmers to have access to weather information to make better farming decisions [14,15]. However, having access to the information is not sufficient. Forecast accuracy and skills are also relatively important to build up trust in weather forecast information. Forecast skill is a measure of prediction accuracy of an observation [16]. This skill of seasonal climate prediction has been improved during recent decades [17,18].
Humans would not be able to confront the complexities of everyday life [19] without trusting each other [20,21,22]. The concept of trust is vital in communication when the purpose is to convince farmers to adopt weather forecast information [23]. Building farmers’ trust in the seasonal forecast is difficult because of relatively poor and risk-averse farmers who cannot bear the risk of using the “wrong forecast” [24,25]. Lack of trust in the data is a significant barrier to the effective uptake and use of seasonal forecast information which is often ineffectively communicated to the users [26]. The trust that farmers have in a forecast is determined by forecast skill and the status of the communicator in the community [27]. Improved credibility may rely on improved forecasts, better data and better communication from respected sources [28].
Forecast accuracy is the percentage of time that the forecast and actual rainfall are in agreement [28]. In one study, the Ziervogel et al. model [28] simulates a 50-year time series of grain storage under three different cases: when the forecast is correct, when there is no forecast, and for forecast failure. This study shows that poor forecasts can be damaging and lead to a grain deficit. Their study concludes that the forecasts must be correct more than about 60–70% of the time to benefit farmers in South Africa. As forecast skill increases, trust and agricultural income also increase in rainfed dependent communities. This suggests that a failure of weather forecasts over time might cause farmers to lose confidence in the forecasts and this impacts agricultural productivity. A sensitivity analysis of forecast skill indicates that, as forecast skill increased to 70%, the farmers’ net agricultural income and trust in the forecast both increased in Sri Lanka [29]. Stigter [30] considered 70% of weather forecast accuracy a failure, and Berry et al. [31] found that a moderate level of forecast skill, 55–65%, is considered potentially useful for adoption in South America. Changing forecast skills over longer periods of time can affect the adoption of forecasts [32]. If forecast accuracy falls below skill level, e.g., for five or more years, this can hamper the propensity of farmers to adopt and maintain trust. Ash et al. [33] found that forecasts of 70% accuracy are required for users to widely adopt seasonal forecasts in Australia.
On the other hand, it is difficult to assess the impacts of weather forecasts because they are not widely used currently in developing countries [34]. Crop management models have been used to assess the impact of seasonal forecasts [35,36]. Yet assessing the impact of weather forecasts requires the study of complex social and environmental systems.
The agent-based model (ABM) has been applied in an array of domains [37], but it is a relatively new approach in agriculture to study farmer-environment relationships and to improve weather forecast assimilation and agricultural productivity. ABM is a computational model that tries to simulate human behavior in order to communicate weather forecasts among users. Agents, households, or other entities interact by a set of logical rules, having unique characteristics for each agent in a confined environment [38]. ABM can facilitate the evaluation of seasonal forecast adoptions by linking social science interests to natural systems [39]. It can also be used to couple crop, climate, and social factors to explore the impact of seasonal forecast use and adaptation strategies [28]. It has been stated [40] that ABM has been proved to be an effective instrument for complex, coupled human/engineered/environmental systems.
The main objectives of this paper are to (1) identify the key information exchange agents, (2) gain an understanding of the key information flow pathways by which the forecast might be disseminated and shared, (3) rank the relative importance of the different pathways, (4) identify barriers to forecast adoption and (5) explore ways to optimize forecast adoption. In this study, an agent-based model was developed based on a field survey of households at the village level to assess the impact of seasonal forecast use by smallholder farmers in Bahir Dar, Ethiopia. We consider farmers’ initial weather forecast information use and characteristics, their options in reacting to forecasts, and how much they trust weather forecast information.

2. Materials and Methods

2.1. Description of the Study Area

Rim Kebele (a Kebele is the smallest administrative unit in Ethiopia) was chosen for this study, located in Mecha Woreda, West Gojam Zone of Amhara Region, Ethiopia [41] (Figure 1). The choice of Rim Kebele was based on the socio-physical characteristics of the farming systems and the agro-ecological setting. Almost all farmers in Kebele practice rainfed agriculture (Table A1). Rainfed agriculture is the main source of sustenance of 90% of the population in Ethiopia [42].
Rim Kebele has a total of 18 villages, and for this study the National Science Foundation Partnership for International Research and Education (PIRE) project research team randomly selected five villages with kebele representatives; Angut-Mahal, Cheba-1, KoRim, Sendi, and Dima villages were sampled for this study (Table A1).

2.2. Sampling and Data Collection

PIRE project researchers visited Rim Kebele in 2017, followed by a visit in summer 2018 to pre-test survey questionnaires designed by the project team with four-five farmers. Data collection was discussed with village-level experts and representatives from households. We randomly sampled 100 households from five villages with 20 households each by using local government generated lists of households. Local experts and farmer representatives reviewed the household-level questionnaire prior to in-person interviews with farmers. We conducted survey questionnaires with 100 sampled smallholder farmers in summer 2019.

2.3. Model Development

This study aims to develop an agent-based model based on the household survey to assess the impact of seasonal weather forecast information used by smallholder farmers.
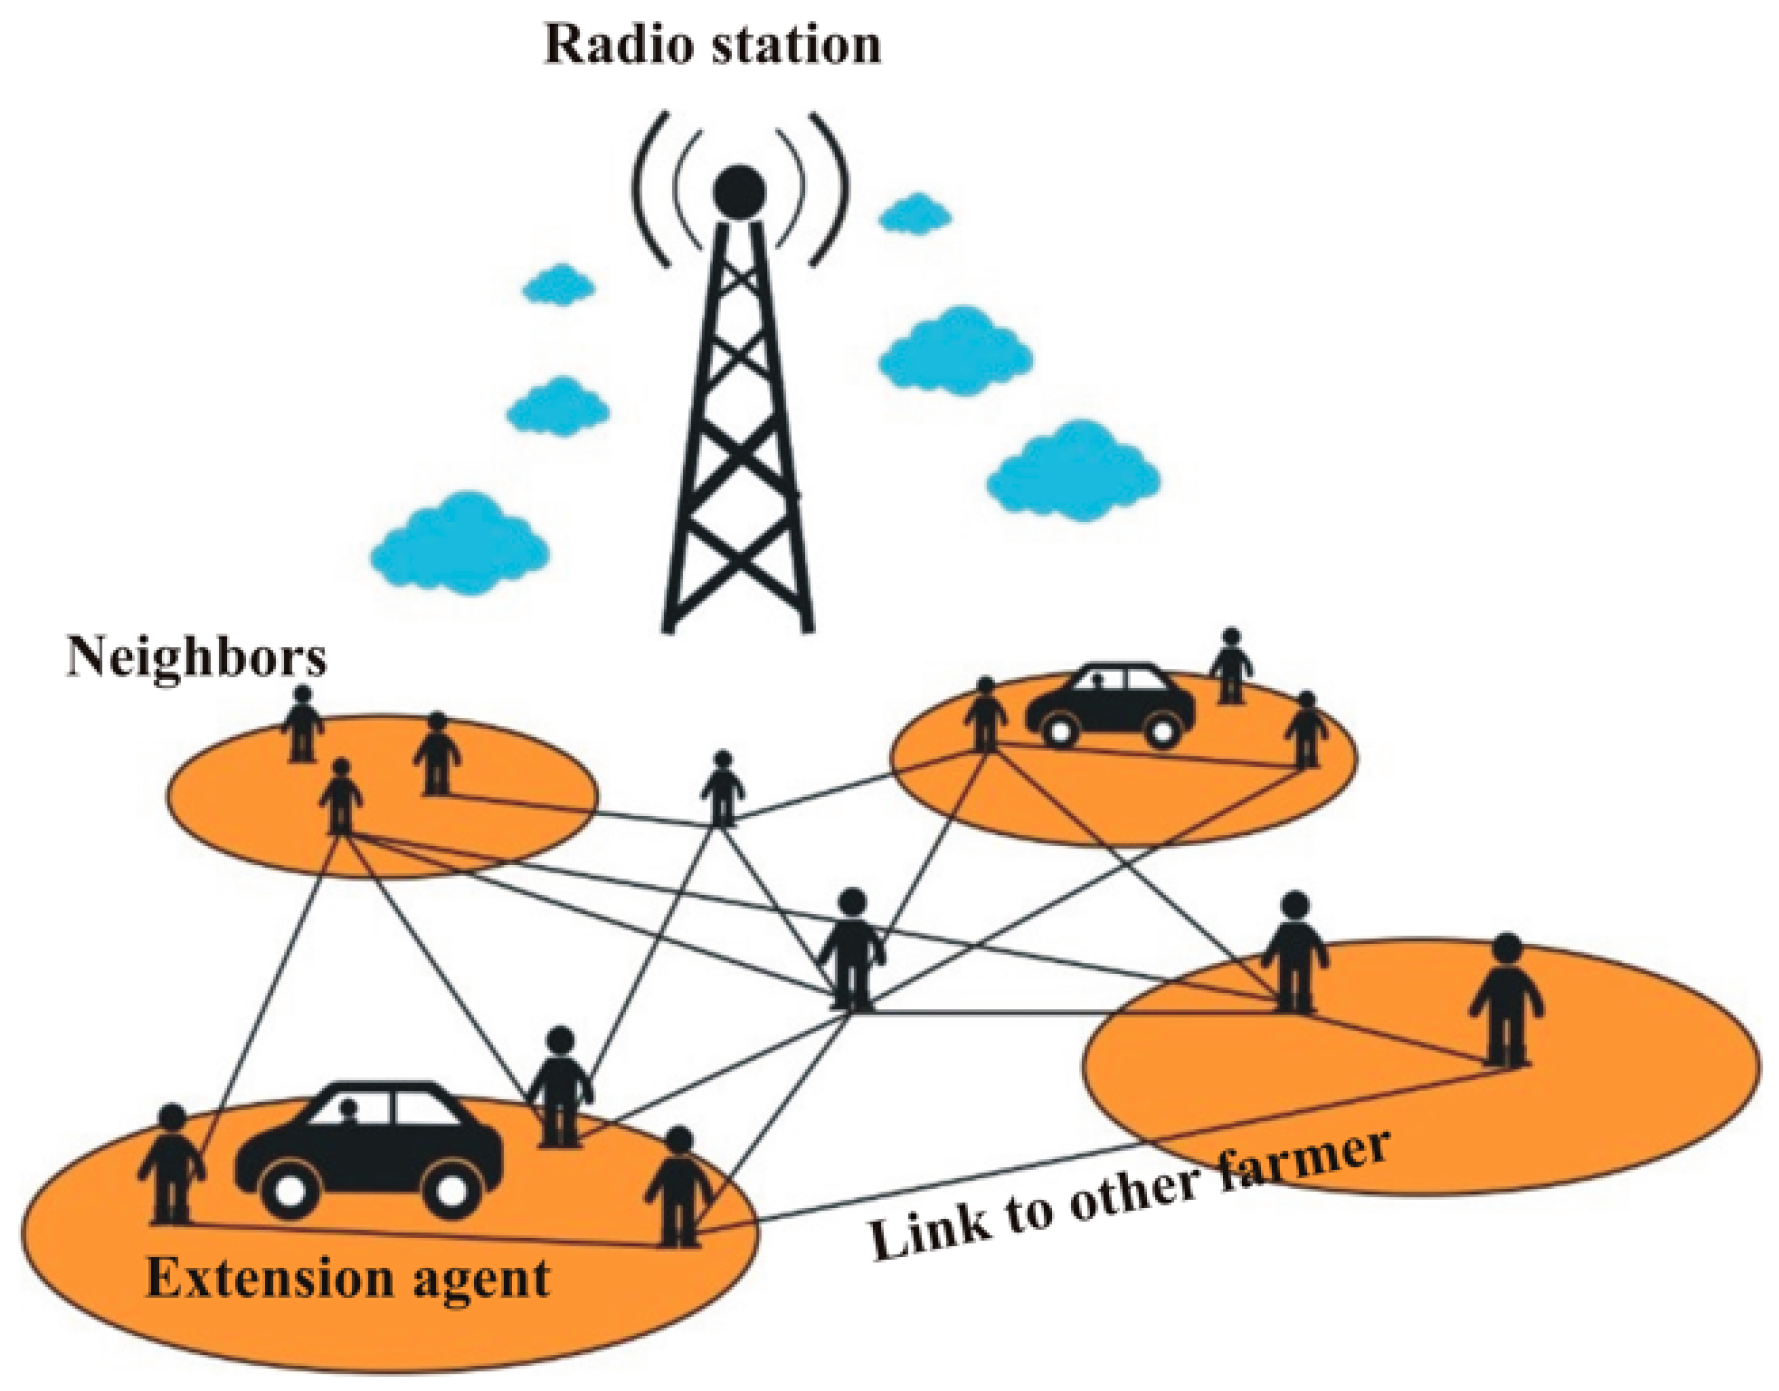
We initially identified 11 types of agents who might communicate weather information in the community during the survey design with local experts. However, survey analysis showed that there are actually four types of agents who are the leading communicators in disseminating and uptaking weather forecast information in the community (Figure 2). Water fathers (berede tebaki), farmer cooperatives, and church priests were thought to be influencers in information dissemination, but were found to be less important in weather communication. The demand for irrigation project experts’ service is less, due to almost all farmers practicing rainfed agriculture (Table A2).
Influential weather information communicators are neighboring farmers, other farmers in the Kebele, agricultural extension workers, and radio. Farmers interact with one another, may trust each other, and act upon the weather information. Agriculture extension workers have higher influence levels in the Kebele compared to other agents (Table 1). Based on the survey reports, there are four extension agent workers in Rim Kebele. They are the Kebele agricultural office head, the Kebele development agent for natural resource management, the Kebele development agent for crop production & management, and the Kebele development agent for animal production & breeding. Our follow up meetings in 2020 with farmers regarding weather forecast communication found that farmers closely cooperated with agricultural extension workers during the growing season. This explains that extension workers have a high influence among the Kebele farmers.

2.3.1. Conceptual Framework of ABM Development

The purpose of the ABM model is to study the dynamics of information exchange among the agents. We coin “Likelihood to Adopt”, or LTA, a basic unit of measurement in the range of 0 to 100 LTA points for the development that an individual agent gains, holds, or loses during interactions with other agents. It is a measure of an agent’s likelihood that they receive, trust and then adopt weather forecast information. Weather forecast failure reduces agricultural productivity [28,43] and trust in the weather forecast [29]. Thus, forecast skill or accuracy is an important indicator to build up trust and adoption levels in the community. Several authors [30,31,33] have suggested a forecast skill of 55%–70% should be required for wide scale of adoption of weather forecast information. Farmers start to disagree with the information and stop trusting it if it is below this level. Thus, we take an average forecast accuracy threshold of 65% for the model. If forecast accuracy is above 65%, agents gain LTA points through interactions (Figure A1) or lose points if forecast accuracy is less than 65%.

2.3.2. Information Flow Path in the ABM Model

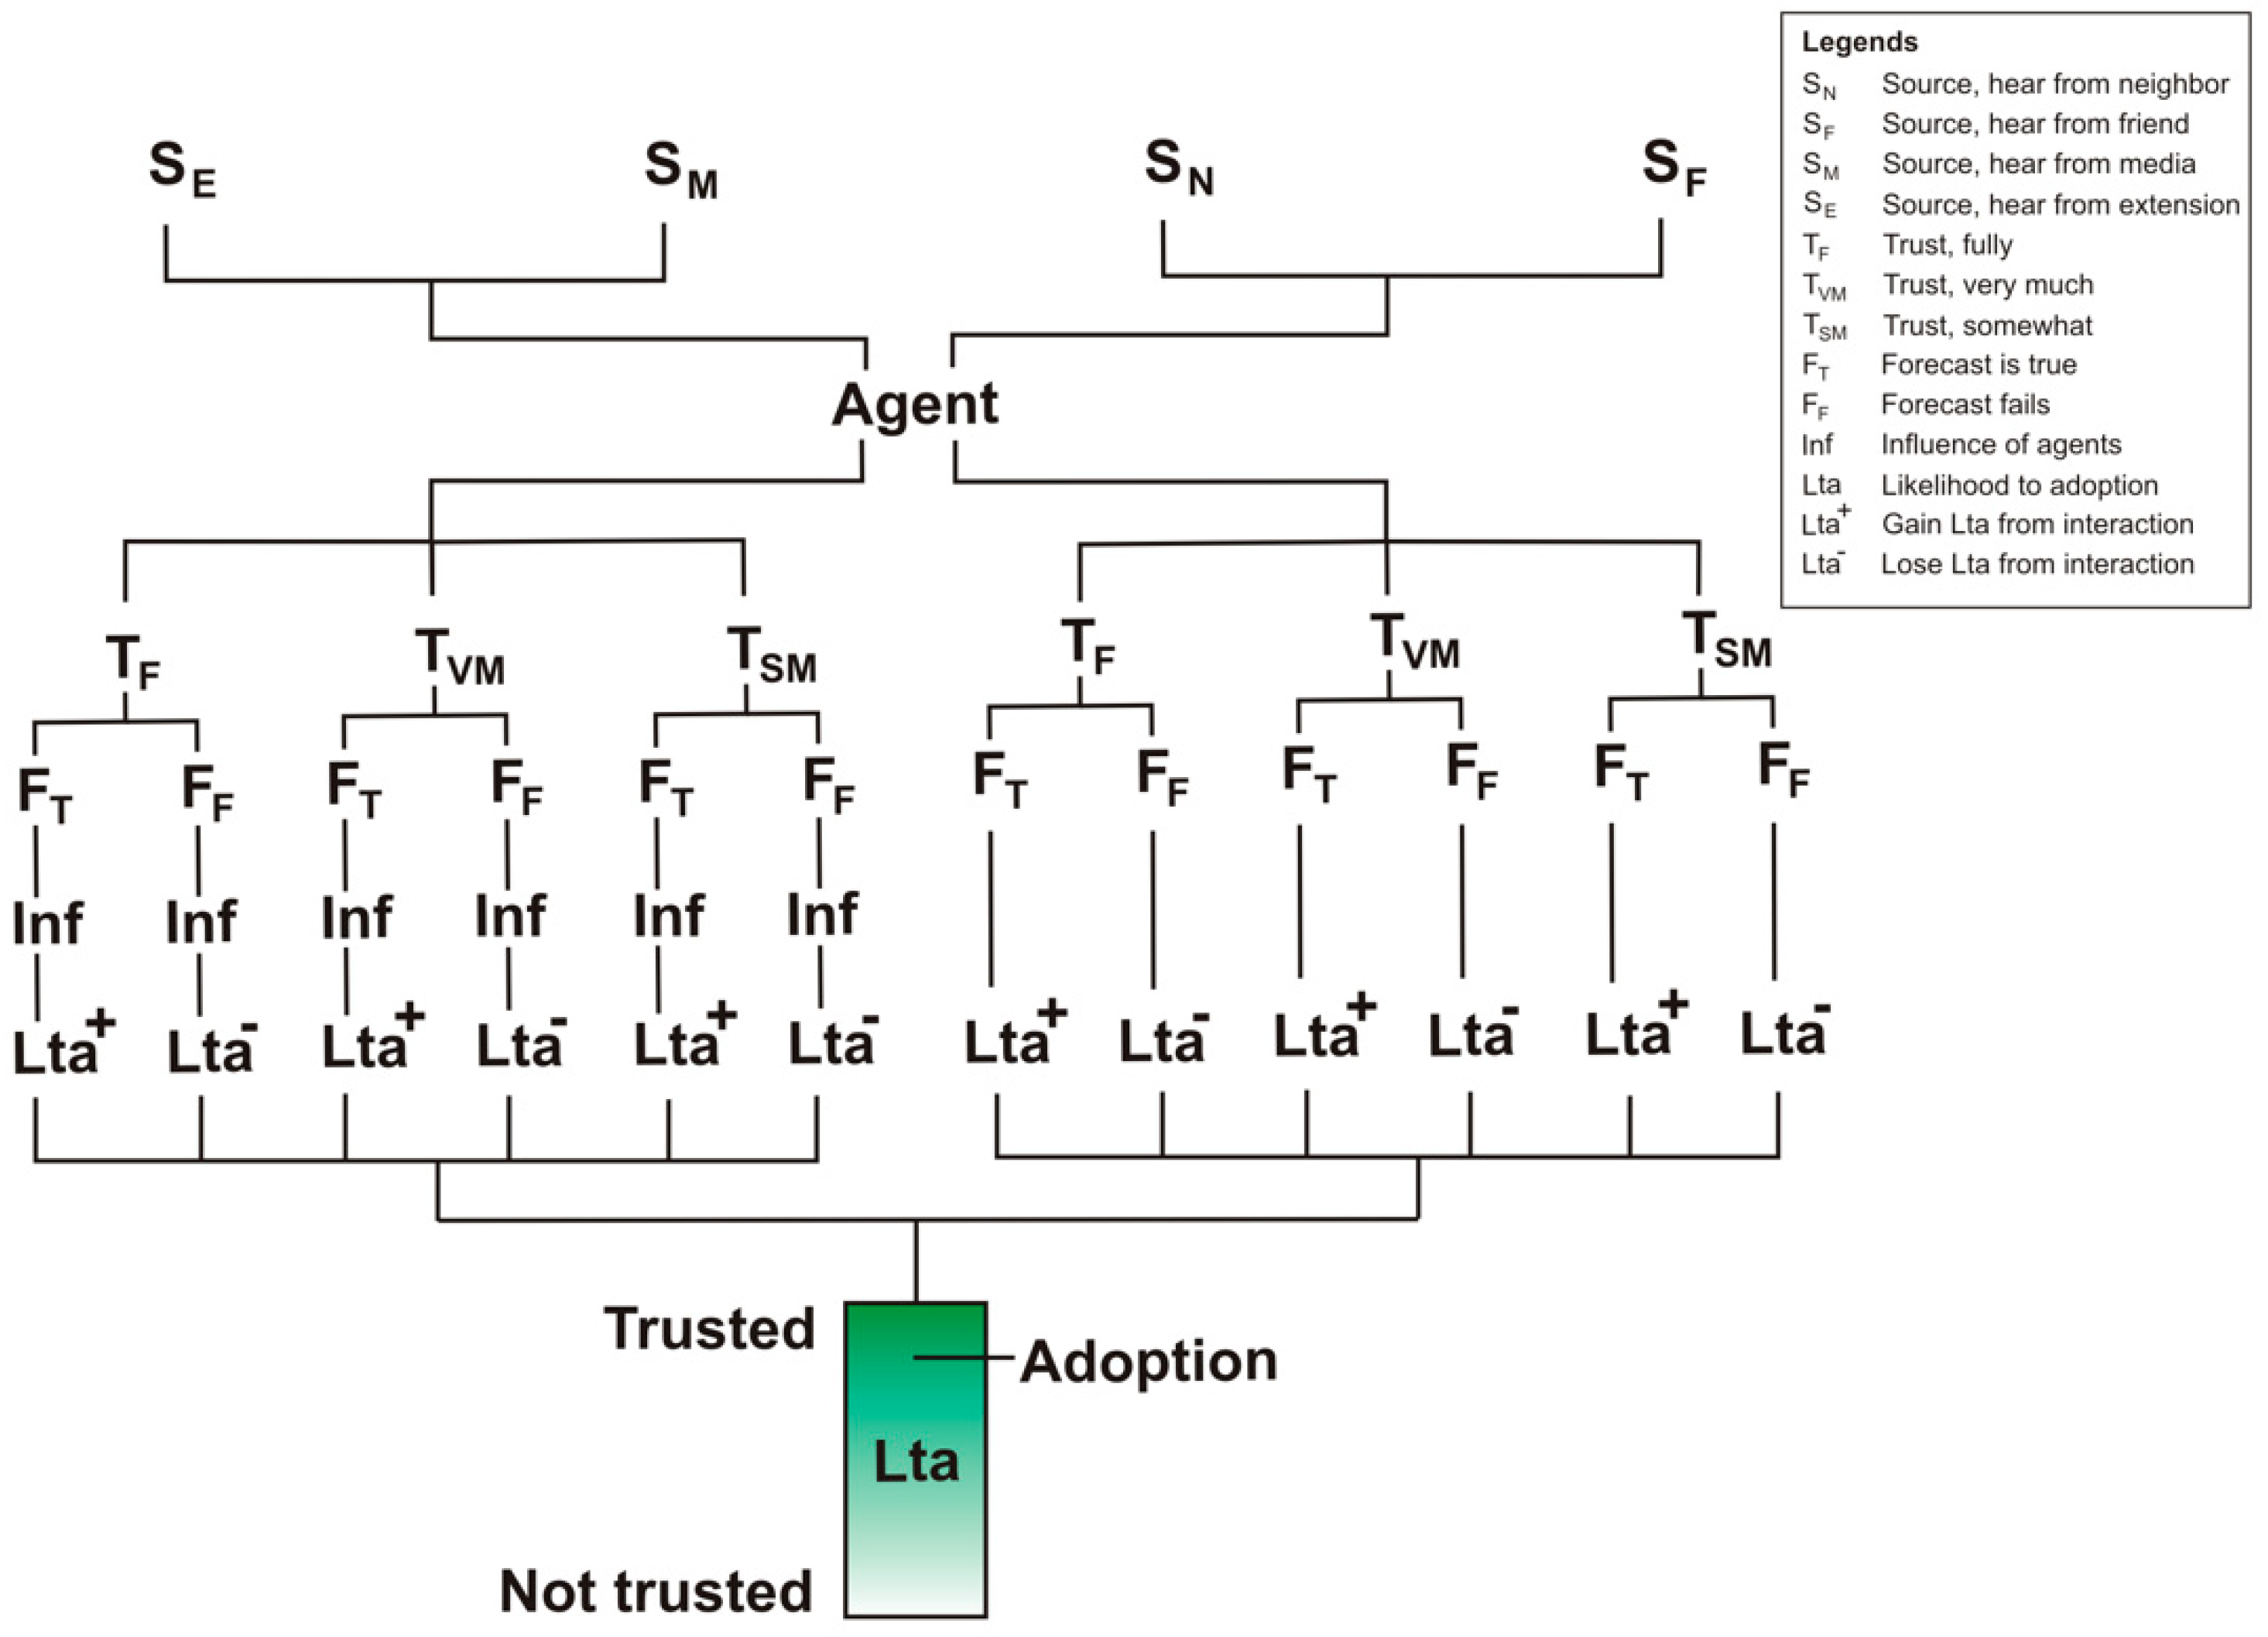
An agent receives weather information from four sources: SE—agriculture extension worker, SM—media, SN—nearby neighbors, and SF—other friends, known as “friends” in the community. Trust levels are an important step in model development. TF represents an agent that fully trusts the source of information, TVM, very much trust, and TSM, somewhat trust. The ABM model connects weather forecast accuracy to the trust level of the agent. Agricultural extension workers and radio have an influence on agents gaining or losing LTA points. These get accumulated over a time series, and farmers adopt weather forecast information when their LTA points reach the adoption threshold (Figure 3).

2.3.3. Model Calibration

We calculated the probability level of information sources, trust, and adoption levels from the field survey. Since it is impossible to know precisely how much LTAs might be gained from a single interaction, we will use this LTA increase (or decrease) as a calibration parameter. We are able to do this, because we know where each agent gets information from, and how many adoption rates there are from various sources. Each individual agent’s LTA’s increase will be weighted according to their reported trust (Figure 4). ABM sensitivity and trust values were designed based on [44] stratification of trust values (Table 2).

2.3.4. Model Sensitivity

It is challenging to quantify how much trust value is exchanged during agents’ communications. Discussion occurs using stratification of trust value, a kind of fuzzy logic of trust, labeling each strata with different trust levels [44]. Thus, ‘very high trust’ > 0.9 places a value of over 90% on how much an agent trusts another agent. Likewise, medium and low trust levels, as well as distrust labels and value ranges, are designated (Table 2).
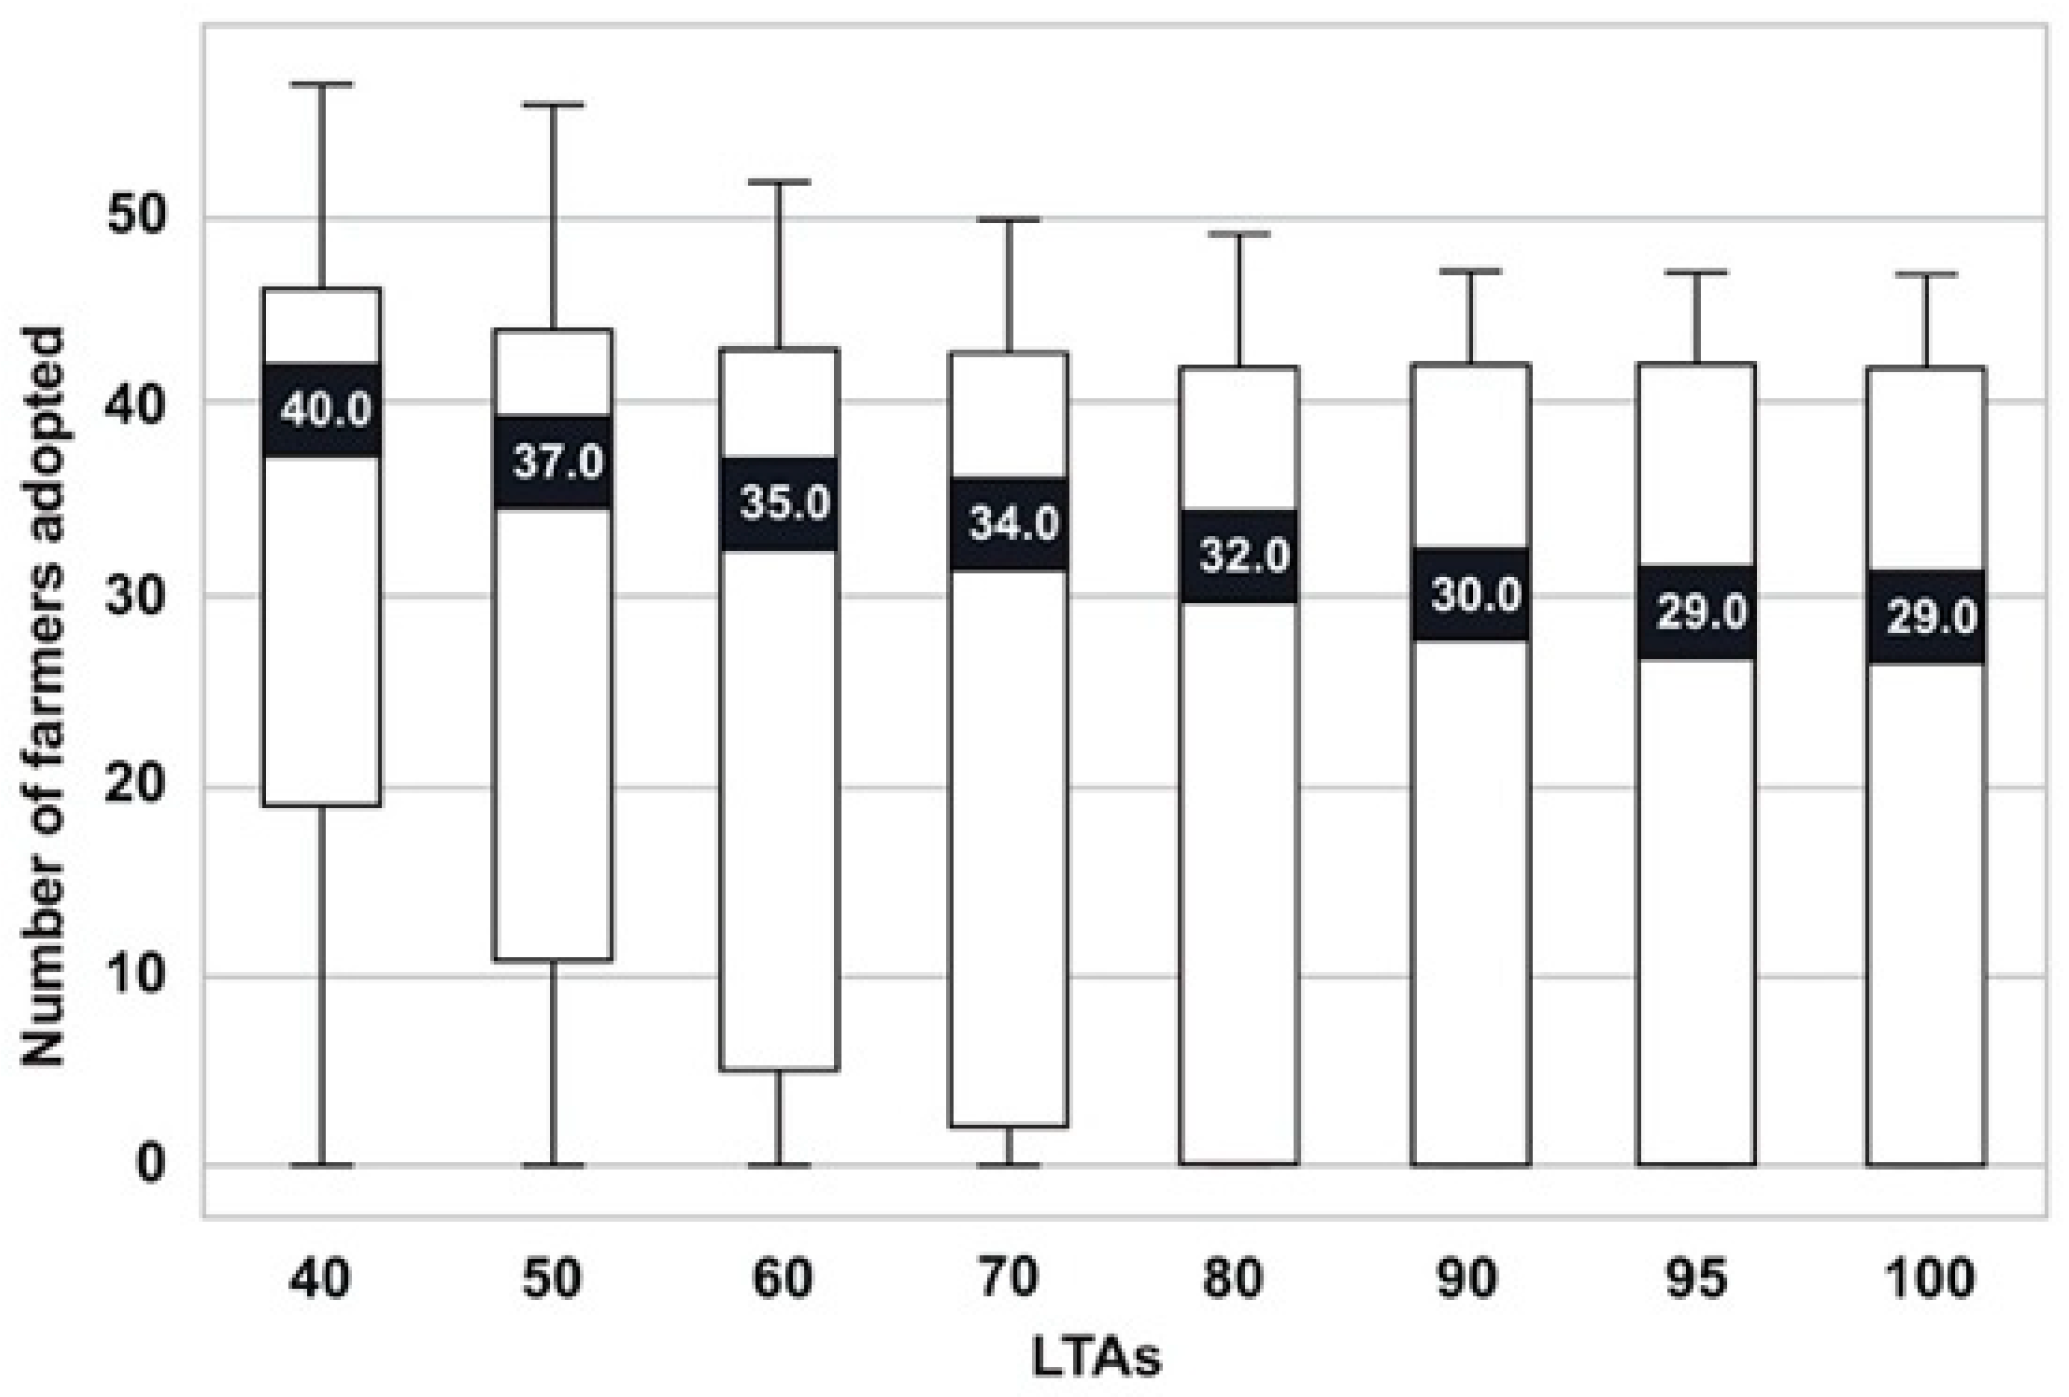
Based on the stratification of trust values given by Marsh [44], a farmer’s amount of trust in weather forecast information exchange ranges between 0 and 1. The forecast is considered as “true” if accuracy is over 65% or “false” when accuracy is below 65%. Thus, if a farmer has complete trust (1.0) in other agents, then he/she gains all LTA points. If a farmer very much trusts (0.75), or somewhat trusts (0.5), he/she gains 75%, 50% of LTA points, respectively. Similarly, weather forecast failure causes the loss of LTA points in distrust (Table 2). The adoption rate has been chosen based on sensitivity analysis over different LTA points (Figure 5). There is no significant increase over 90 LTA points. Marsh [44] also categorizes > 90’ very high trust’. Thus, based on these two observations, farmers in this model adopt the information at 90 LTA points.
ABM models the complex interactions between agents such as nearby neighbors, other farmers in the kebele, agriculture extension workers, and radio.
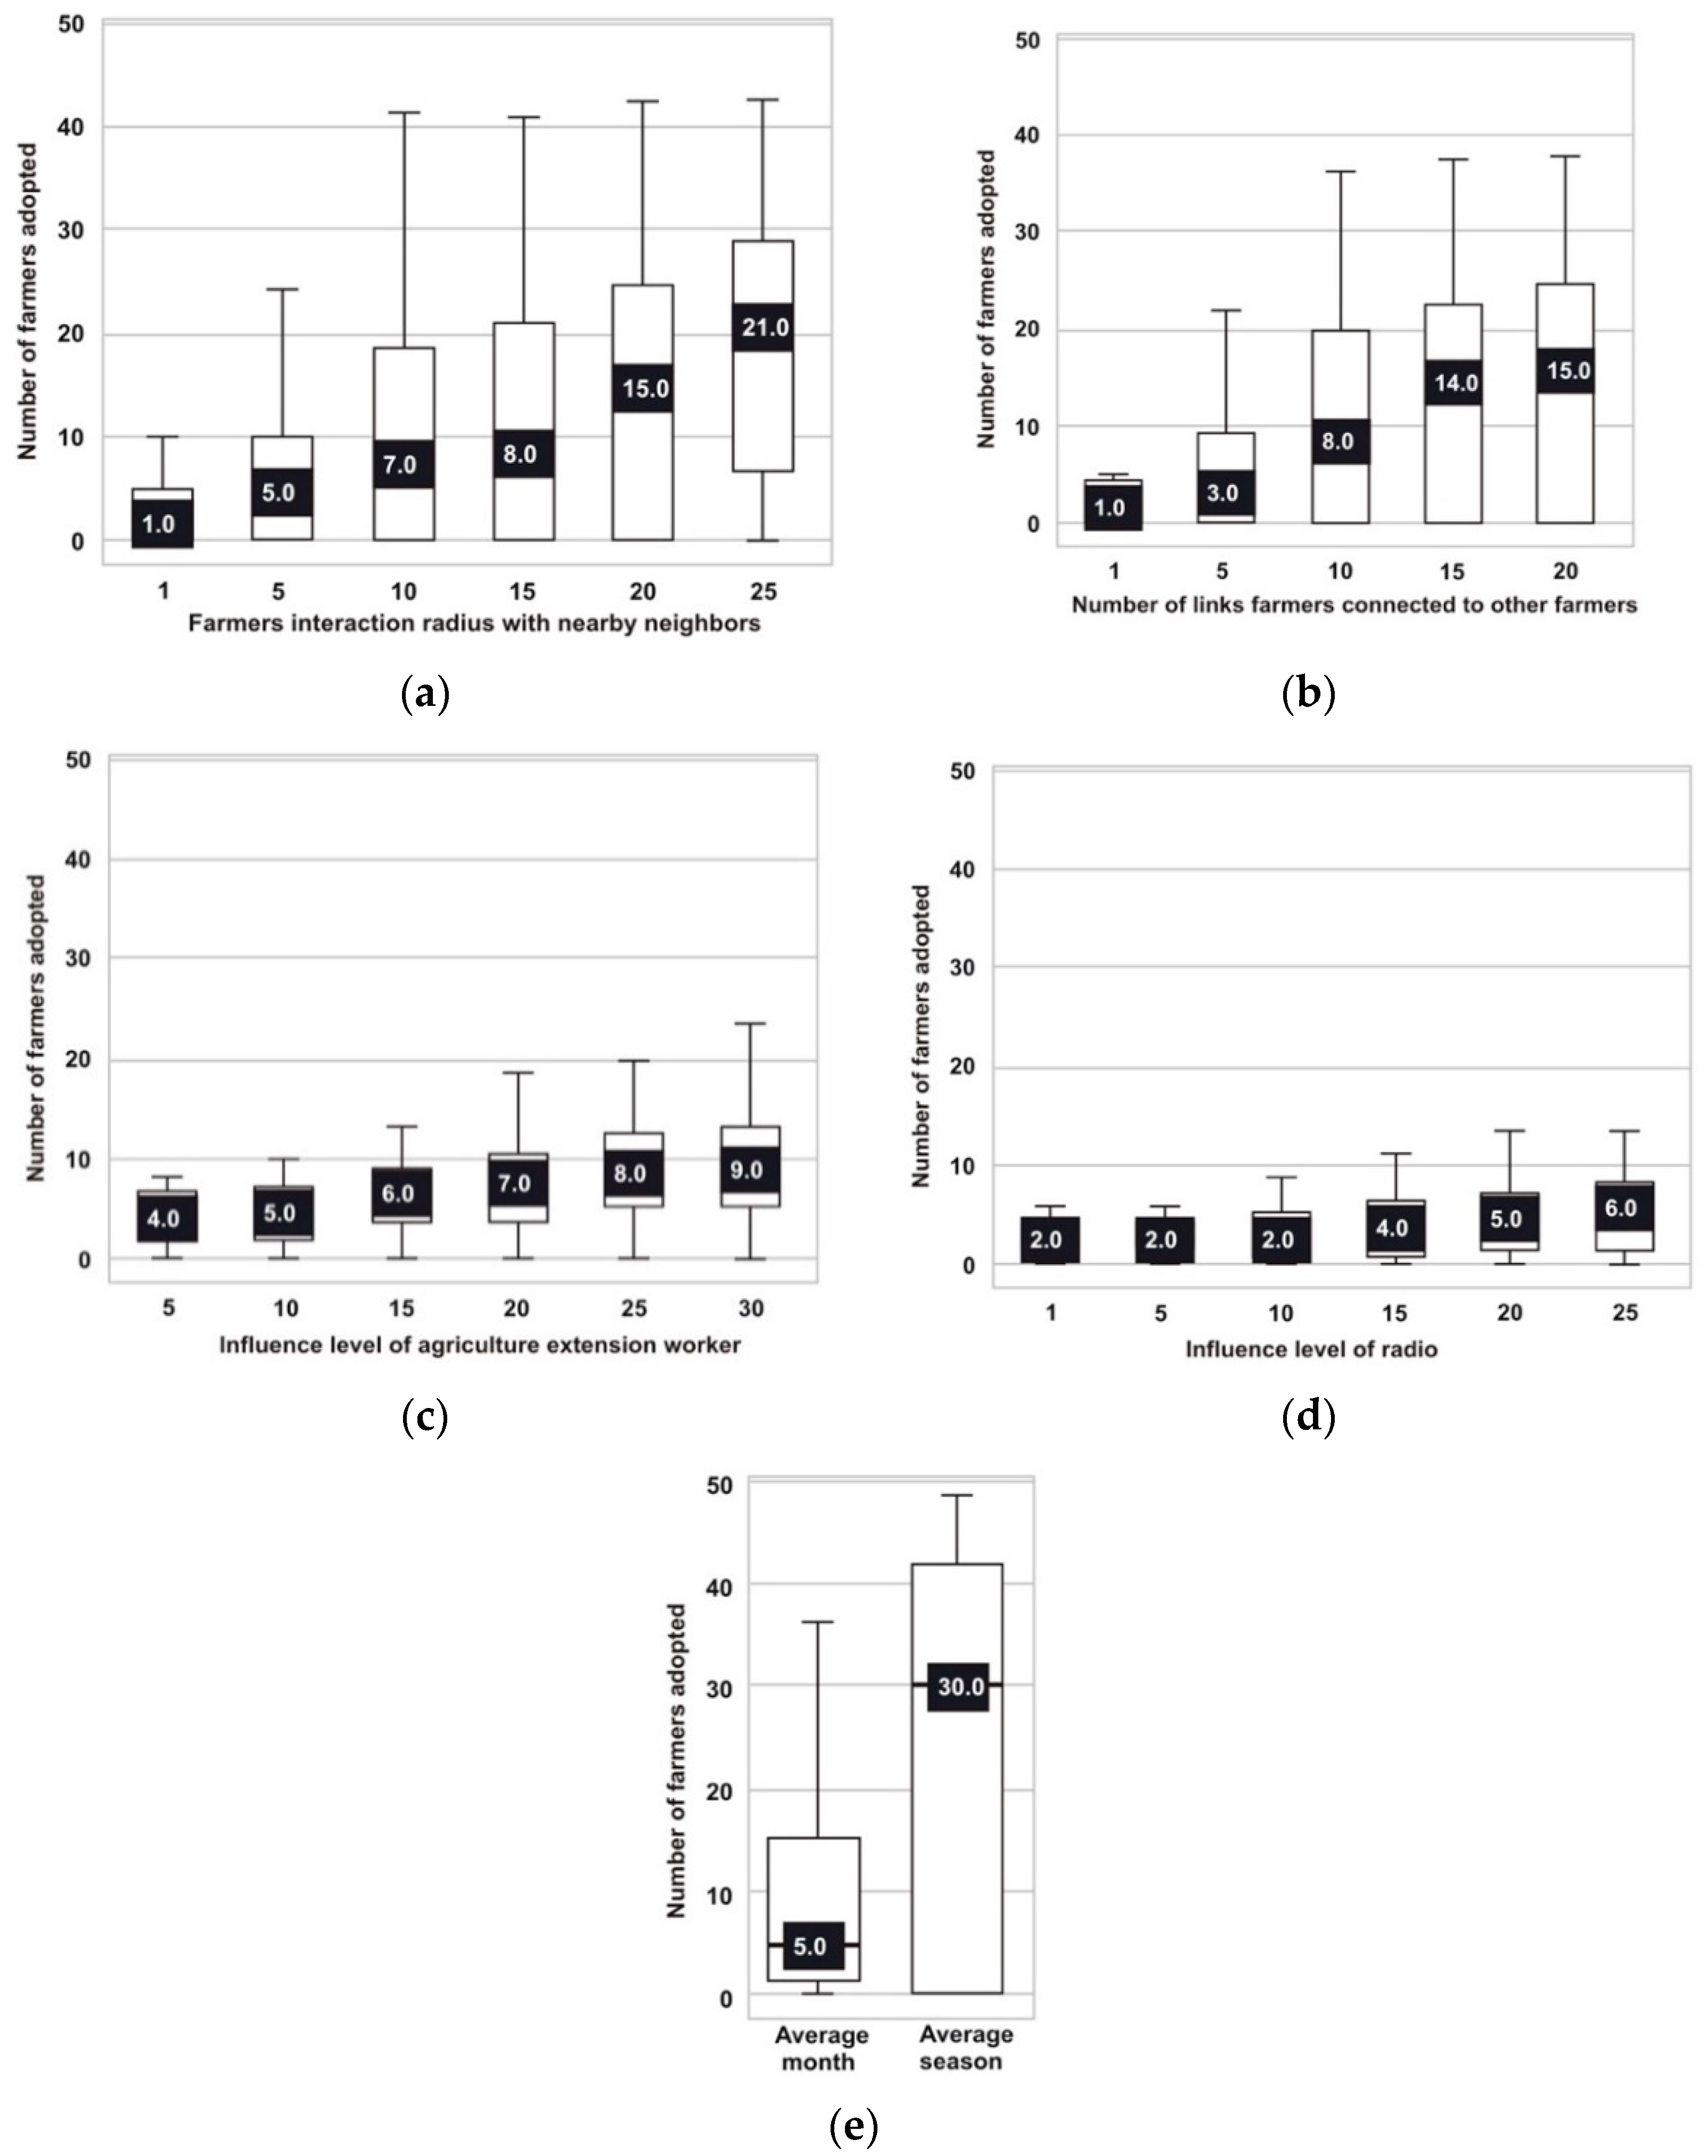
Each agent’s parameters are calibrated based on survey of monthly and seasonal adoption rates. Each agent is calibrated individually based on individual survey data, and in a group as an average where all agents interact with each other in the modeling environment (Figure 6). We run sensitivity analysis (Figure 5) and model calibration based on survey monthly and seasonal data (Figure 6). We then conducted experiments with various changing variables such as farmer-interaction distance with nearby neighbors, their connection to other farmers, radio influence in the community, weather forecast accuracy, and influence of agriculture extension workers. The number of visits by agriculture extension workers is calculated by varying the interaction distance of the workers.

3. Results and Discussion

A survey determines the demographic characteristics of farmers and the use of weather forecast information among the farmers. The age of the household head varies between 20 and 81 years. Questions on education level reveal that 77% of respondents were illiterate. Though 19% of farmers attended school grades 1 through 12 and church school, only 9% of farmers can read and write. The average family size is 5.01 people per household (Table 3). Follow up meetings with farmers were conducted in 2020. Farmers showed interest in using scientific weather forecast information

3.1. Weather Forecast Information and Main Crops

Ethiopia’s climate is geographically diverse [45] and traditionally classified into five climatic zones based on elevation and temperature [46]. Rim Kebele is located at 2000 m elevation [47]. The Kebele is in a “weina dega”—temperature” zone with a mean annual rainfall of 800–1200 mm [48]. There are four seasons in Ethiopia known as the Kiremt, Belg, Bega, and Tsedey. Kiremt or Summer season is the major rainy season that lasts from June to September [49]. Thus, 72% of Rim Kebele farmers prefer to use weather forecast information for this season and rely on it for their farm activities (Table 4).
There are other factors that farmers consider when deciding what type of crop to plant, besides weather forecast information. Most of the farmers (72%) consider soil and land condition as important, along with the availability of capital (money) (65%) and farm inputs and resources (60%) (Table 5). However, farmers value scientific weather forecast information. Based on our survey, 72% of farmers are interested in being informed by scientific weather forecasts regarding on-farm activities, and 68% think the use of scientific weather forecasts could help improve their crop yield.
Survey analysis shows that farmers use traditional forecasting methods over scientific forecasting for land preparation, choosing crop type and variety, determination of planting date and harvest period (Table 6).
Farmers tend to prefer traditional methods (clouds, wind direction, birds) instead of scientific forecasting (broadcast on the TV, radio, and newspaper). 58% of farmers use wind direction, and 55% use cloud and color of the sky seasonally (1–2 times a year) as traditional forecasting methods. One-third of farmers reported using temperature and humidity. However, fewer farmers use TV and radio for scientific forecasting, and no farmers read the newspaper for information. Hence, TV and newspapers might not be good forecasting dissemination tools in this community. However, the radio can be a useful tool for dissemination since 39% of farmers report listening to the radio for scientific forecast information (Table 7).
Around 70% of farmers reported that they need weather forecast on onset and cessation of the rainfall, hail incidence, and dry spells, whereas around 50% or more of farmers reported using the weather forecast for number of rainy days and wind direction. About 45% of farmers need the forecast on rainfall depth and temperature (Table 8).
Based on our 2019 survey, smallholder farmers have an average of 0.75 ha of land. 1916 ha (81.8%) of the Kebele land is cultivated through rainfed agriculture, and only about 20 ha is irrigated (Table A1). Maize is the dominant crop, followed by finger millet. 89% of farmers grow maize and 11% finger millet. Farmers who irrigate grow cash crops such as cabbage, tomato, sugarcane, onion, and pepper during Bega season (December–January). Farmers allot 31% of land for cash crops. Most farmers (89%) plant during the 9 May–7 June period. Farmers (86%) prefer to use improved seeds over traditional seeds (11%), and 3% of farmers use both types of seed. Most farmers reported that they did not face pest problems (80%), so they did not use pesticides (88%). Farmers till their land 4–6 times a year. During years when there is a shortage of rainfall, farmers plan the crop later (74%), while 71% reported that they plan earlier in a wet year. 59% of farmers report a decrease of pests during surplus rainfall years. Farmers (79%) store grains for later consumption. If there is an early rain, 92% of farmers plant maize while a smaller number of farmers plant finger millet (6%), wheat (1%), and barley (1%) as their first chosen crop. The second crop would be finger millet (75%) and barley (7%).
The survey indicates that more farmers reported that rainfall and crop yield were normal during 2016–2018. More than half of farmers reported rainfall and crop yield were the same as normal during the last three years (Table 9).

3.2. Baseline Condition

A baseline condition is a process of establishing the initial agent’s communication scenario. Based on the calibrated parameters, we set the following variables for the baseline condition. The average survey adoption rate is 32.5 farmers (Table 1).
For this modeling, average adoption rate per season (28 weeks) is set to be 30 farmers, i.e., 30% of farmers adopt the forecast information (Table 10).

3.3. Experiments

The number of model runs for the experiments is an essential measuring benchmark to assess the outcome quality.
We run the model repetitions within a range of 100 to 1000 times. There is a difference between 100–200 model repetitions, but not a significant difference after 200 repeats. (Figure 7). Thus, we chose 200 model repeats for each experiment.

3.3.1. Experiment with Varying Farmers Interaction Distance

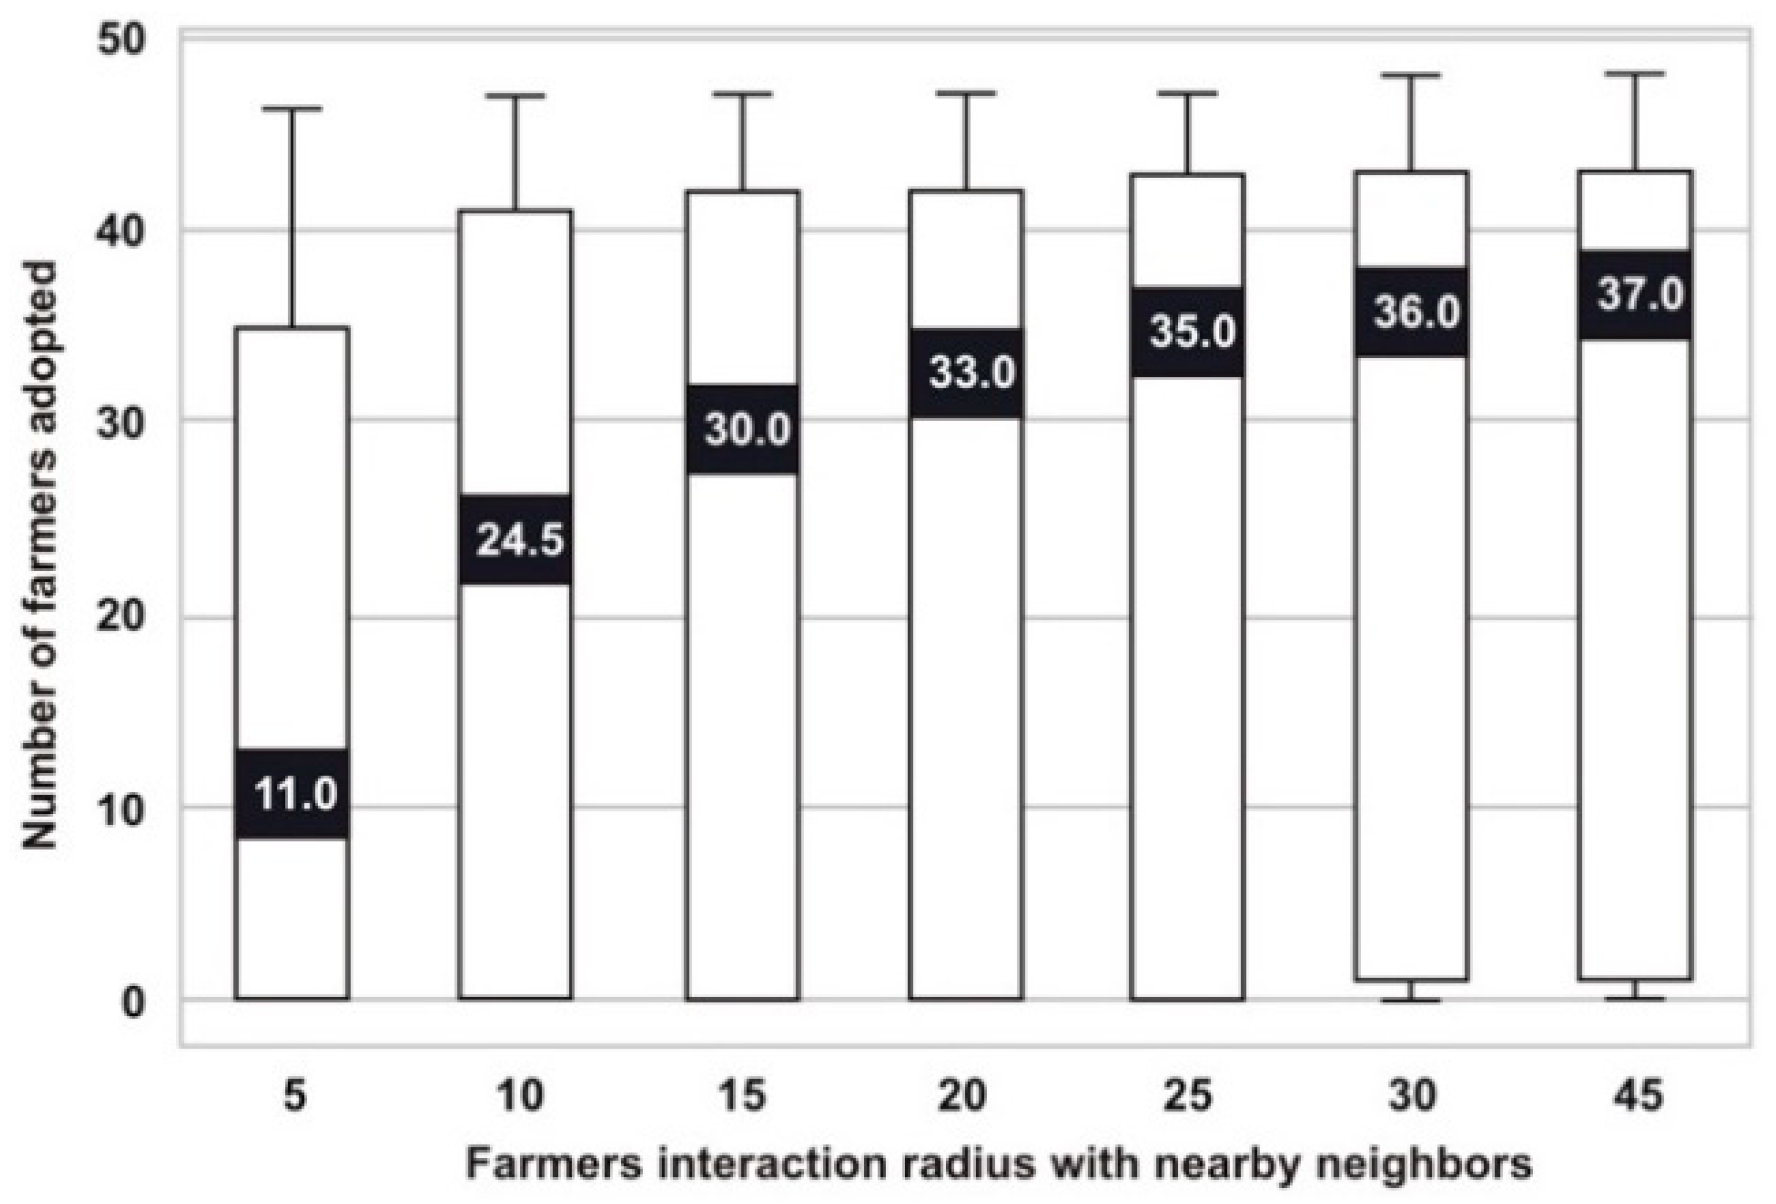
Farmers’ adoption rate increases proportionally as interaction radius distance increases. They interact at a 15 radius distance at the baseline condition, which is about 700 m, with 30 adoption rates. This simulates a village-wise interaction or mono-village interaction. When inter-village interactions are simulated at about 1200 m (25 distance units), adoption rates increased by about 17%. Higher adoption rates are achieved when farmers interact with other farmers from other neighboring villages (Figure 8).
Studies show farmers learn innovations from each other and share their knowledge with one another through intervillage communications [50]. Farmers Field School (FFS) can be organized and facilitates farmers to reach out to other farmers in other villages for the exchange of ideas. Farmers learn from each other become the main actors to bring new innovations to their villages. Farmers’ information exchanges produced good results in village level interactions in China [51]. In Ethiopia, the FFS organization in Amhara region acted as a platform to learn and link smallholder farmers in order to extend new methods among them [52]. These interactions have an impact on agricultural productivity [53,54].

3.3.2. Experiment with Varying Farmers’ Links to Other Farmers

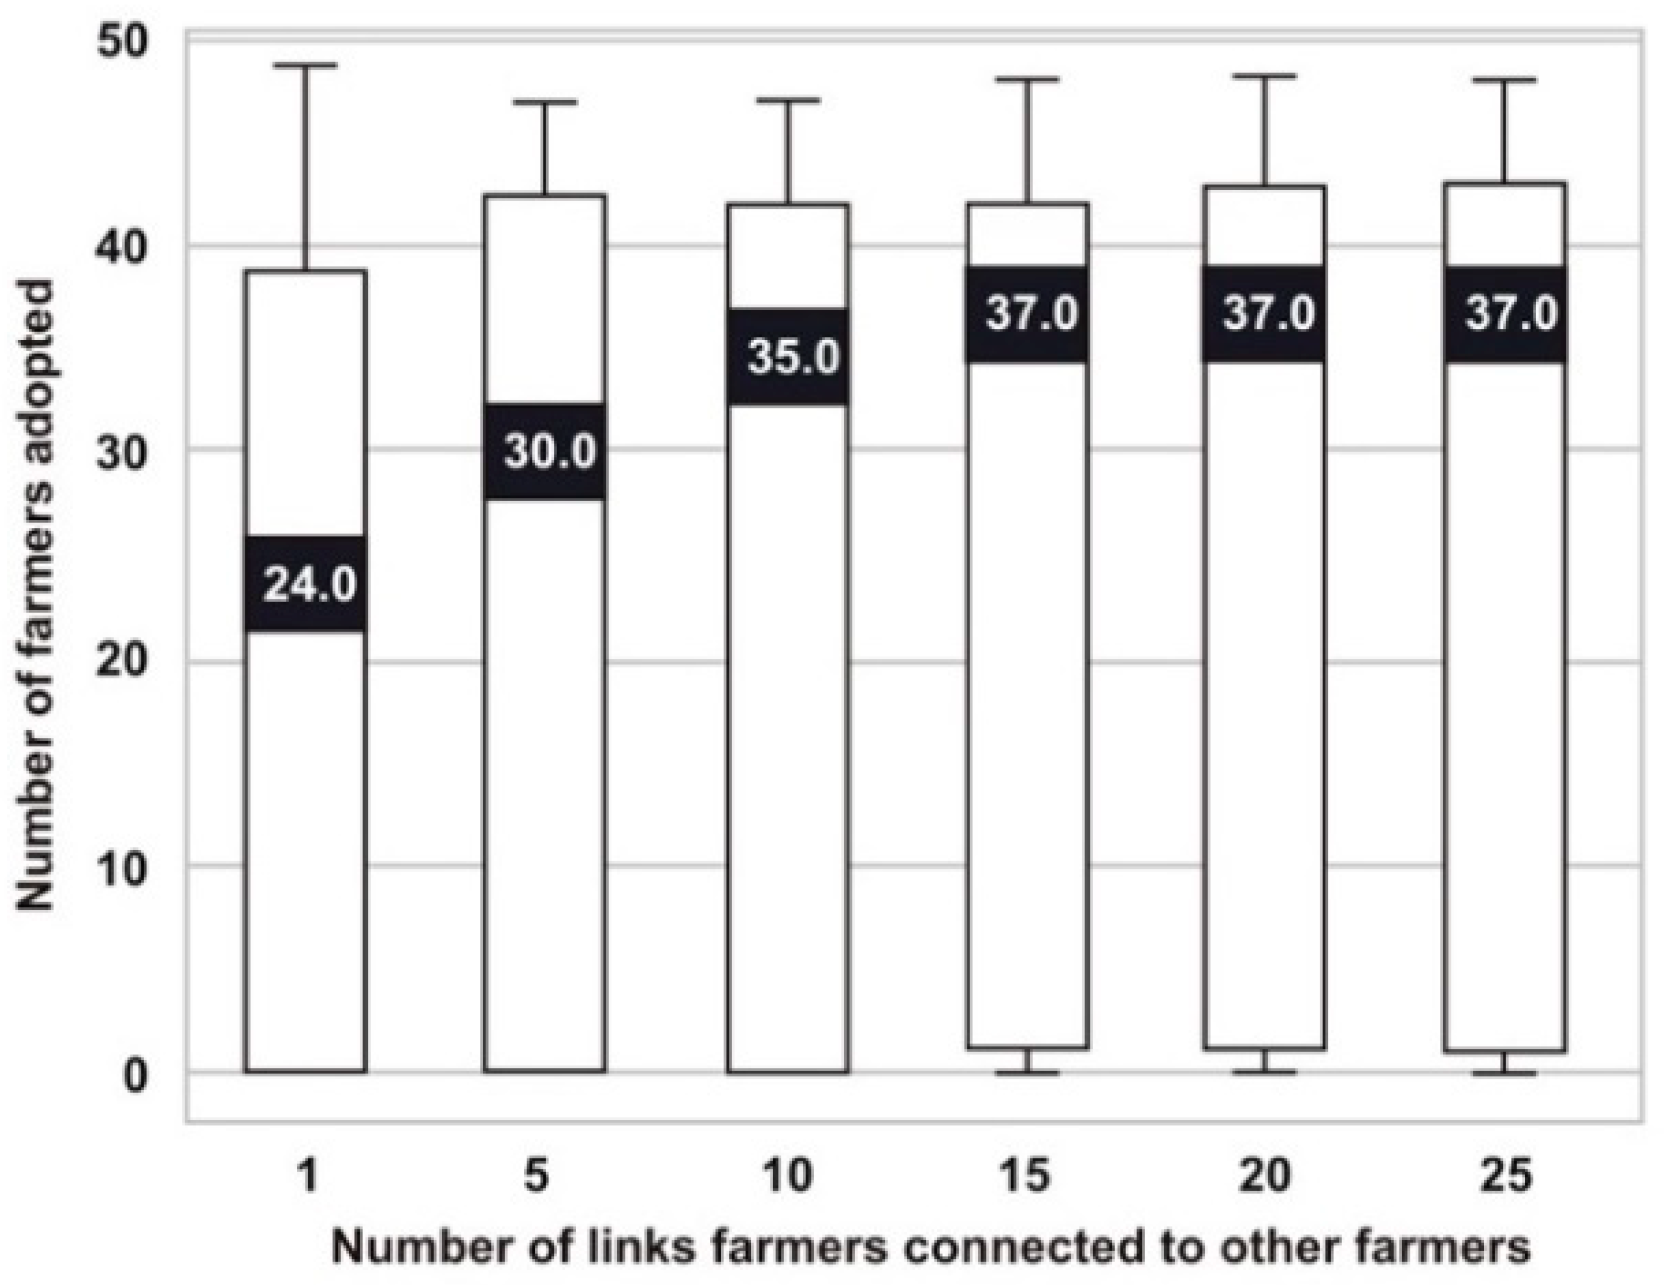
Farmers are connected to at least five other agents in dissemination of information. Having from five connections to 15 connections results in an increase of 23% in adoption. After that, we did not observe an increase in adoption (Figure 9). Thus, higher adoption rates can be achieved by improving network connections by at least twice compared to baseline conditions. Based on the survey, 63% of respondents have a cellphone, improving ICT support information dissemination in the community. This might be related to rural electrification. According to the International Energy Agency, 26% of Ethiopian rural people have electricity in their households. Ethiopia aims for 100% electrification by 2025 with 35% renewable energy [55]. Our study shows that improving this sector would develop weather forecast dissemination in rural areas.

3.3.3. Experiment Varying the Influence of Radio

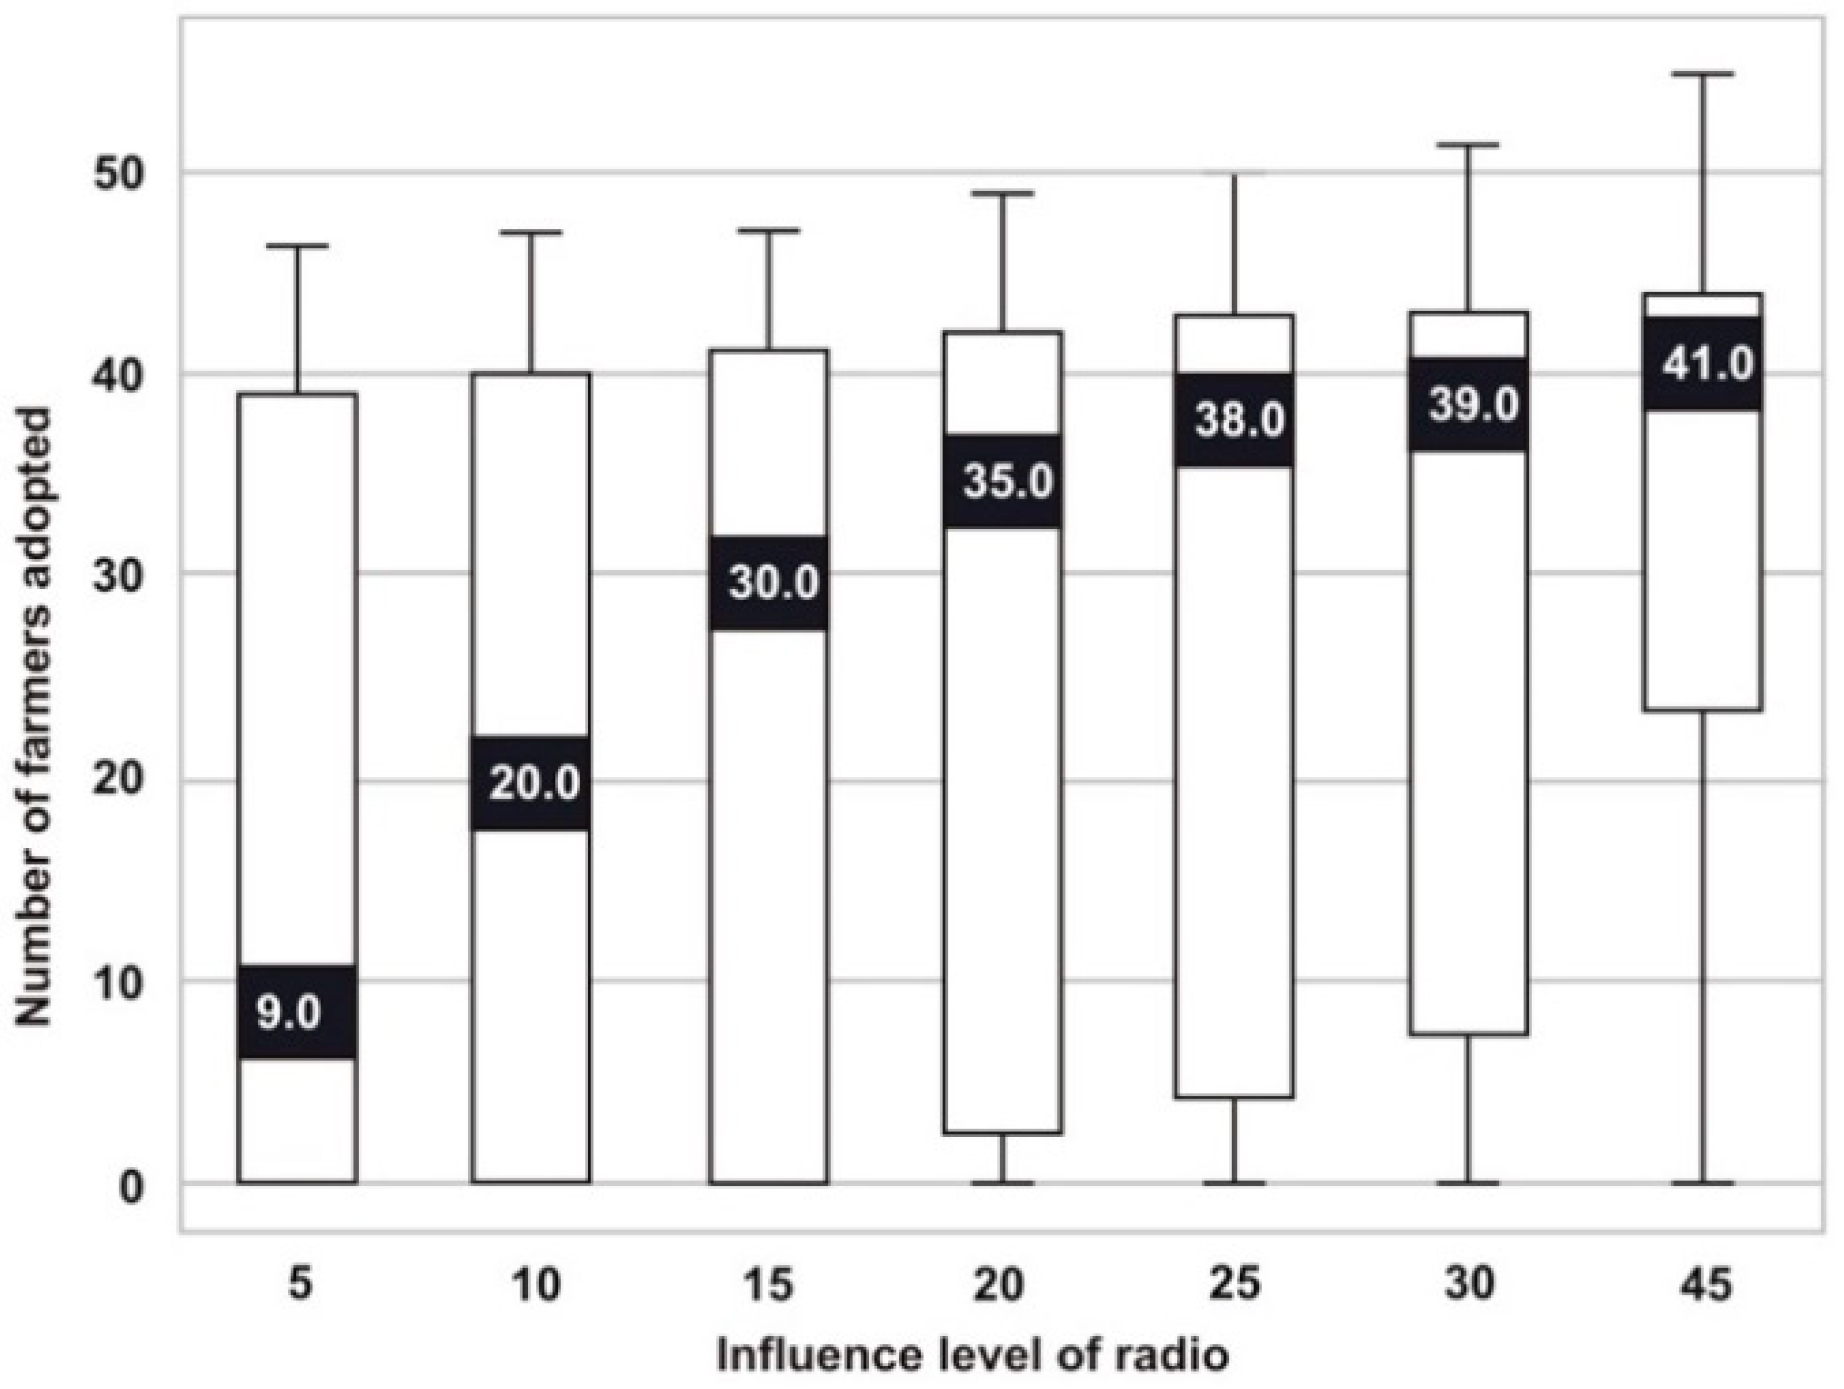
Farmers listen to the radio in Kebele. We found that over 60% radio influence improvement is sufficient to achieve high adoption rates in the community (Figure 10).
There are both local and international radio stations, such as Farm Radio, functioning in the Kebele area. They focus more on teaching crop innovations, but it would also help if they delivered weather forecast information more in Rim Kebele. If mobile phone improves, radio can also be portable via smartphone. Farmers would have access to radio at any location. Improved telecommunication technologies and payment options available for poor people facilitated uptake of mobile phones in developing countries [56]. Rural areas’ mobile users are significantly growing over time in Ethiopia [57]

3.3.4. Experiment with Number of Visits from Agricultural Extension Worker

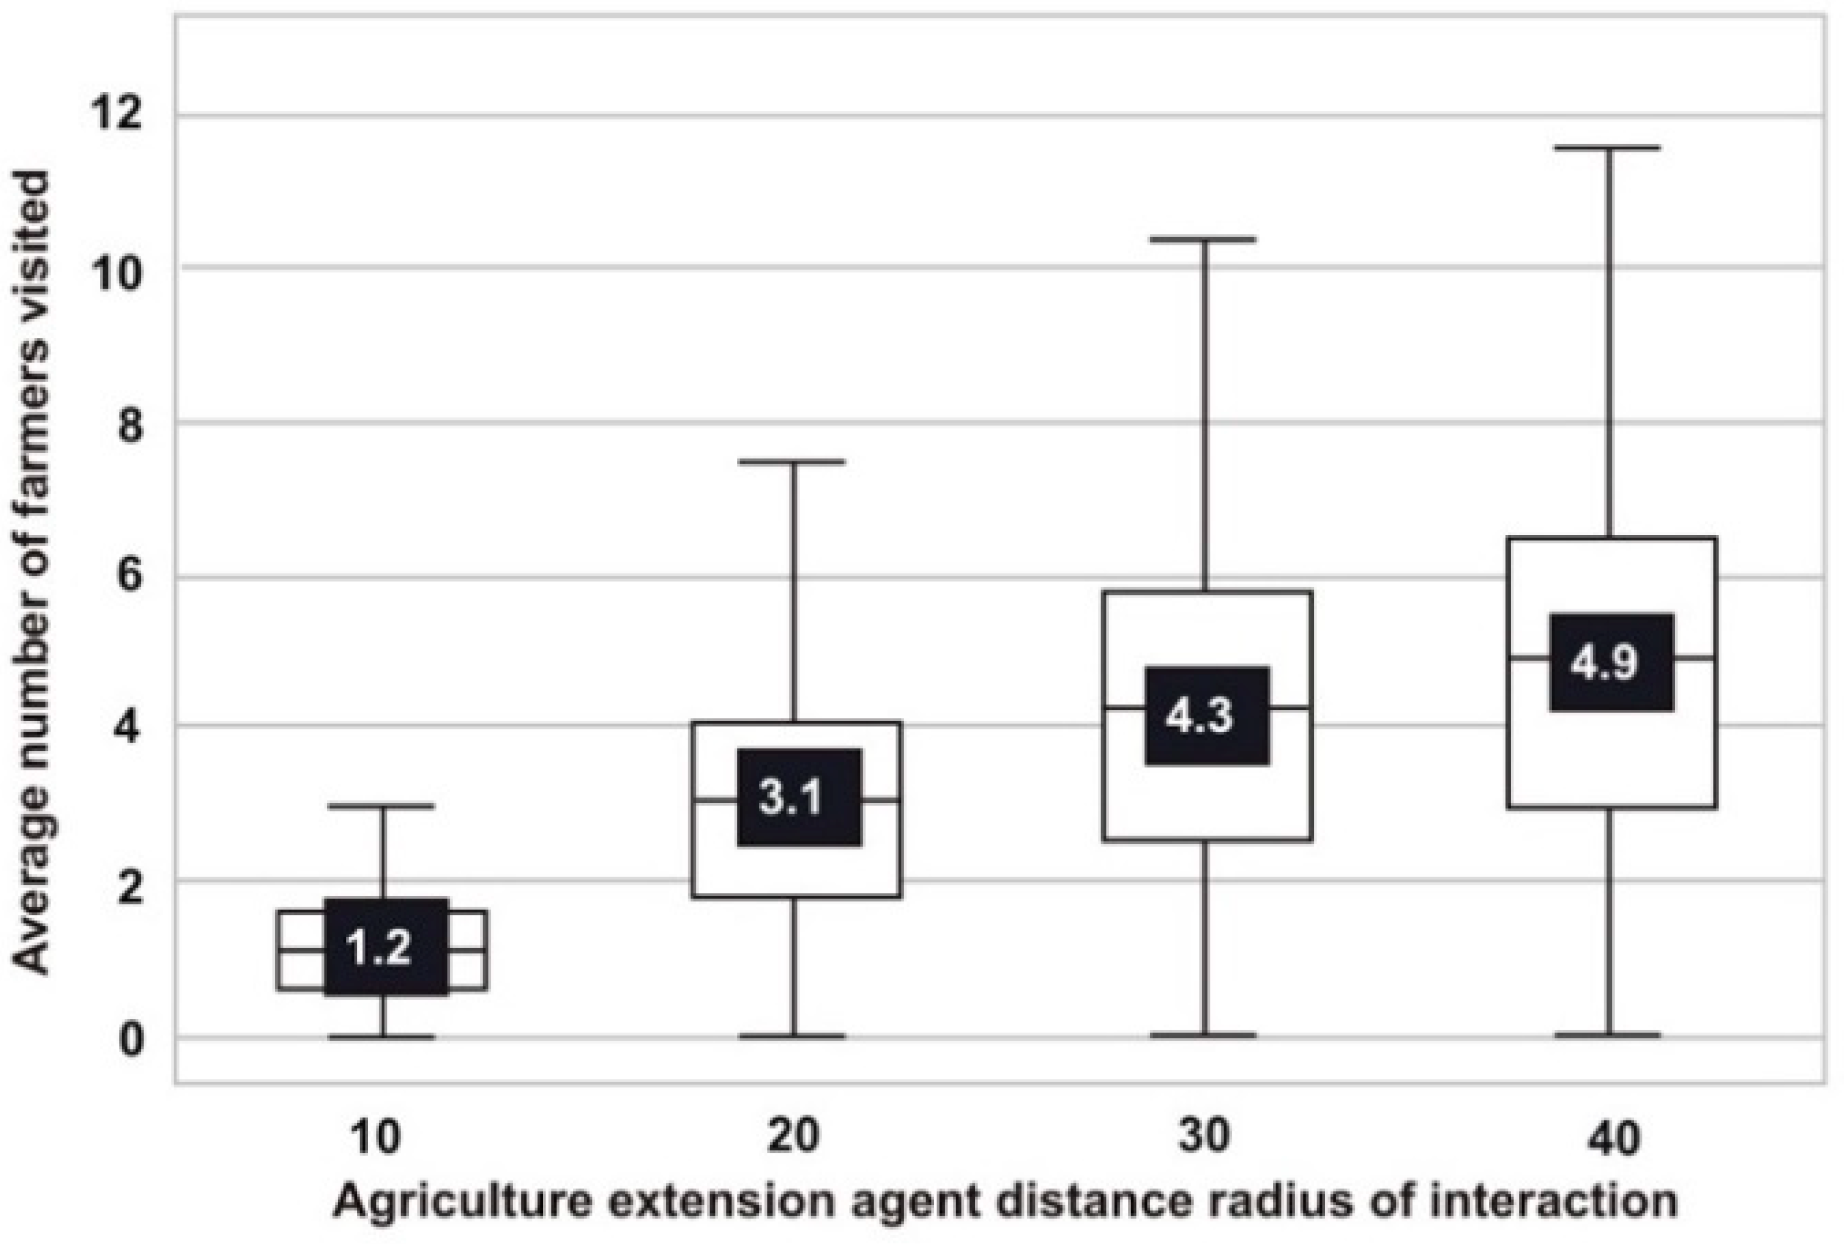
At the baseline condition, the agricultural extension worker interacts with farmers within a radius distance of 900 m. At this distance, a farmer is visited three times at each model step. If an agent increases the interaction distance to 500 m, the average farmer receives about 40% more visits compared to the baseline condition. Model simulation reveals that, as the extension worker’s interaction radius distance expands, the average number of visits also increases (Figure 11). An increase in visits from an extension agent could improve the productivity of farms and reduce poverty. It is reported that at least one extension worker’s visit to the farmer’s field reduces poverty by 10% [58].

3.3.5. Experiment Varying the Extension Workers’ Influence

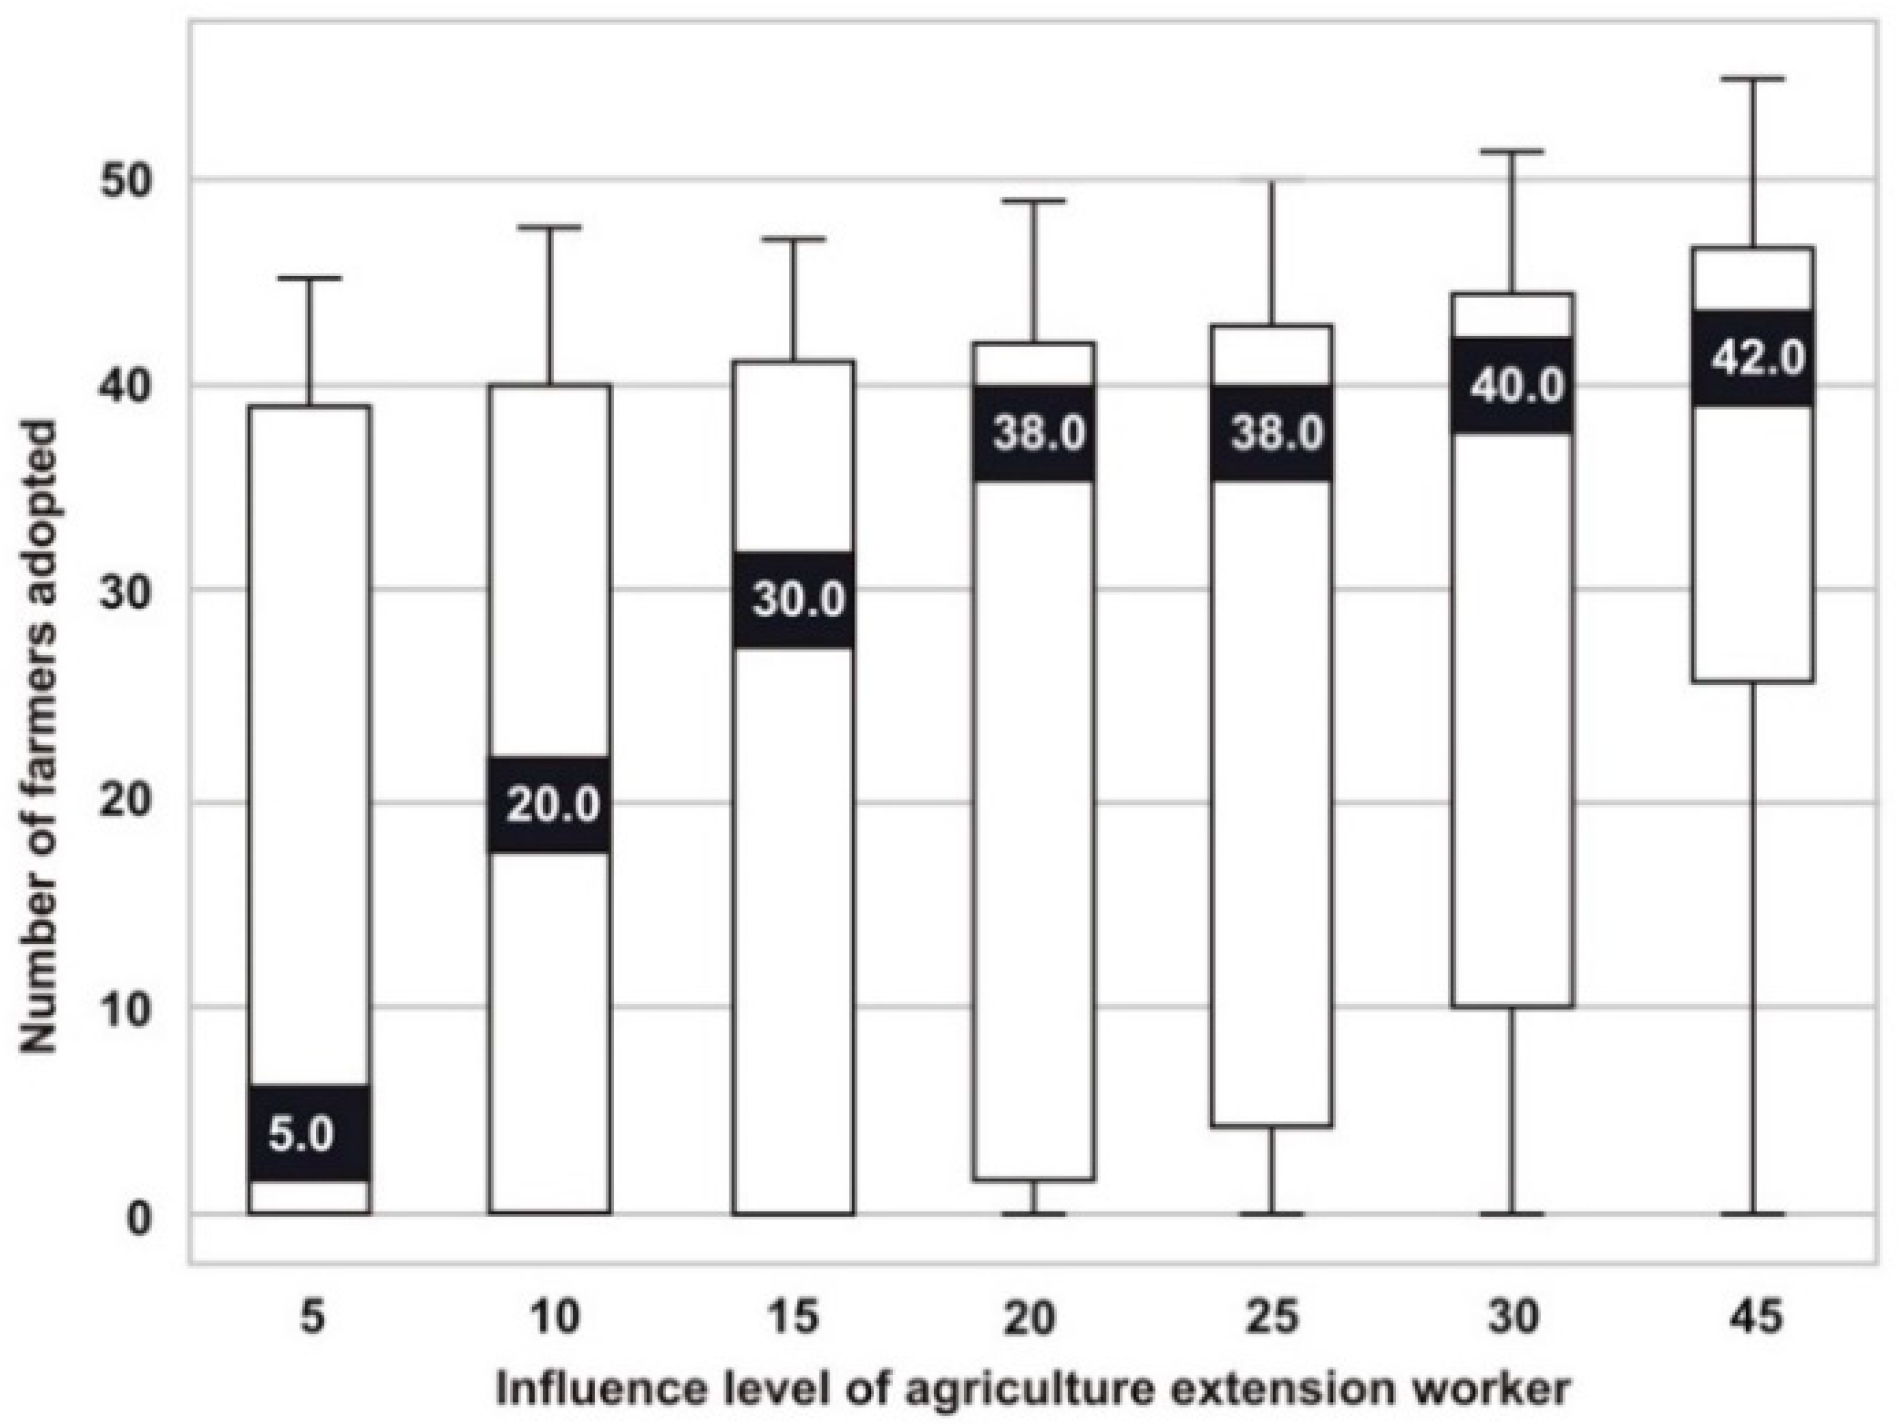
Likewise, in our research area, extension workers have a greater influence on weather forecast information dissemination in the community. Improving the influence level of extension workers to 30% would result in 27% more adoption rates. Double or triple the influence would improve adoption rates per season by 34–40% (Figure 12). There are 1323 households in Rim Kebele (Table A1). Improving the influence of the agricultural extension worker would result in about 530 smallholder farmers adopting scientific weather forecast information. Thus, we found that a 30% influence of agriculture extension worker capacity is enough to reach high adoption rates.
Studies confirm that extension agents generate awareness of new agricultural technologies and better adoption rates by smallholder farmers [59]. Studies have shown a positive correlation between access to information and farmers’ behavior in adopting new practices [60,61]. Thus, the more interaction with an extension agent, the more possibility of adoption and higher productivity.

3.3.6. Experiment Varying Forecast Accuracy

Weather forecast accuracy is an essential factor in adoption rates. In our simulation, forecast accuracy improvement is positively associated with the number of adoptions.
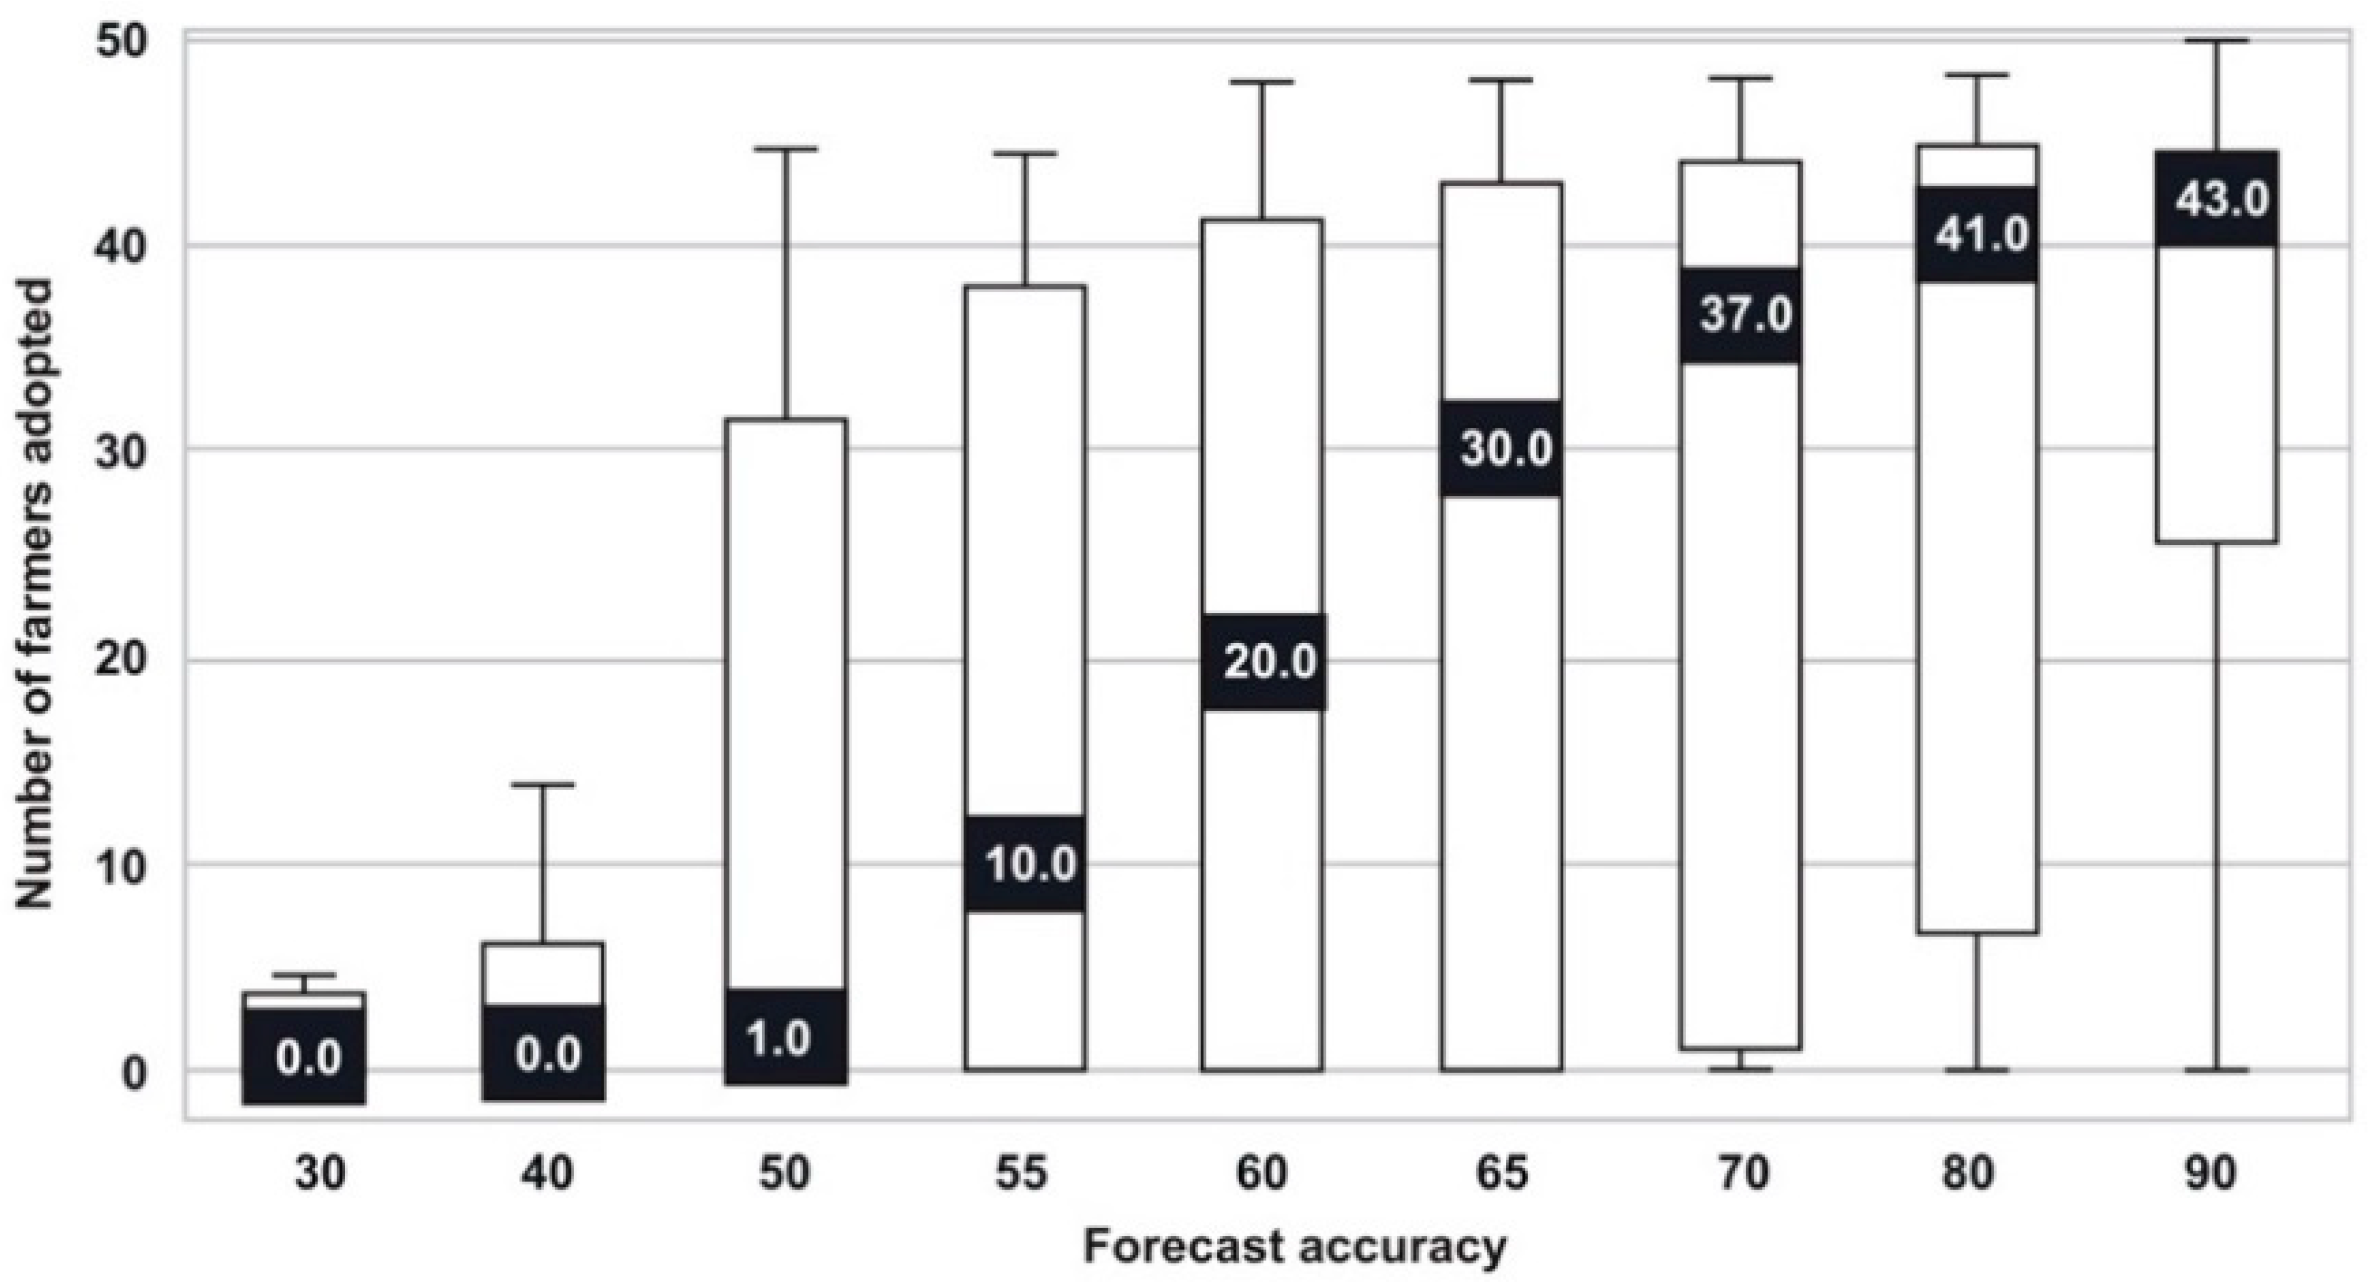
A 5% improvement of weather forecast accuracy (65–70%) shows a 23% bigger adoption rate. A 15% improvement (65–80%) would increase adoption by 37%. However, a 5% reduction (65–60%) would reduce adoption by 33%. A significant drop in adoption rates is observed with less than 55%. This explains that building farmers’ trust in the weather forecast is challenging due to farmers’ unwillingness to risk using failed forecast [25]. Meteorological agencies should monitor forecast accuracy so as not to decline below 60% at any given time (Figure 13). The main finding is that forecast accuracies of 70% are sufficient to achieve high adoption rates.

4. Conclusions

ABM was developed to understand information flow pathways by which weather forecast information might be disseminated among the smallholder farmers in Rim Kebele, Amhara Region. This enables us to identify and rank different pathways as well as optimize weather forecast adoption rates. The household survey helped to build and calibrate the model. Four leading influencers in information communication were identified; nearby farmers, other farmers in the kebele, agricultural extension workers, and radio. Results from this study suggest opportunities for engaging agriculture extension workers who have bigger influences in information dissemination. Their influence can increase adoption rates by more than 40% per season. Latest forecast information and new agricultural innovations can be channeled efficiently to smallholder farmers. Capacity building programs to increase awareness of using extension services appear to be a worthy endowment. Model results also encourage farmers to interact with neighboring village farmers. Agriculture programs to involve kebele level interaction of farmers can help disseminate and learn new practices. Two-thirds of farmers have a cellphone in the kebele. This entails room for improvement in communication technologies. More information adoption can be attained by improved farmers’ networks. Radio has also contributed to positive uptake of information. Forecast accuracy builds farmers’ trust in the community. Results indicate significant improvement in information uptake with a slight improvement in forecast accuracy. However, reduced accuracy would lead to a notable decrease in adoption rates. Our study limitations include the fact that we focused on one Kebele with a sample of 100 households in the Bahirdar area of the Amhara region. We surveyed smallholder farmers in 2019 and developed our model based on this year. Additional years of survey would help examine the tendency and future prospective of use of weather forecast information. Our findings help decision-makers understand the critical information flow pathways and their relative importance by which weather forecasts can be disseminated and shared. This might help regional development programs to identify barriers to the adoption of weather forecast information.

Author Contributions

Conceptualization, J.M. and E.A.; methodology, J.M., S.M., T.W. and E.A.; software, J.M., S.M. and T.W.; validation, J.M., S.M. and T.W., formal analysis,, S.M., investigation, J.M., S.M. and T.W., resources, E.A., and J.M., data curation, J.M. and S.M.; writing-original draft preparation, S.M.; writing-review and editing, J.M., S.M., T.W. and E.A.; visualization, S.M.; supervision J.M. and E.A.; project administration, J.M. and E.A.; funding acquisition, E.A. All authors have read and agreed to the published version of the manuscript.

Funding

This research is based upon work supported by the National Science Foundation under Grant No. 1545874.

Institutional Review Board Statement

The study was conducted according to the guidelines of the Declaration of Helsinki and approved by the Ethics Commission of the Office of Research Compliance of University of Connecticut (protocol code: H15-238, 6 June 2019).

Informed Consent Statement

Not applicable.

Data Availability Statement

The data presented in this study are available on request from the corresponding author.

Acknowledgments

The authors would like to thank all the National Science Foundation Partnership for International Research and Education, PIRE, project researchers and supporting agencies for their continuous support during the completion of this research.

Conflicts of Interest

The authors declare no conflict of interest.

Appendix A

Description of the research area.
Table A1. List and description of villages in Rim Kebele (Mecha Woreda Agriculture Office, 2017).
Name of the Village Estimated Household Size Cultivated Land Out of Total Area (%) Forest Land Out of Total Area (%)Irrigated Land Out of Cultivated Land (%)Irrigation User Households Out of Total Households (%)
1Angut—Adis Alem 4581.54.200
2Angut—Mahal 6576.89.200
3Shafri65814.200
4Wuren—1 6581.84.200
5Wuren—2 6081.8420.0510
6Wuren—36081.84.200
7Cheba—1608140.0510
8Cheba—2 5581400
9Deber Mender—1558140.0510
10Deber Mender—24881400
11Babo Bate—14576.5900
12Babo Bate—2 4577900
13Kuyu 50814.200
14Ko Rim5482400
15Lay Gult 5082400
16Sendi54805115
17Dima 60815115
18Ketema 38721000
Rim Kebele 13231916 ha (81.8%)100 ha (4.2%)20 ha (0.1%)22%

Appendix B

Agent-based model development.
Table A2. Full list of agents and information flow: source, trust, and ‘act upon’.
Agent TypesSourceTrustAct Upon
Yes No NotSomeVeryFullyNeverSeasonMonthWeek
1Neighboring farmers4159593470613270
2Other farmers in the kebele3664643240643321
3Relatives outside of the kebele2278782101782110
4Church Priest9919154091810
5Water Father 1999910099100
6Agriculture extension worker505050241511524071
7Irrigation projects expert1999910099100
8Farmer cooperative member2989820098020
9Radio3466672364672454
10Newspaper0100100000100000
11Television 0100100000100000
Figure A1. Weather information sharing between the agents. In ABM modeling environment farmers interact and share their LTA points with other agents such as neighboring farmers, other farmers in the kebele, agricultural extension workers and radio.
Sustainability 13 04936 g0a1

Appendix B.1. Agents’ Environment and Interaction with the Neighboring Farmer
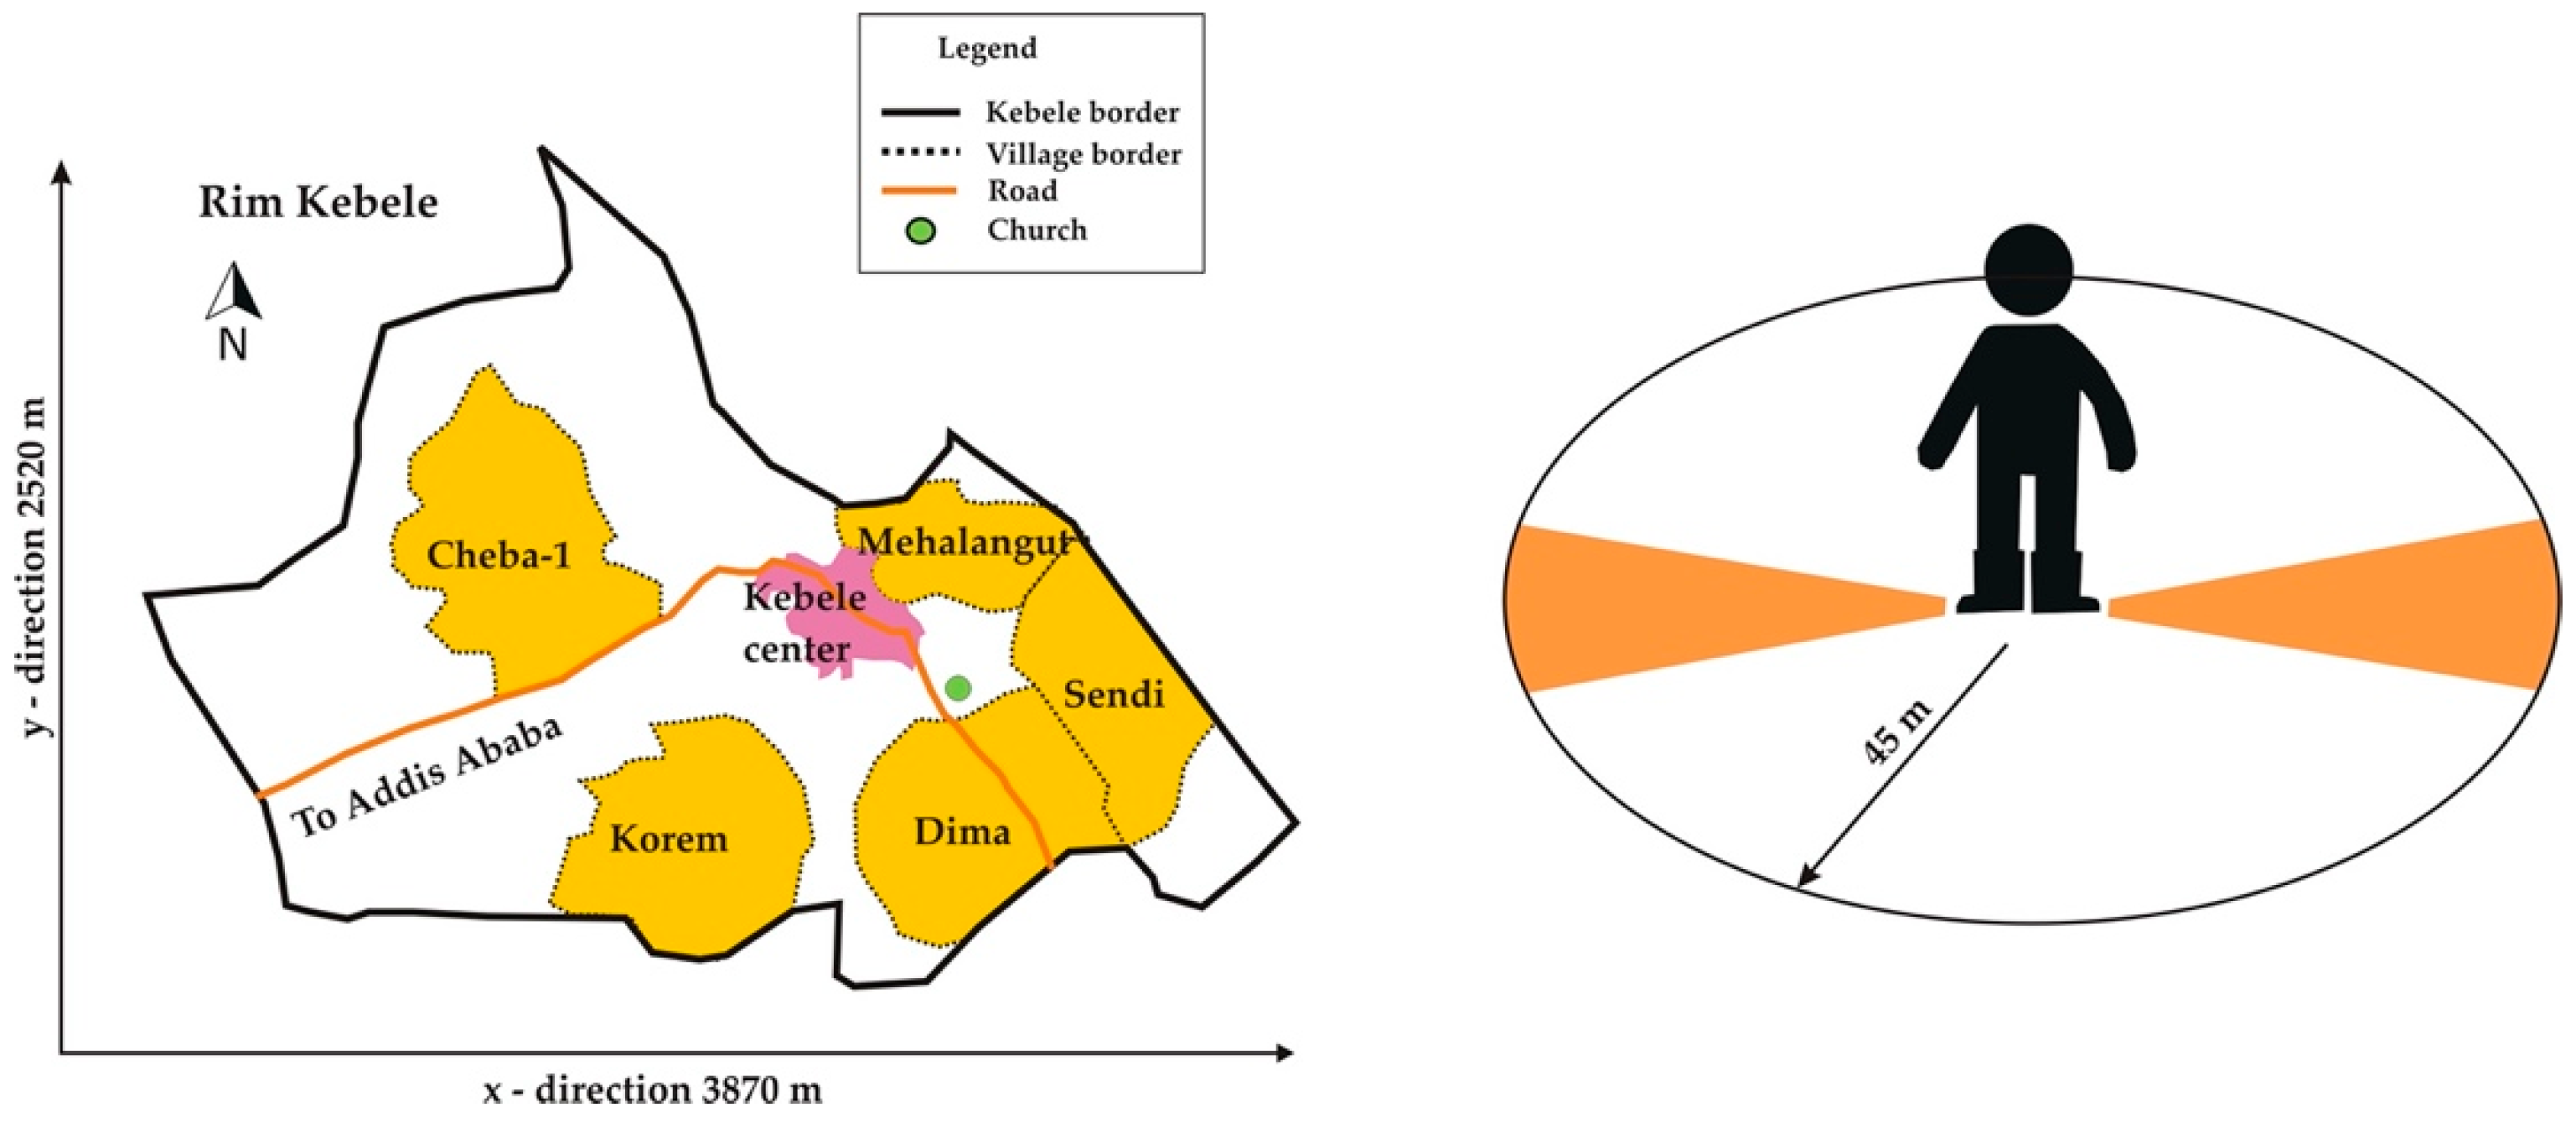
Social networks play an important role in farmers’ learning and adopting new agricultural technologies [62]. Many studies show that farmers get involved in diverse learning processes by experimenting in their own plots before adopting or learning from the performances of neighbors, friends, and relatives [63]. The farmer agent interacts with the neighboring farmers within his/her predetermined distance radius (Figure A2).
Figure A2. Horizontal and vertical distances of the kebele. Unit radius distance of the farmer to interact with other nearby neighbors is 45 m. Farmers interact with other agents based on their interaction radius distance. Distance measurement calculates the distance between the agents and allows the setting of the farmer’s interaction radius distance with other agents.
Sustainability 13 04936 g0a2
If the farmer agent’s interaction distance is small and no other farmers are in his/her range, an agent cannot communicate with other agents and does not gain any LTA points. As agent’s interaction distance radius increases, the agent captures more farmers into his/her communication radius (Figure A3). If the weather forecast is accurate the farmer looks for the closest farmer who has a maximum amount of LTA points and gains that agent’s LTA points based on the trust level. If the weather forecast fails, the farmer loses his/her LTA points based on the trust level.
Figure A3. Farmer agents with smaller and bigger radius of interaction. Farmer agents interact with nearby neighboring farmers within his/her radius of interaction and gains or loses LTA point based on trust levels.
Sustainability 13 04936 g0a3

Appendix B.2. Agents’ Interaction through Networks
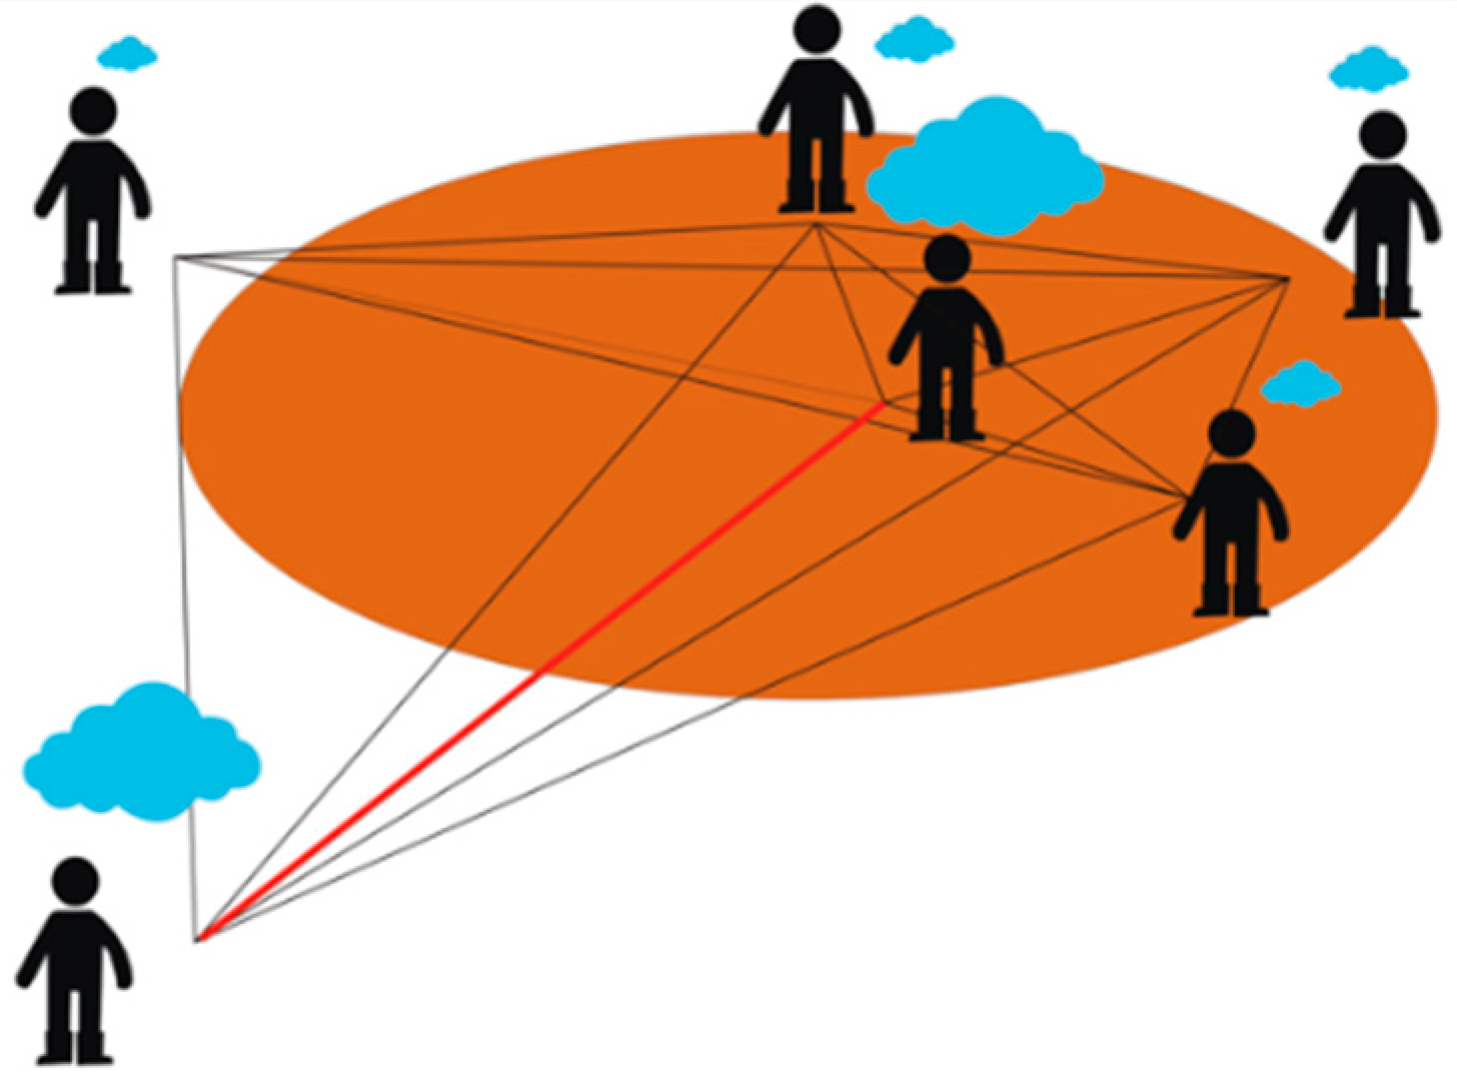
Information and communication technologies’ (ICT) use has been increasing globally [64]. Researchers found ICT-supported dissemination would be most effective in conveying relevant weather information for farmers [65]. In our research in Kebele, 63% of farmers own cell phones. This shows that they can communicate about the weather forecast and share information through phone calls. Our assumption is that farmers call other farmers at a distance for information (Figure A4).
Figure A4. Farmers become connected to other farmers with network links to exchange weather forecast information with other distant farmers. This type of interaction develops farmers’ network system.
Sustainability 13 04936 g0a4
Farmers make a network based on their number of connections to other farmers. We can assess how strongly they are connected by looking at how many links they are connected to. The greater the number of connection links, the greater the number of farmers acquiring LTA points. As discussed in the previous section, farmers gain or lose LTA points based on the forecast accuracy and trust levels.

Appendix B.3. Farmers’ Interaction with an Agricultural Extension Worker

Ethiopia has been training more than 63,000 agricultural extension agents since 2000 [54], with a nationwide ratio of 1:476 of extension agents to farmers, respectively [66]. In contrast, Rim kebele has 1323 households, and four extension agents work in the kebele with a ratio of 1:330. The agriculture extension service is acknowledged to achieve food security and help farmers understand, alleviate and adapt to new climate uncertainties [67,68]. Studies show positive impacts of agricultural extensions on farm productivity [54,69]. Thus, extension workers in communities play an important role in interpreting and conveying weather forecasts to farmers [70]. Our survey results also confirmed extension agents’ important role and that more farmers trust them and act upon the weather information received from agriculture extension workers compared to other agent types in the community (Table 1). Thus, in the ABM modeling environment, the extension worker brings information to the community and spreads it to other farmers (Figure A5). The ABM model can monitor extension agents and farmers’ interaction and estimate the number of visits to each household. We assume this increase of radius of interaction and influence level have an effect on rates of weather forecast information adoption.
Figure A5. Agriculture extension workers brings weather information into the community for efficient dissemination. This improves radius of interaction, influence level and speed. Increasing their radius of interaction, they involve and influence more farmers.
Sustainability 13 04936 g0a5
ABM program, Netlogo 5.3.1, was used to build a virtual Kebele environment where smallholder farm households are located on a geographically referenced platform. This platform is positioned on grids known as “patches” that expand into “x” horizontal (3.87 km) and “y” vertical distances (2.52 km). The area of the kebele is 9.75 km2. The distance is measured in patches, equal to 45 m (Figure A2).
Per modeling characteristics, an agriculture extension agent has a radius distance of interaction, measured in patches (each patch = 45 m) and influence level. The influence level measures the extension worker’s capacity to effectively deliver weather information among the farmers (Figure A5). Extension workers might have higher or lower influence levels regarding weather forecast information on farmers.

Appendix B.4. Influence of Media in Weather Forecast Dissemination

Radio is an important medium to convey weather information to rural households. The Ethiopian National Meteorological Services Agency (NMSA) has been broadcasting weather forecast information through media since 1951. Daily weather forecasts are read by a radio announcer every morning and made in three local languages: Amharic, Ormigna, and Tigrigna [71]. However, ineffective broadcasting was also reported due to the poor relevance of weather forecast contents to farming needs [72,73]. Based on our survey, 34% of Kebele farmers reported listening to the radio for weather information (Table 2). In the modeling environment, we assume farmers listen to the radio to receive information and share it with other agents in the community.

References

  1. Awulachew, S.B.; McCartney, M.; Ibrahim, Y.; Shiferaw, Y.S.; Gichuki, F. Evaluation of water availability and allocation in the Blue Nile basin. In Proceedings of the III and IV Proceedings of the CGIAR Challenge Program on Water and Food 2nd International Forum on Water and Food, Addis Ababa, Ethiopia, 10–14 November 2008; Humphreys, E., Bayot, R.S., Brakel, M., Gichuki, F., Eds.; Central Printing Press: Addis Ababa, Ethiopia, 2008; Volume I. [Google Scholar]
  2. Derib, S.D.; Assefa, T.; Berhanu, B.; Zeleke, G. Impacts of micro-basin water harvesting structures in improving vegetative cover in degraded hillslope areas of north-east Ethiopia. Rangel. J. 2009, 31, 259. [Google Scholar] [CrossRef]
  3. Gissila, T.; Black, E.; Grimes, D.I.F.; Slingo, J.M. Seasonal forecasting of the Ethiopian summer rains. Int. J. Climatol. 2004, 24, 1345–1358. [Google Scholar] [CrossRef]
  4. Ifejika, S. Resilient Adaptation to Climate Change in African Agriculture; Series 54; Deutsches Institut für Entwicklungspolitik gGmbH: Bonn, Germany, 2010; pp. 91–107. Available online: https://www.die-gdi.de/uploads/media/Studies_54.pdf (accessed on 23 May 2020).
  5. Wubie, A.A. Review on the impact of climate change on crop production in Ethiopia. J. Biol. Agric. Healthc. 2015, 5, 103–111. [Google Scholar]
  6. Klopper, E.; Vogel, C.H.; Landman, W.A. Seasonal climate forecasts—Potential agricultural-risk management tools? Clim. Chang. 2006, 76, 73–90. [Google Scholar] [CrossRef]
  7. Skees, J.; Hazell, P.; Miranda, M. New Approaches to Crop Yield Insurance in Developing Countries; IFPRI Discussion Paper 55; IFPRI: Washington, DC, USA, 1999. [Google Scholar]
  8. Roncoli, C. Ethnographic and participatory approaches to research on farmers’ responses to climate predictions. Clim. Res. 2006, 33, 81–99. [Google Scholar] [CrossRef]
  9. Ziervogel, G.; Opere, A. Integrating Meteorological and Indigenous Knowledge-Based Seasonal Climate Forecasts for the Agricultural Sector: Lessons from Participatory Action Research in Sub-Saharan Africa; IDRC: Ottawa, ON, Canada, 2010. [Google Scholar]
  10. Hammer, G.; Nicholls, N.; Mitchell, C. (Eds.) Applications of Seasonal Climate Forecasting in Agricultural and Natural Ecosystems; Atmospheric and Oceanographic Sciences Library; Springer: Dordrecht, The Netherlands, 2000; Volume 21, ISBN 978-90-481-5443-2. [Google Scholar]
  11. Roman, M.; Roman, M.; Prus, P.; Szczepanek, M. Tourism competitiveness of rural areas: Evidence from a region in Poland. Agriculture 2020, 10, 569. [Google Scholar] [CrossRef]
  12. Liu, Y.; Ji, D.; Zhang, L.; An, J.; Sun, W. Rural financial development impacts on agricultural technology innovation: Evidence from China. Int. J. Environ. Res. Public Health 2021, 18, 1110. [Google Scholar] [CrossRef] [PubMed]
  13. Stone, R.C.; Hoedt, G.C. The development and delivery of current seasonal climate forecasting capabilities in Australia. In Applications of Seasonal Climate Forecasting in Agricultural and Natural Ecosystems—The Australian Experience; Hammer, G., Nicholls, N., Mitchell, C., Eds.; Kluwer Academic: Amsterdam, The Netherlands, 2000; pp. 67–75. [Google Scholar]
  14. Gunda, T.; Bazuin, J.; Nay, J.; Yeung, K. Impact of seasonal forecast use on agricultural income in a system with varying crop costs and returns: An empirically-grounded simulation. Environ. Res. Lett. 2017, 12, 034001. [Google Scholar] [CrossRef] [Green Version]
  15. Wood, S.A.; Jina, A.S.; Jain, M.; Kristjanson, P.; DeFries, R.S. Smallholder farmer cropping decisions related to climate variability across multiple regions. Glob. Environ. Chang. 2014, 25, 163–172. [Google Scholar] [CrossRef] [Green Version]
  16. Murphy, A. Forecast verification. In Economic Value of Weather and Climate Forecasts; Katz, R., Murphy, A., Eds.; Cambridge University Press: Cambridge, UK, 1997; pp. 19–74. [Google Scholar]
  17. Murphy, S.J.; Washington, R.; Downing, T.E.; Martin, R.V.; Ziervogel, G.; Preston, A.; Todd, M.; Butterfield, R.; Briden, J. Seasonal forecasting for climate hazards: Prospects and responses. Nat. Hazards 2001, 23, 171–196. [Google Scholar] [CrossRef]
  18. Palmer, T.N.; Anderson, D.L.T. The prospects for seasonal forecasting—A review paper. Q. J. R. Meteorol. Soc. 1994, 120, 755–793. [Google Scholar] [CrossRef]
  19. Luhmann, N. Trust and Power; Wiley: Chichester, UK, 1979. [Google Scholar]
  20. Lagenspetz, O. Legitimacy and trust. Philos. Investig. 1992, 15, 1–21. [Google Scholar] [CrossRef]
  21. Yamamoto, Y. A morality based on trust: Some reflections on Japanese morality. Philos. East West 1990, XL, 451–469. [Google Scholar] [CrossRef]
  22. Deutsch, M. The Resolution of Conflict; Yale University Press: New Haven, CT, USA; London, UK, 1973. [Google Scholar]
  23. Renn, O.; Levine, D. Credibility and trust in risk communication. In Communicating Risks to the Public; Kasperson, R., Stallen, P., Eds.; Springer: Dordrecht, The Netherlands, 1991; pp. 175–217. [Google Scholar]
  24. Broad, K.; Agrawala, S. The Ethiopian food crisis—Uses and limits of climate forecasts. Science 2000, 289, 1693–1964. [Google Scholar] [CrossRef] [PubMed]
  25. Traoré, P.C.S.; Kouressy, M.; Vaksmann, M.; Tabo, R.; Maikano, I.; Traoré, S.B.; Cooper, P. Climate prediction and agriculture: What is different about Sudano-Sahelian West Africa? In Climate Prediction and Agriculture; Sivakumar, M., Hansen, J., Eds.; Springer: Berlin/Heidelberg, Germany, 2007; pp. 189–203. [Google Scholar]
  26. Vincent, K.; Cull, T.; Archer Van Garderen, E.; Conway, D.; Dalin, C.; Deryng, D.; Fallon, A.; Landman, W. Improving Effective Use of Seasonal Forecasts in South Africa; IFPRI: Washington, DC, USA, 2016. [Google Scholar]
  27. Patt, A.; Gwata, C. Effective seasonal climate forecast applications: Examining constraints for subsistence farmers in Zimbabwe. Glob. Environ. Chang. 2002, 12, 185–195. [Google Scholar] [CrossRef]
  28. Ziervogel, G.; Bithell, M.; Washington, R.; Downing, T. Agent-based social simulation: A method for assessing the impact of seasonal climate forecast applications among smallholder farmers. Agric. Syst. 2005, 83, 1–26. [Google Scholar] [CrossRef]
  29. Warnasooriya, A.R. Interview on Jan 19 2016 with the Deputy Director, Forecasting Division. Department of Meteorology. 2016. [Google Scholar]
  30. Stigter, K. (Ed.) Applied Agrometeorology, 1st ed.; Springer: Berlin/Heidelberg, Germany, 2010; ISBN 978-3-540-74697-3. [Google Scholar]
  31. Berri, G.J.; Antico, P.L.; Goddard, L. Evaluation of the climate outlook forums’ seasonal precipitation forecasts of southeast south America during 1998–2002. Int. J. Climatol. 2005, 25, 365–377. [Google Scholar] [CrossRef]
  32. Power, S.; Casey, T.; Folland, C.; Colman, A.; Mehta, V. Inter-decadal modulation of the impact of ENSO on Australia. Clim. Dyn. 1999, 15, 319–324. [Google Scholar] [CrossRef]
  33. Ash, A.; McIntosh, P.; Cullen, B.; Carberry, P.; Smith, M.S. Constraints and opportunities in applying seasonal climate forecasts in agriculture. Aust. J. Agric. Res. 2007, 58, 952. [Google Scholar] [CrossRef]
  34. Ziervogel, G.; Calder, R. Climate variability and rural livelihoods: Assessing the impact of seasonal climate forecasts in Lesotho. Area 2003, 35, 403–417. [Google Scholar] [CrossRef]
  35. Carberry, P.; Hammer, G.L.; Meinke, H.; Bange, M. The potential value of seasonal climate forecasting in managing cropping systems. In Applications of Seasonal Climate Forecasting Agricultural and Natural Ecosystems; Hammer, G., Nicholls, N., Mitchell, C., Eds.; Kluwer: Dordrecht, The Netherlands, 2000; pp. 167–180. [Google Scholar]
  36. Hammer, G.; Holzworth, D.P.; Stone, R. The value of skill in seasonal climate forecasting to wheat crop management in a region with high climatic variability. Aust. J. Agric. Res. 1996, 47, 717. [Google Scholar] [CrossRef]
  37. Niazi, M.; Hussain, A. Agent-based computing from multi-agent systems to agent-based models: A visual survey. Scientometrics 2011, 89, 479–499. [Google Scholar] [CrossRef] [Green Version]
  38. Chattoe, E. Why is building multi-agent models of social systems so difficult? A case study of innovation diffusion. In Proceedings of the XXIV International Conference of Agricultural Economists (IAAE), Mini-Symposium on “Integrating Approaches for Natural Resource Management and Policy Analysis: Bioeconomic Models, Multi-Agent Systems and Cellular Automata”, Berlin, Germany, 13–18 August 2000; pp. 13–19. [Google Scholar]
  39. Barreteau, O.; Bousquet, F.; Attonaty, J.M. Role-playing games for opening the black box of multi-agent systems: Method and lessons of its application to Senegal river valley irrigated systems. J. Artif. Soc. Soc. Simul. 2001, 4, 5. [Google Scholar]
  40. Mellor, J.E.; Smith, J.A.; Learmonth, G.P.; Netshandama, V.O.; Dillingham, R.A. Modeling the complexities of water, hygiene, and health in Limpopo province, south Africa. Environ. Sci. Technol. 2012, 46, 13512–13520. [Google Scholar] [CrossRef] [Green Version]
  41. Adugna, A. Ethiopian Demography and Health. Available online: http://www.ethiodemographyandhealth.org/Amhara.html (accessed on 6 December 2020).
  42. Central Statistical Agency Agricultural Sample Survey 2014/2015 (2007 E.C.) (September–December, 2014). Report on Land Utilization (Private Peasant Holdings, Meher Season). 2015, IV, 331. Available online: https://www.statsethiopia.gov.et/wp-content/uploads/2019/06/Agricultural-Sample-Survey-Land-Utilization-Meher-Season-2015.pdf (accessed on 23 May 2020).
  43. Pfaff, A.; Broad, K.; Glantz, M. Who benefits from climate forecasts? Nature 1999, 397, 645–646. [Google Scholar] [CrossRef]
  44. Marsh, S. Formalizing Trust as a Computational Concept; University of Stirling: Stirling, UK, 1994. [Google Scholar]
  45. Block, P.J. Mitigating the Effects of Hydrologic Variability in Ethiopia: An Assessment of Investments in Agricultural and Transportation Infrastructure, Energy and Hydroclimatic Forecasting; CPWF: Colombo, Sri Lanka, 2008. [Google Scholar]
  46. Berhan, B.; Melesse, A.M.; Seleshi, Y. GIS-Based Hydrological Zones and Soil Geo-Database of Ethiopia. Catena 2013, 104, 21–31. [Google Scholar] [CrossRef]
  47. Goshu, Y.A.; Yitayew, A.E. Malaria knowledge and its associated factors among pregnant women attending antenatal clinic of Adis Zemen hospital, north-western Ethiopia, 2018. PLoS ONE 2019, 14, e0210221. [Google Scholar] [CrossRef] [Green Version]
  48. Seleshi, Y.; Zanke, U. Recent changes in rainfall and rainy days in Ethiopia. Int. J. Climatol. 2004, 24, 973–983. [Google Scholar] [CrossRef]
  49. Van den Berg, H.; Ketelaar, J.W.; Dicke, M.; Fredrix, M. Is the farmer field school still relevant? Case studies from Malawi and Indonesia. NJAS Wageningen J. Life Sci. 2020, 92, 100329. [Google Scholar] [CrossRef]
  50. Cai, J.; Shi, G.; Hu, R. An impact analysis of farmer field school in China. Sustainability 2016, 8, 137. [Google Scholar] [CrossRef] [Green Version]
  51. Van Keulen, R.; Gerrit Holtland, R.W. Farmers ’ field schools in Ethiopia a manual on learning and linking for Smallholders horti. LIFE 2016. Available online: https://snv.org/cms/sites/default/files/explore/download/farmers_field_schools_-_ethiopia.pdf (accessed on 23 May 2020).
  52. Holtland, G. Farm Field Schools to Boost Income and Reduce Use of Harmful Pesticide. Available online: https://snv.org/update/farm-field-schools-boost-income-and-reduce-use-harmful-pesticide (accessed on 23 May 2020).
  53. Davis, K.; Nkonya, E.; Kato, E.; Mekonnen, D.A.; Odendo, M.; Miiro, R.; Nkuba, J. Impact of Farmer Field Schools on Agricultural Productivity and Poverty in East Africa; International Food Policy Research Institute (IFPRI): Washington, DC, USA, 2010; Volume 00992. [Google Scholar]
  54. IEA Ethiopia—Countries & Regions. Available online: https://www.iea.org/countries/ethiopia (accessed on 23 May 2020).
  55. Howard, P.N.; Mazaheri, N. Telecommunications reform, internet use and mobile phone adoption in the developing world. World Dev. 2009, 37, 1159–1169. [Google Scholar] [CrossRef]
  56. Trading Economics. Mobile Cellular Subscriptions in Ethiopia. Available online: https://tradingeconomics.com/ethiopia/mobile-cellular-subscriptions-wb-data.html (accessed on 4 April 2021).
  57. Dercon, S.; Gilligan, D.O.; Hoddinott, J.; Woldehanna, T. The impact of agricultural extension and roads on poverty and consumption growth in fifteen Ethiopian villages. Am. J. Agric. Econ. 2009, 91, 1007–1021. [Google Scholar] [CrossRef] [Green Version]
  58. Dorosh, P.; Thurlow, J. Agriculture and small towns in Africa. Agric. Econ. 2013, 44, 449–459. [Google Scholar] [CrossRef]
  59. Tadesse, B. Simulating strategy options for enhancing HYV-maize technology adoption in Oromia, Ethiopia. In Proceedings of the International Conference on Contemporary Development Issues in Ethiopia, Kalamazoo, MI, USA, 16–18 August 2001. [Google Scholar]
  60. Tura, M.; Aredo, D.; Tsegaye, W.; Rovere, R.; Kassie, G.; Mwangi, W.; Mwabu, G. Adoption and continued use of improved maize seeds: Case study of central Ethiopia. Afr. J. Agric. Res. 2010, 5, 2350–2358. [Google Scholar] [CrossRef]
  61. Thuo, M.; Bell, A.A.; Bravo-Ureta, B.E.; Lachaud, M.A.; Okello, D.K.; Okoko, E.N.; Kidula, N.L.; Deom, C.M.; Puppala, N. Effects of social network factors on information acquisition and adoption of improved groundnut varieties: The case of Uganda and Kenya. Agric. Hum. Values 2014, 31, 339–353. [Google Scholar] [CrossRef]
  62. Monge, M.; Hartwich, F.; Halgin, D. How Change Agents and Social Capital Influence the Adoption of Innovations among Small Farmers: Evidence from Social Networks in Rural Bolivia; IFPRI Discussion Paper 00761; IFPRI: Washington, DC, USA, 2008. [Google Scholar]
  63. Heeks, R. ICT4D 2.0: The next phase of applying ICT for international development. Computer 2008, 41, 26–33. [Google Scholar] [CrossRef]
  64. Tuheirwe-Mukasa, D.; Haveraaen, M.; Sansa-Otim, J.; Kanagwa, B.; Mujuni, G.R. The efficacy of ICT in weather forecast information dissemination: Evidence from farming communities in Mbale and Rakai districts, Uganda. In Climate Change Management: Agriculture and Ecosystem Resilience in Sub Saharan Africa; Bamutaze, Y., Kyamanywa, S., Singh, B., Nabanoga, G., Lal, G., Eds.; Springer: Cham, Switzerland, 2019; pp. 571–593. [Google Scholar]
  65. Kassie, M.; Teklewold, H.; Marenya, P.; Jaleta, M.; Erenstein, O. Production risks and food security under alternative technology choices in Malawi: Application of a multinomial endogenous switching regression. J. Agric. Econ. 2015, 66, 640–659. [Google Scholar] [CrossRef]
  66. Ozor, N.; Nnaji, C. The role of extension in agricultural adaptation to climate change in Enugu State, Nigeria. J. Agric. Ext. Rural Dev. 2011, 3, 42–50. [Google Scholar] [CrossRef]
  67. Sulaiman, R.; Davis, K. The “New Extensionist”: Roles, Strategies, and Capacities to Strengthen Extension and Advisory Services; Global Forum for Rural Advisory Services: Lindau, Switzerland, 2012. [Google Scholar]
  68. Cavatassi, R.; Lipper, L.; Narloch, U. Modern variety adoption and risk management in drought prone areas: Insights from the sorghum farmers of eastern Ethiopia. Agric. Econ. 2011, 42, 279–292. [Google Scholar] [CrossRef]
  69. Gurstein, M. Rural development and food security: A “Community Informatics” based conceptual framework. In Proceedings of the 34th Annual Hawaii International Conference on System Sciences, Maui, HI, USA, 6 January 2001; p. 10. [Google Scholar]
  70. Sear, C.B.; Tadesse, T.; Bettany, B.; Budgen, P.; Copley, V.; Griggs, D. The presentation of weather information via the media in Ethiopia. Meteorol. Appl. 2007, 3, 295–300. [Google Scholar] [CrossRef]
  71. Eakin, H. Smallholder maize production and climatic risk: A case study from Mexico. Clim. Chang. 2000, 45, 19–36. [Google Scholar] [CrossRef]
  72. Phillips, J.; Makaudze, E.; Unganai, L. Current and potential use of climate forecasts for resource-poor farmers in Zimbabwe. In Impacts of El Niño and Climate Variability in Agriculture; Rosenzweig, C., Ed.; American Society of Agronomy: Madison, WI, USA, 2001; pp. 87–100. [Google Scholar]
  73. Roncoli, C.; Ingram, K.; Kirshen, P.; Jost, C. Meteorological meanings: Understandings of seasonal rainfall forecasts by farmers of Burkina Faso. In Weather, Climate and Culture; Strauss, S., Orlove, B., Eds.; Berg: Oxford, UK, 2003; pp. 181–202. [Google Scholar]
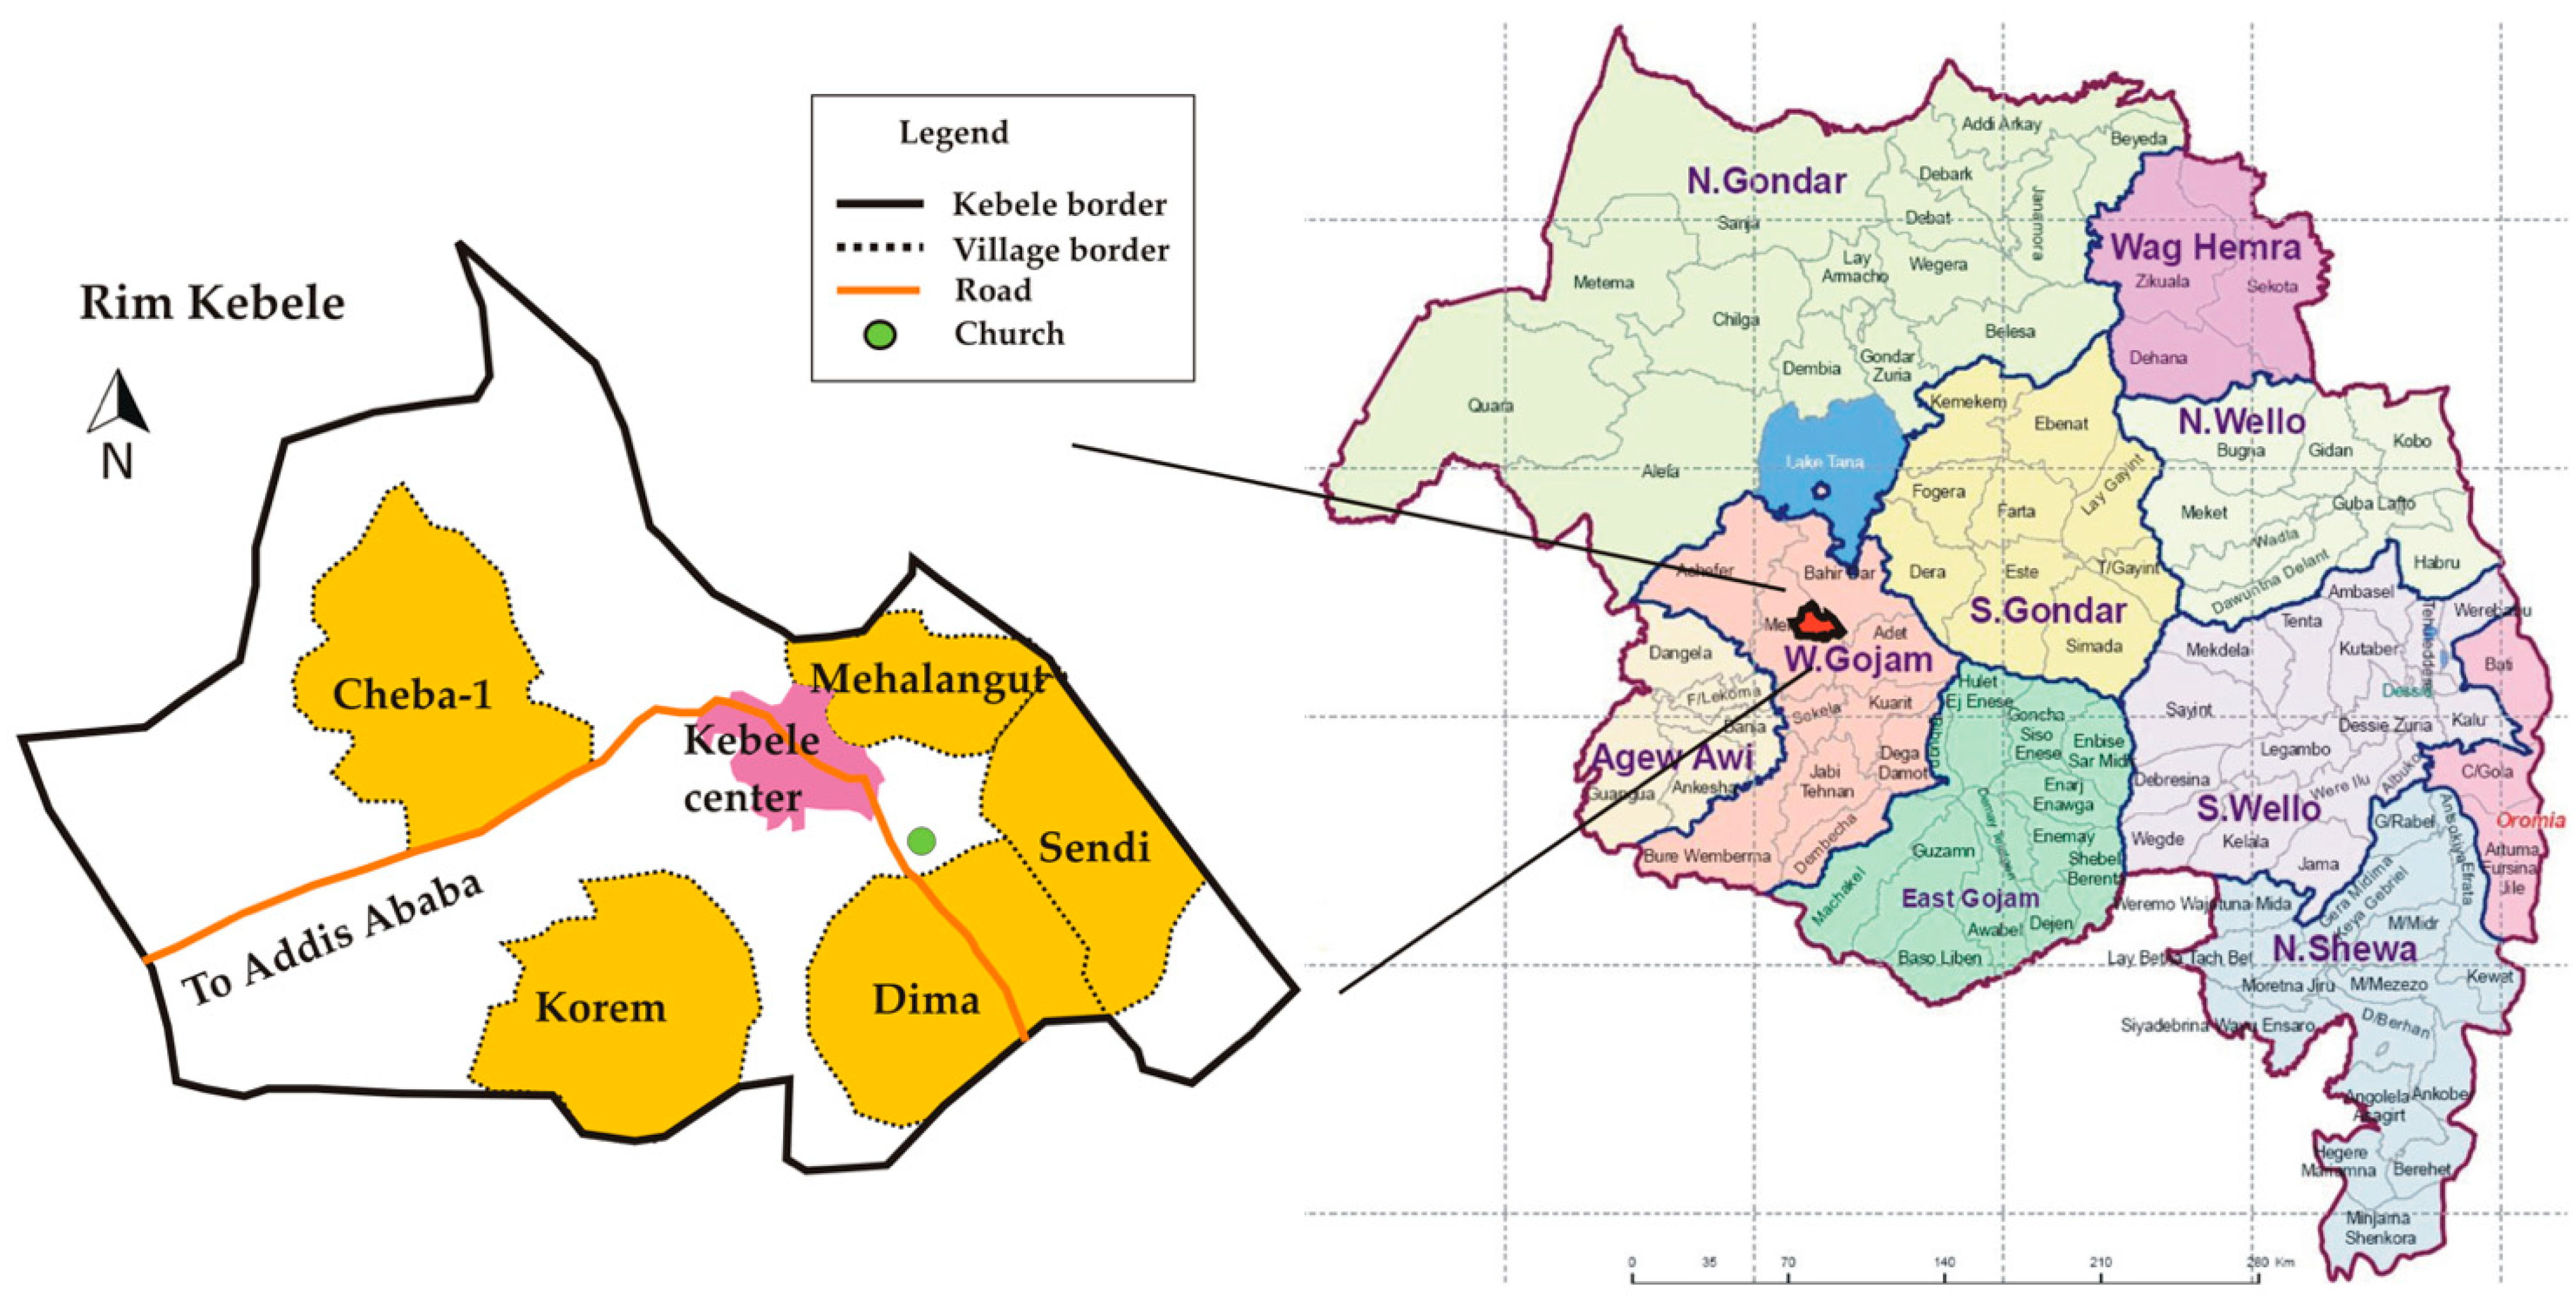
Figure 1. Location map of Rim Kebele in Ethiopia. Rim Kebele is in the West Gojam Zone of Amhara Region. The study was conducted in 5 sampled villages of Rim Kebele.
Sustainability 13 04936 g001
Figure 2. Description of agents’ communication regarding weather forecast information in the community. Farmers interact with nearby farmers within their radius distance of interaction and their links through networking. Agriculture extension workers visit farmers to exchange weather forecast information. Farmers receive daily information from radio.
Sustainability 13 04936 g002
Figure 3. ABM models information flow paths from the source, Sn—neighbors, Sf—other friends in the Kebele, Se—agriculture extension agents and Sm—radio, to agents’ trust levels, Tf—fully trust, Tvm—very much trust and Tsm—somewhat trusts, based on forecast accuracy. Forecast is either true or false. Agriculture extension workers and radio display influence levels and agents gain their LTA points where farmers make decisions at a certain threshold.
Sustainability 13 04936 g003
Figure 4. Farmers’ interactions result in a gain or loss of LTA points. If a farmer has 0 LTA points, he/she does not trust the weather forecast whereas 100 LTA points is the highest point a farmer might gain from agent interactions. As his LTA points increase, his trust level also builds up until the threshold level, at which he/she adopts weather forecast information to act upon for his/her farming activities.
Sustainability 13 04936 g004
Figure 5. Sensitivity analysis of adoption rate.
Sustainability 13 04936 g005
Figure 6. Calibration of agents’ parameters based on monthly (ad) and seasonal (e) survey data.
Sustainability 13 04936 g006
Figure 7. Sensitivity analysis of model run repeats.
Sustainability 13 04936 g007
Figure 8. ABM model experiment with farmers’ interaction radius distance.
Sustainability 13 04936 g008
Figure 9. ABM model experiment with farmer’s connection links to other farmers.
Sustainability 13 04936 g009
Figure 10. ABM model experiment varying the influence of radio.
Sustainability 13 04936 g010
Figure 11. Average number of visits of agricultural extension worker.
Sustainability 13 04936 g011
Figure 12. Experiment varying the agriculture extension worker’s influence.
Sustainability 13 04936 g012
Figure 13. Experiment varying the accuracy of weather forecast.
Sustainability 13 04936 g013
Table 1. Information flow through agent types.
Information Flow Neighboring FarmerOther Farmers Extension WorkerMedia (Radio) Average
Source of information farmers receive from:Yes4136503440.2
No 5964506659.8
Level of trust in weather forecast from: Not at all5964506760.0
somewhat3432242328.2
Very much741568.0
Fully 001143.7
How often agents act-upon the forecast information:Never6164526761.0
Twice a year3233402432.2
Every month72755.2
Once a week01141.5
Table 2. Stratification of trust values.
Value RangeLabel
1.0Complete trust
>0.9Very high trust
0.75–0.9High trust
0.5–0.75High medium trust
0.25–0.5Low medium trust
0–0.25Low trust
−0.25 to 0Low distrust
−0.5 to −0.25Low medium distrust
−0.75 to −0.5High medium distrust
−0.9 to −0.75High distrust
<−0.9Very high distrust
−1Complete distrust
Table 3. Demographic characteristics of Kebele.
Gender of the Household HeadAge of Household HeadEducation Level of
Household Head
Kebele Households OwnHousehold Family Size
Male8520–3019Illiterate77Cellphone63Average 5.01
Female1531–4032Read & write9TV 0
41–5026Grade 1–12 15Electricity 11
51–8129Church school4Radio66
Bicycle 5
Solar lamp72
Table 4. Seasons in which farmers need weather forecast information.
YesNo
Kiremt/Meher season (Jun–Aug)7228
Belg/Autumn season (Sep–Nov)4357
Bega/Winter season (Dec–Feb)3862
Tsedey/Spring season (Mar–May)4456
Table 5. Factors to consider when deciding type of crop to plant.
YesNo
Weather forecast5545
Soil/land condition7228
Capital (money) availability6535
Availability of farm inputs/resources6040
Availability of labor5545
Family consumption needs5644
Table 6. Farm activities in which farmers use traditional and scientific weather forecast information.
TraditionalScientific
YesNoYesNo
Land preparation68322179
Choose what crop type to plant54461981
Choose what crop variety50502179
Determine planting date71291981
Determine harvest period69312872
Pest management49511684
Weed management47531090
Table 7. Farmers forecast methods, sources and frequency of reliance for predicting weather.
Never1–2 Times a YearEvery Month1 Time per WeekDaily
Cloud and color of the sky2155969
Wind direction and level2658529
Temperature and humidity4341529
Indicative birds6731101
TV1000000
Radio6724540
Newspaper1000000
Table 8. Type of forecast information farmers need for farming activities.
YesNo
Starting date of rain 7228
Ending date of rain7129
Number of rainy days5644
Rainfall amounts (mm)4654
Temperature (low/high)4258
Wind direction5743
Hail incidence6634
Dry Spells (days)5941
Table 9. Description of rainfall and crop yield in the three years 2016–2018.
Much WorseWorseSame as NormalBetterMuch Better
2018 (2010/11 E.C)0/03/1758/5325/1814/12
2017 (2009/10 E.C)0/013/1263/6721/213/0
2016 (2008/09 E.C)0/011/1270/7319/150/0
Table 10. List of variables for setting the model baseline condition.
Agent TypeVariableUnit Baseline MeasurementAdoption Rate per 100 Farmers, Seasonal
Number of farmersnumbernumber10030
Neighboring farmerinteraction radius distancepatch, 45 m1530
Other farmerslinksnumber530
Extension workernumbernumber430
Extension workerinteraction radius distancepatch, 45 m2530
Extension workerinfluence level0–1001530
Extension workerspeed0–401030
Radioinfluence level0–1001530
Publisher’s Note: MDPI stays neutral with regard to jurisdictional claims in published maps and institutional affiliations.