Article

Life Cycle Assessment of Protected Strawberry Productions in Central Italy

Department of Agricultural, Food and Environmental Sciences, Università Politecnica delle Marche, 60131 Ancona, Italy
*
Author to whom correspondence should be addressed.
Sustainability 2021, 13(9), 4879; https://doi.org/10.3390/su13094879
Submission received: 5 March 2021 / Revised: 16 April 2021 / Accepted: 22 April 2021 / Published: 27 April 2021
(This article belongs to the Special Issue Agricultural Engineering for Sustainable Agriculture)

Abstract

:
Agricultural activities in Europe cover half of the total area of the continent and are simultaneously a cause of environmental impact and victims of the same impact. Horticultural or fruit crops are considered highly intensive and often employ many crop inputs such as fertilizers, pesticides, and various materials. Strawberry falls into this group, and it has grown in acreage and production more than others globally. The aim of this study is to compare the environmental impact of two strawberry cultivation systems in central Italy, a mulched soil tunnel and a soilless tunnel system. The method used to assess the impact is LCA, widely applied in agriculture and supported by international standards. The data used are mainly primary, related to 2018, and representative of the cultivation systems of central Italy. For impact assessment, the method selected was the CML_IA baseline version. From the results obtained, the two systems show a similar impact per kg of strawberries produced (e.g., for global warming: 0.785 kg CO2 eq for soilless, 0.778 kg CO2 eq for mulched soil tunnel). Reduced differences can be observed for the use of crop inputs (greater for the tunnel) and the use of materials and technology (greater for soilless). The mitigation measures considered concern the replacement of the packaging (excluding plastic) and the growing medium of the soilless using perlite and compost from insect breeding.

1. Introduction

According to the fifth report of IPCC [1], emission of substances deriving from the use of fossil fuels was identified as the leading cause of global warming. In 2019 and 2020, UNEP released the annual Emission Gap Report (EGR) [2,3], which found that greenhouse gas emissions are rising despite the actions taken to protect the climate and despite a purported reduction due to the pandemic caused by COVID 2019. Based on this assumption, UNEP itself launched the Roadmap to a Carbon-Free Future identifying six production sectors that could contribute to the reduction of GHG emissions into the atmosphere [4]. Among these, the agriculture and food sector is the third after energy and industry. The measures indicated for the food sector mainly concern the prevention of food waste as well as the use of sustainable packaging and the purchase of local or 0 km food. The attention paid to the consumption phase of food rather than to its production lies in the relationship between diet, human health, and environmental impact [5] stemmed from the production, distribution, and use of foods. For this reason, there has been a steady increase in preference for both healthy and environmentally less impacting foods by consumers [6] who opt for seasonal and 0 km foods and for correctly recycling their residues in accordance with UNEP indications. In Italy, the effect of increased sensitivity to environmental issues has resulted in the increase of organic farming (from 2010 to 2018 the hectares of surface cultivated with organic methods have increased by more than 75%) [7]. Additionally, in the academic community, several studies have been conducted to assess the environmental sustainability of different cultivation techniques for the same product [8]. Among the many existing crops, fruits and horticultural productions have been highly investigated [9], while taking into account local conditions and differences existing between traditional or organic cultivation methods. Environmental sustainability studies have been conducted on the production of crops such as apples, plums, melons, watermelons [9], mushrooms, and lettuces.
A popular crop that has recorded a significant increase in world production in recent decades is that of strawberry (Fragraria × ananassa), which in 2008 exceeded 4 million tons of annual production with an increase of 24%, compared to the values of the year 2000 [10]. Strawberry is a crop of both economic and health importance [11,12]. According to recent statistics, the strawberry market recorded the highest increase in sales in the agricultural sector (+16%) [13]. Strawberry is mainly consumed fresh, and its beneficial effects on human health are studied mainly due to the high content of antioxidant compounds [14]. Additionally, several environmental studies concerning strawberries have been conducted in major producing countries such as China, the USA, Spain, and Turkey [9,10,15]. In northern Italy and Switzerland, some authors also investigated the existing differences, in terms of environmental sustainability, between the various possible cultivation techniques [16] employed by different companies. The production of strawberries can be carried out in different ways: in open fields, using mulch material, in a greenhouse, on the ground, or soilless. In Sicily alone, soilless production of strawberries is carried out on over 350 total hectares [17]. Each cultivation technique requires similar input such as water, pesticides, any materials for mulching, or for the formation of a suitable substrate that must be used in variable quantities. The assessment of the type and amount of pesticides used during cultivation is critical in many studies since it is necessary to minimize the residues contained in the final product and in the dedicated soil [18]. The goal of pesticides reduction is mainly to offer a safer and more sustainable product.
Horticultural crops have some of the greatest environmental impacts due to the inputs needed for production [19]. There has been a growing interest in the cultivation of strawberries and other highly valued horticultural crops under protective systems such as greenhouses and tunnels mainly due to market demands for off-season agricultural products. Although strawberry is a fruit, it is grown as a horticultural species in tunnels or other similar systems for a period of less than 1 year. The most common cultivation system in Italy for strawberries is the greenhouse system (mulched or soilless) in terms of surface used and harvested production (ISTAT statistical category) [20]. A protected cultivation system is associated with comparably huge profit margins enough to offset the investments made in the construction and maintenance of greenhouses, tunnels, irrigation, and mulching systems, which are normally expensive [8,21]. Over the years, many authors have studied the sustainability of strawberry cultivation and marketing, using different indices and evaluation methods [8,9,15,16]; among these, the most widespread is LCA (life cycle assessment). These studies analyzed the environmental impact of open field or greenhouse cultivation systems in Italy, Switzerland, the USA, Iran, and Turkey. In most studies, the analysis is “from cradle to farm gate” and the impact per kg of strawberries produced varies between 0.2 and 5.8 kgCO2eq. However, there is limited information on the environmental performance of tunnel cultivation systems (mulched and soilless culture systems) for strawberry production. The principal aim of this study is to evaluate, by means of LCA, the environmental burden relative to a soilless strawberry production for central Italy. The analysis considers different commercial packaging systems, with respect to standard tunnel cultivation (control) from cultivation step to packaging phase.

2. Materials and Methods

2.1. Goal of the Study

The primary goal of the study is to assess the environmental impact related to the cultivation and packaging of 1 kg of strawberries comparing two different systems, one with cultivation on mulched soil under tunnel cover bed and the other with soilless tunnel cultivation. The study has been conducted to overcome a lack of information on the environmental impact of these cultivation systems for central Italy. The target audience of the study includes researchers interested in the LCA field and strawberry producers.

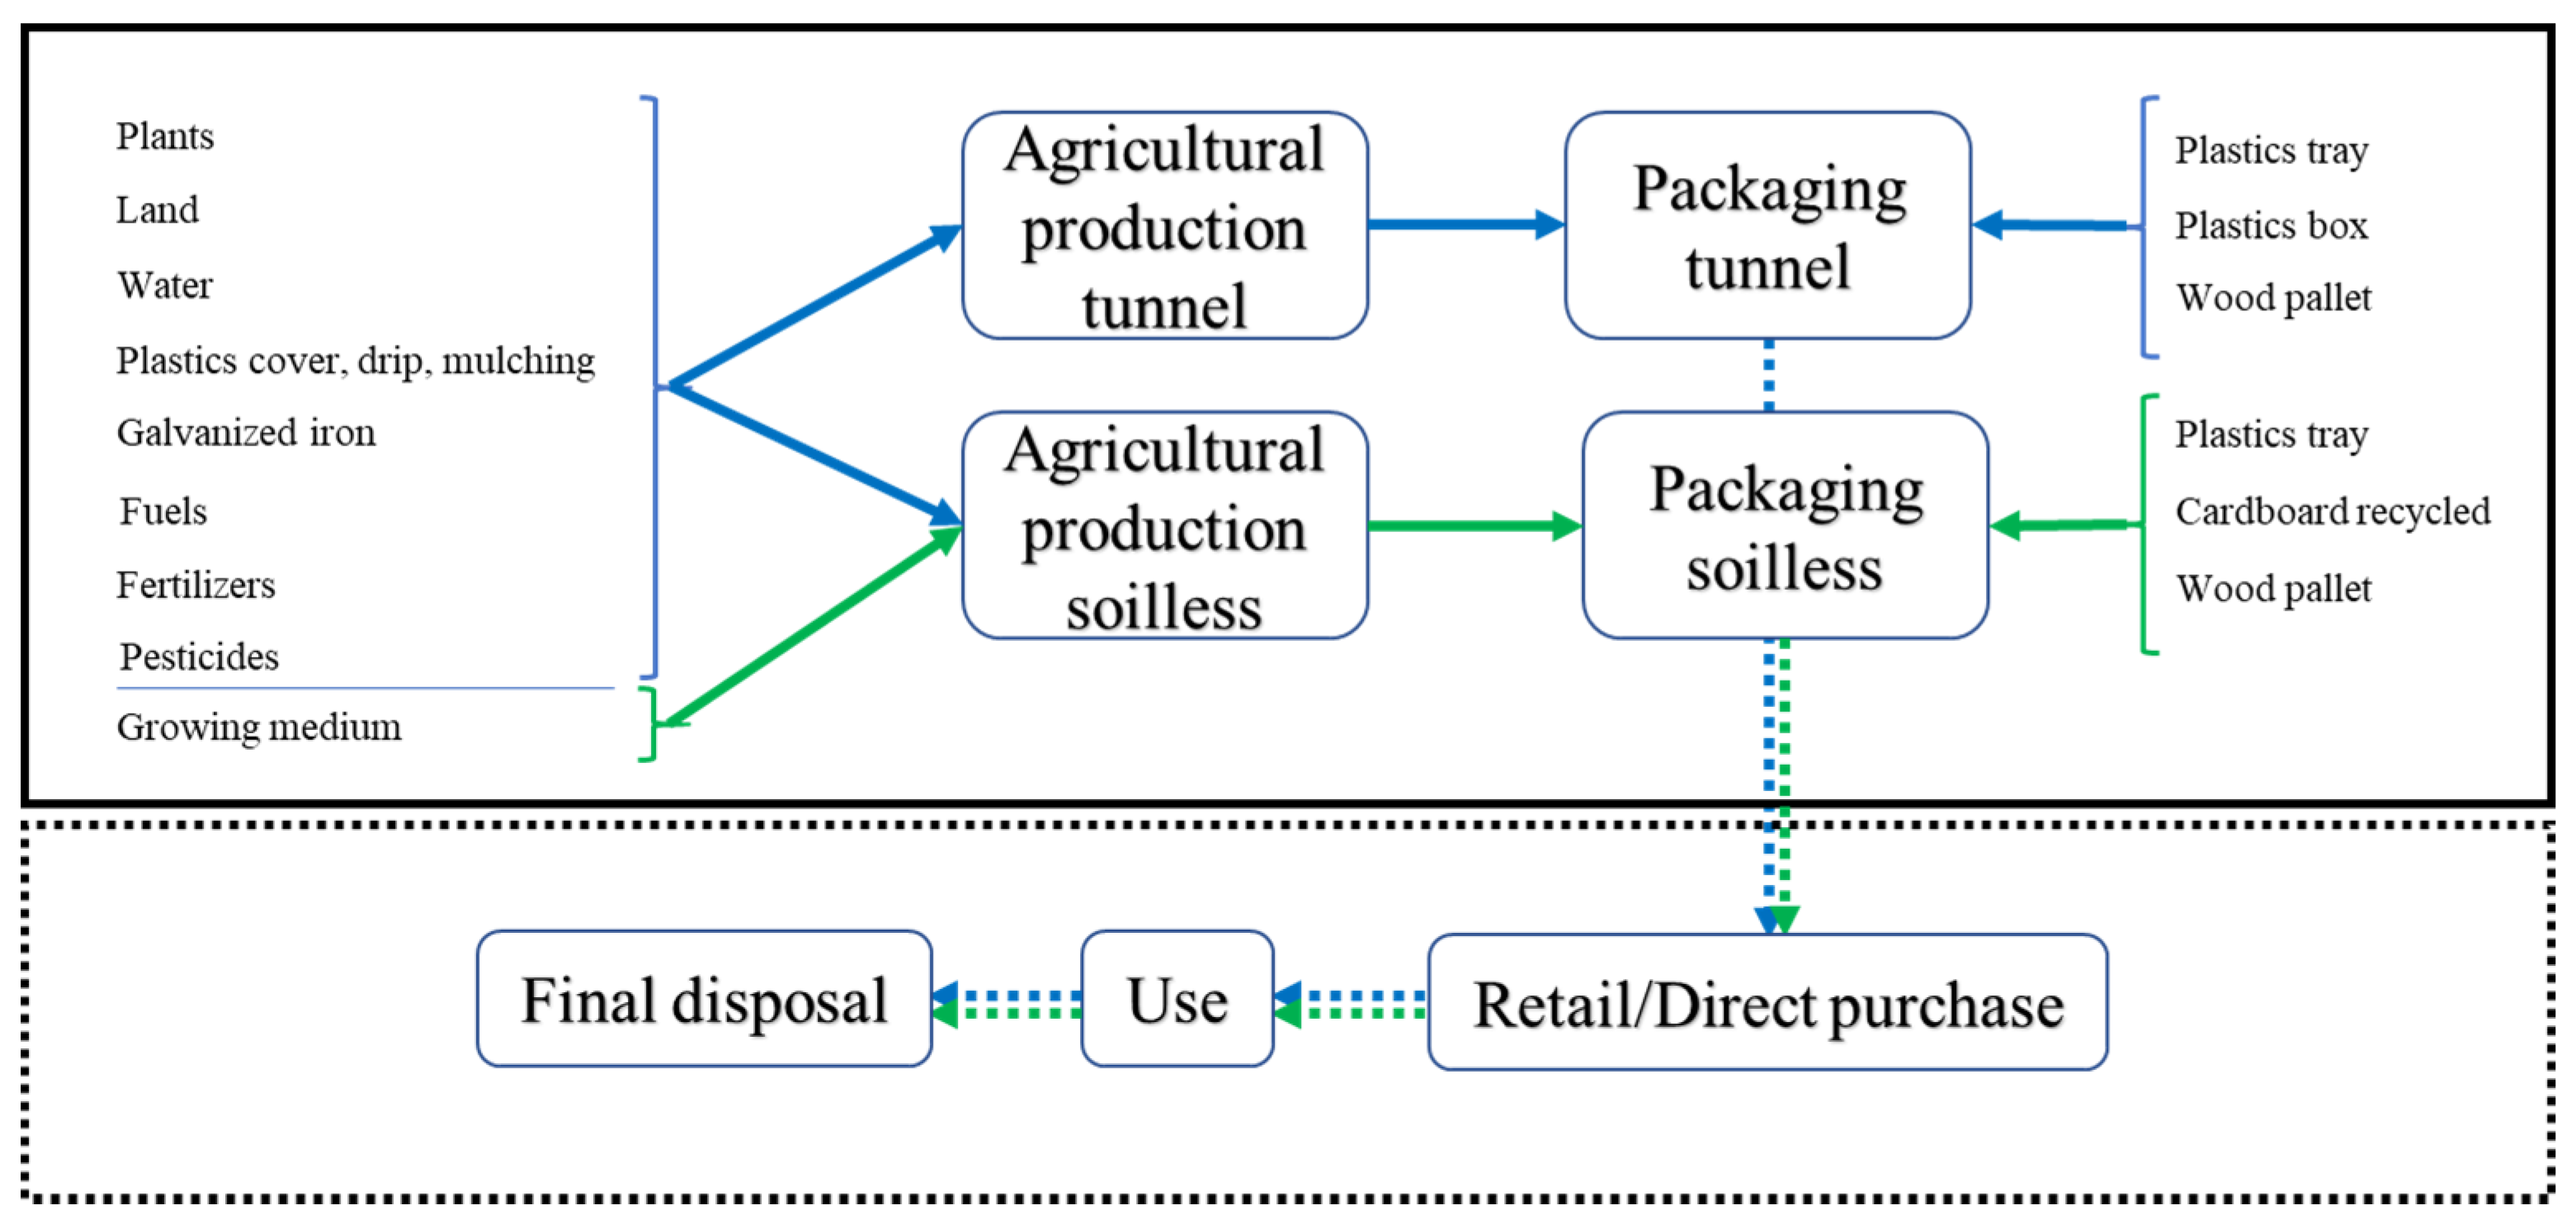
2.2. System Description

The strawberry production under analysis takes place on a farm (Latitude, Longitude 43.063983, 13.723357) located in a small valley (Valdaso) of the hilly territory of Marche region. The climate is a humid subtropical climate (Koppen–Geiger classification: Cfa) typically Mediterranean or sub-Mediterranean (Rivas-Martìnez [22]) with average monthly temperatures that range from 4.4 to 22.7 °C and an average annual rainfall of 800 mm with a concentration in October and November, as shown in Figure 1.
The farm production is based on double cultivation under the tunnel. Although this system is generically considered as greenhouses, in reality, the cultivation is not isolated from the surrounding environment. The tunnels can be opened on all four sides, leaving only the cover to protect the crop in periods with less intense cold temperatures and to favor the recirculation of air in the hottest periods. The crops are therefore partially influenced by the external weather conditions. The temperature affects the development of the crop and the growth of plants. Water affects soil temperature and relative humidity, which could influence the development of some pathogens. The first crop system considered was soil mulched covered with plastic film, and the other was soilless cultivation. The entire farm was made up of tunnels ranging from 40 to 50 m long and 13 to 15 m wide and 2.2 m tall. The mulched soil cultivation (control), shown in Figure 2, was characterized by a medium plant density (60,000 p/ha) planted on raised beds covered with black mulched film. Under the plastic film, a drip irrigation system was installed. The plants were grown on sandy soil with an organic matter content of 0.2%. The total cultivation cycle of the transplanted plants was 11 months and the cultivars employed were Clery, Sibilla, Asia, Tea, Romina, FragolAurea. The total cultivated surface was 750 m2 (50 m long, 15 m wide, 2.2 m tall tunnels).
The soilless cultivation (Figure 3) was characterized by a medium-high plant density (100,000 p/ha) planted on a structure raised above the ground consisting of a tubular bag filled with coconut fiber (40%) and peat (60%). In this production system, fertilizers are distributed, together with irrigation water, to maximize the water and nutrient use efficiency. To provide all plants with an optimal supply of inputs, an excess of water is inevitable, which is recovered and spread to fertilize the near orchard. Additionally, for soilless cultivation, the estimated plant lifespan was 11 months, and the cultivars planted were the same. The total cultivated surface was 520 m2 (40 m long, 13 m wide, and 2.2 m tall tunnels).
The system boundaries selected is from cradle to farm gate and includes the first two production steps: cultivation and packaging, as reported in Figure 4. Time boundaries include all data relative to the 2018 cultivation step, starting from summer 2018 and ending in late spring 2019. The technology employed can be considered average and best available with regard to the mulched soil tunnel scenario and the soilless tunnel scenario, respectively. Mulched soil tunnel cultivation could be considered as intermediate between open field cultivation and more modern soilless cultivation in terms of the technology employed.
The reference year of the reported data is 2018. Information gathered includes total surface, plant density, amount and type of irrigation system used, amount and type of tunnel cover and structure, growing medium, fertilizers, and pesticides. A detailed list of materials and input is reported in Table 1a,b.
The different packaging systems used for mulched soil tunnel production and soilless tunnel production are due to marketing reasons. For mulched soil tunnel production, the plastic crates are used mainly due to their ability to protect the strawberries from mechanical damages during long-distance transport while allowing for stacking (typical of large-scale organized distribution). For soilless tunnel production, the cardboard used is suitable for short-distance travel, which does not require stacking (typically used for the local market).

2.3. System Function, Functional Unit, and Reference Flow

As stated by the ISO standard [23,24], system function and functional unit are defined at the same time. The functional unit (FU) represents the quantification of the performance of the system under analysis, while the system function is the same as the performance of the system (described in qualitative terms). For the specific case study, the system function is to produce fresh strawberries. The FU selected is 1 kg of fresh strawberry, not considering the packaging weight both for soilless tunnel and mulched soil tunnel production (packaging is, however, included as a calculated impact on the FU). The reference flow for soilless production is 75,000 kg/ha·y of strawberries, for tunnel production is 48,000 kg/ha·y.

2.4. Calculations, Allocation, and Emission Models

The data reported in the inventory table are primary; they were collected with interviews and consultation of the official company databases. The data relative to the amounts of input or agricultural production and packaging are foreground data. Information relative to input production processes were taken from LCA databases (Ecoinvent v.3.01 and Agri-footprint (v. 2.0) for agricultural input production and US LCI only for iron production) and are background data. The foreground system includes strawberry production and packaging, and the background system includes, for example, the production of plants, fertilizers, pesticides, capital goods. In addition to the usual normalization on the FU, some data have undergone further calculations, which are reported in detail below.
Regarding tunnel structure, galvanized iron has an estimated lifespan of 10 years; therefore, the value considered in this study is the amount relative to 1 year (total amount divided by lifespan), as indicated by the farmer. The same calculation was made for the transparent tunnel covering sheet, which has a lifespan of 3 years. A similar calculation was made also for the EPAL pallet, as indicated by the Conai Rilegno service in Italy. Rilegno is a nonprofit consortium body under the supervision of two Italian ministries that operates within the Italian national packaging consortium (CONAI) in the national collection and management of wooden packaging. The average reuse of EPAL pallets officially indicated by Rilegno is about 55%; for this reason, the amount considered in the inventory is 45%, corresponding to the new pallets produced to substitute the unserviceable pallets [25].
Regarding allocation procedures, due to the production system which concerns only one product, it was not necessary to adopt any type of allocation.
Emissions calculated relate to the application of pesticides and fertilizers. About pesticides, the emission model selected is based on Boulard et al., 2011 and Anton et al., 2004 [26,27]. The greenhouse pesticide emission pattern considers 95% of the active ingredient as released on the ground and on the crop, and 5% released on water. For fertilizer application, two different models were considered. For soilless tunnel fertilizer application, the emission model used was proposed by Boulard et al., 2011 [26] and based on Sedilot et al., 2002 [28], which consider 31% of nitrates and 48% of potassium as leached. For mulched soil tunnel cultivation, the emission model used for the study considered total N losses (nitrates) equal to 28% of N inputs [29].

2.5. LCIA Method and Software
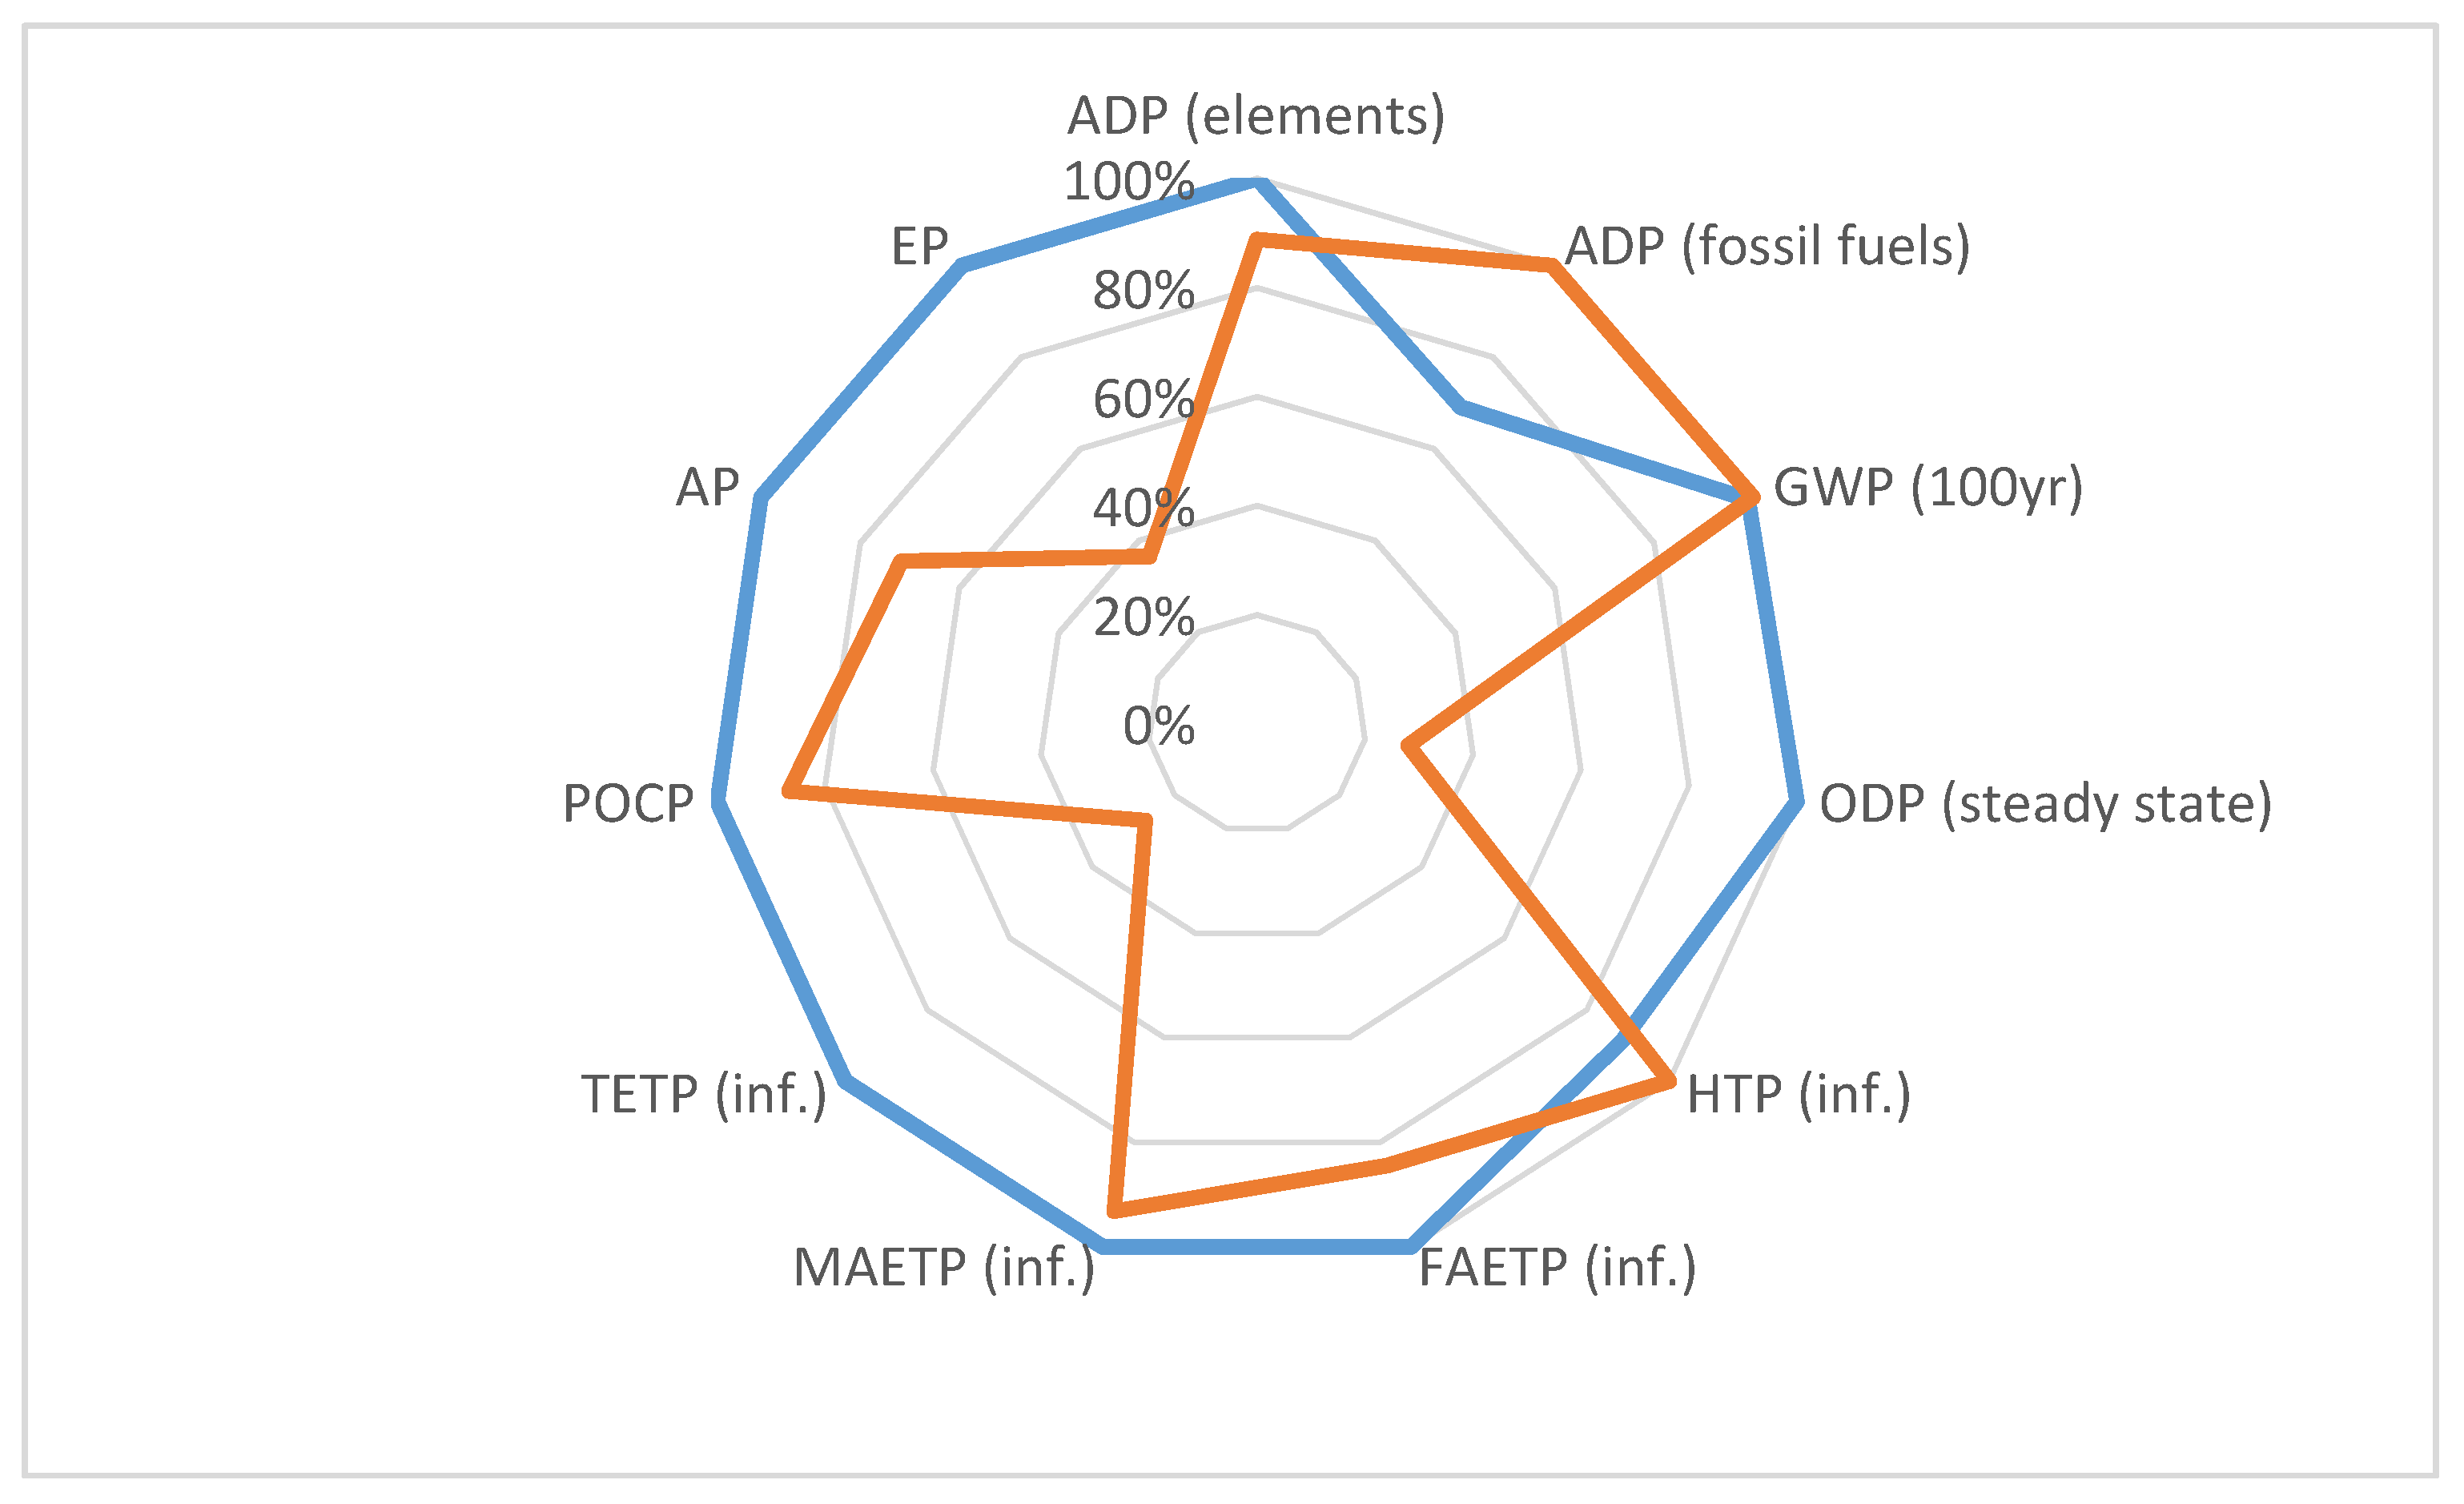
The impact assessment method selected was the CML_IA baseline version [30] because it is one of the most used in the fruit sector [31]. The impact categories included with a midpoint approach were abiotic depletion potential (ADP) elements [32], ADP fossil fuels [32], global warming potential (GWP) 100 [33], ozone layer depletion potential (ODP) steady state [34], human toxicity potential (HTP) inf., fresh water aquatic ecotoxicity potential (FAETP) inf., marine aquatic ecotoxicity potential (MAETP) inf., terrestrial ecotoxicity potential (TETP) inf. [35], photochemical oxidation potential (POCP) [36,37], acidification potential (AP), and eutrophication potential (EP) [38]. All the considered indices use as measurement unit the quantity of an equivalent reference substance (e.g., in the case of the GWP category it corresponds to the kg of equivalent carbon dioxide—kg CO2 eq) The software application used for LCI, LCIA, and partially for interpretation is SimaPro® v. 8.1 with an updated useful database such as Ecoinvent (v.3.01) and Agri-footprint (v. 2.0) for agricultural processes and US LCI for industrial processes. US LCI was selected because of the unavailability of detailed information on iron production in Europe.

3. Results

The total impact related to the FU selected for packaged strawberry is reported in Table 2 and as a relative comparison in Figure 5. Soilless production shows a higher impact for ADP elements, ODP, FAETP, MAETP, TETP, POCP, AP, and EP and slightly higher for GWP 100yr. Tunnel production shows a higher impact only for ADP fossil fuels and HTP.

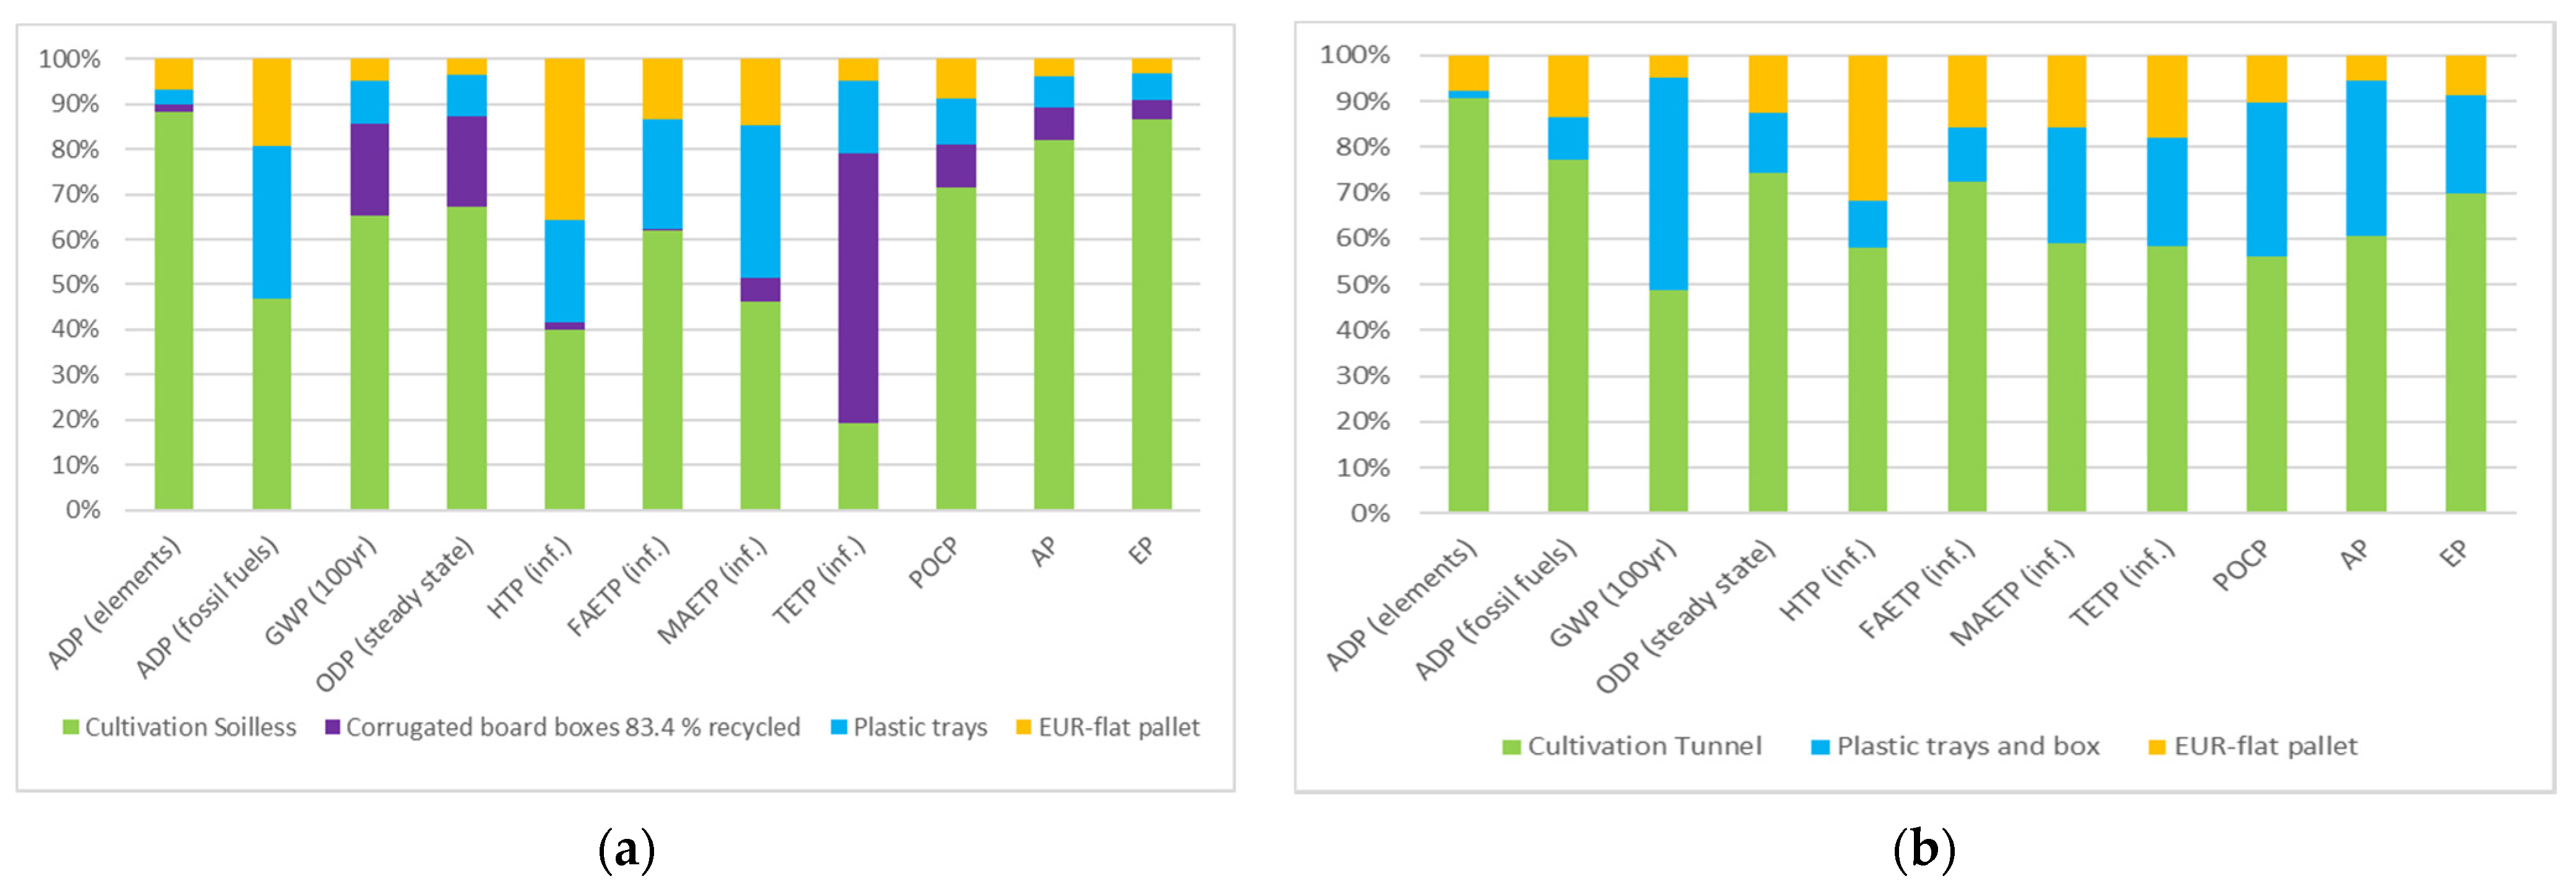
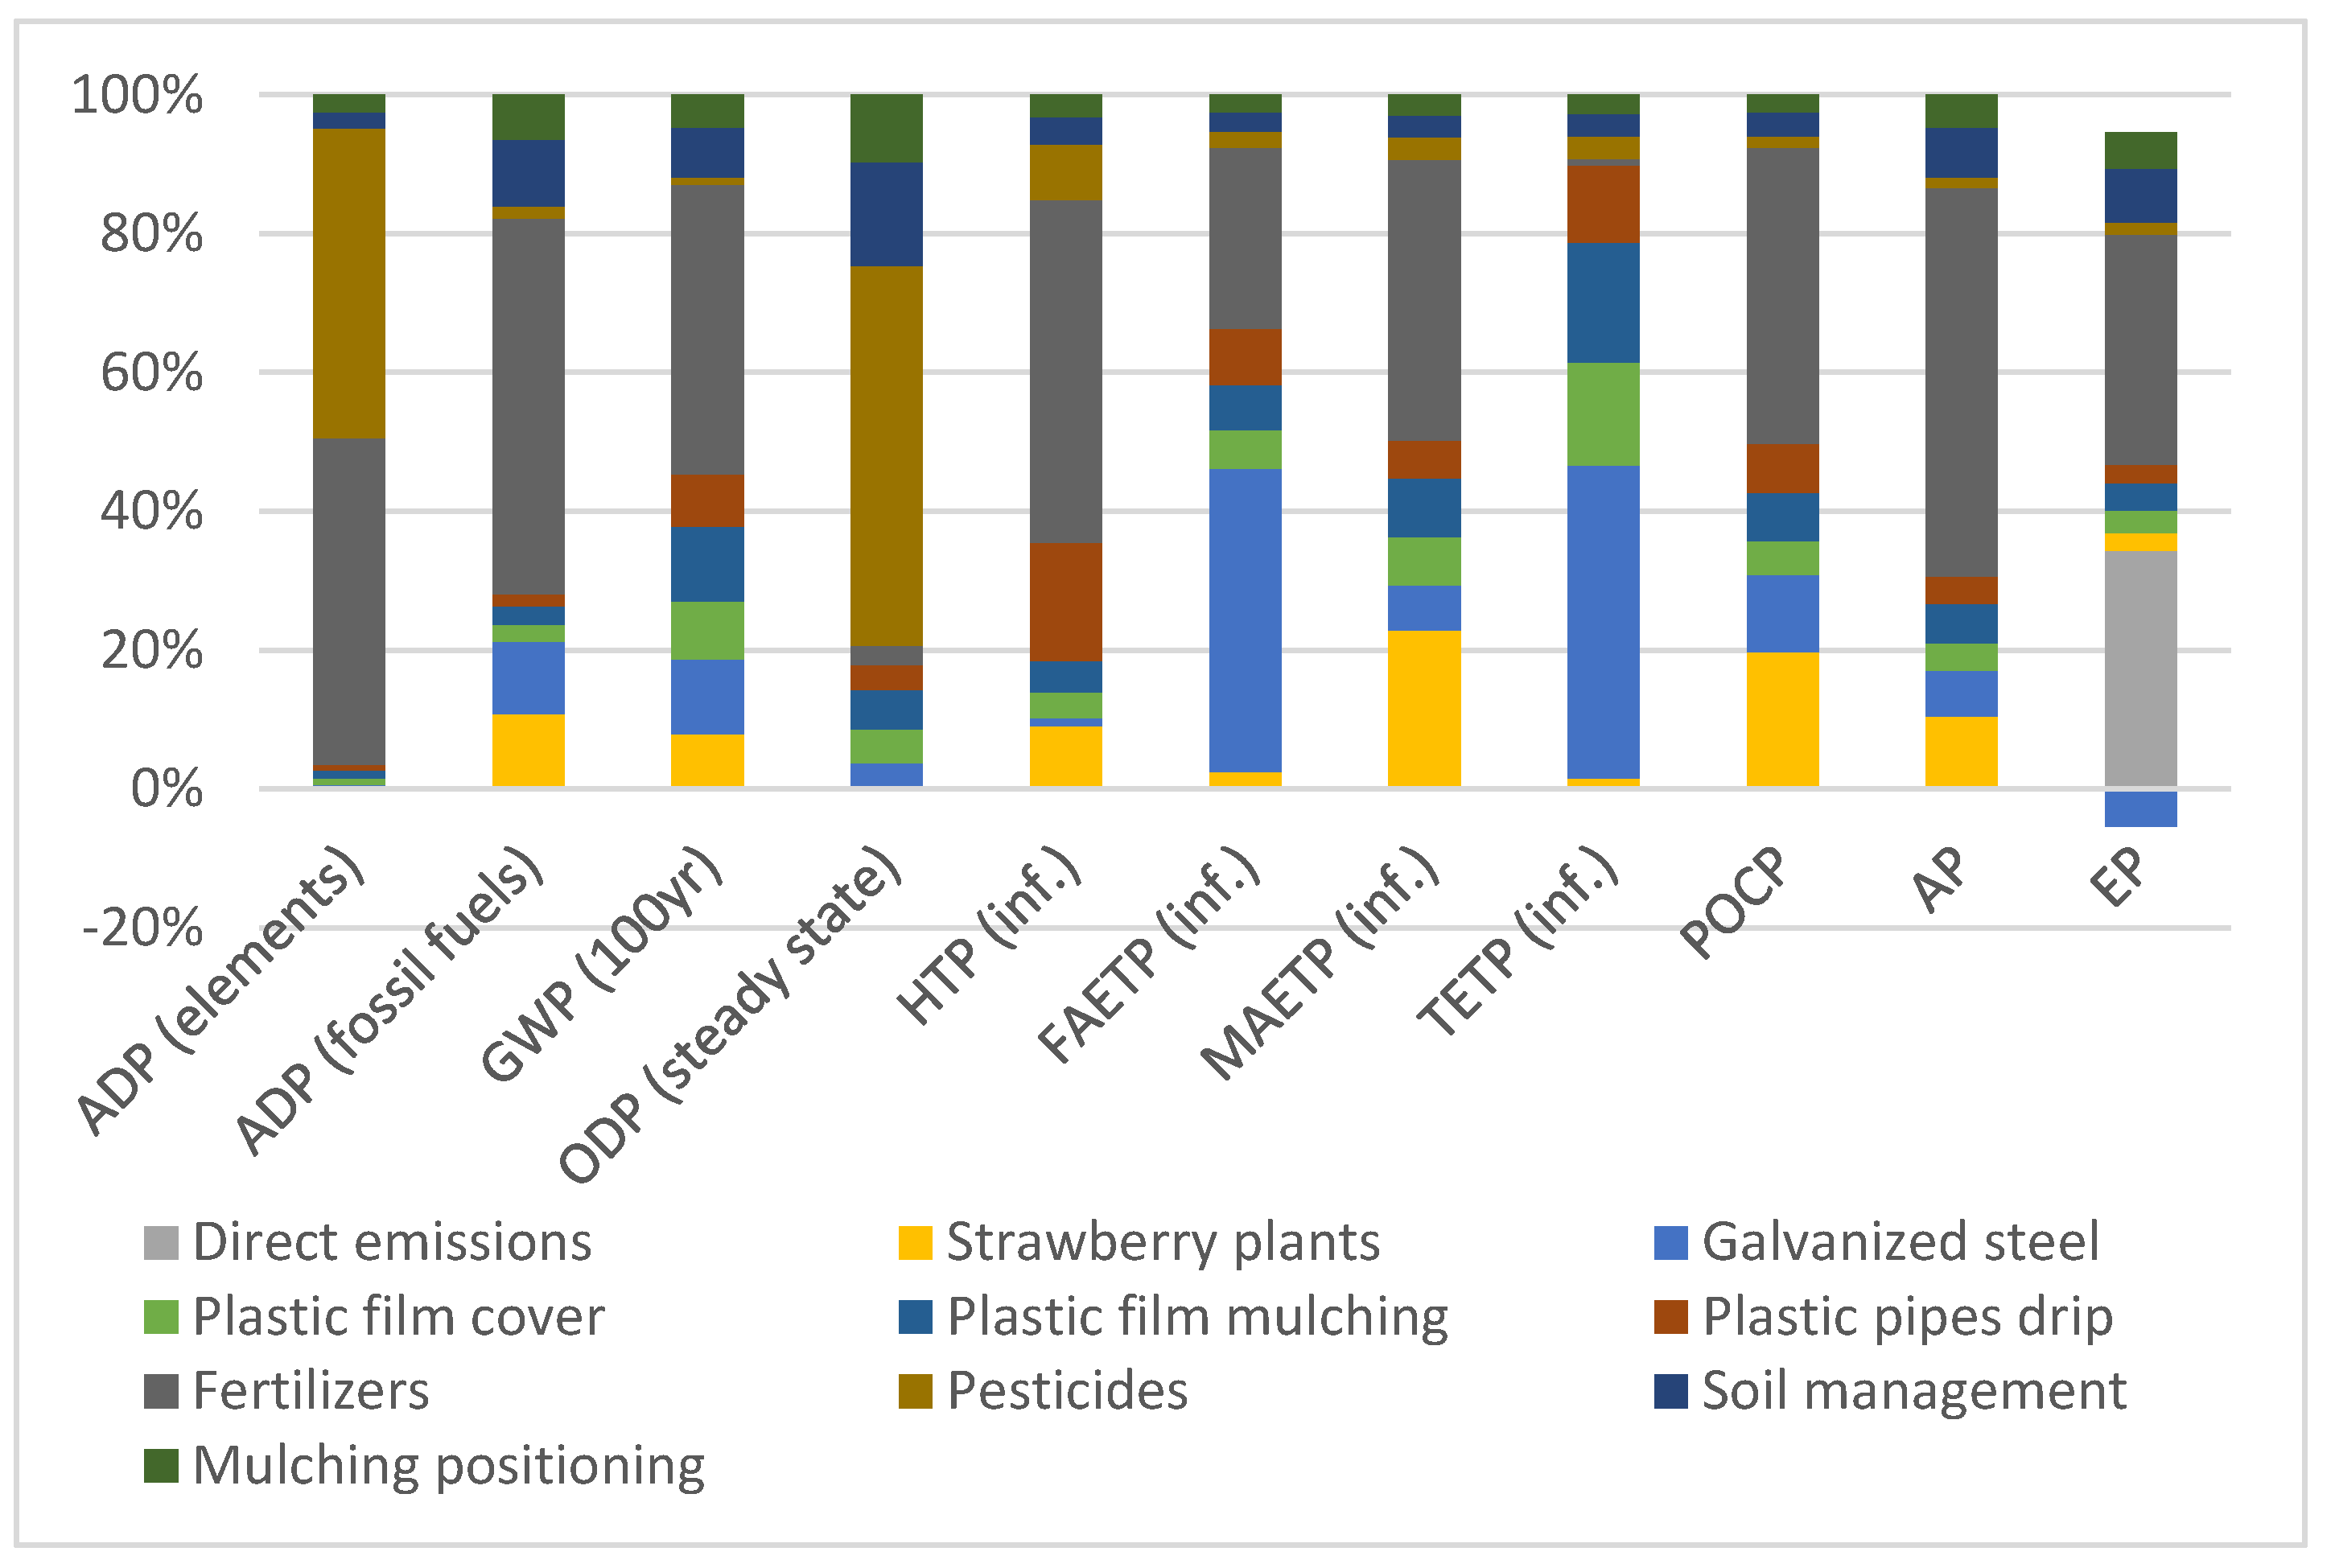
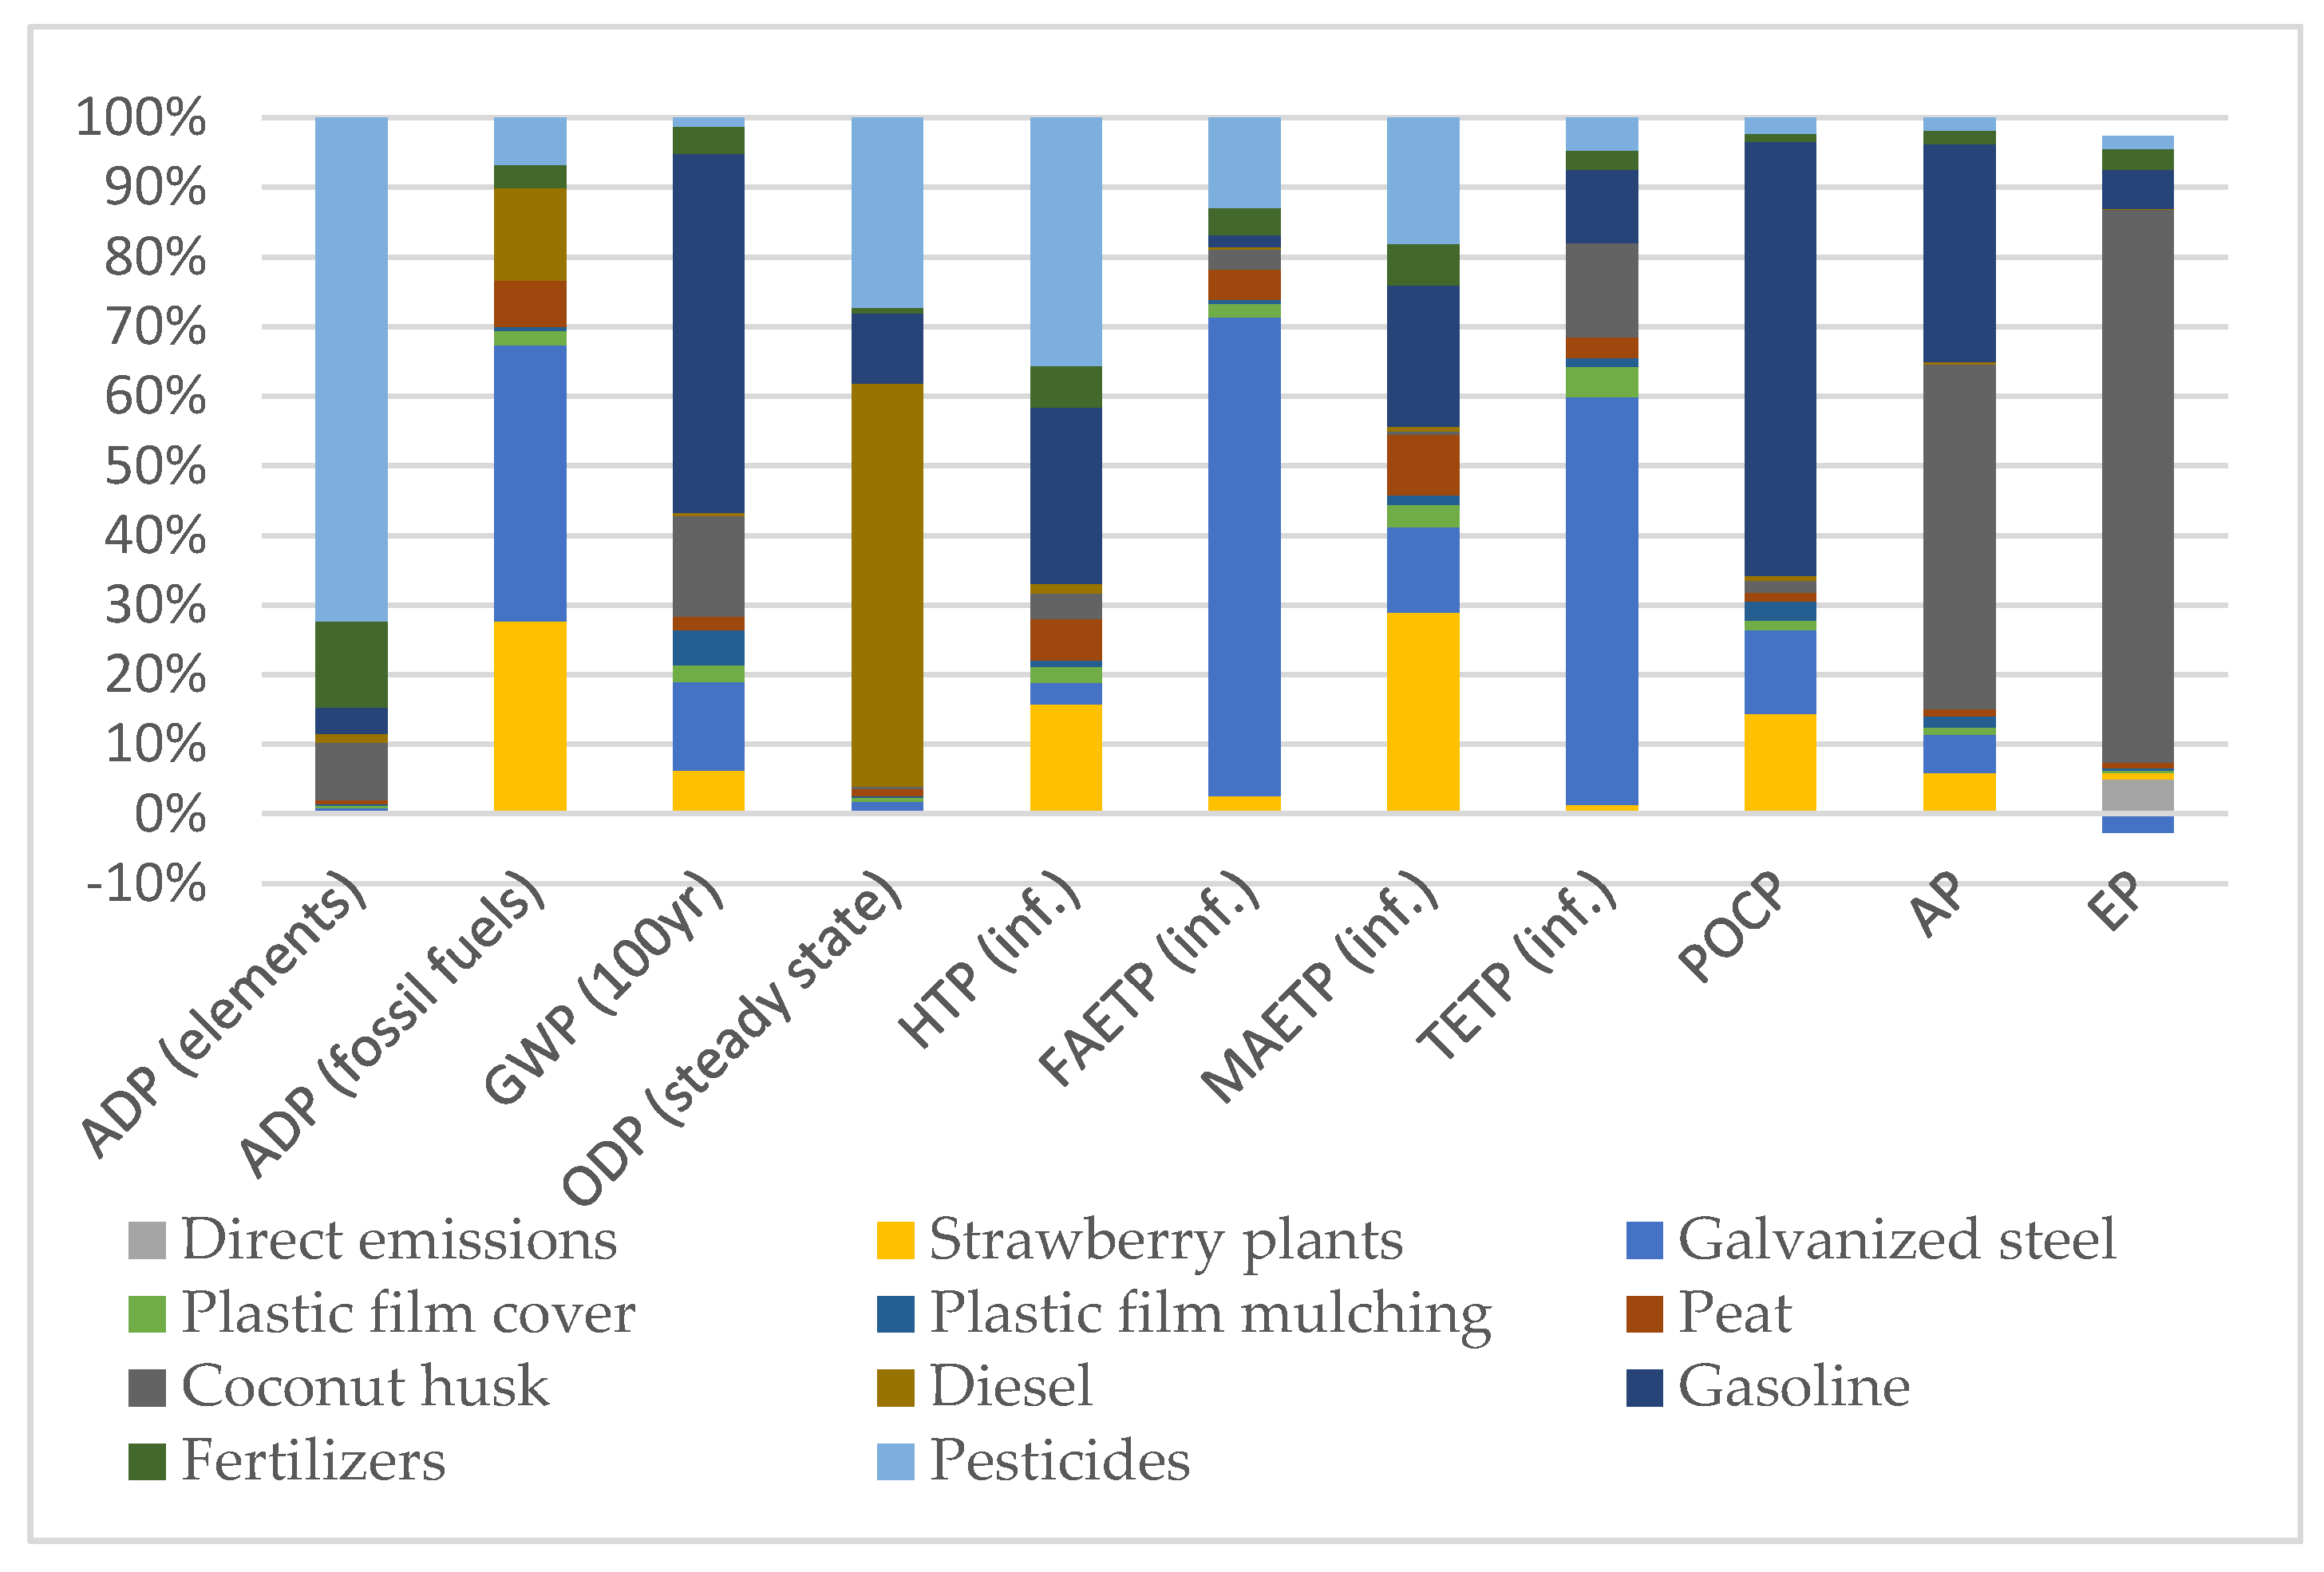
Contribution Analysis

Looking at the contribution analysis reported in Table 3 and Table 4 and Figure 6a,b, it is worthy to note that cultivation is the main contributor for both production systems for almost all the categories. For tunnel cultivation (Figure 6b), packaging shows a significant share with respect to cultivation only for GWP and POCP categories for which the total impact is equally distributed. For the soilless system (Figure 6a), packaging shows a higher contribution exceeding 50% only for TETP. For all the other impact categories the contribution of packaging ranges between 9.4(ADP elements for mulched soil tunnel scenario) and 80.7% (TETP for soilless scenario).
Due to the high share of the cultivation, it is useful to further assess the contributions from the input–output materials included in this phase. The contribution analysis for the cultivation of strawberries in the tunnel scenario is reported in Figure 7. As can be inferred, the major contributors to the impact are fertilizers, pesticides, capital goods (steel), and direct emissions of fertilizers (contribution to EP). Galvanized iron also generates an impact credit for EP, related to the reduction of phosphates in the steel production process and in particular in the water used in the production stage.
The relative impact of input and output in soilless cultivation is shown in Figure 8. The major contributors to total impact are pesticides, galvanized steel, fuels (diesel, gasoline), growing medium (coconut husk, peat). Additionally, for soilless production, an impact credit can be observed for galvanized steel.

4. Discussions

Considering the total impact of soilless and tunnel cultivation, it can be noted that the soilless system shows a higher impact on the specific impact categories of ADP elements, ODP, ecotoxicity group, POCP, AP, and EP. This is due mainly to the high use of agricultural input (growing medium, fertilizers, pesticides, and materials) even if related to a higher production than tunnel cultivation. Tunnel production shows a higher impact on HTP and ADP (fossil fuels) because of the higher use of fertilizers and fossil fuels for soil management, while the impact on the other categories is lower due to the reduced quantity of materials used even if related to relatively low production. GWP could be considered similar in the two systems. Indeed, looking at contribution analysis of field production, it is clear that tunnel production is significantly influenced by fertilizers, soil management, and direct emissions (from fertilizers and pesticides). For soilless production, the contribution of fertilizers was lower (mainly due to more efficient use of nutrients) while pesticides, capital goods, and growing medium recorded higher impacts. This is because it is an intensive crop that requires more propagation material, frequent treatments, substrates, and dedicated infrastructures to guarantee a higher production as compared to other systems. In general terms, it could be stated that the tunnel exploits more land and crop inputs (excluding pesticides), while the soilless more technology and building materials. Thus, it is difficult to establish which system is more environmentally sustainable since the various categories selected in some cases show negligible differences, while in other cases, rather high differences were observed. This implies that a system is more, less, or fairly sustainable in relation to the environmental objective to be achieved. From the comparison with the literature shown in Table 5 [8,15,16,39,40,41,42] only for the GWP category, it can be noted that the values calculated in this study were, on average, similar to those obtained in the studies that focused on greenhouse (GH) cultivation [8,16,39,42], except for the Japan case, which had a much higher value. In comparison with the results from Italian case studies [16,40], the calculated values are higher, but it is a comparison with different systems (open field—OF) that in some cases last for several years. The Marche region is in central Italy where the climate does not allow efficient open field cultivation similar to that of southern Italy. However, on average, the production of crops under a protected system in this climate is more sustainable than in colder climates (considering an annual cycle).
Considering the cultivation system and the contribution analysis for soilless, the possible practical mitigation measures concern almost exclusively the growing medium. Alternatives to peat obtained from coconut husks transported over long distances to Italy include perlite and compost. Peat is obtained from materials regarded as important carbon sinks. In the case of perlite, the resulting impact would be lower for almost all impact categories with more evident savings in the categories of eutrophication and acidification (−89% and −49%, respectively), and less evident for the other categories (0–8%). For GWP and TETP, a maximum saving of 15% and 12% could potentially be derived. In the case of compost, the use of litter from insect breeding such as the black soldier fly (Hermetia illucens) could be promising. The ability of these insects to treat organic waste is now recognized. Based on the results reported by Martenat et al., 2019 [43], the use of black soldier fly litter would reduce impacts for GWP by about 1.4% (equivalent to an annual saving of approximately 52 kg of CO2 eq for the system under study). Contribution analysis shows how the use of different packaging materials can clearly shift the impact contribution. Considering, for example, the substitution of plastic boxes used in the tunnel system with cardboard, the impact generated would be lower for different impact categories (−21% GWP, −21% POCP, −17% AP, −1% EP) and higher for other categories of reduced absolute impact and, in some cases, of lesser overall importance (+2% ADP elements, +73% ODP, +221% MAETP). Other possible mitigations that could be subjected to future evaluations include the replacement of plastic materials with bioplastics, considering the strong current interest in the topic.

Author Contributions

Conceptualization, A.I. and D.D.; methodology, D.D., A.I. and E.F.P.; software, A.I.; validation, D.D. and K.A.B.-Y.; formal analysis, A.I. and K.A.B.-Y.; investigation, A.I.; resources, D.D. and E.F.P.; data curation, A.I. and D.D.; writing—original draft preparation, A.I., D.D., G.T. and K.A.B.-Y.; writing—review and editing, A.I., D.D. and E.F.P.; supervision, A.I. and D.D.; project administration, D.D. and E.F.P.; funding acquisition, D.D. and G.T. All authors have read and agreed to the published version of the manuscript.

Funding

This research received no external funding.

Institutional Review Board Statement

Not applicable.

Informed Consent Statement

Not applicable.

Data Availability Statement

The data supporting the results presented in this study are available on request from the corresponding author. The data are not publicly available due to privacy issues.

Acknowledgments

The authors are grateful to Filinara company for providing data on the systems under analysis.

Conflicts of Interest

The authors declare no conflict of interest.

References

  1. IPCC. Climate Change 2013 the Physical Science Basis; Cambridge University Press: Cambridge, UK; New York, NY, USA, 2013; p. 1535. [Google Scholar]
  2. United Nations Environment Programme. Emissions Gap Report 2019; UNEP: Nairobi, Kenya, 2019. [Google Scholar]
  3. United Nations. Emissions Gap Emissions Gap Report 2020; UNEP: Nairobi, Kenya, 2020. [Google Scholar]
  4. UNEP. The Six Sector Solution to Climate Change n.d. Available online: https://www.unep.org/interactive/six-sector-solution-climate-change/ (accessed on 3 March 2021).
  5. Drew, J.; Cleghorn, C.; Macmillan, A.; Mizdrak, A. Healthy and Climate-Friendly Eating Patterns in the New Zealand Context. Environ. Heal Perspect. 2020, 128, 017007. [Google Scholar] [CrossRef] [Green Version]
  6. Unioncamere. Consumatori Sempre più Attenti Alla Sostenibilità 2011. Available online: http://www.unioncamere.gov.it/csr/P42A177C154S153/Consumatori-sempre-piu-attenti-alla-sostenibilita.htm (accessed on 3 March 2021).
  7. Mipaaf. Dati Biologico 2018. 2018. Available online: https://www.politicheagricole.it/flex/cm/pages/ServeBLOB.php/L/IT/IDPagina/14394 (accessed on 3 March 2021).
  8. Khoshnevisan, B.; Shariati, H.M.; Rafiee, S.; Mousazadeh, H. Comparison of energy consumption and GHG emissions of open field and greenhouse strawberry production. Renew. Sustain. Energy Rev. 2014, 29, 316–324. [Google Scholar] [CrossRef]
  9. Eren, O.; Baran, M.F.; Gokdogan, O. Determination of greenhouse gas emissions (GHG) in the production of different fruits in Turkey. Fresenius Environ. Bull. 2019, 28, 464–472. [Google Scholar]
  10. Andreotti, C.; Antoniacci, L.; Aranda, J.L.; Babini, A.R.; Baruzzi, G.; Baudino, M. Fragola nel mondo, Coltura e Cultura; n.d. Available online: https://www.colturaecultura.it/content/fragola-nel-mondo (accessed on 25 April 2021).
  11. Giampieri, F.; Forbes-Hernandez, T.Y.; Gasparrini, M.; Alvarez-Suarez, J.M.; Afrin, S.; Bompadre, S.; Quiles, J.L.; Mezzetti, B.; Battino, M. Strawberry as a Health Promoter: An Evidence Based Review. Food Funct. 2015, 6, 1386–1398. [Google Scholar] [CrossRef] [Green Version]
  12. Mazzoni, L.; Giampieri, F.; Suarez, J.M.A.; Gasparrini, M.; Mezzetti, B.; Hernandez, T.Y.F.; Battino, M.A. Isolation of strawberry anthocyanin-rich fractions and their mechanisms of action against murine breast cancer cell lines. Food Funct. 2019, 10, 7103–7120. [Google Scholar] [CrossRef] [PubMed]
  13. ISMEA. FILIERA FRUTTA FRESCA: Scheda di settore. 2020. Available online: http://www.ismeamercati.it/flex/cm/pages/ServeAttachment.php/L/IT/D/2%252F4%252Fb%252FD.5f56e7f9a5d8ff6e87d9/P/BLOB%3AID%3D3508/E/pdf (accessed on 25 April 2021).
  14. Holt, R.R.; Zuelch, M.L.; Charoenwoodhipong, P.; Al-Dashti, Y.A.; Hackman, R.M.; Keen, C.L. Effects of short-term consumption of strawberry powder on select parameters of vascular health in adolescent males. Food Funct. 2020, 11, 32–44. [Google Scholar] [CrossRef]
  15. Tabatabaie, S.M.H.; Murthy, G.S. Cradle to farm gate life cycle assessment of strawberry production in the United States. J. Clean. Prod. 2016, 127, 548–554. [Google Scholar] [CrossRef] [Green Version]
  16. Valiante, D.; Sirtori, I.; Cossa, S.; Corengia, L.; Pedretti, M.; Cavallaro, L.; Vignoli, L.; Galvagni, A.; Gomarasca, S.; Pesce, G.R.; et al. Environmental impact of strawberry production in Italy and Switzerland with different cultivation practices. Sci. Total. Environ. 2019, 664, 249–261. [Google Scholar] [CrossRef]
  17. Fritegotto, S. Fragola, coltivare in Sicilia con la tecnica del fuori suolo 2017. Available online: https://coltureprotette.edagricole.it/orticoltura/coltivare-sicilia-la-tecnica-del-suolo/ (accessed on 25 April 2021).
  18. Song, L.; Zhong, Z.; Han, Y.; Zheng, Q.; Qin, Y.; Wu, Q.; He, X.; Pan, C. Dissipation of sixteen pesticide residues from various applications of commercial formulations on strawberry and their risk assessment under greenhouse conditions. Ecotoxicol. Environ. Saf. 2020, 188, 109842. [Google Scholar] [CrossRef] [PubMed]
  19. Ilari, A.; Duca, D. Energy and environmental sustainability of nursery step finalized to “fresh cut” salad production by means of LCA. Int. J. Life Cycle Assess. 2018, 23, 800–810. [Google Scholar] [CrossRef]
  20. ISTAT. I.Stat, Data And Microdata on Horticultural Cultivation (Strawberry 2016–2019); Istituto nazionale di statistica: Rome, Italy, 2020. [Google Scholar]
  21. Muley, A.B.; Singhal, R.S. Extension of postharvest shelf life of strawberries (Fragaria ananassa) using a coating of chitosan-whey protein isolate conjugate. Food Chem. 2020, 329, 127213. [Google Scholar] [CrossRef] [PubMed]
  22. Rivas-Martínez, S.; Rivas-Sáenz, S.; Penas-Merino, A. Worldwide bioclimatic classification system. Glob Geobot 2011, 1, 1–638. [Google Scholar]
  23. ISO. ISO 14044-2006, Environmental Management—Life Cycle Assessment—Requirements and Guidelines; International Organization for Standardization: Geneva, Switzerland, 2006. [Google Scholar]
  24. ISO. ISO 14040-2006, Environmental Management—Life cycle Assessment—Principles and Framework; International Organization for Standardization: Geneva, Switzerland, 2006. [Google Scholar]
  25. Rilegno. Rapporto 2018. Available online: http://www.rilegno.org/wp-content/uploads/2018/08/Rapporto-2018-completo.pdf (accessed on 25 April 2021).
  26. Boulard, T.; Raeppel, C.; Brun, R.; Lecompte, F.; Hayer, F.; Carmassi, G.; Gaillard, G. Environmental impact of greenhouse tomato production in France. Agron. Sustain. Dev. 2011, 31, 757–777. [Google Scholar] [CrossRef] [Green Version]
  27. Antón, A.; Castells, F.; Montero, J.; Huijbregts, M. Comparison of toxicological impacts of integrated and chemical pest management in Mediterranean greenhouses. Chemosphere 2004, 54, 1225–1235. [Google Scholar] [CrossRef] [PubMed]
  28. Sedilot, C.; Degas, L.; Le Quillec, S.; Brajeul, E.; Grasselly, D. Management of greenhouse effluents: A status report for France. Infos-Ctifl 2002, 181, 50–52. [Google Scholar]
  29. Lecompte, F.; Bressoud, F.; Pares, L.; De Bruyne, F. Root and nitrate distribution as related to the critical plant N status of a fertigated tomato crop. J. Hortic. Sci. Biotechnol. 2008, 83, 223–231. [Google Scholar] [CrossRef]
  30. Guinée, J.B.; Gorrée, M.; Heijungs, R.; Huppes, G.; Kleijn, R.; de Koning, A.; van Oers, L.; Wegener Sleeswijk, A.; Suh, S.; Udo de Haes, H.A.; et al. Handbook on Life Cycle Assessment; Operational guide to the ISO standards. I: LCA in perspective. IIa: Guide. IIb: Operational annex. III: Scientific background; Kluwer Academic Publishers: Dordrecht, Holland, 2002. [Google Scholar]
  31. Cerutti, A.K.; Beccaro, G.L.; Bruun, S.; Bosco, S.; Donno, D.; Notarnicola, B.; Bounous, G. Life cycle assessment application in the fruit sector: State of the art and recommendations for environmental declarations of fruit products. J. Clean. Prod. 2014, 73, 125–135. [Google Scholar] [CrossRef]
  32. van Oers, L.; de Koning, A.; Guinée, J.B.; Huppes, G. Abiotic Resource Depletion in LCA—As an Illustrative the Extraction Rates of 14 Minerals Were Compared to Their Stocks in the Natural Environment (thus Excluding Stocks in the Economy). Mineral Stocks Were Here Defined in Three Different Ways: 2002:75. Available online: https://www.leidenuniv.nl/cml/ssp/projects/lca2/report_abiotic_depletion_web.pdf (accessed on 25 April 2021).
  33. Myhre, G.; Shindell, D.; Bréon, F.-M.; Collins, W.; Fuglestvedt, J.; Huang, J.; Koch, D.; Lamarque, J.-F.; Lee, D.; Mendoza, B.; et al. 2013: Anthropogenic and Natural Radiative Forcing. In Climate Change 2013: The Physical Science Basis. Contribution of Working Group I to the Fifth Assessment Report of the Intergovernmental Panel on Climate Change; Stocker, T.F., Qin, D., Plattner, G.-K., Tignor, M., Allen, S.K., Boschung, J., Nauels, A., Xia, Y., Bex, V., Midgley, P.M., Eds.; Cambridge University Press: Cambridge, UK; New York, NY, USA, 2013. [Google Scholar]
  34. WMO. Scientific assessment of ozone depletion: 2003. In Global Ozone Research and Monitoring Project—Report No. XX; WMO: Geneva, Switzerland, 2003. [Google Scholar]
  35. Huijbregts, M.; Thissen, U.; Guinée, J.; Jager, T.; Kalf, D.; Van De Meent, D.; Ragas, A.; Sleeswijk, A.W.; Reijnders, L. Priority assessment of toxic substances in life cycle assessment. Part I: Calculation of toxicity potentials for 181 substances with the nested multi-media fate, exposure and effects model USES-LCA. Chemosphere 2000, 41, 541–573. [Google Scholar] [CrossRef]
  36. E Jenkin, M.; Hayman, G.D. Photochemical ozone creation potentials for oxygenated volatile organic compounds: Sensitivity to variations in kinetic and mechanistic parameters. Atmos. Environ. 1999, 33, 1275–1293. [Google Scholar] [CrossRef]
  37. Derwent, R.G.; Jenkin, M.E.; Saunders, S.M.; Pilling, M.J. Photochemical ozone creation potentials for organic compounds in northwest Europe calculated with a master chemical mechanism. Atmos. Environ. 1998, 32, 2429–2441. [Google Scholar] [CrossRef]
  38. Huijbregts, M. Life-Cycle Impact Assessment of Acidifying and Eutrophying Air Pollutants 1999. Available online: https://p2infohouse.org/ref/37/36502.pdf (accessed on 25 April 2021).
  39. Khoshnevisan, B.; Rafiee, S.; Mousazadeh, H. Environmental impact assessment of open field and greenhouse strawberry production. Eur. J. Agron. 2013, 50, 29–37. [Google Scholar] [CrossRef]
  40. Peano, C.; Baudino, C.; Tecco, N.; Girgenti, V. Green marketing tools for fruit growers associated groups: Application of the Life Cycle Assessment (LCA) for strawberries and berry fruits ecobranding in northern Italy. J. Clean. Prod. 2015, 104, 59–67. [Google Scholar] [CrossRef]
  41. Gunady, M.G.; Biswas, W.; Solah, V.A.; James, A.P. Evaluating the global warming potential of the fresh produce supply chain for strawberries, romaine/cos lettuces (Lactuca sativa), and button mushrooms (Agaricus bisporus) in Western Australia using life cycle assessment (LCA). J. Clean. Prod. 2012, 28, 81–87. [Google Scholar] [CrossRef]
  42. Yoshikawa, N.; Amano, K.; Shimada, K. Evaluation of environmental load on friuts and vegetables consumption and its reduction potential. Environ. Syst. Res. 2007, 35, 499–509. [Google Scholar] [CrossRef]
  43. Mertenat, A.; Diener, S.; Zurbrügg, C. Black Soldier Fly biowaste treatment—Assessment of global warming potential. Waste Manag. 2019, 84, 173–181. [Google Scholar] [CrossRef] [PubMed]
Figure 1. Average monthly rainfall and temperatures of Monterubbiano municipality (period 1982–2012, source climate-data.org accessed 14 January 2021).
Sustainability 13 04879 g001
Figure 2. The 3D model of soil mulched tunnel for strawberry production (drawing software used: SketchUp 2017).
Sustainability 13 04879 g002
Figure 3. The 3D model of soilless cultivation under tunnel for strawberry production (drawing software used: SketchUp 2017).
Sustainability 13 04879 g003
Figure 4. System boundaries of strawberry production. The flows and processes that are not included in the evaluations of this work are marked with a dashed line.
Sustainability 13 04879 g004
Figure 5. Relative impact of Soilless (blue line) and tunnel (red line), system boundaries considered: from cradle to farm gate.
Sustainability 13 04879 g005
Figure 6. Contribution analysis for soilless (a) and mulched soil tunnel (b) cultivation and packaging.
Sustainability 13 04879 g006
Figure 7. Impact share of input–output for tunnel cultivation.
Sustainability 13 04879 g007
Figure 8. Impact share of input–output for soilless cultivation.
Sustainability 13 04879 g008
Table 1. Life cycle inventories of the systems under analysis: (a) mulched soil tunnel; (b) soilless tunnel.
(a) Life cycle inventory table for mulched soil tunnel production (all data are expressed per the functional unit of 1 kg of fresh packed strawberry).
Input/OutputTunnel Description/Compartment
Plants (p)1.25
Land occupation (ha)2.08 × 10⁻⁵
Plastics PE (kg) 11.35 × 10⁻² Greenhouse
Galvanized iron (kg) 11.27 × 10⁻²
Mulching film/bag (kg) 11.32 × 10⁻² Mulching film
Drip irrigation pipes (kg) 11.25 × 10⁻² Irrigation
Field operations diesel (l)6.67 × 10⁻³
Mulching film laying diesel (l)4.17 × 10⁻³ Field operations
Water (m3)8.77 × 10⁻¹ Irrigation
Plastic tray (RPET) (kg) 31.60 × 10⁻²
Plastic box (HDPE) (kg)7.50 × 10⁻²
Wood pallet EPAL 1200 × 800 (p) 33.46 × 10⁻³ Packaging
Wood pallet EPAL 1200 × 800 (kg) 38.53 × 10⁻²
Nails pallet EPAL 90 mm (kg) 32.23 × 10⁻²
Nails pallet EPAL 70 mm (kg) 31.74 × 10⁻²
Nails pallet EPAL 55 mm (kg) 39.25 × 10⁻³
Pesticide1 (kg)1.14 × 10⁻⁵Spinosad5.00 × 10−6
Pesticide2 (kg)2.50 × 10⁻⁴Bacillus subtilis3.92 × 10−6
Pesticide3 (l)2.31 × 10⁻⁵Azoxystrobin5.20 × 10−6
Pesticide4 (kg)3.34 × 10⁻⁵Cyprodinil1.25 × 10−5
Fludioxonil8.32 × 10−6
Pesticide5 (l)1.03 × 10⁻⁵Penconazole1.04 × 10−6Plant protection products
Pesticide6 (l)8.56 × 10⁻⁵Sulfur4.38 × 10−5
Pesticide7 (l)1.00 × 10⁻⁵Clofentezine4.16 × 10−6
Pesticide8 (l)1.59 × 10⁻⁵Penconazole3.00 × 10−7
Water for pesticides (m3) 41.67 × 10⁻⁴
Organic nitrogen fertilizer (kg) 45.56 × 10⁻²⁷-2/3-1/2 NPK
Ammonium nitrate and Isobutylidenediurea (IBDU) fertilizer (kg) 42.78 × 10−215-9-15 NPK
Ammonium and ureic fertilizer (kg) 43.09 × 10−310-52-10 NPK
Ammonium nitrate and ureic fertilizer(kg) 43.09 × 10−320-20-20 NPK Fertilizers (solid)
Ammonium nitrate fertilizer(kg) 41.53 × 10−312-30-12 NPK
Ammonium nitrate fertilizer(kg) 41.24 × 10−210-10-30/23-6-10 NPK
Ammonium nitrate fertilizer(kg) 42.28 × 10−316-5-25 NPK
Calcium nitrate (kg) 41.03 × 10−315.5 N
(b) Life cycle inventory table for soilless tunnel production (all data are expressed per the functional unit of 1 kg of fresh packed strawberry).
Input/OutputSoilless Description/Compartment
Plants (p)1.33
Land occupation (ha)1.33 × 10⁻⁵
Plastics PE (kg) 14.80 × 10⁻³ Greenhouse
Galvanized iron (kg) 12.02 × 10⁻²
Mulching film/bag (kg) 11.33 × 10⁻² Growing bag
Peat 60% (kg) 24.00 × 10⁻¹ Growing medium
Coconut fiber 40% (kg) 22.67 × 10⁻¹
Field operations diesel (l)4.27 × 10⁻³
Field operations petrol (l)3.84 × 10⁻³
Water (m3)3.45 × 10⁻¹ Irrigation
Plastic tray (RPET) (kg) 34.00 × 10⁻²
Recycled cardboard (kg) 31.40 × 10⁻¹
Wood pallet EPAL 1200 × 800 (p) 33.46 × 10⁻³ Packaging
Wood pallet EPAL 1200 × 800 (kg) 38.53 × 10⁻²
Nails pallet EPAL 90 mm (kg) 32.23 × 10⁻²
Nails pallet EPAL 70 mm (kg) 31.74 × 10⁻²
Nails pallet EPAL 55 mm (kg) 39.25 × 10⁻³
Pesticide1 (l) 51.79 × 10⁻⁵Acetamiprid8.34 × 10−7
Pesticide2 (kg) 56.27 × 10⁻⁵Boscalid1.19 × 10−5
Pyraclostrobin2.99 × 10−6
Pesticide3 (l) 59.99 × 10⁻⁶Bifenazate4.36 × 10−6
Pesticide4 (l) 59.31 × 10⁻⁶Piretrina3.56 × 10−7
Pesticide5 (l) 51.02 × 10⁻⁵Fluopyram2.18 × 10−6
Trifloxystrobin2.18 × 10−6
Pesticide6 (l) 52.74 × 10⁻⁵Sulfur1.40 × 10−5
Pesticide7 (l) 51.40 × 10⁻⁵Bupirimate3.34 × 10−6
Pesticide8 (kg) 52.14 × 10⁻⁵Azoxystrobin5.32 × 10−6
Pesticide9 (kg) 52.14 × 10⁻⁵Cyprodinil8.00 × 10−6Plant protection products
Fludioxonil5.32 × 10−6
Pesticide10 (kg) 51.33 × 10⁻⁴Potassium bicarbonate5.66 × 10−5
Pesticide11 (kg) 54.00 × 10⁻⁶Tau-fluvalinate9.60 × 10−7
Pesticide12 (l) 56.57 × 10⁻⁶Penconazole6.66 × 10−7
Pesticide13 (l) 58.45 × 10⁻⁶Quinoxyfen3.48 × 10−7
Myclobutanil3.48 × 10−7
Pesticide14 (l) 59.60 × 10⁻⁶Clofentezine4.00 × 10−6
Pesticide15 (l) 57.25 × 10⁻⁵Copper1.45 × 10−5
Pesticide16 (l) 51.34 × 10⁻⁴Potassium salts of fatty acids6.40 × 10−5
Pesticide17 (l) 52.17 × 10⁻⁵Azadirachtin A5.20 × 10−7
Water for pesticides (m3) 52.37 × 10⁻⁴
Nitric acid (kg) 53.60 × 10⁻³
Calcium ammonium nitrate (kg) 55.47 × 10⁻³
Single superphosphate (kg) 55.47 × 10⁻³ Fertilizers (soluble)
Potassium sulfate (kg) 52.27 × 10⁻³
Magnesium sulfate (kg) 58.00 × 10⁻⁴
Table 2. Absolute impact results for soilless and tunnel strawberry production at packaging gate.
CategoryUnitSoillessTunnel
ADP (elements)kg Sb eq1.72 × 10−61.52 × 10⁻⁶
ADP (fossil fuels)MJ eq3.465.01
GWP (100yr)kg CO2 eq7.85 × 10−17.78 × 10⁻¹
ODP (steady state) kg CFC-11 eq5.62 × 10−81.57 × 10⁻⁸
HTP (inf.)kg 1,4-DB eq1.13 × 10−11.28 × 10⁻¹
FAETP (inf.)kg 1,4-DB eq8.09 × 10−26.83 × 10⁻²
MAETP (inf.)kg 1,4-DB eq2.38 × 1022.22 × 102
TETP (inf.)kg 1,4-DB eq6.43 × 10−41.74 × 10⁻⁴
POCPkg C2H2 eq2.90 × 10−42.52 × 10⁻⁴
APkg SO2 eq6.20 × 10−34.45 × 10⁻³
EPkg PO43- eq2.05 × 10−37.48 × 10⁻⁴
Table 3. Contribution analysis for the soilless scenario.
CategoryUnitCultivation SoillessCorrugated Board Boxes 83.4% RecycledPlastic TraysEUR-Flat Pallet
ADP (elements)%88.21.73.36.7
ADP (fossil fuels)%46.80.033. 819.4
GWP (100 yr)%65.220.59.34.9
ODP (steady state) %67.220.29.13.5
HTP (inf.)%39.91.622. 735.8
FAETP (inf.)%61.90.324.513.3
MAETP (inf.)%46.25.134.114.6
TETP (inf.)%19.359.915.94.9
POCP%71.49.710.18.9
AP%82.26.97.04.0
EP%86.5%4.5%5.8%3.2%
Table 4. Contribution analysis for the mulched soil tunnel scenario.
CategoryUnitCultivation TunnelPlastic Trays and BoxEUR-Flat Pallet
ADP (elements)%90.61.87.6
ADP (fossil fuels)%77.39.313.4
GWP (100 yr)%48.7%46.3%5.0%
ODP (steady state)%74.413.012.5
HTP (inf.)%58.110.131. 8
FAETP (inf.)%72.611.715. 8
MAETP (inf.)%59.025.415.6
TETP (inf.)%58.423.618.1
POCP%56.0%33.8%10.2%
AP%60.5%34.0%5.5%
EP%69.9%21.3%8.8%
Table 5. GWP for fresh strawberry production from literature. Values were reported to the same functional unit and system boundary as in the present study.
ReferenceCountryCropProduction SystemGrowing Cyclekg CO2 eq/kg Fresh Product
Valiante et al., 2019 [16] CH strawberryGH1yr1.868
strawberry
Valiante et al., 2019 [16] ITstrawberryOF2yr0.182
strawberry 3 yr0.212
Khoshnevisan et al., 2013 [39] IRstrawberryGH (tunnel)1yr0.585
strawberryOF1yr0.695
Khoshnevisan et al., 2014 [8] IRstrawberryGH (tunnel) 0.484
strawberryOF 0.147
Peano et al., 2015 [40] ITstrawberryOF1yr0.324
raspberryOF1yr0.192
blueberryOF1yr0.168
Tabatabaie et al., 2016 [15] USstrawberry California 1.75
strawberry Florida 2.5
strawberry North Carolina 5.48
strawberry Oregon 2.21
Gunady et al., 2012 [41] AUstrawberryOF 2.23
Yoshikawa et al., 2008 [42] JPstrawberryGH 4.8
Current studyITstrawberryTunnel 0.778
Current studyITstrawberryTunnel soilless 0.785
Publisher’s Note: MDPI stays neutral with regard to jurisdictional claims in published maps and institutional affiliations.

