Article

Influences of Spectral Power Distribution on Circadian Energy, Visual Comfort and Work Performance

1
Department of Architectural Engineering, Kyung Hee University, 1732 Deogyeong-daero, Giheung-gu, Yongin-si 17104, Gyeonggi-do, Korea
2
Department of Architecture, Kyung Hee University, 1732 Deogyeong-daero, Giheung-gu, Yongin-si 17104, Gyeonggi-do, Korea
*
Author to whom correspondence should be addressed.
Sustainability 2021, 13(9), 4852; https://doi.org/10.3390/su13094852
Submission received: 16 March 2021 / Revised: 22 April 2021 / Accepted: 23 April 2021 / Published: 26 April 2021
(This article belongs to the Special Issue The Future of Interior Lighting is here)

Abstract

:
Spectral power distribution (SPD) is an essential element that has considerable implications on circadian energy and the perception of lit environments. The present study assessed the potential influences of SPD on energy consumption (i.e., considering circadian energy), visual comfort, work performance and mood. Two lighting conditions based on light-emitting diode (LED) and organic light-emitting diode (OLED) were used as proxies for SPDs of different spectral content: dominant peak wavelength of 455 nm (LED) and 618 nm (OLED). Using measured photometric values, the circadian light (CL), melatonin suppression (MS), and circadian efficacy (CE) of the two lighting sources were estimated via a circadian-phototransduction model and compared. Additionally, twenty-six participants were asked to evaluate the said lit environments subjectively in terms of visual comfort and self-reported work performance. Regarding circadian lighting and the associated energy implications, the LED light source induced higher biological actions with relatively less energy than the OLED light source. For visual comfort, OLED lighting-based conditions were preferred to LED lighting-based conditions, while the opposite was true when considering work performance and mood. The current study adds to the on-going debate regarding human-centric lighting, particularly considering the role of SPD in energy-efficient and circadian lighting practices.

1. Introduction

The role of architectural lighting has been to aid visual and task performance in buildings, but recently, it has evolved to include aspects beyond visual and task performance. For example, due to the combustion of fossil fuels in the production of electricity and its subsequent effects on the environment [1], modern architectural lighting must now be engineered with extra emphasis on energy efficiency; in particular, it must use reduced amounts of electricity and, at the same time, provide satisfactory levels of illuminance for any given task (i.e., high luminous efficacy). This aspect of artificial lighting has seen tremendous advancements since the invention of solid-state lighting (SSL), which is also particularly beneficial to building owners since it reduces electric utility bills. In addition, architectural lighting must be designed not only to assist in activities that require visual accentuation but also to simultaneously provide visual comfort (i.e., glare-free lit environments) [2].
Besides visual comfort and reduced energy consumption, another crucial design aspect of modern architectural lighting is the potential impact of emitted light on human circadian rhythms. Research in photobiology has reported potential nonvisual effects of light on humans [3]. Human biological functions are synchronized by a master clock found in the suprachiasmatic nuclei in the hypothalamus region of the brain [4]. It is well established that light plays an important role in the regulation/control of the human master clock although the exact mechanisms through which light might influence the circadian rhythms are not yet fully known. One way light may be able to influence circadian rhythms is through the human eye and the secretion of melatonin. The absence of light at the retina initiates the production of melatonin, a hormone responsible for inactiveness or sleepiness in humans. Similarly, light incident on the retina signals the body to inhibit melatonin production, thereby promoting activeness and suppressing sleepiness. The inhibition or secretion of melatonin plays an important role in the human wake/sleep cycle and, potentially, in the functioning of other diverse physiological processes (e.g., endocrine processes) [5].
Consequently, because the levels of melatonin are largely dependent on prevailing lighting conditions, artificial lighting, especially at night, has the potential to influence the secretion/inhibition of melatonin and can thus desynchronize the human circadian rhythm. Wake/sleep cycles that are out of tune with natural settings have been associated with many serious health conditions, such as breast cancer in women [6] and diabetes [7]. Similarly, properly designed architectural lighting can be used as a circadian stimulus to elicit alertness and alleviate concentration levels in areas that lack sunlight during the day [8].
For the reasons explained above, modern architectural lighting must consider aspects beyond the visual and task performance (i.e., the nonvisual effects of light). Although the exact mechanisms through which light influences circadian rhythms are not yet fully known, the spectra power distribution (SPD) of a given light source is one element likely to have significant influences on the human circadian system [9]. Moreover, SPD has been reported to influence several psychological aspects of building occupants [10]. Consequently, critical assessments of the role of SPD on human- centric lighting are warranted, especially to couple healthy lighting with energy-efficient lighting.
To that end, experiments were conducted to (I) explore the circadian properties associated with different spectra content in terms of energy consumption and (II) compare the subjective experiences between luminous conditions of different spectra content in terms of visual comfort (e.g., discomfort glare), work performance (e.g., self-reported productivity) and mood (e.g., positive, and negative moods) The said experiments were conducted in a university classroom. Pertinent information was obtained through subjective survey questionnaires and the physical measurements of light quantities. The results were then systematically compared with charts and statistical analysis to gage the differences in lighting conditions. Furthermore, to set up lit environments with different spectra content, organic light-emitting diodes (OLED) and light-emitting diodes (LED) light panels were used. OLED and LED are two competing SSL lighting technologies that are easily manipulated to emit lighting conditions with varying characteristics and which have seen an increase in usage for many lighting purposes [11].
The study expands on the ongoing discussion regarding healthy lighting and provides an assessment of SPDs with respect to rarely assessed elements, such as circadian properties and work performance. Moreover, to the best of the authors’ knowledge, this is the first study to assess the potential effects of OLED lighting on the circadian entrainment of building occupants. Indeed, this is valuable as SSL technologies, especially OLED lighting, are anticipated to dominate indoor-lighting practices in the near future. It is thus useful to understand the potential effects of such light sources on occupant well-being and general perception in indoor environments.

2. Methods

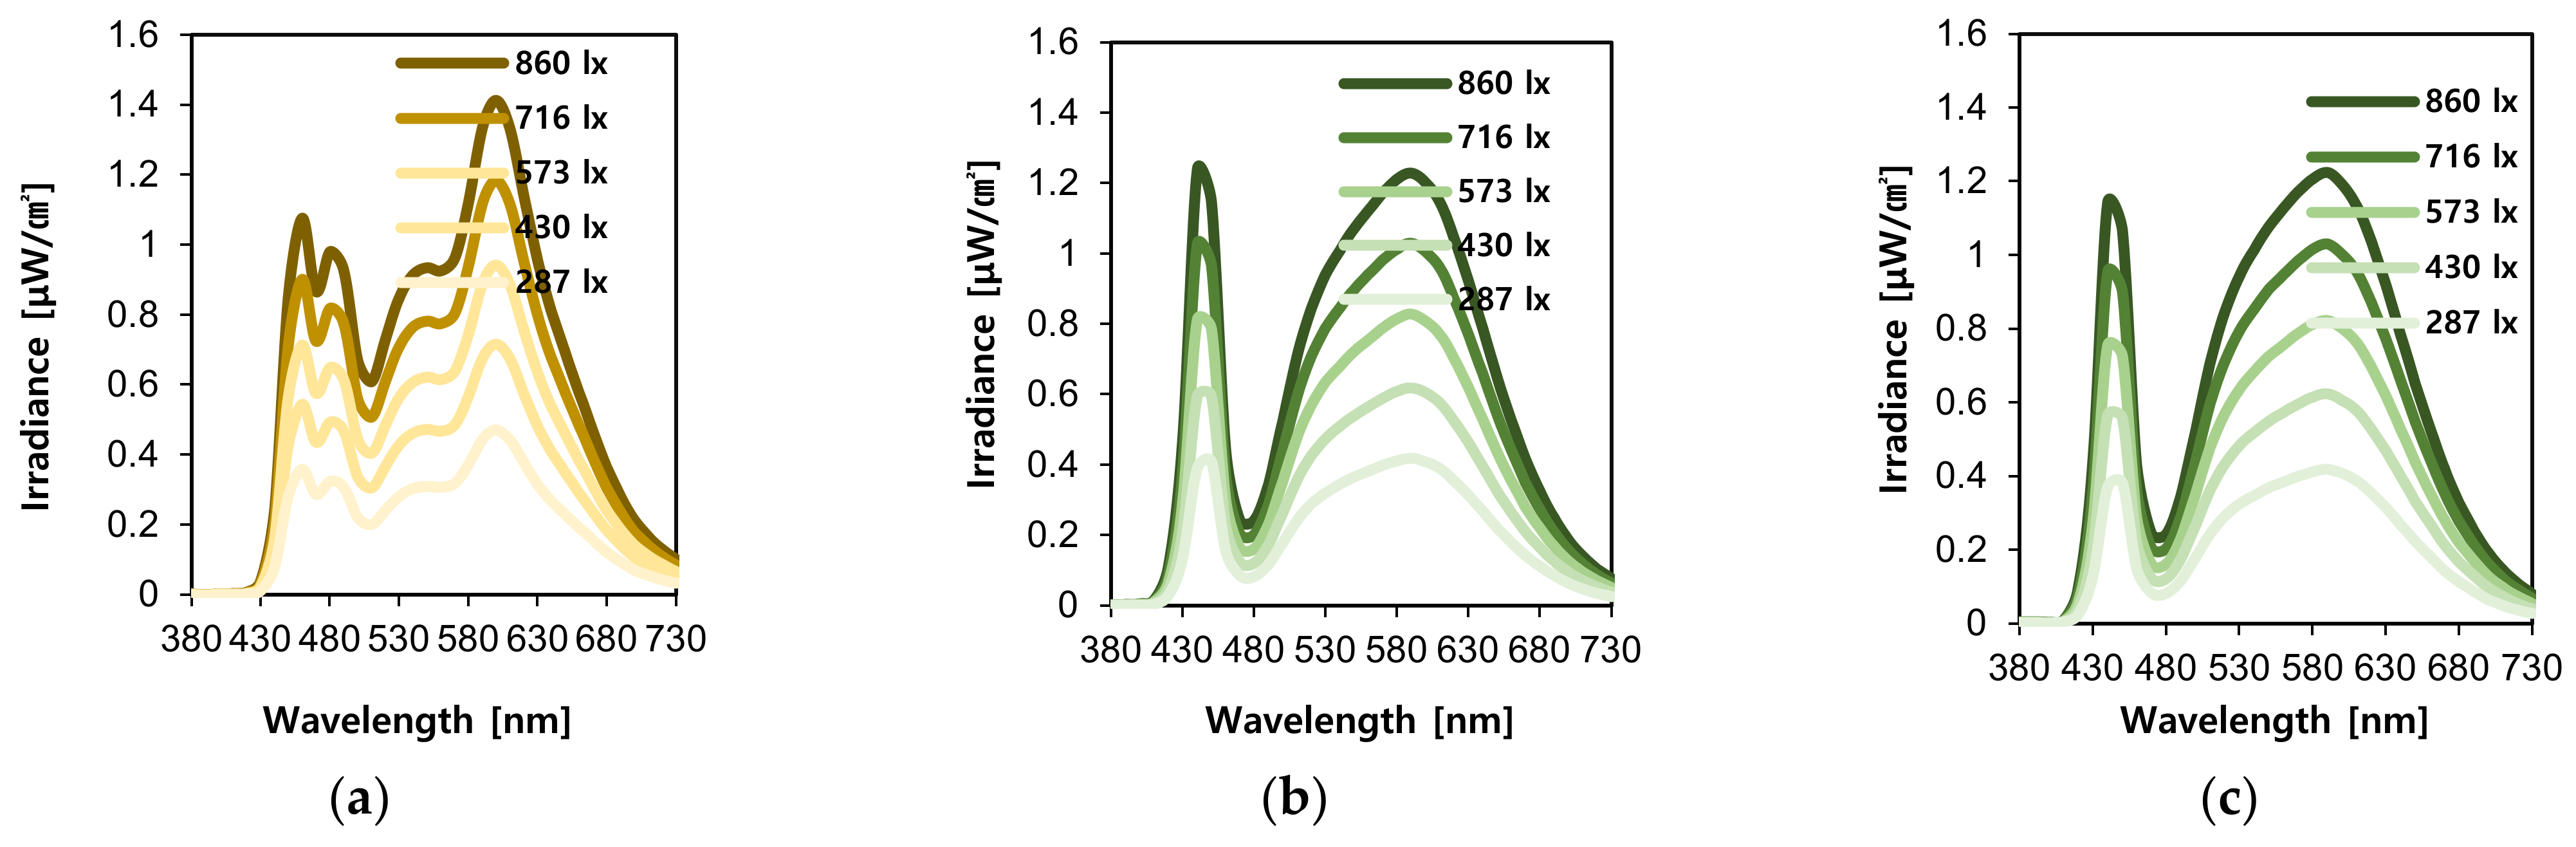
2.1. Experimental Conditions and Light Sources

To create a luminous environment with varying SPDs, two types of light panels with the same correlated color temperature (CCT) were considered: OLED light panel and LED light panel with a CCT value of 4000 K. In addition, because OLED is a surface light source and LED is a point light source, a third light panel (i.e., a covered-LED light panel) was included in the experiment to account for the differences in perception that may be caused by the difference in the direction of light emitted by the two light panels. The light fixtures were also equipped with dimming devices that allowed us to adjust illuminance levels. Five different illuminance levels were used: 287, 430, 573, 716, and 860 lux. The dimensions of the light panels were 80 × 83.5 cm for the OLED light panel and 60.5 × 60.5 cm for both the LED light panel and the covered-LED light panel. Figure 1 shows the images of the light panels used in the study.

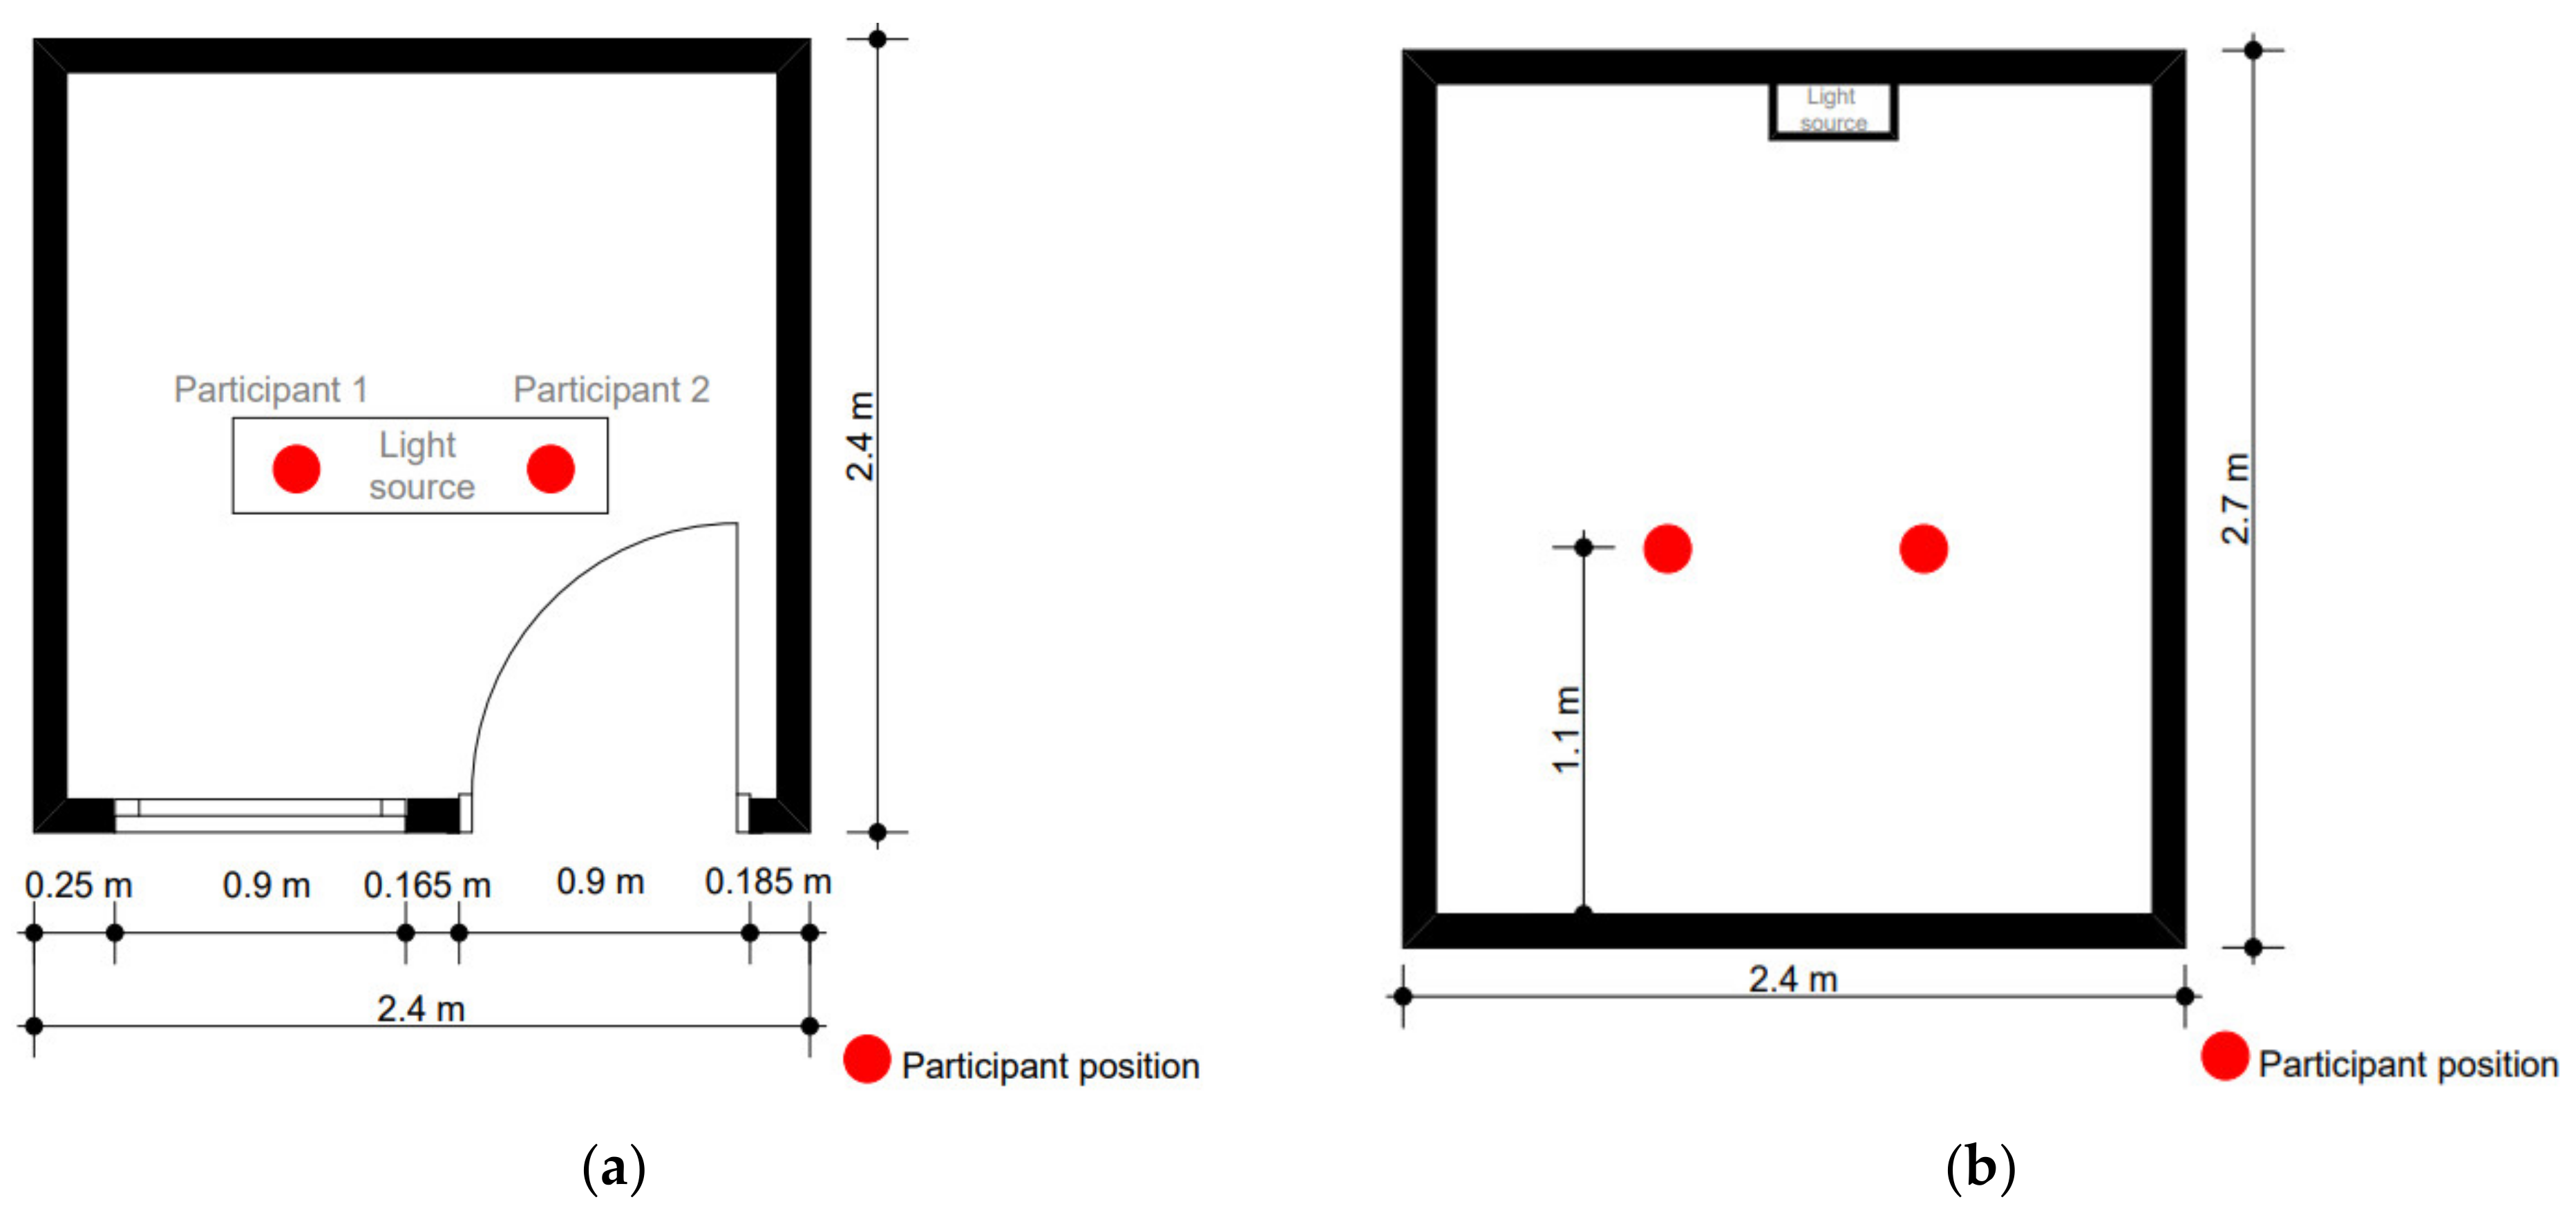
2.2. Experiment Area and Participants

The experiment was conducted in a room located at Kyung Hee University, South Korea. The room dimensions were 2.4 × 2.4 × 2.7 m. The light panels were mounted at the center of the ceiling and two chairs were placed in the center of the room for the participants to use when filling in the questionnaire forms (See Figure 2). A total of 26 students recruited from Kyung Hee University took part in the study. The entire group consisted of 17 males and 9 females with an average age of 20.8 years (standard deviation = 0.05). 12 of the participants had no major vision problems (e.g., color blindness or short-sightedness), but 14 wore eyeglasses.

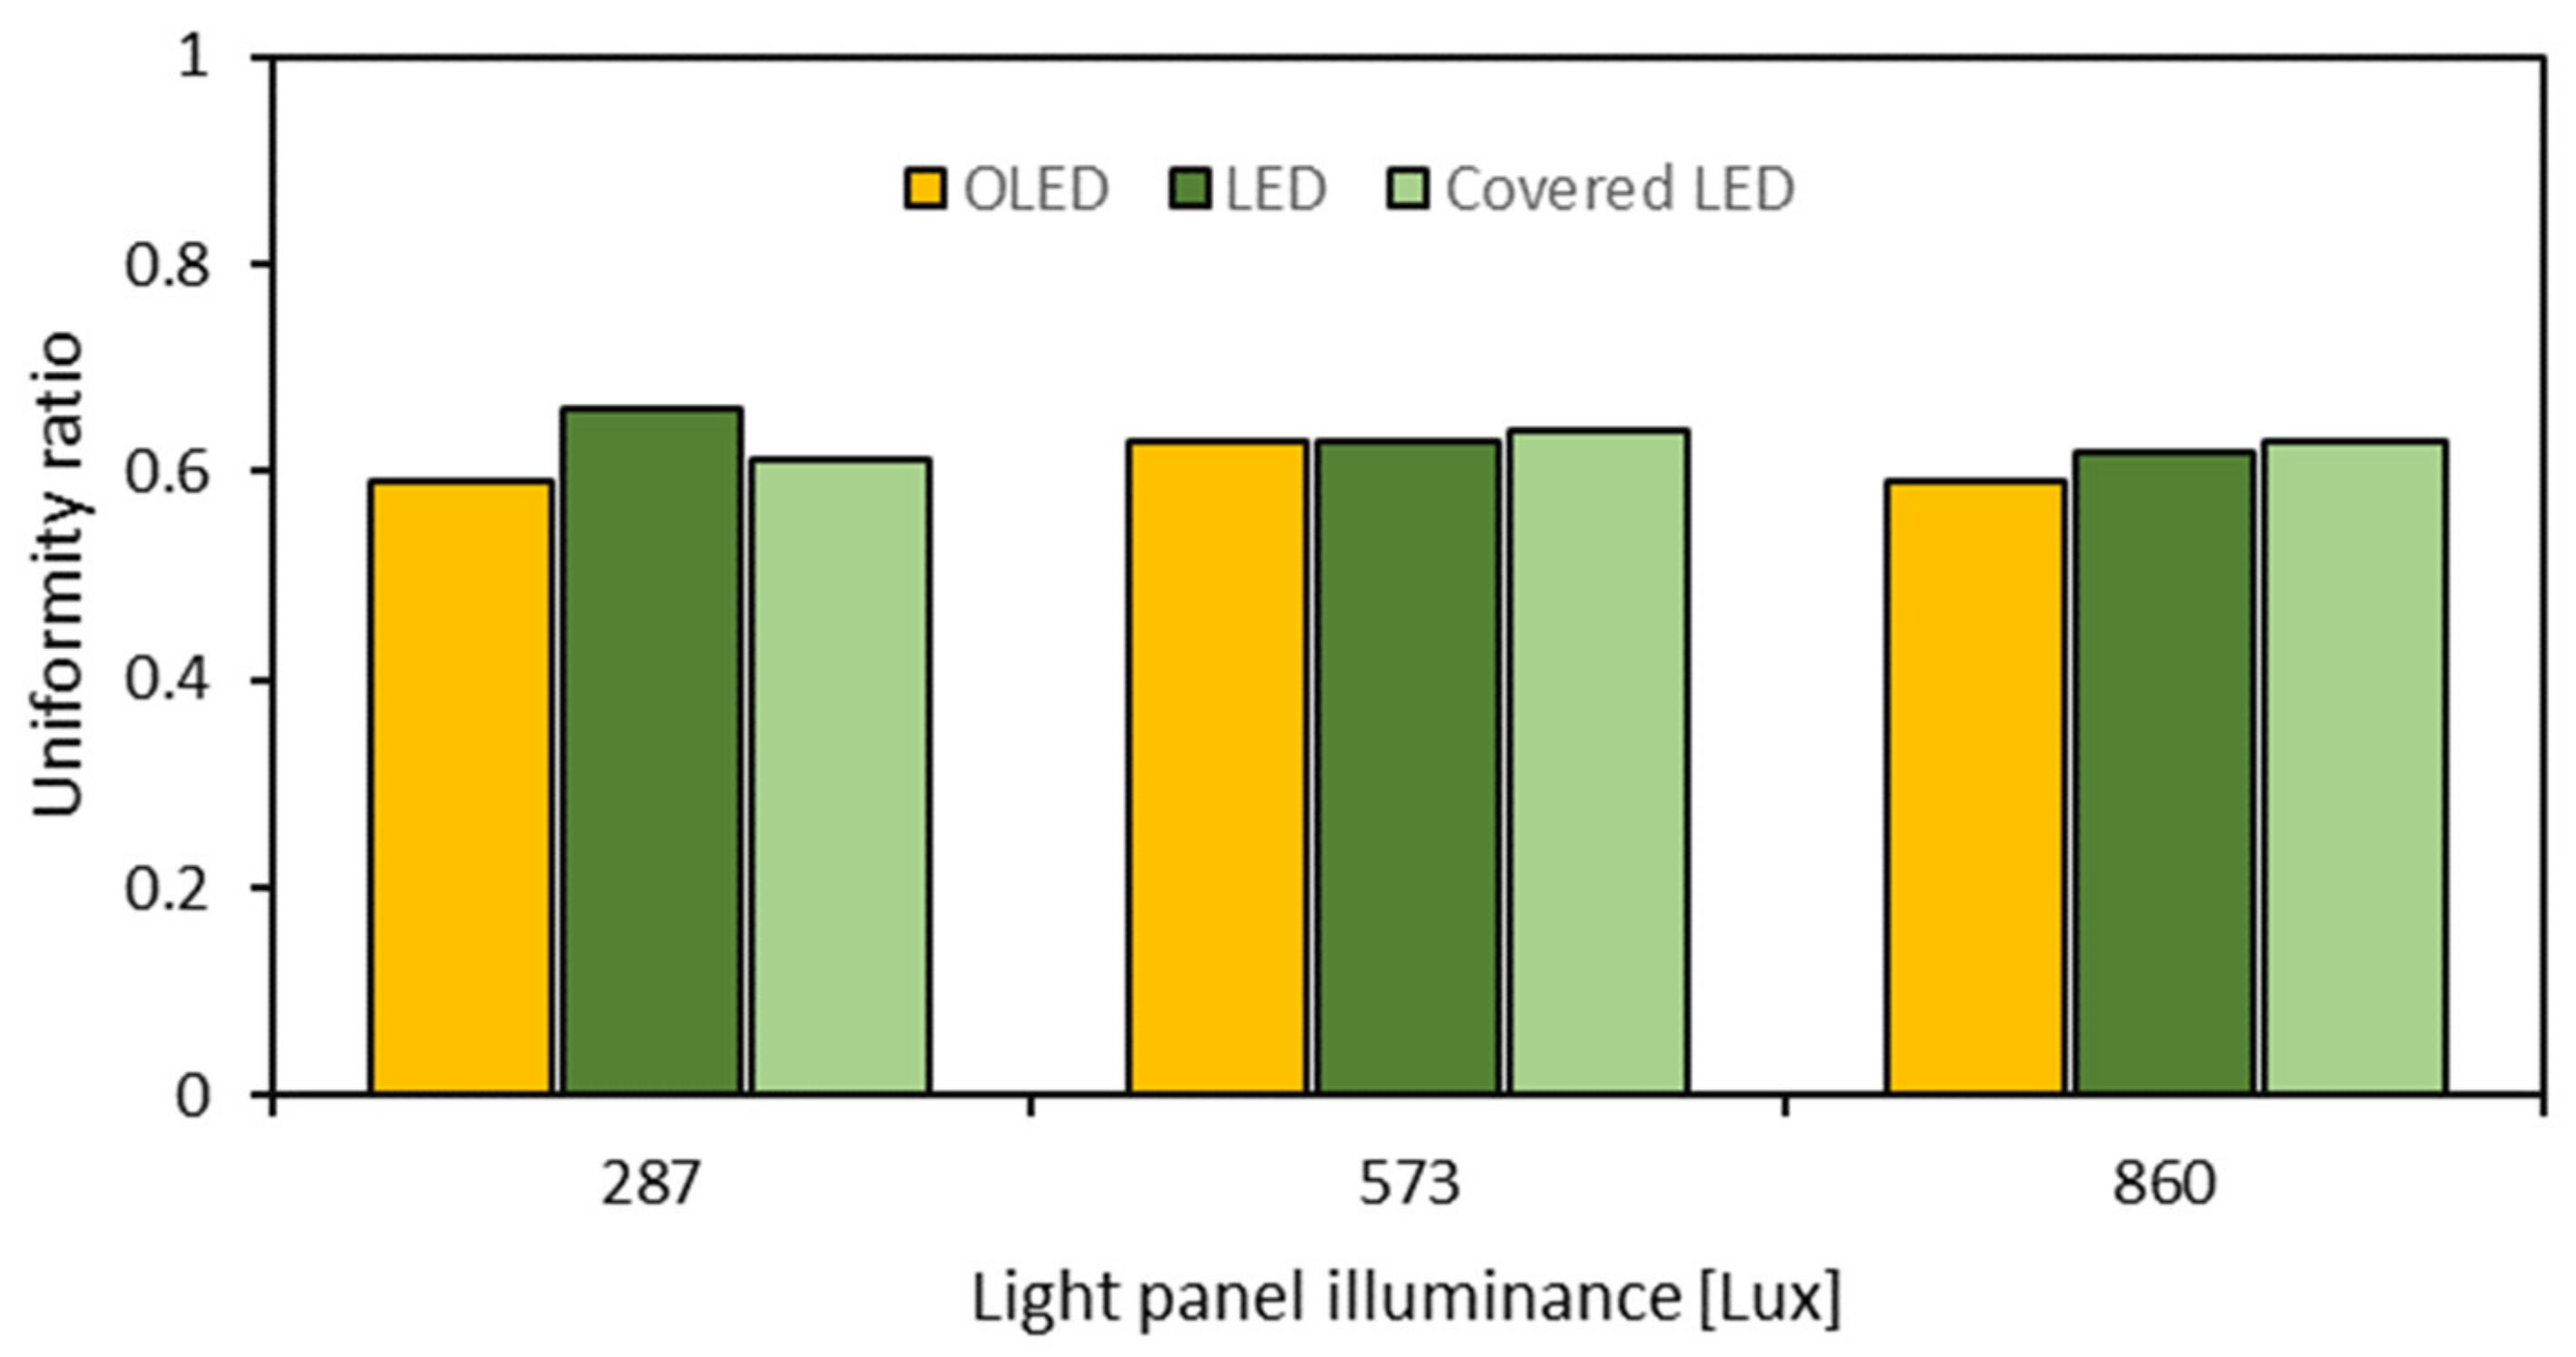
2.3. Photometric Measurements

Spectral power distribution (SPD) at different illuminance levels was measured using a spectrometer (Avec-3648 UV/VIS). In addition, the average horizontal illuminance at the workspace was determined from the illuminance levels at 25 points uniformly distributed across the workspace area using an illuminance meter (Testo 540) at a point 1.7 m vertically below the mounted light panels. Table 1 shows the specifications of the equipment used to measure SPD and workspace illuminance. Figure 3 shows the SPD associated with each light source as measured by the spectrometer.
Furthermore, to ensure that the light level reaching the desks where the participants filled the questionnaire forms was the same for all the three lighting conditions, the illuminance levels on the desk under the three lighting conditions were measured. The measurements were conducted five times under three different light panel illuminances (i.e., 287 lux, 573 lux, and 860 lux) and the average was calculated. Here the difference between light panel illuminance and desk illuminance is the distance where illuminance was measured. The light panel illuminance was measured at a distance of 30 mm below the light panel to ensure that the illuminance levels initially emitted by the three light panels were identical, whereas the desk illuminance was measured at 1.7 m below the light panel, directly in the center of the desk. The desk illuminance was relatively similar under the three lighting conditions. For example, the desk illuminance when the light panel illuminance was 287 lux for OLED lighting conditions, LED lighting conditions and covered LED lighting conditions were 255 lux, 267 lux, and 269 lux respectively, indicating no substantial differences in the desk illuminances among the three lighting conditions. Similarly, no substantial differences were observed at higher light panel illuminances (i.e., 573 lux and 860 lux). Furthermore, illuminance distribution was fairly the same under the three light conditions as measured by the uniformity ratio (See Figure 4). The uniformity ratio was determined as the quotient of the maximum and minimum illuminance levels among the 25 points uniformly distributed across the workspace.

2.4. Subjective Evaluation of Visual Comfort, Work Performance and Mood

Visual comfort was evaluated based on the subjective assessment of the presence of glare, preference, and brightness of the luminous conditions. Preference and brightness were rated on a seven-degree Likert scale with low values indicating increased preference/brightness and vice versa. The evaluation of perceived discomfort glare was conducted using two types of survey questionnaires, one of which assessed the presence of discomfort glare and the other assessed the tolerance level of discomfort glare. The presence of perceived discomfort glare was rated on a seven-degree Likert scale with 1 indicating “the presence of glare” and 7 indicating “no presence of glare”. The level of glare tolerance was ranked on a 1–4.5 scale developed by Hopkinson [12], with 1 indicating “just perceptible” and 4.5 indicating “intolerable”. Perceived productivity was assessed using subjective questionnaires, rated on a seven-point Likert scale with the low values indicating reduced productivity and the high values indicating increased productivity. The questionnaire used in the mood evaluation was based on the positive affect and negative affect schedule (PANAS) developed by Watson et al. [13]. This involves 20 items to report the participant mood, which are rated on a scale of 1–5, with 1 indicating “not at all” and 5 indicating “very much”. The evaluation of precision involved a simple task designed to assess how accurate the participants were in identifying errors in two similar rows of numbers. For example, the participants were given two sheets of paper with similar number patterns and tasked to identify where the number patterns differed under each luminous condition. The survey questionnaires were prepared both in English and Korean to prevent any language-related errors.

2.5. Quantifying Discomfort Glare

Discomfort glare was also assessed using the unified glare rating (UGR) index. UGR is widely used in the quantification of discomfort glare [14]. It considers three elements of a lit environment contributing to discomfort glare: the luminance ratio between the light source and its background, the size of the light source, and the position of the light source in reference to the line of vision. In the present study, a calibrated luminance measuring camera (Canon EOS 60D) was used to estimate the luminance ratio between the light source and its background. Several images of the light panel at different shutter speeds were taken and combined into a single high dynamic image using a processing software (i.e., Photolux). UGR values for the single high dynamic image were then extracted using the same processing software.

2.6. Estimating Circadian and Circadian Energy Elements

The potential effects of light on the circadian rhythm are well-documented in the scientific literature [15]. The processes that take place at the retina when it is exposed to light have been studied and reported [16]. Accordingly, Rea et al. [17] developed a model based on spectral-sensitivity data that explains circadian phototransduction, which is how the retina converts light signals to be used in the nonvisual processes of the human body. The model first estimates circadian light (CL) falling onto the cornea from spectral irradiance data. The CL is then converted into circadian stimulus, which represents the total amount of light required for melatonin suppression (MS). This model has been widely used and validated through several scientific studies [18,19,20]. Accordingly, the model was employed to estimate CL and MS values for each light panel. Equations (1) and (2) summarize the circadian-phototransduction model outlined by Rea et al. [17].
C L = [ ( a 1 P λ M λ d λ b 1 ) + a 2 ( P λ S λ d λ k P λ V 10 λ ) b 2 ] a 3 ( 1 e P λ V   λ d λ r o d S a t For   P λ S λ d λ k P λ V λ d λ k P λ V 10 λ d λ 0
C L = a 1 P λ M λ d λ b 1 For   P λ S λ d λ k P λ V λ d λ k P λ V 10 λ d λ < 0
where M λ denotes the melanopsin-containing retinal-ganglion-cell spectral-efficiency function peaking at 480 nm, V 10 λ denotes the large-field L+M-cone spectral-efficiency function, V λ denotes the rod spectral-efficiency function, P λ denotes the S-cone spectral-efficiency function, and P λ denotes the spectral radiance at the eye. The parameters, K , a 1 , a 2 , and a 3 , represent the interactions among photoreceptor types: K = 0.31 , a 1 = 0.285 , a 2 = 0.2 , and a 3 = 0.72 . The constants, b 1 , b 2 , and rodSat, represent the thresholds and dynamic characteristics of the photoreceptor types: b 1 = 0.01 , b 2 = 0.001 , and rodSat = 6.5.
CE was also computed. It is defined as the ratio of the circadian luminous flux to the radiant flux of a light source [21]. In essence, it provides an estimate of how a given light source is likely to impact the circadian properties while, at the same time, considering the energy efficiency of the said light source. The CE was obtained from Equation (3) below.
C E = α C L W
where α = L E C L W , with LE representing luminous efficacy and W the light-source watt power. Two variants of CE depending on two different values of the light-source power were calculated: nominal CE and effective CE. Nominal CE was calculated based on LE as reported by the manufacturer of the light panels, and effective CE was calculated based on the calculated LE considering the actual room area, number of light panels, and their wattage values. In addition, the circadian action factor (CAF) was calculated as the ratio of CE to LE indicating circadian action per unit visual response.

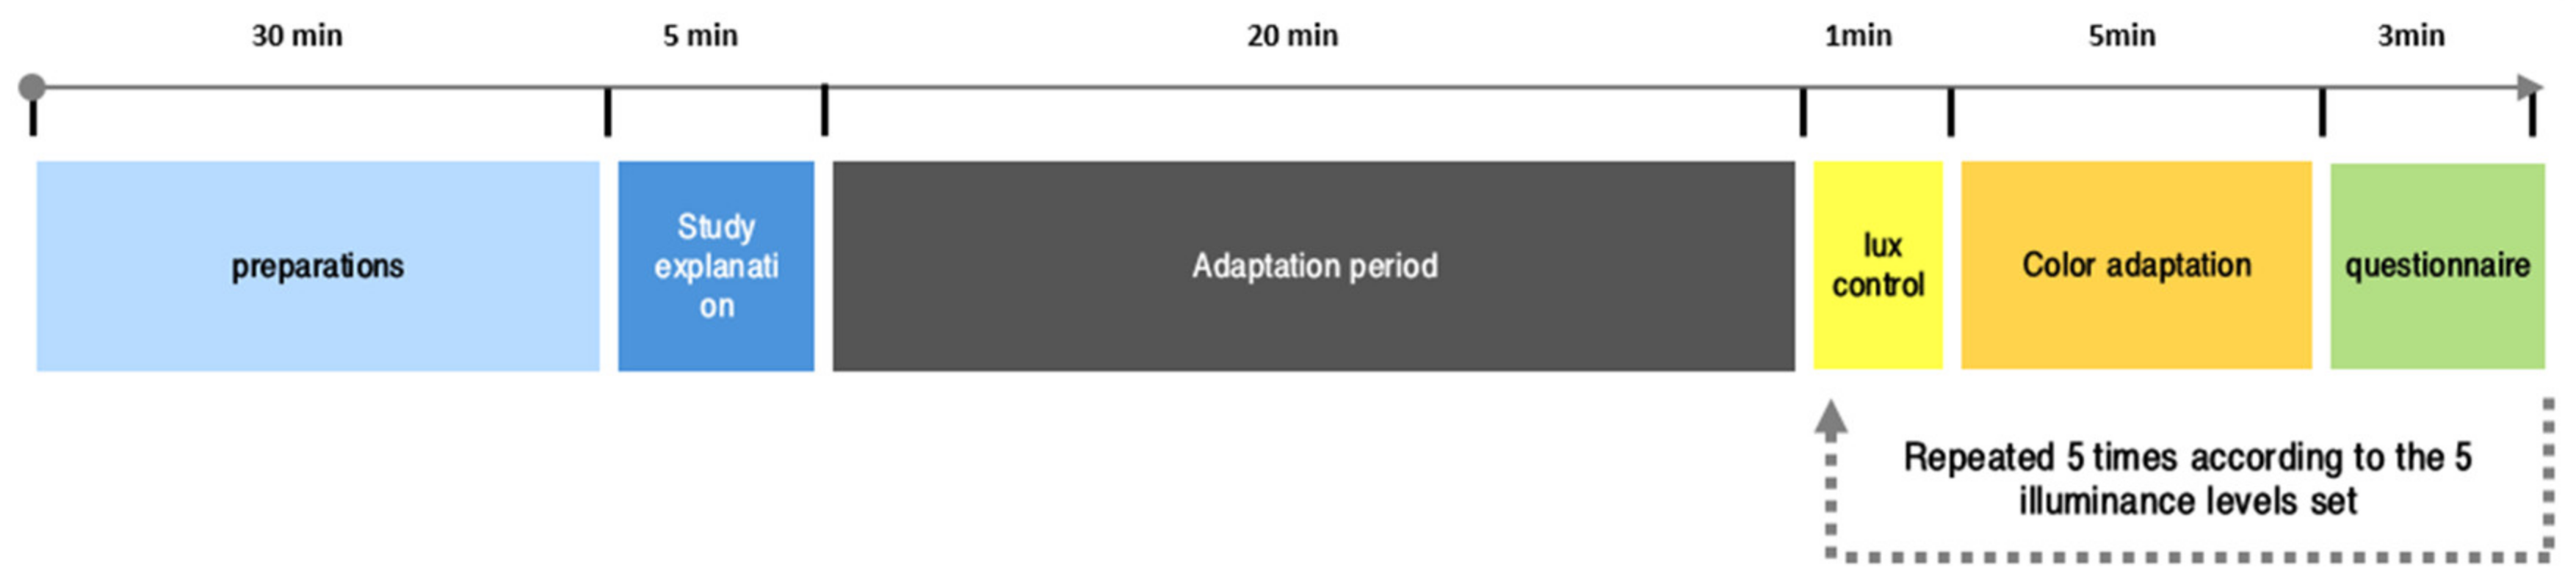
2.7. Experimental Protocol

On the day of the experiment, the first 30 min were used to set up the experiment room and other general preparations, such as setting up chairs for the participants. The following 5 min were used to explain the study to the participants. The participants were then allowed 20 min to adapt to the experimental lighting conditions. Thereafter, two participants at a time were asked to evaluate the luminous conditions using the survey questionnaires discussed in Section 2.4. This was repeated five times to cover the five illuminance conditions discussed in Section 2.1. Furthermore, for the entire experiment, the participants were chosen randomly and sent into the room to begin their evaluations. They were not aware of the type of light panel they were evaluating. In addition, there was no specific order upon which the light panels were evaluated. Figure 5 illustrates the experiment protocol.

2.8. Statistical Analysis

Differences in the subjective evaluations and photometric performance of the luminous conditions were assessed using the paired samples t-test and analysis of variance. The assumption of normality was assessed using the “skewness” and “kurtosis” criteria; “skewness” and “kurtosis” values between −1 and 1 generally indicate normal distribution. Failure to meet the normality assumption was treated with Templeton’s transformation [22]. Statistical significance was determined at p < 0.05 for all tests.

3. Results

3.1. Circadian and Circadian Energy Elements

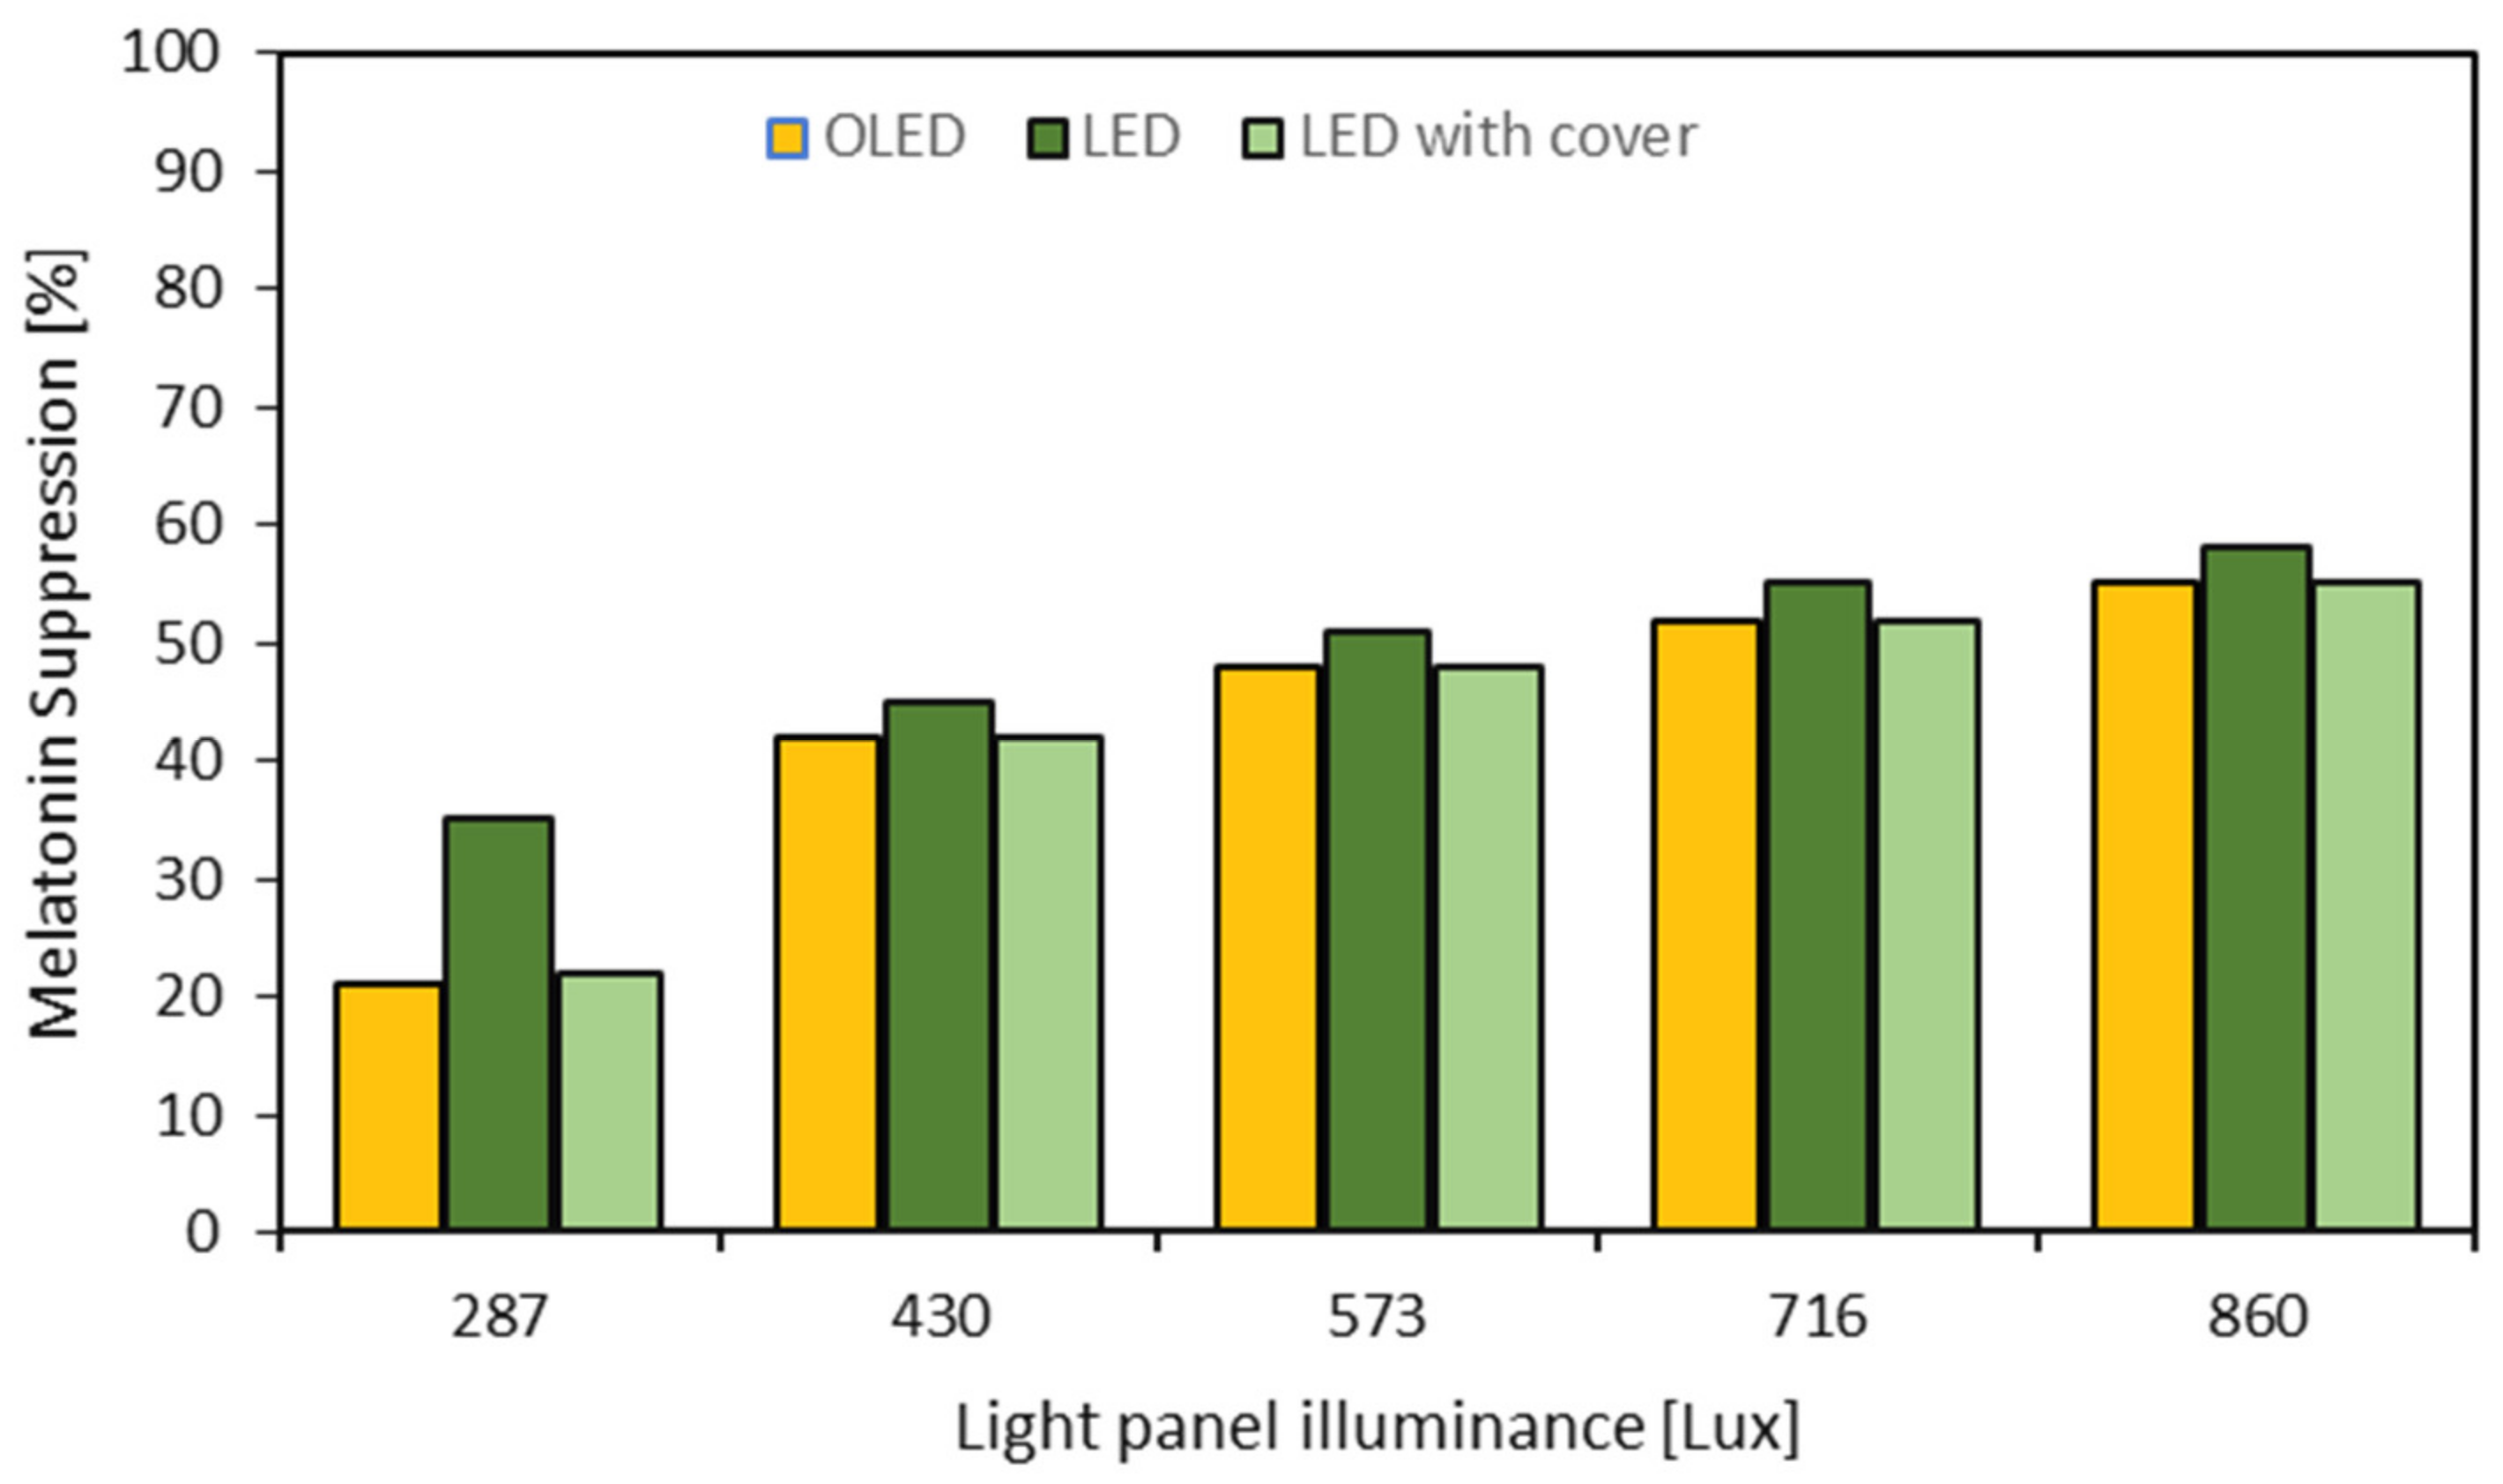
3.1.1. Melatonin Suppression (MS) and Circadian Light (CL)

Figure 6 compares the MS by the OLED, LED and covered LED panels. As shown in the figure, the results show that the mean percentage suppression was lower under OLED lighting conditions than under both LED and covered-LED luminous conditions, further emphasizing the potential influence of SPD on MS. In addition, MS increased with an increase in illuminance levels. Moreover, the difference in melatonin-suppression levels among the lighting conditions was more pronounced at low illuminance levels (287 lux) than at high illuminance levels (480, 573, 716, and 860 lux). These differences were also statistically significant at all illuminance levels: 287 lux [F (2,6) = 34.841, p-value < 0.005], 430 lux [F (2,6) = 17.333, p-value < 0.005], 573 lux [F (2,6) = 42.000, p-value < 0.005], 716 lux [F (2,6) = 73.000, p-value < 0.005], and 860 lux [F (2,6) = 73.000, p-value < 0.005].
Table 2 compares the CL performance between the OLED light source and the LED light source. As shown from the figure, the OLED light source emits more CL than the LED light source. To provide a performance comparison with other common light sources, CL performances of the CIE D65 illuminant (a representative of natural daylight), a 1000 CCT incandescent lamp, and a 1000 CCT fluorescent lamp are also presented (See Table 2). Among all the light sources, the CIE D65 illuminant emits the highest CL levels while the fluorescent lamp emits the least levels of CL. Moreover, compared to the solid-state light sources, the incandescent light source and fluorescent lamps emit much less CL levels.

3.1.2. Effective and Nominal Circadian Energy

Table 3 compares the CE and LE between the OLED and the LED light sources. As seen from the figure, the LED light source has higher CE and LE than the OLED light source. Again, for comparison with common light sources, including daylight, circadian and luminous efficacies of common light sources presented (see Table 3). As shown in the table, the CIE D65 illuminant (i.e., representative of sunlight) showed the highest CE (304.45 CL/W) and LE (120 lumens/W). In contrast, the incandescent lamp showed the lowest CE (7.51 CL/W) and LE (7.51 lumen/W). Interestingly, comparing the OLED light source with the LED light source, the circadian-to-visual ratio was higher under OLED light conditions (1.33) than the LED light conditions (1.08). Additionally, among the considered light sources, the CIE D65 illuminant indicated the highest circadian-to-visual ratio (2.54), while the fluorescent lamp showed the lowest circadian-to-visual ratio (0.77).
Table 4 shows similar comparisons as those in Table 3 above but focusing on the nominal circadian efficacy. As seen from the table, there is a relatively large difference between the nominal CE by the OLED light source (78.81 CL/W) and the LED light source (142 CL/W). Similarly, the LED light source showed a relatively higher LE (100 lumens/W) than the OLED light source (45 lumens/W). For comparison purposes, nominal circadian efficacies and nominal luminous efficacies of common light sources are also presented (See Table 4). Among the considered light sources, the CIE D65 illuminant indicated the highest CE (399.9 CL/W) and LE (120 lumens/W). In comparison, the incandescent lamp was associated with the lowest CE (10.50 CL/W) and LE (7.53 lumen/W). Additionally, comparing the nominal circadian-to-visual ratio between the OLED light source and the LED light source, the results showed a higher circadian-to-visual ratio under the OLED light source than under the LED light source. In addition, comparing the circadian-to-visual ratio of common light sources, the CIE D65 illuminant showed the highest ratio (3.33) while the fluorescent lamp showed the lowest ratio (0.81).

3.2. Visual Comfort

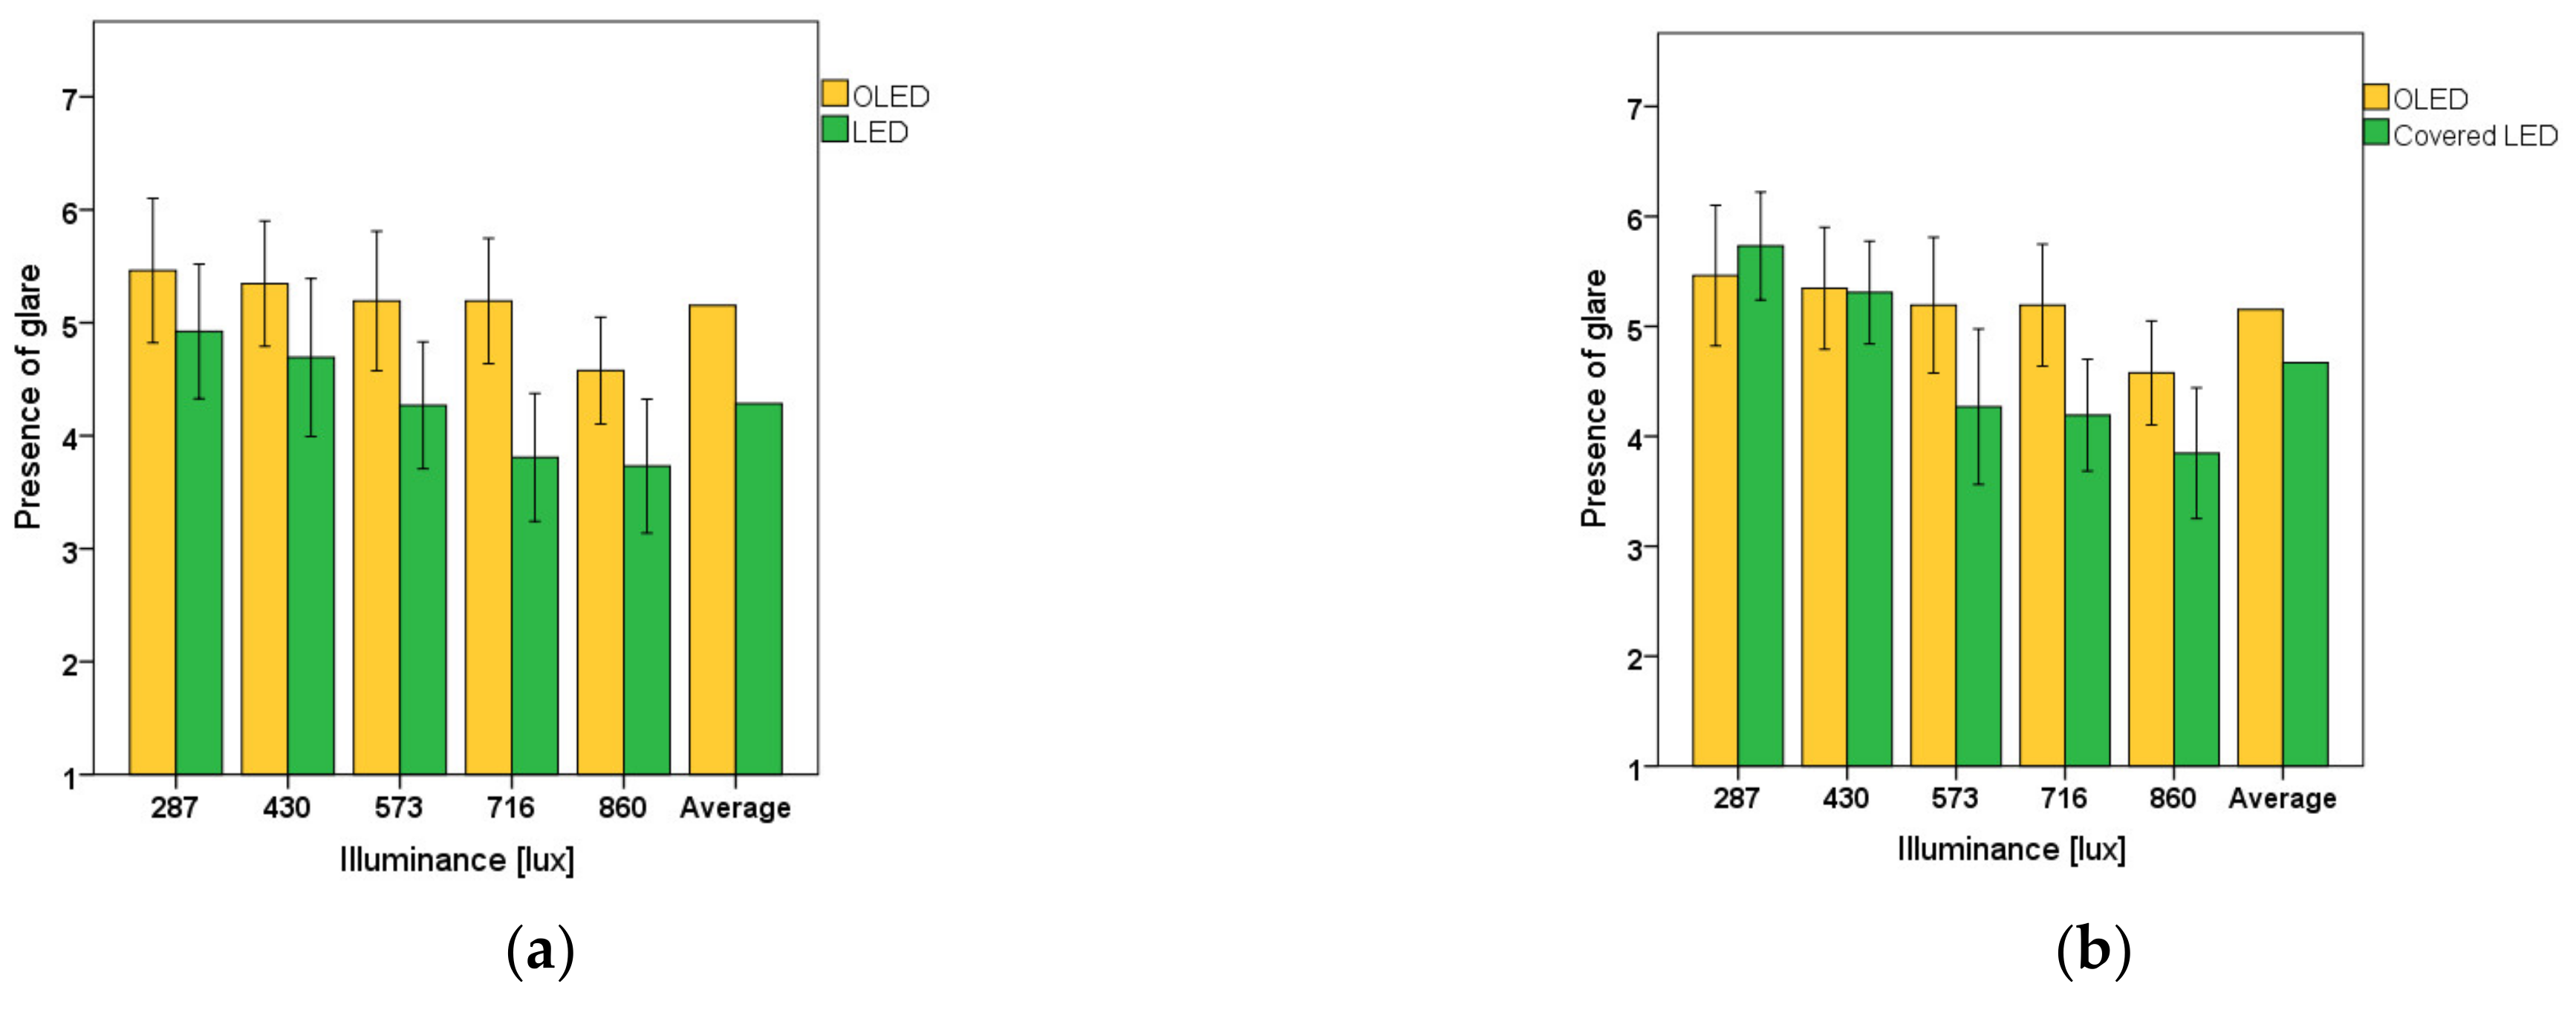
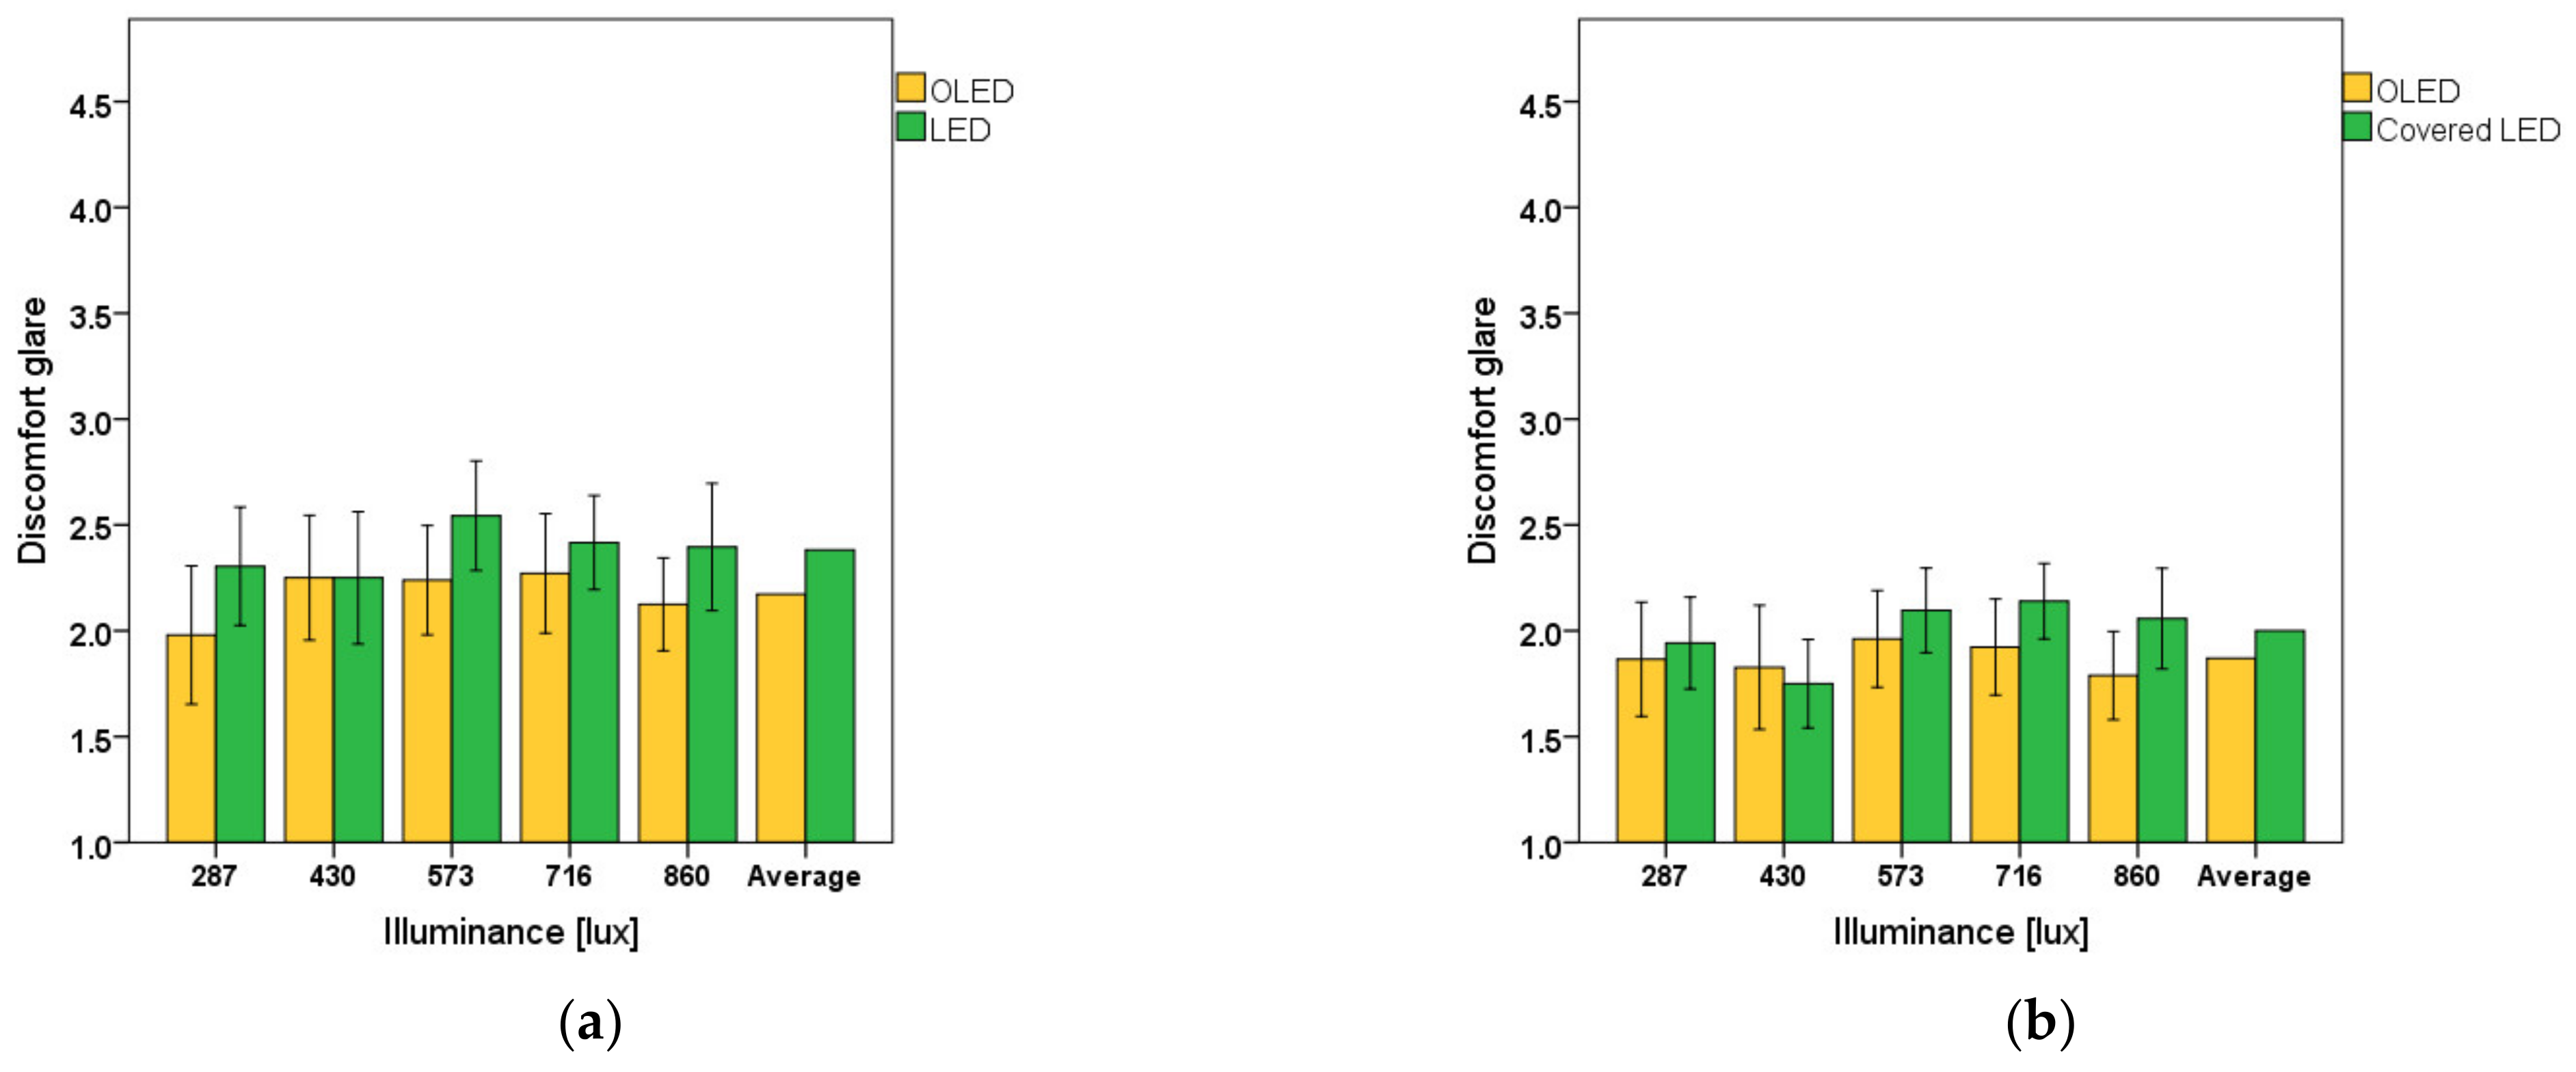
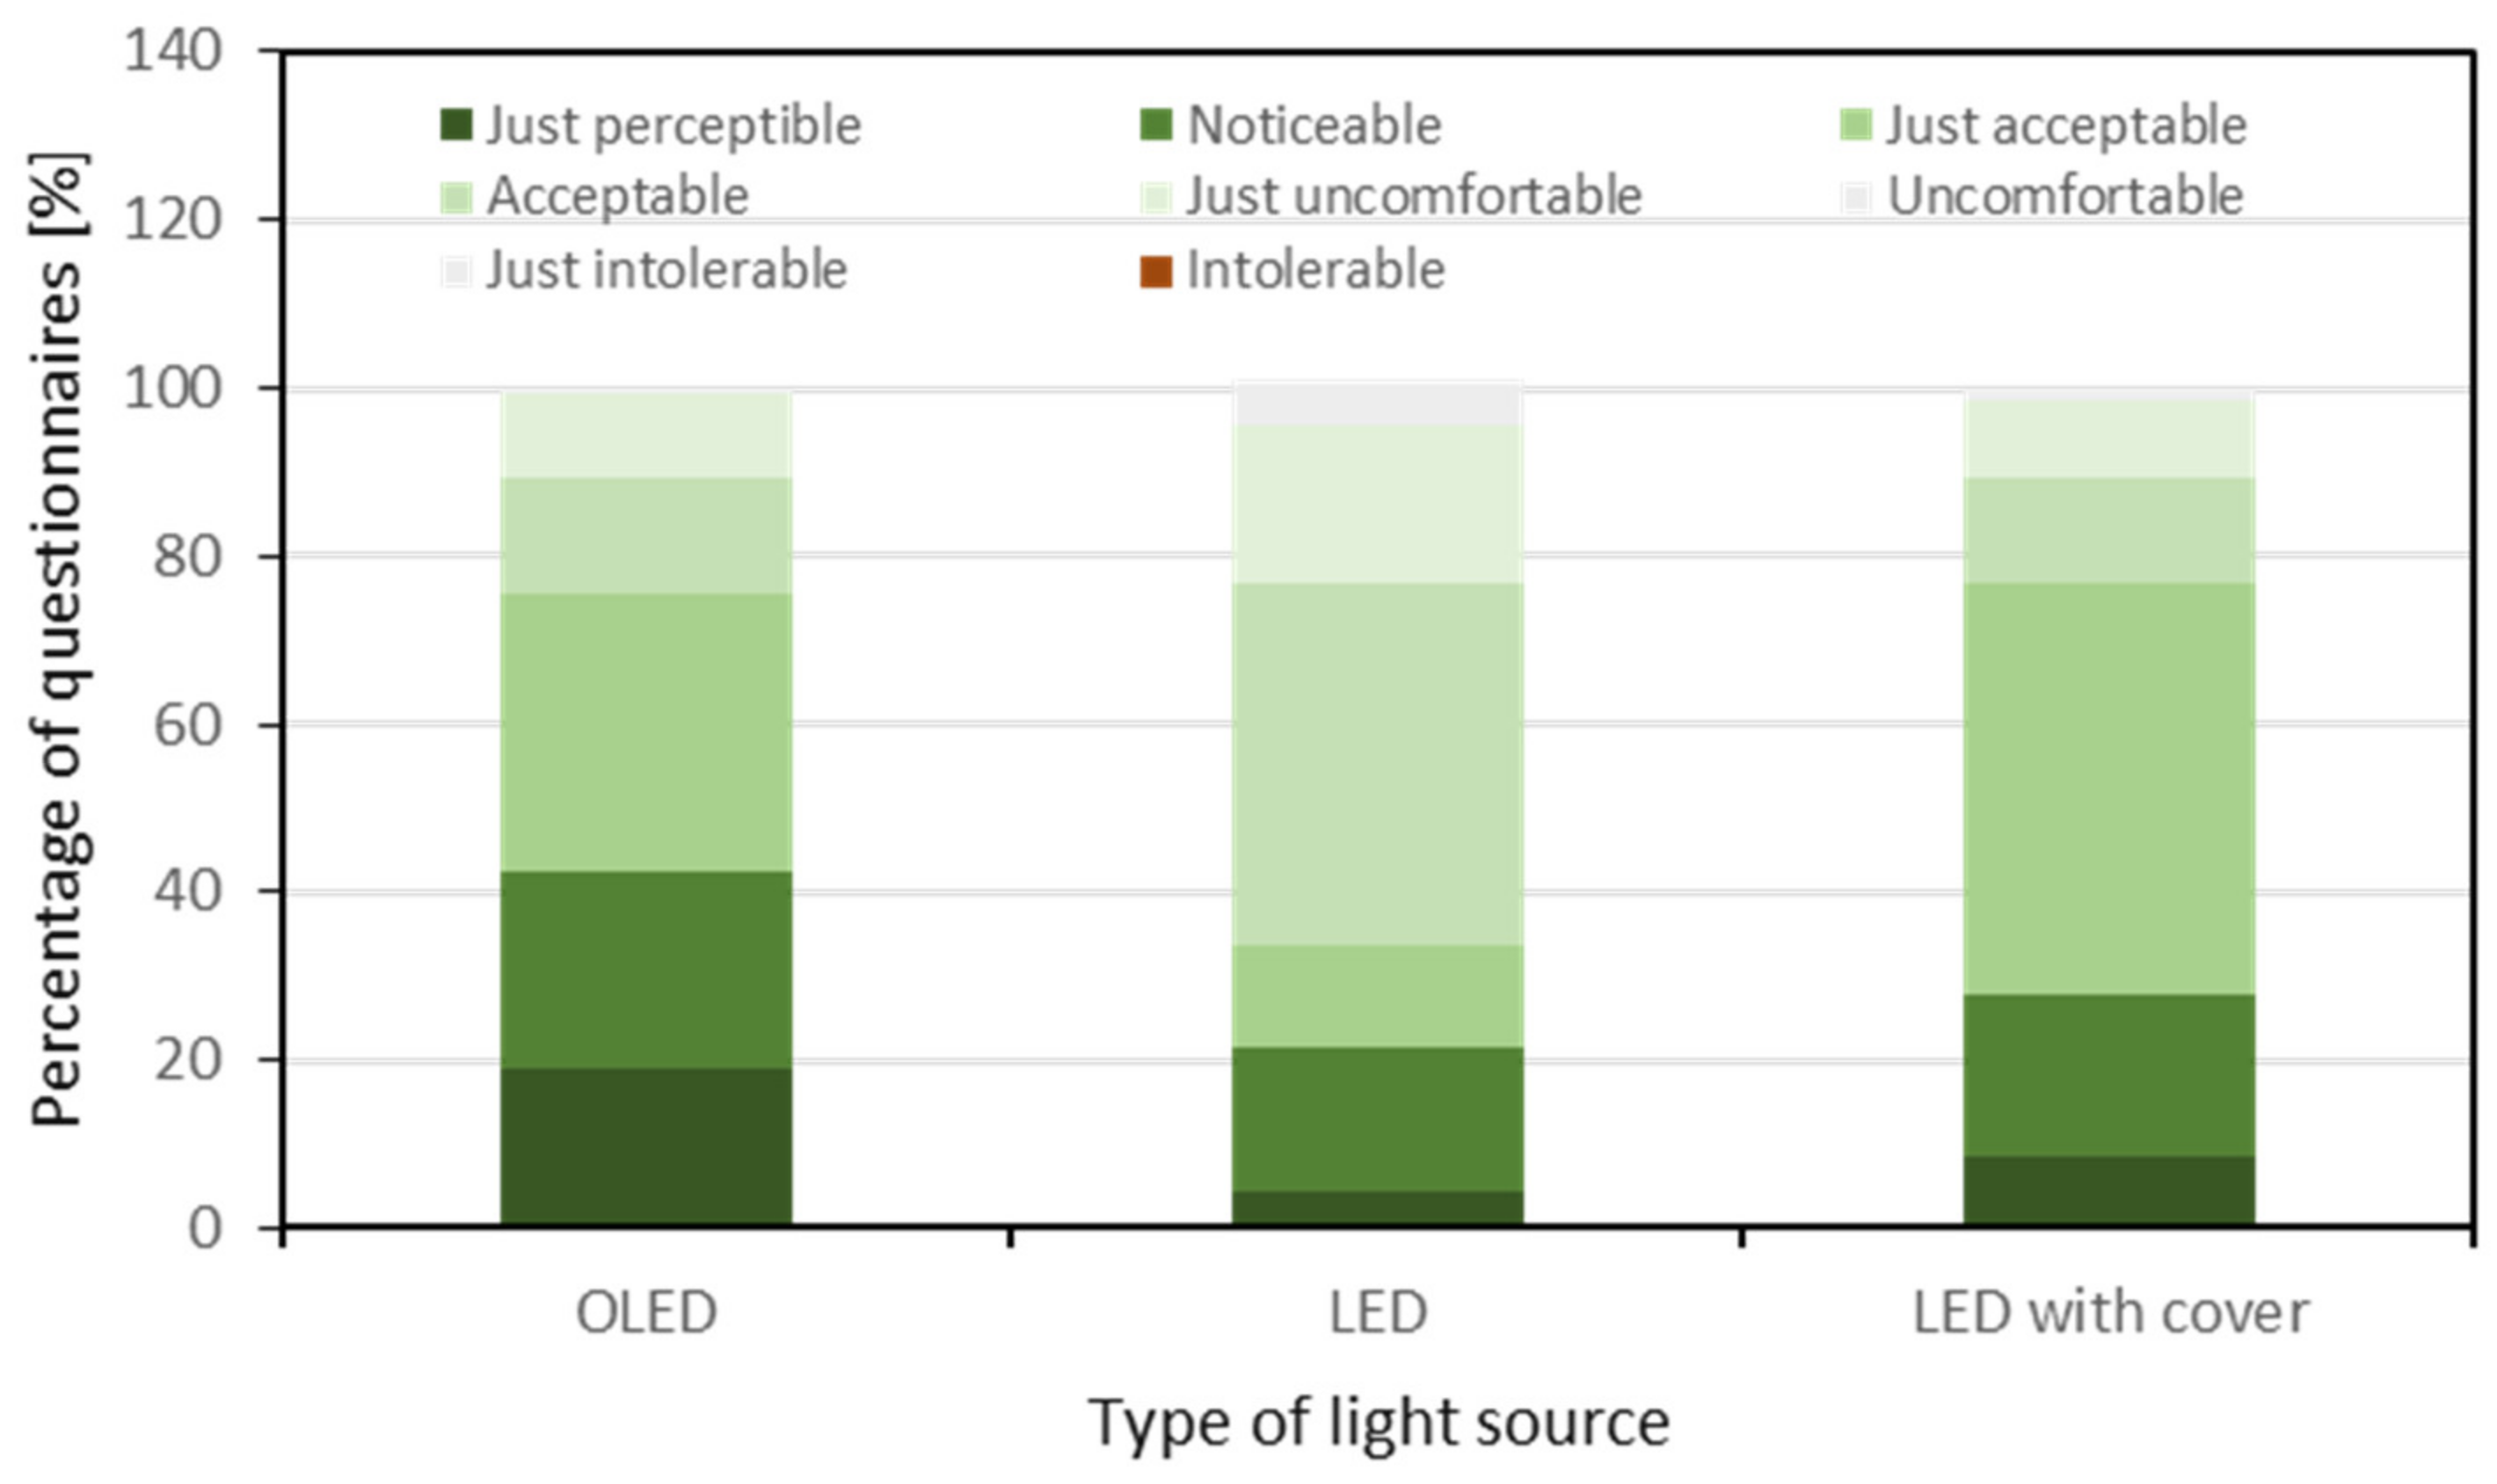
3.2.1. Discomfort Glare

Discomfort glare was assessed in terms of perceived discomfort glare, tolerance of glare and objectively using the unified glare rating index. In regard to perceived glare, the participants experienced lower levels of discomfort glare under OLED lighting conditions than under LED lighting conditions. The difference in the subjective evaluation of perceived discomfort glare was also statistically significant at high illuminance levels: 573 lux [T (50) = 2.212, p-value < 0.005], 716 lux [T (50) = 34.94, p-value < 0.005], and 860 lux [T (50) = 2.23, p-value < 0.005]. Alternatively, the difference in the subjective rankings of discomfort glare between OLED and covered-LED lighting conditions was, on average, marginal. These differences were also not statistically significant, except at the illuminance level of 573 lux [T (50) = −2.244, p-value < 0.005]. Figure 7 shows the differences in the subjective rating of the presence of discomfort glare between the OLED, LED, and covered-LED luminous conditions.
Figure 8 shows the difference in the subjective ranking of glare tolerance among the three luminous conditions. The results suggest that, on average, discomfort glare under OLED lighting conditions was more tolerable than glare under both LED and covered-LED lighting conditions. However, these differences were not statistically significant.
According to the survey-response votes, roughly 19%, 4%, and 8% of participants evaluated the glare tolerance to be “just perceptible” with respect to OLED, LED, and covered-LED lighting conditions, respectively. In addition, the majority of survey-response votes for LED and covered-LED lighting conditions belonged to the upper categories on the Hopkinson scale [12], whereas the majority of survey-responses under OLED belonged to the lower categories on the said scale. This further highlights the increased tolerability of glare under OLED lighting conditions than under both LED and covered-LED lighting conditions. Figure 9 shows the distribution of discomfort-glare rankings under all three luminous conditions.
Considering the objective assessment of discomfort glare (i.e., using the UGR index), the OLED light panel had the lowest UGR value, followed by the covered LED and then the LED lighting. Taking a UGR value of 28 as the maximum acceptable value for indoor discomfort glare, the OLED light panel at 287 lux (UGR = 25.5) and 430 lux (UGR = 27.3) and the covered-LED light panel at 287 lux (UGR = 26.7) provided a glare-free environment. Figure 10 compares the UGR values among the three light panels, from which it is evident that the glare under LED lighting conditions increased with an increase in illuminance levels, whereas, under OLED lighting conditions, glare-level changes were relatively minor with changing illuminance levels.

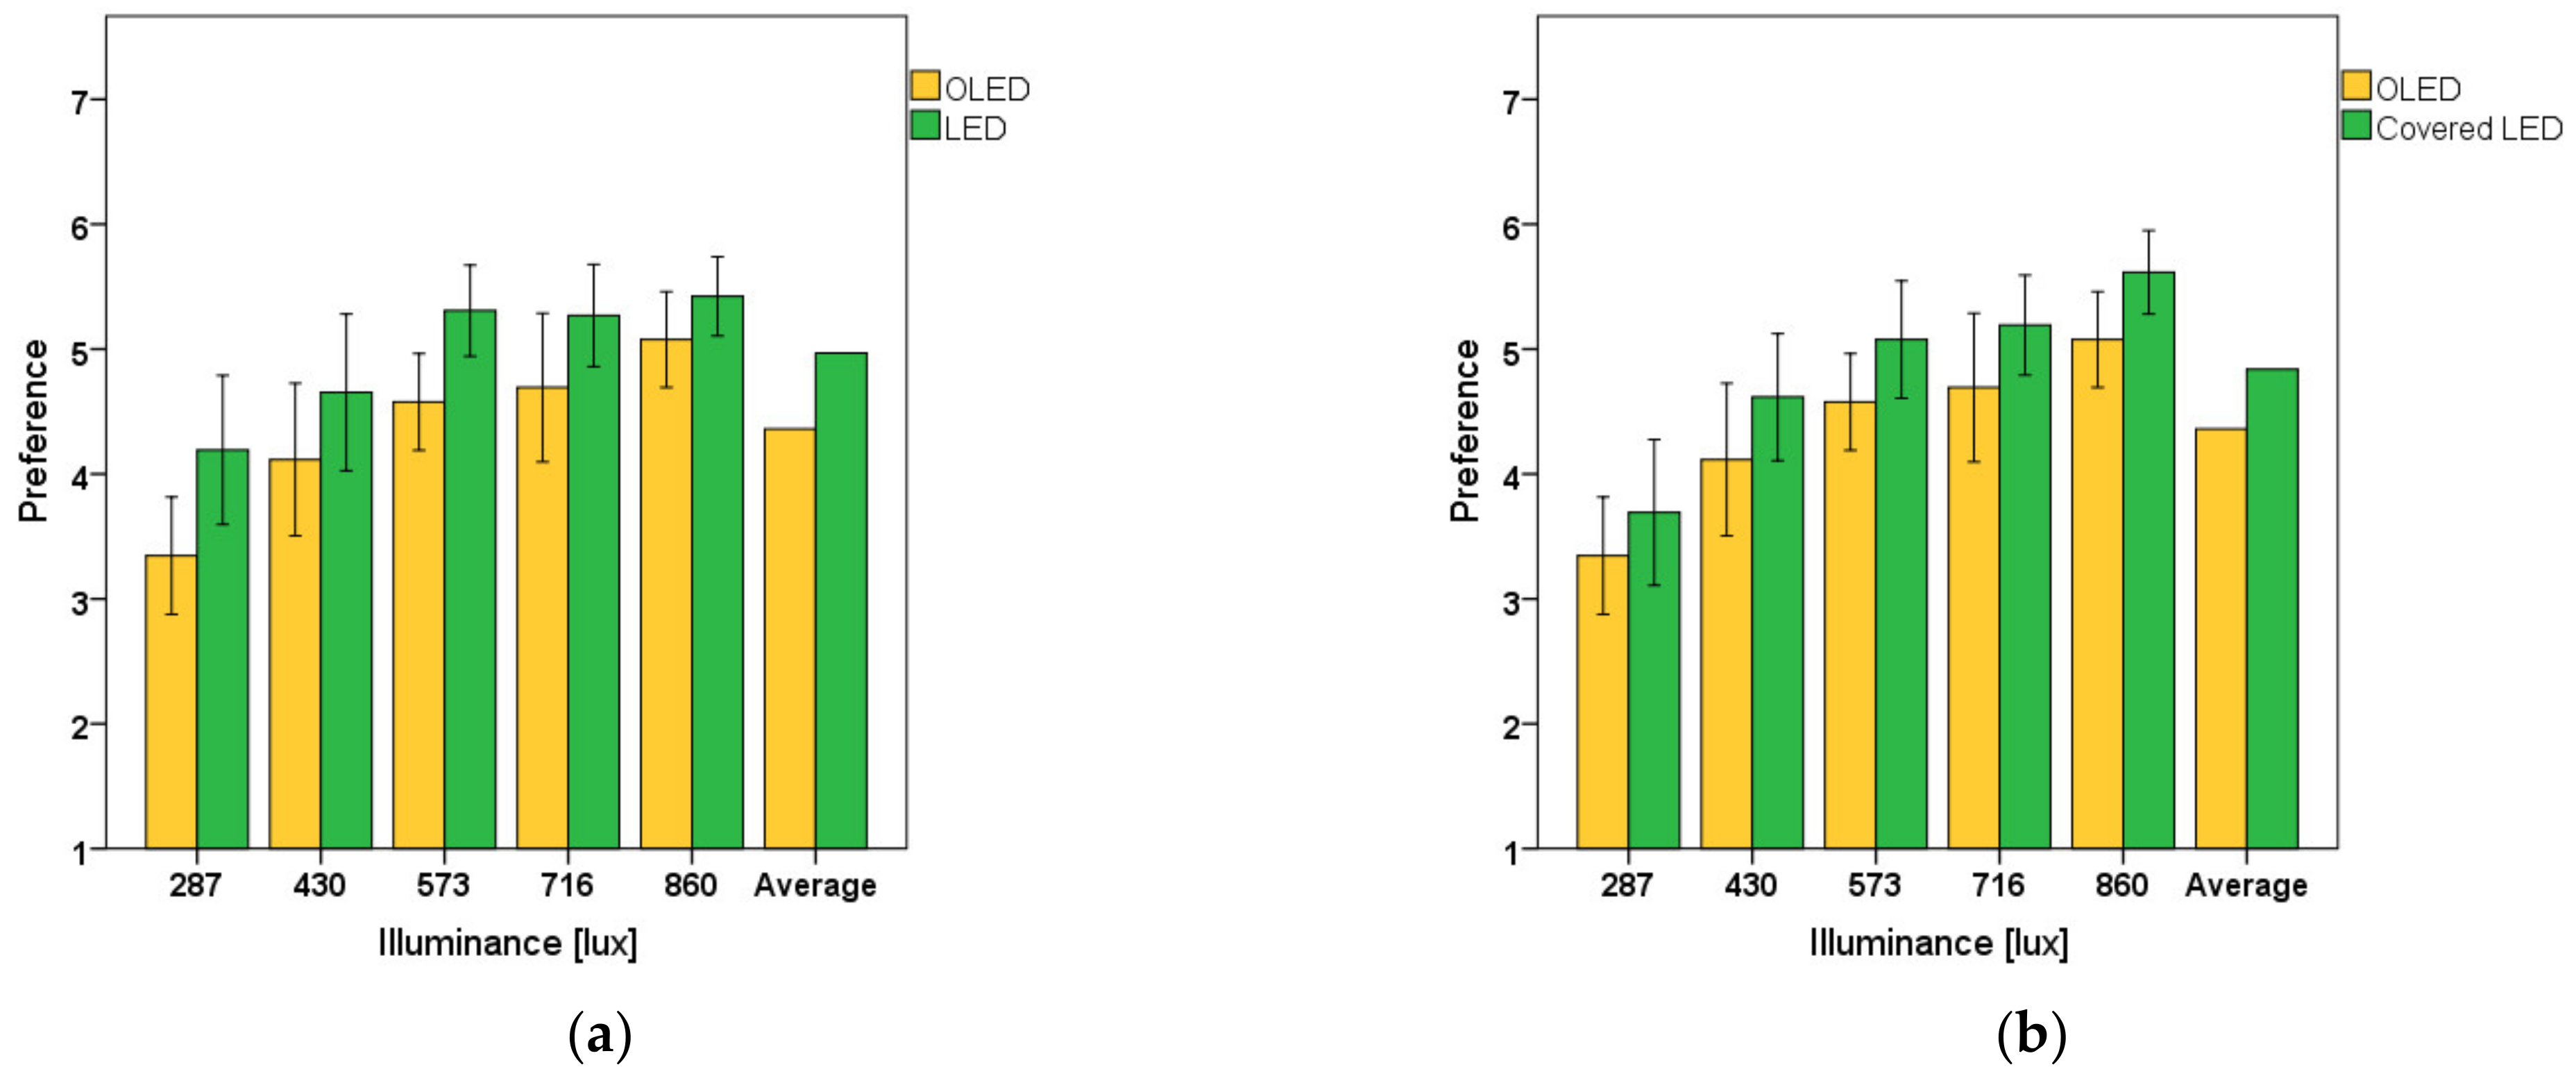
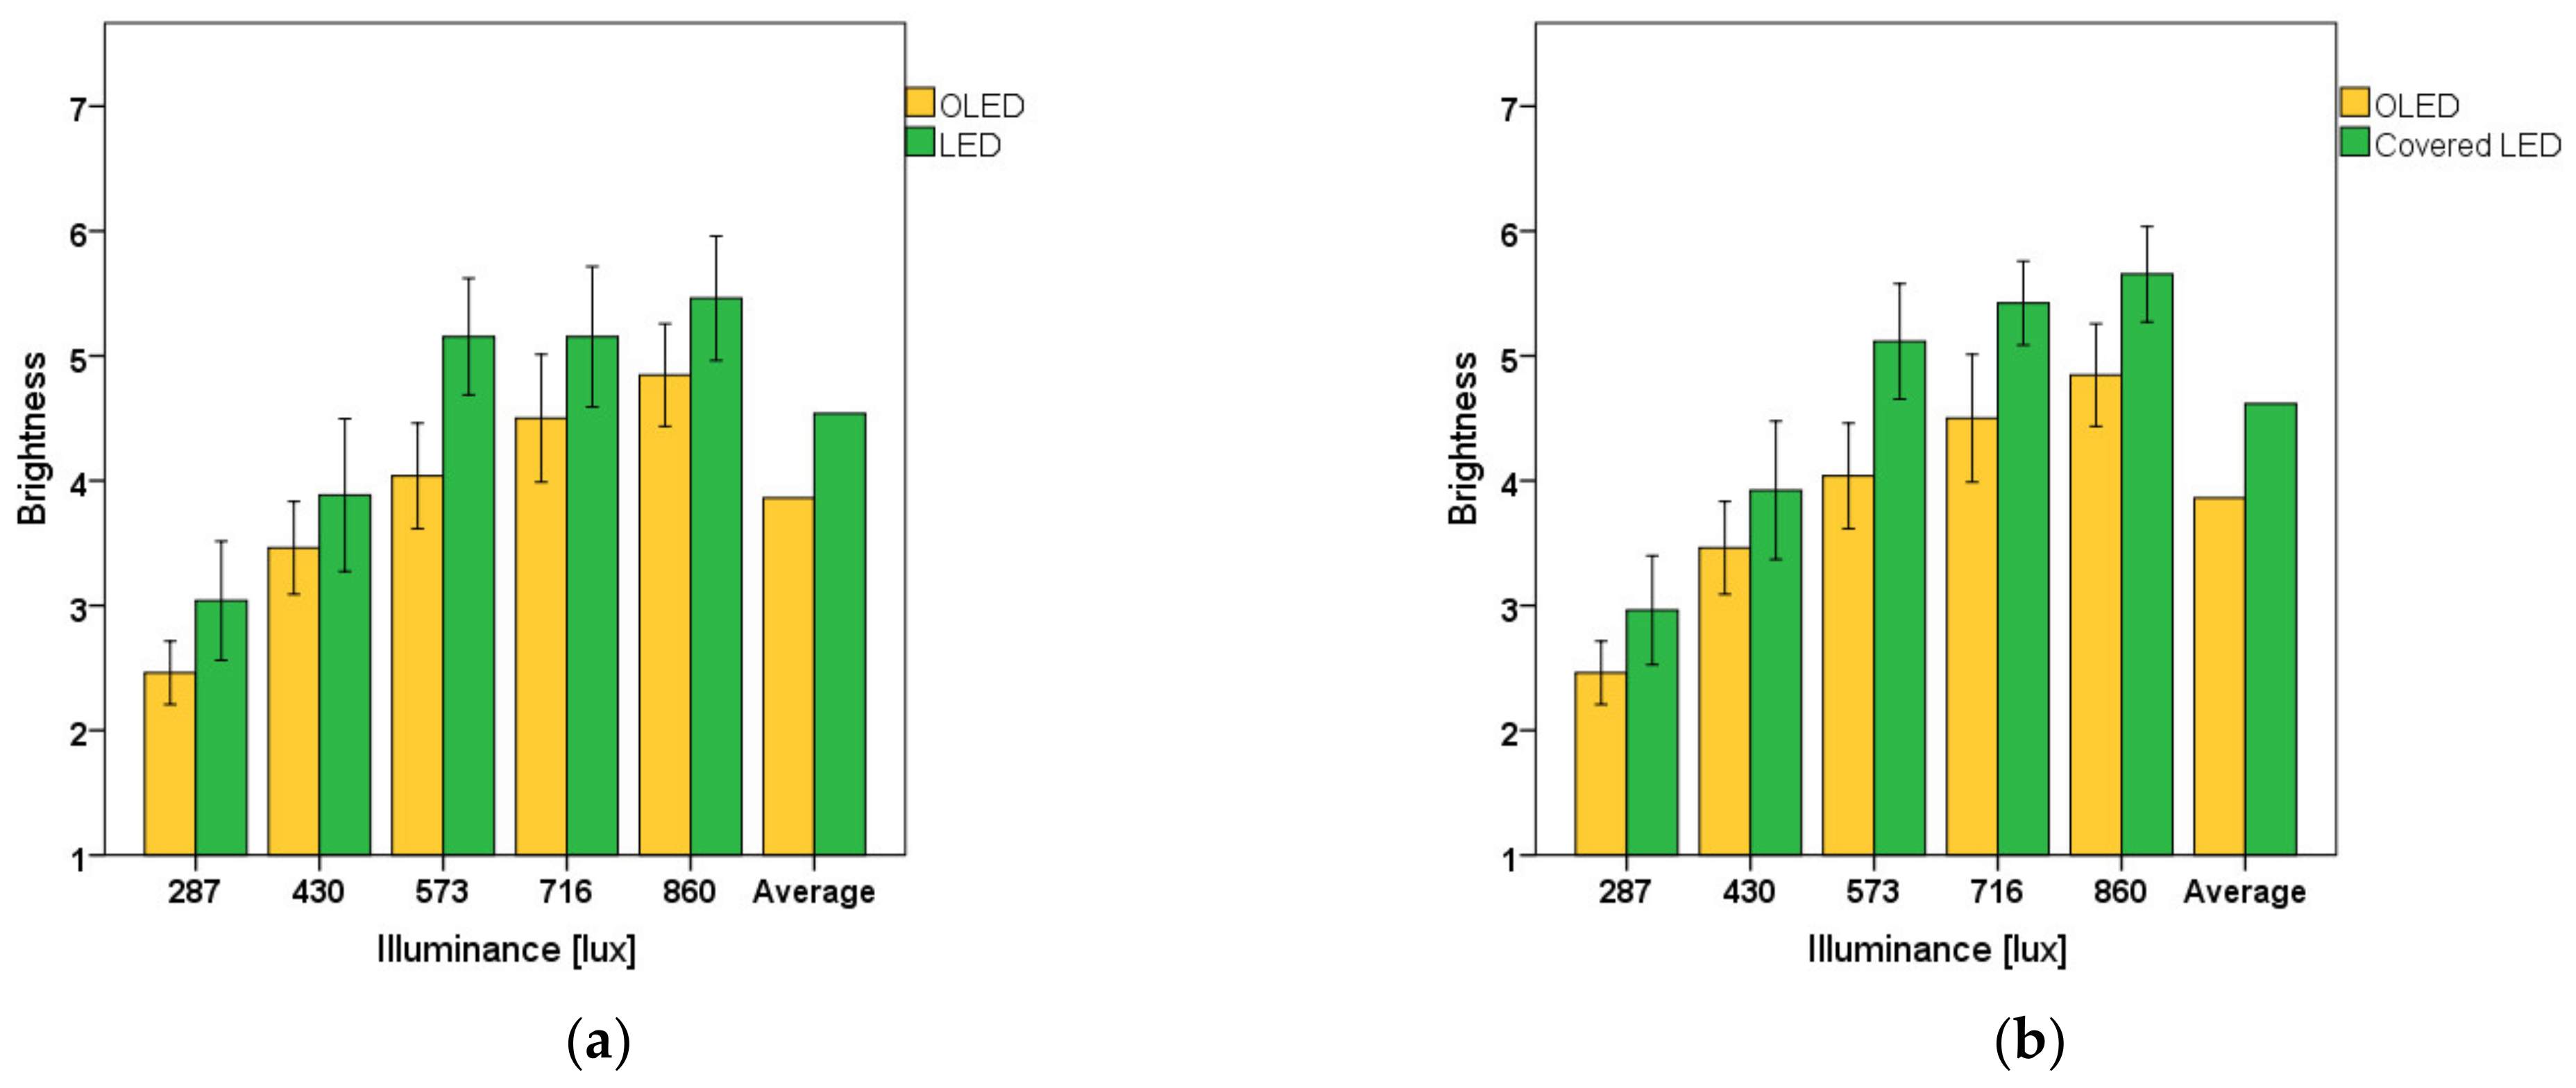
3.2.2. Preference and Brightness

Figure 11 shows the difference in preference under different luminous environments. On average, participants preferred LED lighting conditions over OLED lighting conditions. Subsequent t-test analyses also indicated statistically significant differences in preference levels under OLED and LED lighting conditions at 287 and 430 lux, respectively. There were also differences in preference levels under the OLED and covered-LED lighting conditions, but these were not statistically significant.
Figure 12 shows the difference in perceived brightness under different luminous environments. On average, participants experienced more brightness under LED lighting conditions than under OLED lighting conditions, even though both lighting sources emitted the same luminance levels. In addition, the follow-up t-test results suggest that observed differences were statistically significant at 287 lux [T (50) = −2.136, p-value < 0.005] and 573 lux [T (50) = −3.545, p-value < 0.005]. In addition, participants experienced more brightness under covered-LED lighting conditions than under OLED lighting conditions. However, the mean difference was not statistically significant.

3.3. Work Performance and Mood

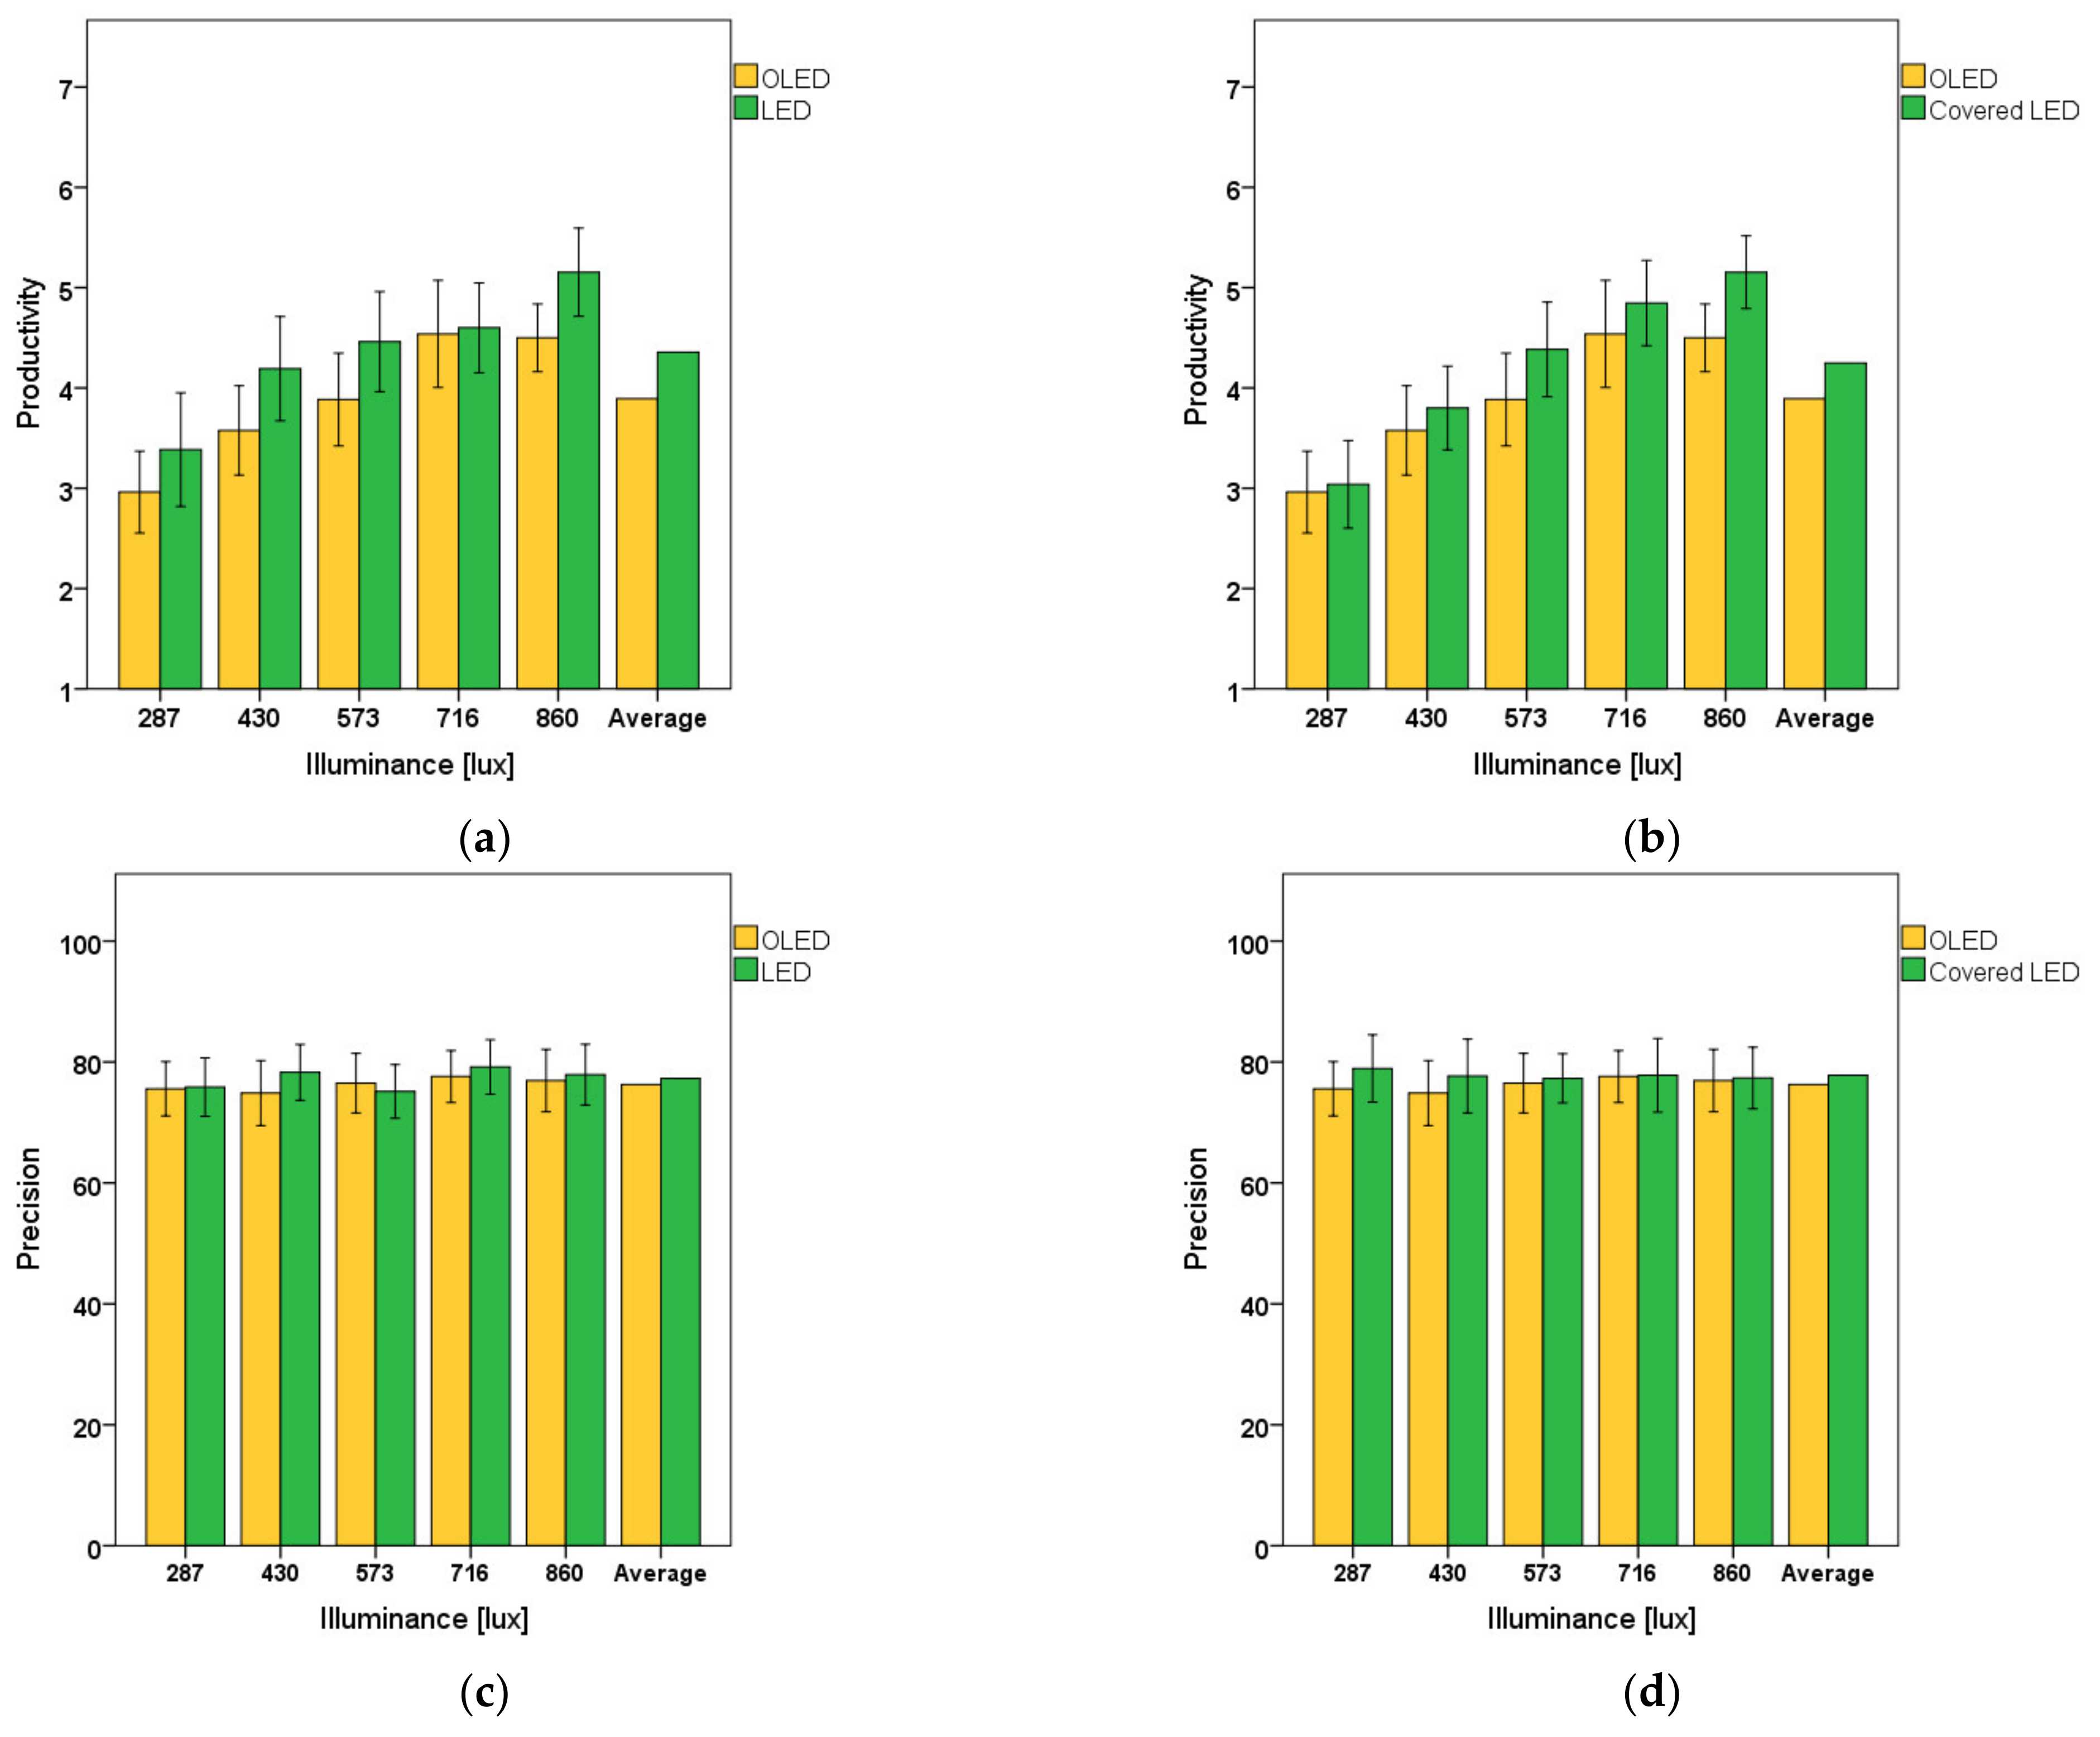
3.3.1. Self-Reported Productivity and Precision
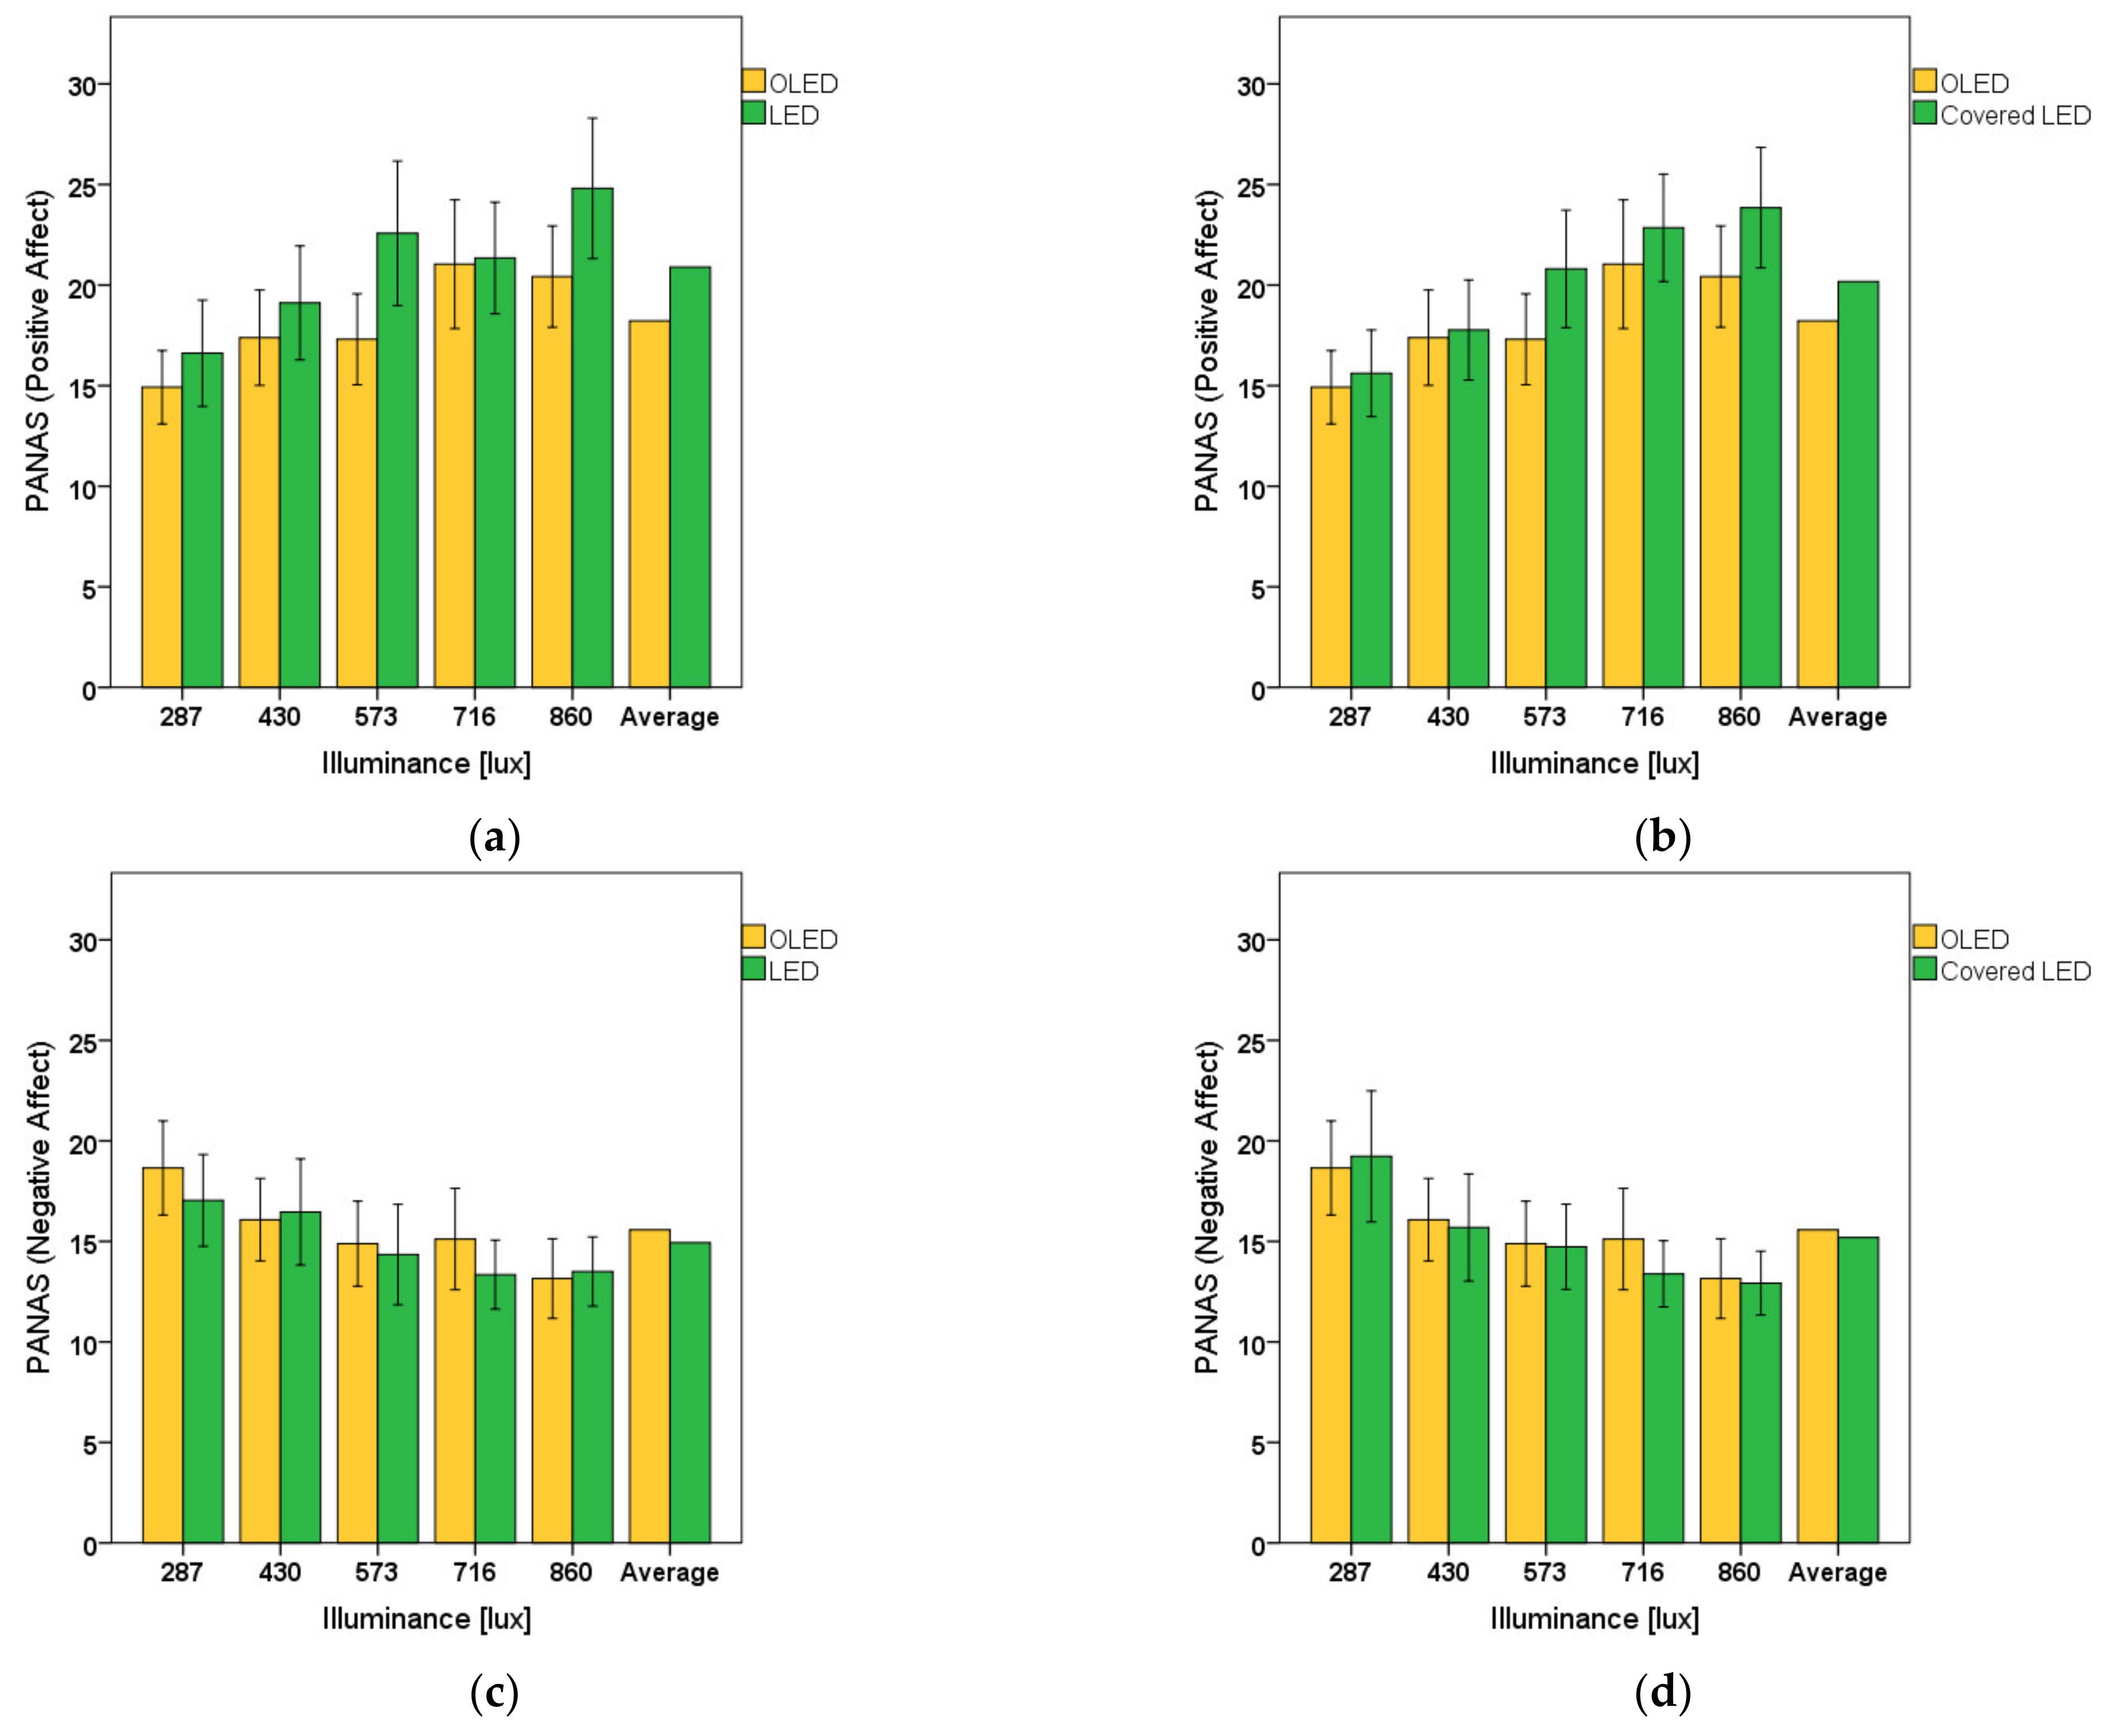
The effects of the luminous conditions on self-reported productivity and precision (i.e., visual acuity) were studied. With respect to productivity, on average, the participants were more productive under LED and covered-LED lighting conditions than under OLED lighting conditions. The mean difference in perceived productivity between LED lighting conditions and OLED lighting conditions at 860 lux was statistically significant: T (50) = −2.360, p-value < 0.005. However, the differences in perceived productivity between covered-LED and OLED lighting conditions were not statistically significant at all illuminance levels. Moreover, the subjective ratings of productivity increased with an increase in illuminance levels under all luminous conditions. For example, self-reported productivity ratings were averaged at three points under OLED lighting conditions at an illuminance level of 287 lux, whereas the same ratings were averaged at four points under the same OLED lighting conditions but at an illuminance level of 860 lux. This same trend can be observed under LED and covered-LED lighting conditions, suggesting that productivity increases with an increase in illuminance levels regardless of light source. For precision, it was measured as the percentage of errors made when taking a numerical verification test. On average, negligible differences existed in task performance under OLED lighting conditions than under LED and covered-LED lighting conditions; the said differences were not statistically significant at all illuminance levels. In addition, the differences in precision resulting from the changes in illuminance levels were somewhat negligible. Figure 13 shows the differences in self-reported improvements in productivity and measured precision between different luminous conditions.

3.3.2. Mood

The influence of lighting conditions on both the positive and negative moods of the participants were assessed. The results suggest that, on average, positive mood was more enhanced under LED lighting conditions than under OLED lighting conditions. The experienced mood differences were also statistically significant at 860 lux [T (50) = −2.037, p-value < 0.005] and 573 lux [T (50) = −2.484, p-value < 0.005]. However, the differences in positive mood under covered-LED and OLED lighting conditions were negligible and not statistically significant. In addition, the influence on positive mood increased with an increase in illuminance levels under all lighting conditions. For example, the positive-mood rating on the PANAS scale under OLED lighting conditions at 287 lux was approximately 15; the same mood rating at 860 lux was approximately 20. With respect to the subjective ratings of negative moods, the obtained results suggest that, on average, negative mood was more enhanced under OLED lighting conditions than under LED lighting conditions; however, the results were not statistically significant. Differences in negative mood under covered-LED and OLED lighting conditions were, on average, negligible and not statistically significant. In addition, contrary to the ratings of positive mood, negative-mood ratings decreased with an increase in illuminance levels under all lighting conditions. For example, the subjective ratings for negative mood were averaged at approximately 19 points for OLED lighting conditions at 287 lux, whereas the same ratings were averaged at roughly 17 points at 860 lux. Figure 14 shows the differences in occupant moods under different luminous environments.

4. Discussion

This study aimed at evaluating the potential effects of SPD on circadian energy and the subjective perception of lit environments. In particular, the influence of SPD on, (I) circadian elements considering energy performance (II) visual comfort (III) work performance and mood were examined. To set up lighting conditions with different SPDs, a LED light source and an OLED light source with dominant spectra content in the different portions of the visible spectrum were employed. The use of common SSL lighting panels is significant here as SSL lighting is projected to dominate future lighting practices, particularly OLED lighting [11], and yet research studies related to the application of OLED lighting in indoor environments are still lacking. The obtained findings have various implications concerning indoor lit environments and are discussed below.

4.1. Circadian Elements and Circadian Energy Implications

It was observed that MS was relatively higher under the LED light conditions than the OLED light conditions. This finding is in line with previous research that report increased MS under light conditions with spectra profiles from the short-wave region of the visible spectrum and may have practical implications regarding which types of light sources are used and under which circumstances [23]. For instance, the use of light sources with dominant emissions from the lower region of the spectrum such as the LED light panel used in the current study is likely to disrupt the wake/sleep cycles of building occupants, which, in turn, can result in a myriad of health conditions [5].
However, there are circadian benefits of using light sources that produce light from the lower region of the spectrum during the day. This is important because the effect of short-wavelength spectral content on human health has mostly been discussed in the context of nighttime environments; thus, such discussions largely neglect the potential usefulness of such light in eliciting alertness, which, for instance, is beneficial in office buildings that lack sufficient daylight. The potential benefits of light right of short wavelength spectral content as a source of circadian stimulus and alertness in office workers have been discussed by Figueiro et al. [24], who suggest that using LED lamps in overhead light fixtures that deliver circadian stimulus levels above 0.3 is capable of improving alertness in office workers. Sufficient amounts of such light in the morning hours have also been reported to improve sleep patterns in old patients with Alzheimer’s disease [25]. From the results of the current study, it was observed that the light source with SPD peaking between 430–480 nm on the visible spectrum, in our case the LED light panel, has higher abilities to suppress melatonin secretion than the light source with peak SPD in the red/orange region of the spectrum (i.e., in our case the OLED light panel. Indeed, this is further evidence that light rich in short-wavelength content is likely to offer circadian benefits during the daytime when melatonin levels should be low, especially in areas that experience insufficient levels of daylight. Conversely, lighting rich in the relatively high light spectra content is more suitable in nighttime environments when melatonin levels should be high so as to facilitate sleep [26].
Another important finding of this study pertains to the circadian efficacies of light sources with different spectra content. As shown in Table 3 and Table 4, the LED light panel indicated a higher CE than OLED light panel. This indicates that light from the lower region of the visible spectrum produces more CL per unit radiant flux, and thus likely to elicit stronger biological actions, than light from the upper region of the visible spectrum with less energy requirements. This is important because traditional evaluations of light sources only relied on visual performance and light quality metrics (e.g., LE, CCT, color rendering index). Currently, however, and after the many discoveries on the potentiality of light sources to affect human biological processes, assessing the circadian properties of lit environments/light sources is becoming common practice [15]. In that regard, and by employing SSL lighting sources, in particular OLED light panels, which are likely to see increased application in indoor lighting practices [11], our analysis provides prospective benchmarking values for SLL lighting considering circadian energy efficiency. Interestingly, however, the CAF (see Table 3 and Table 4) which is ideally a measure of biological action per unit visual response was relatively higher for the OLED light source than the LED light source. In our particular case, this finding implies a higher biological action per unit visual response of the OLED light emission than the LED light emission, but this is likely due to the low LE of the OLED light source used rather than a general characteristic of light of high-wavelength spectra content.

4.2. Visual Comfort

Another important finding of presented in the current study is associated with discomfort glare considering different peak SPDs. Discomfort glare was assessed from two perspectives: the presence and tolerance of glare. Although the participants experienced lower levels of discomfort glare under the luminous conditions associated with SPDs peaking in the upper regions of the visible spectrum (i.e., between 580–630 nm than under LED luminous conditions. Glare tolerance was also higher under long wavelength SPD conditions than light conditions with SPD peaking in the lower region of the visible spectrum (Figure 8). This finding, however, can be attributed to the fact that OLED is a surface light source and LED is a point light source. Furthermore, objective discomfort glare using was assessed using luminance cameras and the UGR index, finding that the light sources with peak SPD in the lower region of the spectrum were more likely to result in discomfort glare compared with those with peak SPD in the upper region of the spectrum. This is an interesting finding primarily because discomfort glare has mostly been viewed from the perspective of limited quantities such as the size of the glare source and direction of light [27]. The obtained results show that SPD of a given light source is potentially complacent in the formation of discomfort glare, but further studies are necessary to re-enforce this line of thought.
Besides visual comfort as seen from the perspective of glare (discussed above), the potential effect of SPD on visual comfort from the perspective of preference and perceived brightness was also studied. With respect to perceived brightness, the participants experienced higher levels of brightness under the lighting conditions associated with peak SPD in the lower region of the visible spectrum than those associated with peak SPD in the upper region of the spectrum, despite the used candidate light panels having relatively similar luminous efficiencies. This suggests that light sources with peak SPD in the lower region of the spectrum are more suitable those with peak SPDs in the upper region of the spectrum in spaces that require high luminance levels for visual clarity, such as museums or showrooms. With respect to preference, on average, the participants preferred lighting conditions associated with peak SPD in the lower region of the spectrum and vice versa. However, these subjective differences in preference were not statistically significant and further studies are required to further explore the effect of SPD on lighting preferences.

4.3. Work Performance and Mood

The effect of SPD on participant mood were assessed using subjective questionnaires. Both positive and negative mood were assessed using the PANAS system [13]. The results suggest that, for a positive influence, the participants rated the luminous environment associated with peak SPD in the lower region of the visible spectrum and vice versa. for a negative influence, there was no substantial differences in mood considering different SPDs. With respect to the potential influence of SPD on productivity, self-reported improvement in productivity was much higher under lighting conditions associated with peak SPDs in the lower region of the visible spectrum than under those associated with peak SPDs in the upper region of the spectrum. This can be attributed to our earlier discussion on the relationship between the spectra content of light and the secretion/inhibition of melatonin hormone responsible. In particular, lighting conditions rich in blue light have been reported to inhibit the secretion of melatonin, consequently resulting in increased levels of alertness/wakefulness [24] and possibly the positive effect on self-reported productivity observed in the current study.
The visual acuity in the form of precision was also assessed, finding no particular influence of SPD on visual acuity. This suggests that in spaces where visual acuity is the highest priority, the SPD of the chosen light source is not of significant importance. This is an interesting finding given that and according to the Commission Internationale de l’Eclairage [28], the human eye is sensitive under lighting conditions of a particular wavelength (i.e., 580 nm); thus, taking into account Figure 3, visual acuity should be higher in lighting conditions associated with SPDs in the upper region of the visible spectrum than those associated with SPDs in the lower region of the spectrum.

5. Limitations and Future Research

The current study possesses limitations that must be addressed in future studies. For example, the current study only considers light sources of a single CCT, despite a potential linkage between CCT and circadian entrainment [29]. It would be useful to assess the influence of SPD on the perception of lit environments considering different CCTs. It would also be useful to utilize light of various discrete wavelengths to identify the optimum spectra profile for improved circadian energy efficiency.
Furthermore, it is important to note that not all the differences in mood between the two light sources with differing peak SPDs were statistically significant. Future studies should endeavor to further analyze the said difference using a much larger dataset and a larger number of participants so as to deterministically confirm the findings presented in the current study. Also, since the effect of lighting conditions on mood is potentially linked to physiological and psychological aspects, extra objective analyses on the effect of SPD on occupant mood are required (e.g., an electroencephalogram to monitor physiological responses). Similarly, future studies should further explore the differences in visual acuity under the two luminous conditions, preferably using a much larger experimental study with a large number of participants.

6. Conclusions

The present study explored the influence of SPD on three elements: (i) circadian energy (ii) visual comfort (i.e., discomfort glare, preference, and brightness) and (iii) work performance and mood (i.e., self-reported productivity, precision, negative and positive affect) by comparing luminous environments with varying spectra content. Substantial differences in all the three factors, attributed to the differences in spectra content, were observed. The differences were more pronounced for circadian energy elements and discomfort glare. For instance, the results showed that light sources with peak SPDs in the lower region of the spectrum are more likely to induce larger biological actions than those with peak SPDs in the upper region of the spectrum. Consequently, light sources with peak SPDs in the lower region of the visible spectrum are more suitable for use in spaces that require high levels of alertness in the morning/afternoon hours and spaces that have insufficient levels of daylight. Alternatively, light sources with peak SPDs in the upper region of the spectrum are more appropriate for spaces that require high concentrations of melatonin, such as indoor residential spaces at night. Also, it was observed that the light source with peak SPD in the upper region of the visible spectrum was less glary than that with peak SPD in the lower region of the spectrum, suggesting relatively improved visual comfort under luminous conditions with peak SPDs in the upper region of the visible spectrum.

Author Contributions

Conceptualization, G.Y.Y.; methodology, G.Y.Y.; formal analysis and investigation, G.Y.Y. and J.N.; writing—original draft preparation, J.N.; writing—review and editing, G.Y.Y. and I.K.; supervision, G.Y.Y.; funding acquisition, I.K. All authors have read and agreed to the published version of the manuscript.

Funding

This research was supported by a grant (21AUDP-B127891-05) from the Architecture & Urban Development Research Program funded by the Ministry of Land, Infrastructure and Transport of the Korean government.

Informed Consent Statement

Informed consent was obtained from all subjects involved in the study.

Data Availability Statement

The data used in the study is available on reasonable request from the corresponding author.

Conflicts of Interest

The authors declare no conflict of interest.

References

  1. Ucal, M.; Xydis, G. Multidirectional Relationship between Energy Resources, Climate Changes and Sustainable Development: Technoeconomic Analysis. Sustain. Cities Soc. 2020, 60, 102210. [Google Scholar] [CrossRef]
  2. Altomonte, S.; Allen, J.; Bluyssen, P.M.; Brager, G.; Heschong, L.; Loder, A.; Schiavon, S.; Veitch, J.A.; Wang, L.; Wargocki, P. Ten Questions Concerning Well-Being in the Built Environment. Build. Environ. 2020, 180, 106949. [Google Scholar] [CrossRef]
  3. Xiao, H.; Cai, H.; Li, X. Non-Visual Effects of Indoor Light Environment on Humans: A Review. Physiol. Behav. 2021, 228, 113195. [Google Scholar] [CrossRef] [PubMed]
  4. Berson, D.M.; Dunn, F.A.; Takao, M. Phototransduction by Retinal Ganglion Cells That Set the Circadian Clock. Science 2002, 295, 1070–1073. [Google Scholar] [CrossRef] [PubMed] [Green Version]
  5. Walker, W.H.; Walton, J.C.; DeVries, A.C.; Nelson, R.J. Circadian Rhythm Disruption and Mental Health. Transl. Psychiatry 2020, 10, 28. [Google Scholar] [CrossRef] [PubMed] [Green Version]
  6. Ahabrach, H.; El Mlili, N.; Errami, M.; Cauli, O. Circadian Rhythm and Concentration of Melatonin in Breast Cancer Patients. EMIDDT 2020, 20. [Google Scholar] [CrossRef]
  7. Mason, I.C.; Qian, J.; Adler, G.K.; Scheer, F.A.J.L. Impact of Circadian Disruption on Glucose Metabolism: Implications for Type 2 Diabetes. Diabetologia 2020, 63, 462–472. [Google Scholar] [CrossRef] [PubMed] [Green Version]
  8. Figueiro, M.; Kalsher, M.; Steverson, B.; Heerwagen, J.; Kampschroer, K.; Rea, M. Circadian-Effective Light and Its Impact on Alertness in Office Workers. Lighting Res. Technol. 2019, 51, 171–183. [Google Scholar] [CrossRef]
  9. Hartstein, L.E.; Tuzikas, A.; Karlicek, R.F. The Impact of Dynamic Changes in Light Spectral Power Distribution on Cognitive Performance and Wellbeing. LEUKOS 2020, 16, 289–301. [Google Scholar] [CrossRef]
  10. Bellia, L.; Bisegna, F.; Spada, G. Lighting in Indoor Environments: Visual and Non-Visual Effects of Light Sources with Different Spectral Power Distributions. Build. Environ. 2011, 46, 1984–1992. [Google Scholar] [CrossRef]
  11. Pode, R. Organic Light Emitting Diode Devices: An Energy Efficient Solid State Lighting for Applications. Renew. Sustain. Energy Rev. 2020, 133, 110043. [Google Scholar] [CrossRef]
  12. Hopkinson, R.G. Glare from Daytighting in Buildings. Appl. Ergon. 1972, 3, 206–215. [Google Scholar] [CrossRef]
  13. Watson, D.; Clark, L.A. The PANAS-X: Manual for the Positive and Negative Affect Schedule Expanded Form; The University of Iowa: Iowa City, IA, USA, 1999. [Google Scholar]
  14. Cai, H.; Chung, T. Evaluating Discomfort Glare from Non-Uniform Electric Light Sources. Lighting Res. Technol. 2013, 45, 267–294. [Google Scholar] [CrossRef]
  15. Tähkämö, L.; Partonen, T.; Pesonen, A.-K. Systematic Review of Light Exposure Impact on Human Circadian Rhythm. Chronobiol. Int. 2019, 36, 151–170. [Google Scholar] [CrossRef] [Green Version]
  16. Rivera, A.M.; Huberman, A.D. Neuroscience: A Chromatic Retinal Circuit Encodes Sunrise and Sunset for the Brain. Curr. Biol. 2020, 30, R316–R318. [Google Scholar] [CrossRef] [PubMed]
  17. Rea, M.S.; Figueiro, M.G.; Bullough, J.D.; Bierman, A. A Model of Phototransduction by the Human Circadian System. Brain Res. Rev. 2005, 50, 213–228. [Google Scholar] [CrossRef] [PubMed]
  18. Truong, W.; Zandi, B.; Trinh, V.Q.; Khanh, T.Q. Circadian Metric—Computation of Circadian Stimulus Using Illuminance, Correlated Colour Temperature and Colour Rendering Index. Build. Environ. 2020, 184, 107146. [Google Scholar] [CrossRef]
  19. Houser, K.W.; Esposito, T. Human-Centric Lighting: Foundational Considerations and a Five-Step Design Process. Front. Neurol. 2021, 12, 630553. [Google Scholar] [CrossRef] [PubMed]
  20. Van Creveld, K.; Mansfield, K. Lit Environments That Promote Health and Well-Being. Build. Serv. Eng. Res. Technol. 2020, 41, 193–209. [Google Scholar] [CrossRef]
  21. Oh, J.H.; Yang, S.J.; Do, Y.R. Healthy, Natural, Efficient and Tunable Lighting: Four-Package White LEDs for Optimizing the Circadian Effect, Color Quality and Vision Performance. Light Sci. Appl. 2014, 3, e141. [Google Scholar] [CrossRef]
  22. Templeton, G.F. A Two-Step Approach for Transforming Continuous Variables to Normal: Implications and Recommendations for IS Research. CAIS 2011, 28, 41–58. [Google Scholar] [CrossRef] [Green Version]
  23. Sunde, E.; Pedersen, T.; Mrdalj, J.; Thun, E.; Grønli, J.; Harris, A.; Bjorvatn, B.; Waage, S.; Skene, D.J.; Pallesen, S. Alerting and Circadian Effects of Short-Wavelength vs. Long-Wavelength Narrow-Bandwidth Light during a Simulated Night Shift. Clocks Sleep 2020, 2, 37. [Google Scholar] [CrossRef] [PubMed]
  24. Figueiro, M.; Steverson, B.; Heerwagen, J.; Yucel, R.; Roohan, C.; Sahin, L.; Kampschroer, K.; Rea, M. Light, Entrainment and Alertness: A Case Study in Offices. Lighting Res. Technol. 2020, 52, 736–750. [Google Scholar] [CrossRef]
  25. Figueiro, M.G.; Leggett, S. Intermittent Light Exposures in Humans: A Case for Dual Entrainment in the Treatment of Alzheimer’s Disease. Front. Neurol. 2021, 12, 625698. [Google Scholar] [CrossRef]
  26. Cain, S.W.; McGlashan, E.M.; Vidafar, P.; Mustafovska, J.; Curran, S.P.N.; Wang, X.; Mohamed, A.; Kalavally, V.; Phillips, A.J.K. Evening Home Lighting Adversely Impacts the Circadian System and Sleep. Sci. Rep. 2020, 10, 19110. [Google Scholar] [CrossRef]
  27. Hamedani, Z.; Solgi, E.; Skates, H.; Hine, T.; Fernando, R.; Lyons, J.; Dupre, K. Visual Discomfort and Glare Assessment in Office Environments: A Review of Light-Induced Physiological and Perceptual Responses. Build. Environ. 2019, 153, 267–280. [Google Scholar] [CrossRef]
  28. Goodman, T.M.; Bergen, T.; Blattner, P.; Ohno, Y.; Schanda, J.; Uchida, T. The Use of Terms and Units in Photometry–Implementation of the CIE System for Mesopic Photometry (CIE TN 004: 2016); Commission Internationale de l‘Eclairage (CIE): Vienna, Austria, 2016. [Google Scholar]
  29. Nie, J.; Zhou, T.; Chen, Z.; Dang, W.; Jiao, F.; Zhan, J.; Chen, Y.; Chen, Y.; Pan, Z.; Kang, X.; et al. Investigation on Entraining and Enhancing Human Circadian Rhythm in Closed Environments Using Daylight-like LED Mixed Lighting. Sci. Total Environ. 2020, 732, 139334. [Google Scholar] [CrossRef] [PubMed]
Figure 1. Light panels: (a) organic light emitting diode (OLED); (b) light emitting diode (LED); (c) covered LED.
Sustainability 13 04852 g001
Figure 2. Experiment room dimensions and participant positions; (a) top view (b) side view.
Sustainability 13 04852 g002
Figure 3. Spectral power distribution (SPD) from (a) OLED; (b) LED; (c) covered LED.
Sustainability 13 04852 g003
Figure 4. Uniformity ratio of illuminance at the workspace.
Sustainability 13 04852 g004
Figure 5. Experimental protocol.
Sustainability 13 04852 g005
Figure 6. Potential melatonin-suppression levels by the three light panels.
Sustainability 13 04852 g006
Figure 7. Subjective evaluation of presence of discomfort glare: (a) OLED vs. LED and (b) OLED vs. covered LED.
Sustainability 13 04852 g007
Figure 8. Subjective evaluation of discomfort-glare tolerance: (a) OLED vs. LED and (b) OLED vs. covered LED.
Sustainability 13 04852 g008
Figure 9. Distribution of discomfort-glare rankings under all three luminous conditions.
Sustainability 13 04852 g009
Figure 10. Unified glare rating (UGR) observed for the three light panels.
Sustainability 13 04852 g010
Figure 11. Subjective evaluation of preference: (a) OLED vs. LED and (b) OLED vs. covered LED.
Sustainability 13 04852 g011
Figure 12. Subjective evaluation of perceived brightness: (a) OLED vs. LED and (b) OLED vs. covered LED.
Sustainability 13 04852 g012
Figure 13. Self-reported productivity: (a) OLED vs. LED and (b) OLED vs. covered LED. Precision: (c) OLED vs. LED and (d) OLED vs. covered LED.
Sustainability 13 04852 g013
Figure 14. Subjective evaluation of mood. Positive mood: (a) OLED vs. LED and (b) OLED vs. covered LED. Negative mood: (c) OLED vs. LED and (d) OLED vs. covered LED.
Sustainability 13 04852 g014
Table 1. Measuring equipment for spectral power distribution (SPD) and illuminance.
VariablesEquipmentRangeAccuraciesManufacturer
IlluminanceTesto 5400–99,999 [lux]±3 [lux]Testo AG, Germany
Spectral power distributionAvaspec-3648 UV/VIS220–1100 [nm]±0.5 [nm]Avantes, Netherlands
Table 2. Circadian light (CL) among light sources with differing SPDs.
Light SourceCL
OLED0.1836
LED0.1488
D650.3491
Incandescent lamp0.1376
Fluorescent lamp0.0914
Table 3. Effective circadian and luminous efficacies among light sources with differing SPDs.
Light SourceCE
(CL/W)
LE
(Lumen/W)
CAF
OLED70.6452.941.33
LED131.69121.81.08
D65304.45120.02.54
Incandescent lamp7.517.511.00
Fluorescent lamp59.7877.400.77
Table 4. Nominal circadian and luminous efficacies among light sources with differing SPDs.
Light SourceCE
(CL/W)
LE
(Lumen/W)
CAF
OLED78.81451.75
LED141.931001.42
D65399.59120.03.33
Incandescent lamp10.507.511.00
Fluorescent lamp78.4697.000.81
Publisher’s Note: MDPI stays neutral with regard to jurisdictional claims in published maps and institutional affiliations.

