Article

Evaluation Analysis of Forest Ecological Security in 11 Provinces (Cities) of the Yangtze River Economic Belt

School of Economic & Management, Beijing Forest University, Beijing 100083, China
*
Author to whom correspondence should be addressed.
Sustainability 2021, 13(9), 4845; https://doi.org/10.3390/su13094845
Submission received: 27 February 2021 / Revised: 28 March 2021 / Accepted: 22 April 2021 / Published: 26 April 2021

Abstract

:
The forest ecological security of the Yangtze River Economic Belt has an important influence on improving the regional environment and promoting the sustainable development of the social economy. Therefore, the aim of this paper is to provide countermeasures and suggestions for improving the level of regional ecological security by quantitatively analyzing the forest ecological security status of the Yangtze River Economic Belt and the tributaries of the Yangtze River. Using three main aspects, i.e., resources, socio-economic pressure and maintenance response, the study established 26 indicators that affect the forest ecological security of 11 provinces (cities) in the Yangtze River Economic Belt. The index weights were determined by principal component analysis, and the forest ecological security levels of 11 provinces (cities) in the Yangtze River Economic Belt were classified and evaluated by the grey clustering method. The results show the following: (1) the principal component analysis determined the weight of the three aspect indicators. The order is as follows: resource index > socio-economic pressure index > maintenance response index. This means that the basic environmental condition which the forest growth depends on and quality and quantity of forest is most important, and the maintenance activities performed by human beings in forest resources need to be strengthened. (2) The level of the forest ecological security in all the provinces (cities) of the Yangtze River Economic Belt is relatively good, with an upward trend. The level of forest ecological security in each province (city) decreases from the upper reaches of the Yangtze River basin to the lower reaches, and the level of forest ecological security in the central cities is lower. (3) The resource index, socio-economic pressure index and maintenance response index of all the provinces and cities showed an upward trend in these four years. The provinces with a significantly higher forest resource index include Yunnan and Guizhou. Shanghai, Chongqing, Sichuan, Hunan and Jiangxi were the provinces with significantly higher socio-economic pressure values; Yunnan province, Shanghai, Jiangxi Province and Hubei province were the provinces with higher forest maintenance response values.

1. Introduction

Ecological security is a necessary condition for maintaining human existence, while human activities pose a threat to the ecological environment. This means ecological security contains three meanings: first, the security of the ecosystem is the foundation of ecological security; second, the role of the ecosystem in maintaining the development of human society and the economy; third, the effect of humans on ecosystem security. Norman first proposed that the degradation of the ecological environment would cause insecurity in politics and the economy [1]. Richard et al. discussed the relationship between economic growth and ecological destruction [2]. Golam et al. analyzed the ecology and sustainable development of traditional agriculture in Bangladesh [3]. Hong analyzed China’s environment after decentralization, ecological construction and reform [4]. Forest ecological security reflects the interaction and interdependence between humans and the forest ecosystem. Moraes [5], Hayes [6] and other scholars evaluated the ecological security of Northwest Washington and the Amazon forest by establishing a set of risk assessment systems. With more and more attention paid to the construction of environmental protection, forest ecological security has been gradually gaining attention [7]. Forest ecological security refers to the health and safety of the forest ecosystem itself, but also refers to the state of maintaining safety when it is disturbed and affected by human behavior [8]. On the one hand, the research into forest ecological security analyzes the influencing factors. Feng et al. believed that extensive forest management and other factors led to the decline in stand quality and a series of ecological and environmental problems [9]. On the other hand, the research also analyzes provincial forest ecological security levels. Xu et al. [10] and Wang et al. [11] evaluated and analyzed the level of the ecological security index in China’s provinces. Climate change affects the spatial distribution of forest tree species, affecting forest quality, and has had an important impact on the variables in forest ecology [12]. Related research has gradually expanded to water ecology and fluvial ecosystems. Yin proposed measures to improve the ecological environmental protection of water resources system combining the basin and region as well as proposals to accelerate the ecological monitoring system of water and to strengthen the ecological environmental protection of water resources in key areas [13]. Fluvial ecosystems possess great capacity for providing food and shelter for fish and many other aquatic species and offer a board range of ecosystem services that directly affect human well-being [14]. Excessive water resource exploitation might profoundly impair the integrity of the fluvial ecosystems [15,16]. The construction of water conservancy facilities such as hydropower stations has had a significant impact on fluvial ecosystems. In addition, preliminary research progress has also been made on the early warning mechanism of forest ecological security [17] and the relationship between the economic industry and forest ecology [18]. The most commonly reported ecological impacts are flow regime alteration, water depletion in the bypass reach, loss of longitudinal connectivity, fish injuries, habitat degradation and the simplification of the composition of fish/macroinvertebrate communities [14].
Domestic scholars focus on the evaluation of levels and the spatial-temporal analysis of provinces and counties, while foreign evaluation mainly focuses on regional analysis, which is the biggest difference between the two. Therefore, this article focusses on the Yangtze River Economic Belt as the research area. There are few studies in China that take all of the provinces of the Yangtze River Basin into account as the research area. Secondly, in terms of the research framework, this article conducts evaluations from the point of view of two aspects, namely province (city) and tributary forest ecological security evaluation, which can comprehensively and systematically reflect the forest ecological security status of the Yangtze River Economic Belt. Based on this, this paper uses principal component analysis to determine the weight of each index and uses grey cluster analysis to evaluate the forest ecological security of provinces (cities) in the Yangtze River Economic Belt. Additionally, it analyzes the factors that affect the regional forest ecological security which have become key factors for improving the regional forest ecological environment and realizing regional sustainable development. It is expected to provide support for the construction and sustainable development of safe forest ecological environments in the provinces (cities) of the Yangtze River Economic Belt.

2. Data Source and Study Area Profile

2.1. Data Source

This study chose 11 provinces (cities) in the Yangtze River Economic Belt as the research object. Statistical data from 2005, 2010, 2015 and 2017 were used as sample data.

2.2. Study Area Profile

The Yangtze River Economic Belt is located between 97°21′ E and 122°12′ E and 21°22′ N and 35°20′ N, and covers an area of about 2.05 million square kilometers. Table 1 shows the study area of this arcticle.
The Yangtze River Economic Belt is a key area for ecological and environmental protection in China. Most areas are affected by the subtropical monsoon climate. The average annual precipitation range is between 270 and 500 mm in the western region and between 1600 and 1900 mm in the southeastern region. The Yangtze River Economic Belt is the main part of the forest region in southwest China because of the better precipitation and temperature conditions and abundant forest resources [19]. The average forest coverage rate of all provinces (cities) of Yangtze River Economic Belt is 42.40%, which is higher than the national forest coverage rate of 22.96%. Forest resources provide a strong carbon sequestration capacity. The total carbon sequestration capacity of forest vegetation in the implementation area of the natural conservation project in the Yangtze River Basin from 2011 to 2020 is 5903.25 Tg C. Among different forest types, the carbon sequestration capacity of natural forests is 3916.68 Tg C and that of artificial forests is 1986.57 Tg C. The implementation of the second phase of the natural forest protection project will further enhance the capacity of forest carbon sequestration [20].

3. Research Method

3.1. Forest Ecological Security Index Setting and Principal Component Weight Determination

3.1.1. Indicator Meanings and Basic Hypothesis

The influencing factors were divided into a resource factor (Si), socio-economic pressure factor (Pm) and maintenance response factor (Rl). The influencing factors reflect the relationship between the change in ecosystem state, the pressure which human activities have placed on the ecological environment and the response of human beings to the change in ecosystem state [21]. The relevant indexes are selected from the literature on forest ecological security and the literature on the ecological security of the Yangtze River Economic Belt. After soliciting the opinions of experts in ecology, economics, mathematics and other related fields and combining the relevant indicators of the forest quality assessment system, 26 specific indicators were finally selected according to the principle of the accessibility of the data of each factor. Table 2 shows the index meanings and properties.
Natural conditions include annual mean temperature, annual sunshine hours, moisture index, annual precipitation and water area ratio. These indices are the basic environmental conditions which forest growth depends on. State conditions include forest coverage rate, forest stock per unit area, the proportion of natural forest, forest abundance index and the proportion of woodland area. These indices can reflect the quality and quantity of forest growth. General pressures include forest pest disaster rate, soil erosion intensity, forest fire disaster rate and other indicators. A larger number of activities are less conducive to the growth of trees and decrease ecological security indexes. Behavior stress includes population density, energy consumption per unit area, deforestation intensity, sulfur dioxide emission intensity, GDP per unit area and other indicators. Larger values of these indexes place greater pressure on the ecological space and are more unfavorable to the growth of trees. The maintenance response index includes the proportion of natural forest protection area, the annual proportion of afforestation, the intensity of government investment in forestry, the proportion of nature reserve areas, the proportion of farmland returned to forest and other indexes. These indexes play a positive role in increasing forest area and ensuring forest quality.

3.1.2. Determination of Weights under Principal Component Analysis

Principal component analysis is one of the most commonly used unsupervised high-dimensional data dimensionality reduction methods. The principal component analysis method aims to retain the most important components of the original data in the process of dimensionality reduction, so as to maximize the variance of the original data. Conclusions drawn by principal component analysis may be different from those drawn by other methods, resulting in a different order of results and classification. In order to eliminate the influence caused by the inability of the original data to be directly compared because of the difference in magnitude and dimension and to make the indices of different dimensions comparable, the original data were standardized by using the range normalization method. Indicators Si, Pm and Rl are expressed by Xn, and the standardized processing formula is
X ˜ n = X n X ¯ n S n
Among them, X ˜ n is the standardized value of the index, X ¯ n is the average value of the index, Sn is the standard deviation of the index, and z is the sample number of the index. The original data of each index (Si, Pm, Rl) were standardized into dimentionless data.
Principal component analysis was used to calculate the weight of each index.
w n = b n k θ k θ k
where θj represents the variance contribution rate of the principal component, bnk represents the component scoring coefficient of the principal component corresponding to the index, and wn represents the weight of the indicator.

3.2. Grey Cluster Method for Forest Ecological Security

3.2.1. Construct the Sample Matrix

Grey cluster analysis can divide samples into different levels [22]. However, the grey cluster analysis method is cumbersome to calculate, and there may be a weak limitation due to a certain characteristic index participating in the clustering. Standardize the data of the provinces to be evaluated and use the standardized data for sample estimation. Assuming that the data to be evaluated include n indicators in m years, the standardized data can form the sample matrix A:
A = { D 11 D 21 D n 1 D 21 D 22 D n 2 D y 1 D y 2 D y n }
where
A = { D i j } , 0 i y , 0 n j

3.2.2. Construct the Definite Weighted Functions

The interval of standardized data was divided into four evaluation grey categories, and the corresponding evaluation grade set was set as S = {S1,S2,S3,S4} = {0.9,0.7,0.5,0.2}. The corresponding comment set is {excellent, good, medium, poor}. To construct the evaluation, the grey class serial number set e = {1,2,3,4} represents “excellent”, “good”, “medium” and “poor”, and the grey number ⊗ represents the interval of a number set under the grey category.
The weight fe is calculated according to definite weighted functions, and Uie is the total grey number of the evaluation matrix. rie is the evaluation weight coefficient of each province.
r i e = f e ( D i j ) U i e
Then, determine the comprehensive evaluation matrix. The expression of forest ecological security evaluation matrix B of the Yangtze River Economic Belt is as follows:
B = ( w 1 , w 2 , , w n ) [ r 11 r 12 r 1 e r 21 r 22 r 2 e r j 1 r j 2 r j e ]
The evaluation grade of the forest ecological security of the provinces and cities in the Yangtze River Economic Belt is P: P = B × S, where S represents the rating level. The forest ecological security grade evaluation of each tributary is the same as the above steps.

4. Results and Analysis

4.1. Principal Component Analysis and Weight Determination

Table 3 shows the results of the weight calculation. The weight of the resource index is 0.408, in which the weight of natural conditions is 0.196, the weight of state conditions is 0.212, and the weight of annual precipitation and forest area ratio is the largest, both at 0.046. The weight of the social and economic pressure index is 0.397, in which the weight of general pressure is 0.149 and the weight of behavior pressure is 0.248. The weight of the forestry output value is the largest, at 0.046, followed by the forest fire disaster rate, at 0.041. The index weight of maintenance activities is 0.195, in which the area ratio of natural forest protection is the largest, at 0.047. This is followed by the proportion of annual afforestation and the area ratio of farmland returned to forest, both of which are 0.039. The results of the weight calculation show the comprehensive influence of 26 indicators on forest ecological security in 11 provinces (cities) of the Yangtze River Economic Belt. The weight coefficient can provide a basis for the improvement of forest ecological security in the Yangtze River Economic Belt.

4.2. Evaluation of Forest Ecological Security Grade by Grey Clustering Method

4.2.1. Comparison of Forest Ecological Security Indexes of 11 Provinces (Cities) of the Yangtze River Economic Belt

Through the above calculation method, the results for the forest ecological security grade evaluation of 11 provinces (cities) were obtained. The results are shown in Table 4.
Combined with the results in Table 4, the evaluation results for the forest ecological security level in the 11 provinces (cities) of the Yangtze River Economic Belt in four years showed the following characteristics:
(1)
It can be seen from the average results that the average forest ecological security level of 11 provinces (cities) is 0.689, which is at a good level on the whole. Among them, the average range of 11 provinces and cities is between 0.45 and 0.85. Yunnan Province has the highest level of forest ecological security, while Shanghai has the lowest level of forest ecological security, which indicates the unbalanced development of forest ecological security regions.
(2)
Through the calculation and comparison of the forest ecological security level of each province (city), it can be seen that the forest ecological security level of each province (city) decreases from the upper reaches of the Yangtze River Basin to the lower reaches. This is consistent with the spatial pattern of forest growth in the Yangtze River Basin. The main reason for this is that the provinces and cities which are in the middle and upper reaches of the Yangtze River have carried out natural forest resource protection projects and the project of returning farmland to forest. Therefore, the protection of forest resources in these areas is stronger than that in areas where these measures have not been implemented. The forest ecological security level of Shanghai is clearly lower than that of other provinces and cities. The main reason is that Shanghai, as an economic hub, has a high population concentration and rapid economic development. Due to the needs of the domestic economy and foreign trade, Shanghai needs to provide many kinds of forest products, and the social and economic pressure is large, which is not conducive to the increase in the quality and quantity of trees. This shows that the development of central cities has caused negative impacts on forest ecological security. How to realize the coordinated development of the economy and ecology has become the focus of research.
(3)
By comparing the forest ecological security level of 11 provinces (cities) in the Yangtze River Economic Belt over time, the results show that on the whole, the forest ecological security of 11 provinces (cities) in 2017 is better than that of 2005, and the level of forest ecological security showed a fluctuating upward trend, but the growth is slow. The reason is that the growth cycle of trees is long and forestry policies are slow to take effect. At the same time, the survey found that the plantation of trees is greatly affected by diseases and insect pests, which is also the reason why the survival rate and quality of trees improves slowly despite vigorous promotion of the policy of returning farmland to forest.

4.2.2. Factor Analysis and Comparison of Forest Ecological Security Factors in 11 Provinces (Cities) of the Yangtze River Economic Belt
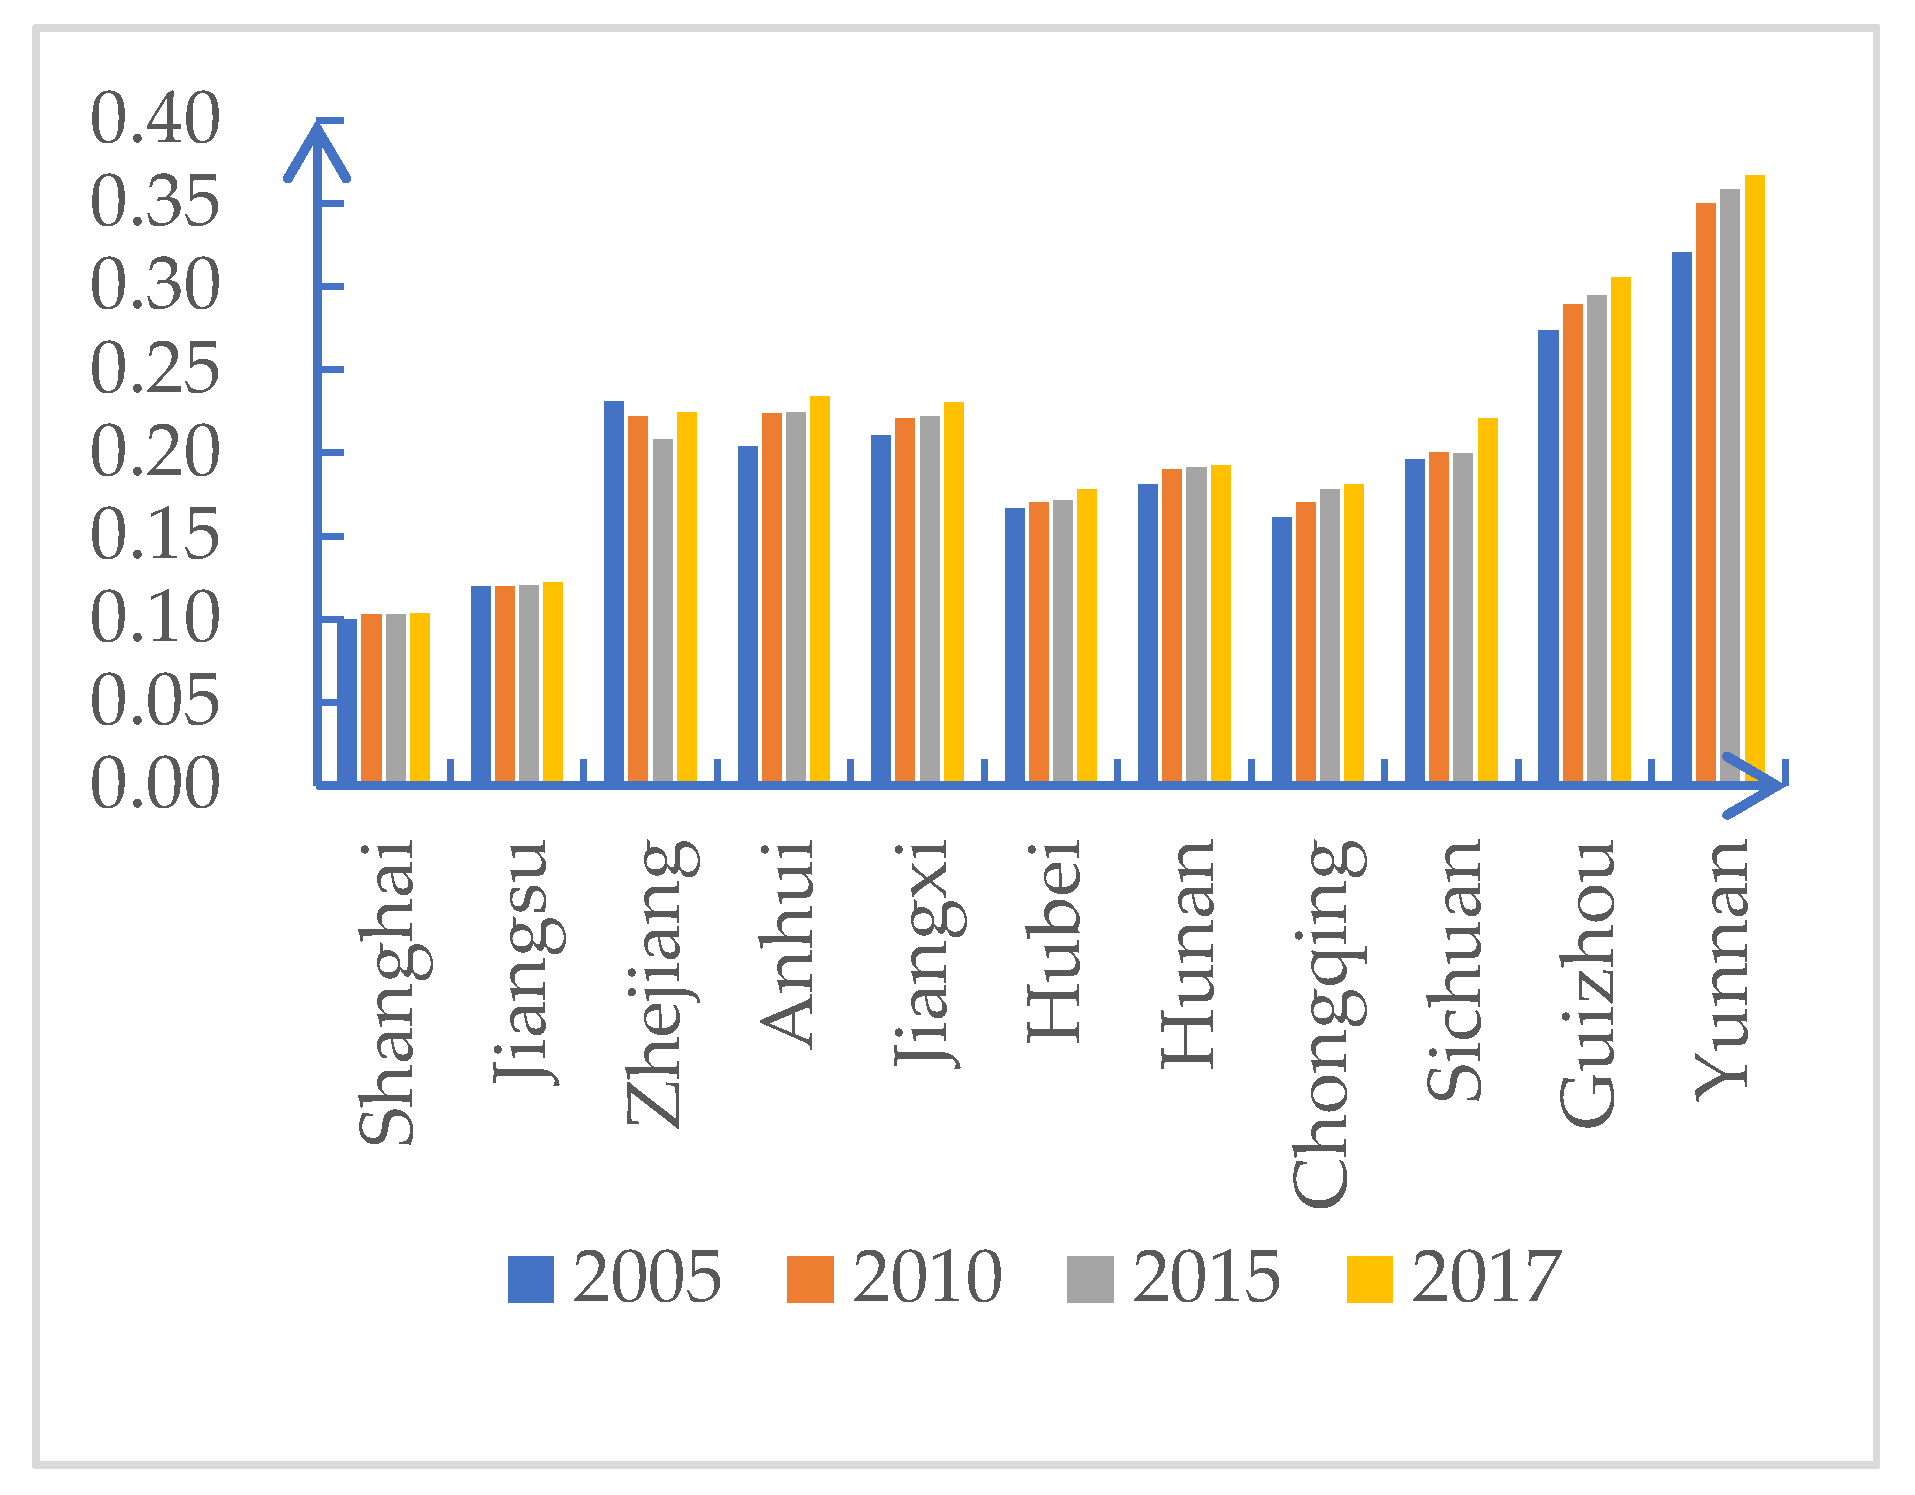
The index of a criterion layer is calculated according to the grey clustering method and formula. The indices of resources, social and economic pressure and maintenance response of the provinces (cities) in the Yangtze River Economic Belt are obtained, as shown in Figure 1, Figure 2 and Figure 3.
Combined with the calculation results in Figure 1, Figure 2 and Figure 3, it is found that the resource indices, social and economic pressure indices and maintenance response indices of the provinces (cities) of the Yangtze River Economic Belt show an upward trend on the whole. The specific features are as follows:
(1)
The index of forest ecological security resources of all provinces and cities showed an upward trend over the four years. The provinces with a higher forest state index were Yunnan and Guizhou, which indicated that these provinces had a better forest resource base. The influence of natural environment conditions on the quality and quantity of forest resources is the main reason, which is mainly reflected in the precipitation. Secondly, the forest coverage rate and the forest stock per unit area under the influence of precipitation are also significantly different. The average value of the forest ecological security resource factor is lower than that of the social economic pressure factor.
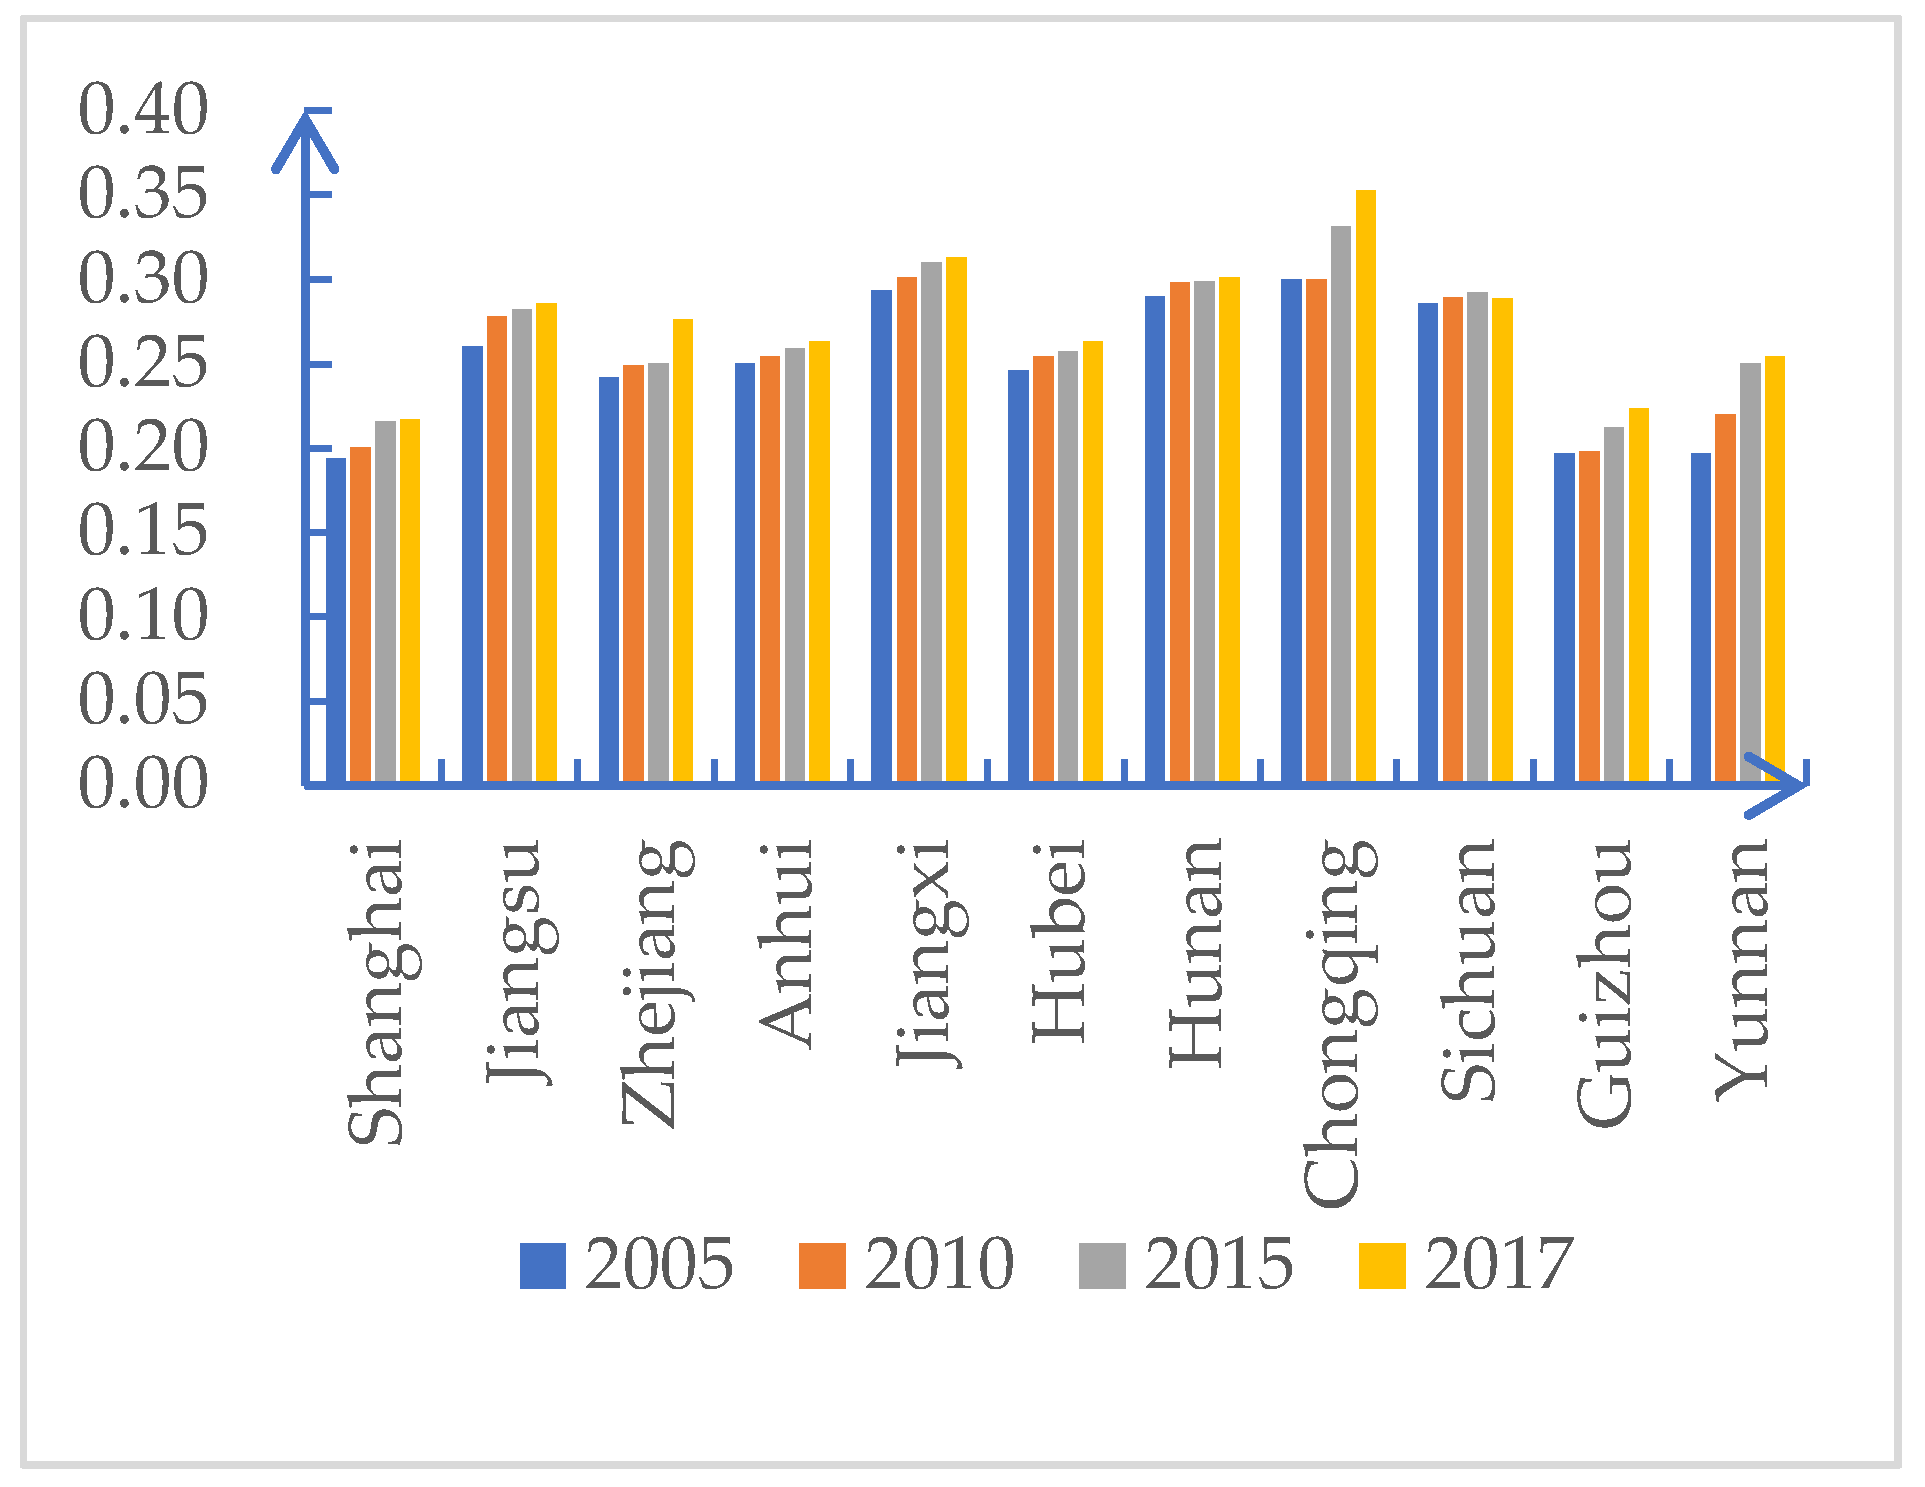
(2)
The social and economic pressure index of forest ecological security in all provinces and cities showed an increasing trend, and its average value was the largest in the three criterion layers. Social and economic pressure plays a negative role in the calculation process of forest ecological security level, so the higher the forest ecological security evaluation level is, the more unfavorable the calculation of the forest ecological security level is. Shanghai, Chongqing, Sichuan, Hunan and Jiangxi provinces had significantly higher social and economic pressure values. The reason for this is that, due to the division of regional economic status and functional areas, the social and economic pressures of special areas such as municipalities directly under the central government and key functional areas are greater than those of other provinces. In the process of analyzing specific indicators, the negative effects of the pressure index are mainly reflected in population density, sulfur dioxide emissions and industrial production per unit area, which mainly reflect the negative effects of human activities and industrial economic development on forest ecological security. Therefore, realizing the coordinated development of the economy and ecology is still the key point.
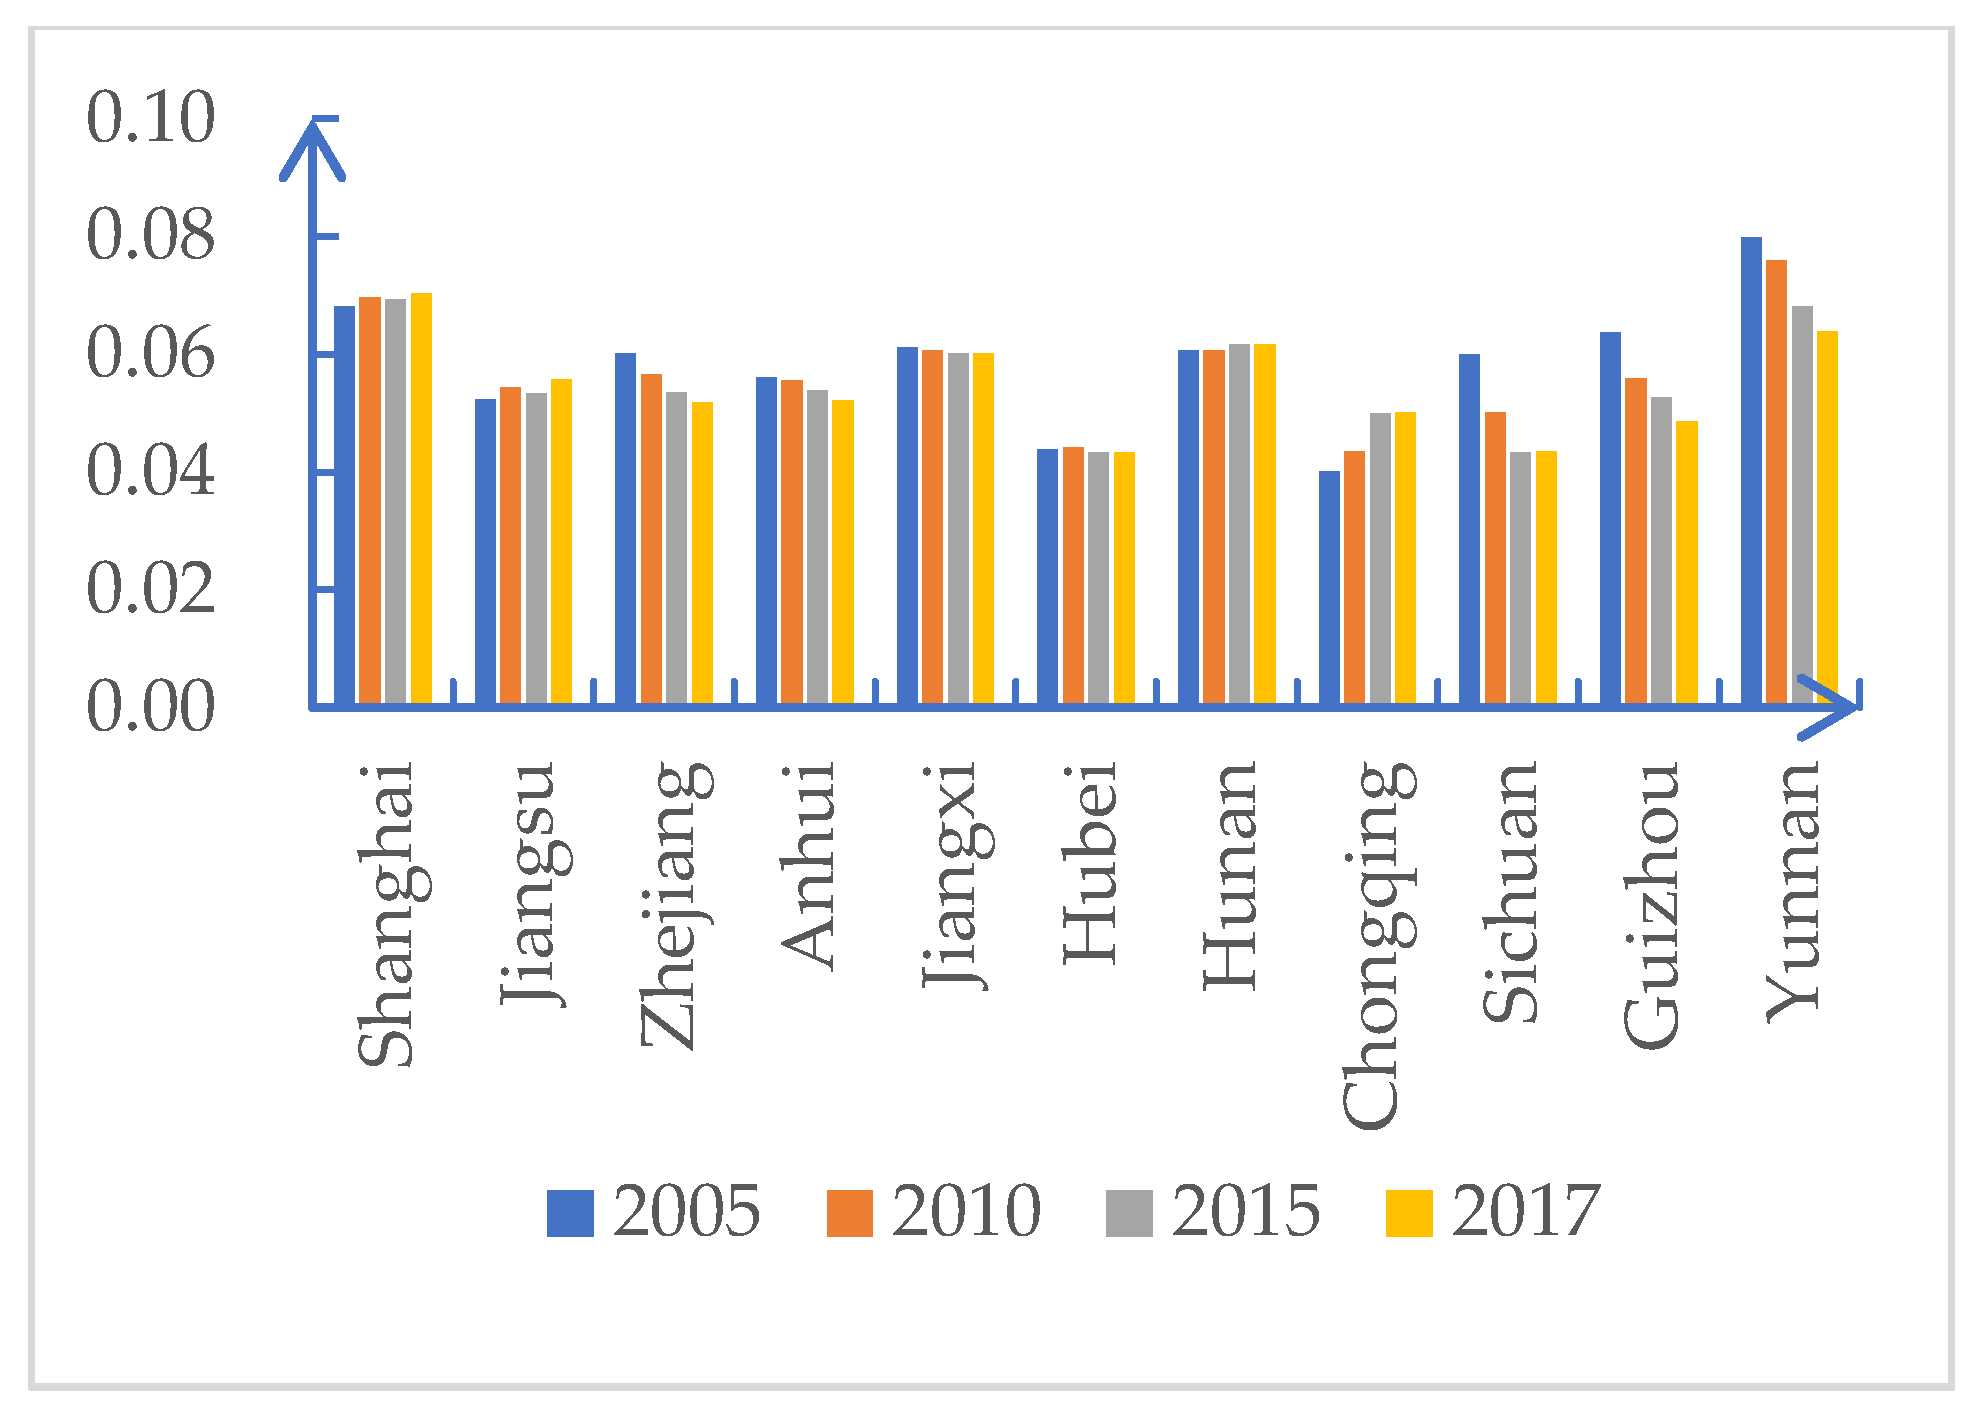
(3)
The maintenance response level of the forest ecological security maintenance is the smallest among the three criterion layers. Overall, the maintenance response index changed steadily, and the grade of maintenance response index showed an increasing trend in the four years. The provinces with higher values of forest maintenance response are Yunnan, Shanghai, Jiangxi and Hubei. The maintenance response index reflects the importance of the government in forestry work. From 2005 to 2017, during the important period of the second phase of the municipal natural protection project and the new round of the policy of returning farmland to forest, the state invested more in forestry. National forestry investment can improve the quantity and quality of regional forest resources.

4.2.3. Evaluation of Forest Ecological Security in Tributaries of the Yangtze River Economic Belt

Table 5 shows the evaluation results of the forest ecological security grade in eight major tributaries in four years. As some actual data are inaccurate, the number of districts and counties that actually participated in the calculation is shown in brackets in Table 5.
The forest ecological security index of the eight tributaries is between 0.6 and 0.8, which is good. The ranking of the average value of the forest ecological security index in the eight tributaries from high to low is Yalong > Minjiang > Jialing > Wujiang > Yuanjiang > Hanjiang > Xiangjiang > Ganjiang. On the whole, the indices of the eight tributaries showed an upward trend in the four years. The main reason lies in the implementation of the project of returning farmland to forest and the natural forest protection project, which has made outstanding contributions to soil and water conservation and forest coverage rate improvement in the region. Additionally, provinces and cities have also put forward corresponding policies. For example, Hunan province has put forward the “General Plan for the Development of the Xiangjiang River Basin”, which makes detailed plans for the protection of public forests, the construction of ecological parks and the prevention and control of forest diseases and insect pests so as to promote the healthy development of the forest ecology in the basin. Secondly, the order of the forest ecological security index of the eight tributaries basically conforms to the characteristics whereby the index value of the upper reaches of the Yangtze River Economic Belt is greater than that of the middle and lower reaches of the provinces.

5. Discussion

According to the comparison of river basins, the Yalong River has the highest value, while the Gan River has the lowest value. This is basically in line with the trend of gradual decline from the upper reaches of the Yangtze River to the lower reaches of the Yangtze River. From the comparison of provinces and cities, the development of forest ecological security in the 11 provinces and cities of the Yangtze River Economic Belt is uneven. The level of the upper reaches of the Yangtze River is higher than that of the lower reaches of the Yangtze River, and the level of forest ecological security shows a fluctuating upward trend. Therefore, realizing the balance of spatial distribution of regional forest ecological security is the focus of future work, in addition to strengthening the maintenance of areas with a good forest ecological environment, strengthening the protection of natural forests and controlling diseases and insect pests in artificial forests. Poor areas should implement forestry protection policies actively. We should increase the control of high pollution and high energy consumption industries and reduce the “three wastes” emissions. The central cities, such as Shanghai, should implement a circular economy and implement the vision of green economic development. The government’s forestry investment follows the principle of adapting measures to local conditions. The provinces and cities with a better forest resource base focus on management and maintenance, while those with a poorer forest resource base focus on afforestation. It can be seen from the above analysis that economic development will inevitably bring about the destruction of the ecological environment. The coordinated development of the economy and ecology should become the focus of future policy analysis, and the convergence of the economy and ecology should become the future research direction. Mattepo and others pointed out the impact mechanism of climate change on forest ecology [12]. They believe that understanding and quantifying future forest coverage in view of climate change is therefore crucial in order to develop appropriate forest management strategies. Sustainable forest management strategies can reduce the potential impact of climate change on forest ecosystems. Thus, the impact path of the various specific factors mentioned above regarding the forest ecological security of the Yangtze River Economic Zone has become the next research direction.
The assessment of the ecological environment in a certain area is affected by the difficulty of data collection. After selecting the variables mentioned above, the authors believe that topography, geology, wind speed, biomass, environmental sensitivity [23] and other factors are also important variables reflecting forest ecological security; however, because those data cannot be obtained, they are not within the scope of these statistics, which may lead to deviation in the calculated values. Additionally, the classification of nature reserves set up by provinces and cities is not included in the scope of these statistics [24,25]. The classification of nature reserves will affect the range and intensity of people’s activities and affect forest ecology to varying degrees. These are all problems that should be solved in future works. In addition, the construction of engineering facilities, such as hydropower stations, has a negative impact on river ecology. The establishment of hydropower stations will first affect biodiversity. The Three Gorges Hydropower Station and the Gezhouba Hydropower Project are well-known water conservancy projects on the Yangtze River. Their role cannot be underestimated. It is important to incorporate the impact of water conservancy projects into the research system.
Regarding the use of methods, environmental flow assessment (e-flows) is a relatively new assessment method, especially in developing countries [26]. Environmental flow methodologies stem from a need to conserve rivers and wetlands sustainably with the appropriate ecological balance in the water system close to the natural flow regime. This article can be used for reference in the study of forest ecological security assessment of the tributaries of the Yangtze River Basin. However, in terms of method selection, as a developing country, China can choose hydrological methods, which can be used as a reference for the ecological research on the tributaries of the Yangtze River. As different methods may have different results, the horizontal comparison between research methods can also become the next research direction. At the same time, under the guidance of different theories [27,28,29], the horizontal comparison of different method models [30,31,32,33,34,35] is also the focus and direction of future research.

6. Conclusions

(1)
The weight of 26 specific indices was calculated by principal component analysis. The results show that the forest ecological security resource index had the largest weight, which indicated that the forest ecological security is greatly affected by the environment. Secondly, the social and economic pressure index, in which the forest fire disaster and forestry output values take up a large proportion, indicated that forest resources are an important factor, and improper human activities are the biggest threat to forest resources. The impact of human behavior and improper forest tourism activities will lead to the decline in the forest ecological security level. At the same time, the development of the forestry industry has also become a greater threat to the ecological security of forests.
(2)
The results of the forest ecological security index analysis show that the forest ecological status of 11 provinces (cities) is at a good level, and the forest ecological security level of Yunnan is the highest, while that of Shanghai is the lowest. The forest ecological security index of the eight tributaries of Yalong River was the highest, while that of Ganjiang River was the lowest. Overall, the forest ecological security in 2017 was better than that in 2005, and the level of forest ecological security shows a fluctuating rise. The unbalanced development among regions and provinces is a significant feature of the safe development of forests in the Yangtze River Economic Belt.
(3)
Through analyzing and comparing the forest ecological security index factors, resource factors, social and economic pressure factors and maintenance response factors, we observed an overall upward trend; the proportion of social and economic pressure factors is the largest, and the change in maintenance response is relatively stable.

Author Contributions

Y.W. (Yiran Wang) contributed to the writing of the paper, D.Z. contributed to the design of the research proposal and methodology, and Y.W. (Yahui Wang) contributed to the data collection. All authors have read and agreed to the published version of the manuscript.

Funding

This research was undertaken at the Beijing Forestry University. The project (Major Forestry Issues Research Project of National Forestry and Grassland Administration in 2014) is funded by the National Forestry and Grassland Administration (ZDWT201415). The purpose is to deal with all kinds of major emergent problems in forestry.

Acknowledgments

This research was supported by the National Forestry and Grassland Administration. The authors would like to thank the researchers of the Major Forestry Issues Research Project of the National Forestry and Grassland Administration in 2014 for their support and help and the anonymous reviewers for their helpful and constructive comments.

Conflicts of Interest

The authors declare no conflict of interest.

References

  1. Norman, M. Environment and Security. Foreign Policy 1993, 74, 23–42. [Google Scholar]
  2. Richard, D.; Jason, R.; David, W. The Road to Growth: Measuring and Tradeoffs between Economic Growth and Ecological Destruction. World Dev. 2018, 101, 351–376. [Google Scholar]
  3. Golam, R.; Gopal, B.T. Sustainability Analysis of Ecological and Conventional Agricultural Systems in Bangladesh. World Dev. 2003, 31, 1721–1741. [Google Scholar]
  4. Hong, J. Decentralization, Ecological Construction, and the Environment in Post-reform China. World Dev. 2005, 34, 1907–1921. [Google Scholar]
  5. Moraes, R.; Landis, W.G.; Molander, S. Regional Risk Assessment of a Brazilian Rain Forest Reserve. Hum. Ecol. Risk Assess. Int. J. 2002, 8, 1779–1803. [Google Scholar] [CrossRef]
  6. Hayes, E.H.; Landis, W.G. Regional Ecological Risk Assessment of a Near Shore Marine Environment: Cherry point, WA. Hum. Ecol. Risk Assess. Int. J. 2004, 10, 299–325. [Google Scholar] [CrossRef]
  7. Bing, L.; Zhiguang, Z. Measurement of Indicators-Indexes Coupling and Indexes-Indicators Decoupling for Forestry Ecological Security: Taking Three Forestry Regions in China for Example. J. Agro For. Econ. Manag. 2020, 19, 352–361. [Google Scholar]
  8. Feng, M.I.; Zenghaodi, T.A.N.; Yanhong, G.U. Difference Analysis and Evaluation of Chinese Forest Ecological Security. Sci. Silvae Sin. 2017, 51, 107–115. [Google Scholar]
  9. Feng, Y.; Zheng, J.; Zhu, L.; Xin, S.Y.; Sun, B.; Zhang, D.H. County Forest Ecological Security Evaluation and Spatial Analysis in Hubei Province Based on PSR and GIS. Econ. Geogr. 2017, 37, 171–178. [Google Scholar]
  10. Xu, H.; Zhao, X.; Zhang, D. Evaluation and Difference Analysis of Provincial Forest Ecological Security in China Based on the Background of Ecological Civilization Construction. Acta Ecol. Sin. 2018, 38, 6235–6242. [Google Scholar]
  11. Wang, Y.; Zhang, D.; Wu, Y. The Spatio-temporal Changes of Forest Ecological Security Based on DPSIR Modal: Case Study in Zhejiang Procince. Acta Ecol. Sin. 2020, 40, 2793–2801. [Google Scholar]
  12. Pecchi, M.; Marchi, M.; Moriondo, M.; Forzieri, G.; Ammoniaci, M.; Bernetti, I.; Bindi, M.; Chirici, G. Potentical Impact of Climate Change on the Forest Coverage and the Spatial Distribution of 19 Key Forest Tree Species in Italy under PCR4.5 IPCC Trajectory for 2050s. Forsets 2020, 11, 934. [Google Scholar] [CrossRef]
  13. Yin, W. Current Situation and Countermeasures of Water Ecological Environment Protection in the Yangtze River Economic Belt. Ecol. Environ. Monit. Three Gorges 2018, 3, 2–7. [Google Scholar]
  14. Kuriqi, A.; Pinheiro, A.N.; Sordo-Ward, A.; Bejarano, M.D.; Garrote, L. Ecological Impacts of Run-of-river Hydropower Plants–Current Status and Future Prospects on the Brink of Energy Transition. Renew. Sustain. Energy Rev. 2021, 142. [Google Scholar] [CrossRef]
  15. Mittal, N.; Bhave, A.G.; Mishra, A.; Singh, R. Impact of Human Intervention and Climate Change on Natural Flow Regime. Water Resour Manag. 2015, 30, 685–699. [Google Scholar] [CrossRef] [Green Version]
  16. Bunn, S.E.; Arthington, A.H. Basic Principles and Ecological Consequences of Altered Flow Regimes for Aquatic Biodiversity. Environ. Manag. 2002, 30, 492–507. [Google Scholar] [CrossRef] [PubMed] [Green Version]
  17. Chen, N.; Lu, S.; Guan, X. Spatio-temporal Differences and the Driving Mechanism of Early Warnings of Forest Ecological Security in Beijing. Acta Ecol. Sin. 2018, 38, 7326–7335. [Google Scholar]
  18. Jiang, Y.; Geng, N. Study on Dynamic Relationship between Forestry Industrial Structure and Forest Ecological Security: With an Example of Heilongjiang Province. J. Cent. South Univ. For. Technol. 2017, 37, 163–168. [Google Scholar]
  19. Zhang, F.; Zhang, Z.; Tian, J.; Huang, R.; Kong, R.; Zhu, B.; Wang, Y.; Chen, X. Forest NPP Simulation in Yangtze River Basin and Its Response to Climate Change. Journal of Nanjing. For. Univ. 2020, 2, 1–8. [Google Scholar]
  20. Tang, X.; Song, X.; Zeng, Y.; Zhang, D. Evaluation and Spatio-temporal Evolution of Forest Ecological Security in the Yangtze River Economic Belt. Acta Ecol. Sin. 2021, 41, 1–12. [Google Scholar]
  21. Zhou, X.; Wang, L.; Zheng, B. Ecosystem Health Assessment for the Changjiang River Estuary and Its Adjacent Sea Area. J. Hydraul. Eng. 2011, 42, 1. [Google Scholar]
  22. Ke, X.; Xiang, M.; Lin, Y. Ecological Security Evaluation of Wuhan City Based on Principal Component Analysis and Grey Clustering Method. Sci. Technol. Manag. Res. 2018, 38, 79–85. [Google Scholar]
  23. Li, Y.; Qi, D. Ecological Service Function Value Assessment of Yichun Forest Based on Ecological Niches Measurement. Sci. Silvae Sin. 2013, 49, 140–147. [Google Scholar]
  24. Xue, D.; Jiang, M.; Wang, X. Research on the Classification Standard of Nature Reserves in China. J. Ecol. Rural Environ. 1993, 9, 1–4. [Google Scholar]
  25. Gao, S.; Hong, L. Deepening the Reform of State-owned Forest Farm to Promote Forest Economic Development—The State-owned Forest Farm Reform and Development Experience and Achievements in Bijie, Guizhou. For. Econ. 2014, 36, 6–9. [Google Scholar]
  26. Suwal, N.; Kuriqi, A.; Huang, X.; Delgado, J.; Młyński, D.; Walega, A. Environmental Flows Assessment in Nepal: The Case of Kaligandaki River. Sustainability 2020, 12, 8766. [Google Scholar] [CrossRef]
  27. Chen, X.; Peng, J.; Liu, Y.X.; Yang, Y.; Li, G.C. Constructing Ecological Security Patterns in Yunfu City Based on the Framework of Importance-sensitivity-connectivity. Geogr. Res. 2017, 36, 471–484. [Google Scholar]
  28. Chen, L.; Tian, S.; Zhang, K. Measurement and Analysis on the Ecological Security Measure of Cultivated Land in Sichuan Province Based on the Dissipative Structure Theory. Res. Soil Water Conserv. 2017, 24, 307–313. [Google Scholar]
  29. Guo, Y.; Cheng, X.Y.; Zhu, F.; Jiang, R.H. Studies on Ecological Security Dynamics Based on Ecological Footprint in Jiangsu Province. Resour. Environ. Yangtze Basin 2010, 19, 1327–1332. [Google Scholar]
  30. Li, Y.; Liu, Y.; Yan, X. A DPSIR-Based Indicator System for Ecological Security Assessment at the Basin Scale. Acta Sci. Nat. Univ. Pekin. 2012, 48, 971–981. [Google Scholar]
  31. Bin, Z.; Lin-Sheng, Z.; Tian, C.; Rui, Z. Ecological Security Early-warning in Zhoushan Islands Based on Variable Weight Model. Chin. J. Appl. Ecol. 2015, 26, 1854–1862. [Google Scholar]
  32. Jiqin, R.; Jingyang, X.; Yue, Y. The Prediction of Primary Energy Consumption Based on Improved BP Neural Network and Markoff Model: A Case Study of Beijing. Ecol. Econ. 2017, 33, 28–33. [Google Scholar]
  33. Jiaqi, Z.; Yijin, W.; Yong, G.; Chenghao, W.; Kung, H. Eco-security Assessments of Poor Areas Based on Gray Correlation Model: A Case Study in Enshi. Geogr. Res. 2014, 33, 1457–1466. [Google Scholar]
  34. Zhu, W.; Miao, C.; Zheng, X.; Cao, G.; Wang, F. Study on Ecological Safety Evaluation and Warning of Wetlands in Tumen River Watershed Based on 3S Technology. Acta Ecol. Sin. 2014, 34, 1379–1390. [Google Scholar]
  35. Dinghua, O.; Jiangguo, X.; Xiaofang, O. Regional Ecological Security Assessment and Change Trend Prediction in Peri-urban Areas Based on GIS and RBF: A Case Study in Longquanyi District of Chengdu City. Geogr. Geo Inf. Sci. 2017, 33, 49–58. [Google Scholar]
Figure 1. The resource index of 11 provinces (cities) in 2005, 2010, 2015 and 2017.
Sustainability 13 04845 g001
Figure 2. The social and economic pressure index of 11 provinces (cities) in 2005, 2010, 2015 and 2017.
Sustainability 13 04845 g002
Figure 3. The maintenance responses index of 11 provinces (cities) in 2005, 2010, 2015 and 2017.
Sustainability 13 04845 g003
Table 1. The study area of this article.
Differentiation MethodSpecific Area
Distinguish by provincesShanghai, Jiangsu, Zhejiang, Anhui, Jiangxi, Hubei, Hunan, Chongqing, Sichuan, Guizhou and Yunnan
Distinguish by tributary basinsYalong River Basin, Minjiang River Basin, Jialing River Basin, Wujiang River Basin, Ganjiang River Basin, Xiangjiang River Basin, Hanjiang River Basin and Yuanjiang River Basin
Table 2. Index meanings and properties.
Rule LayerPrimary IndexIndex MeaningsIndex Properties
Resource indexNatural conditionNatural condition is the basic environmental condition which the forest growth depends onPositive index
State conditionState condition reflects the quality and quantity of forest growthPositive index
Social and economic stress indexGeneral stressGeneral pressure is the pressure effect of natural external environment on the growth of forest resourcesNegative index
Behavior stressBehavior stress is the pressure impact of human activities on forest growthNegative index
Maintenance response indexMaintenance response indexMaintenance response index mainly refers to the maintenance activities of human beings for forest resourcesPositive index
Table 3. The index system of forest ecological security in provinces (cities).
Rule LayerPrimary IndexSecondary IndexFormulaIndex Weight
Resource index (Si)Natural conditionAnnual mean temperature (S1)Direct access0.042
Annual sunshine hours (S2)Direct access0.045
Moisture index (S3)Annual precipitation/annual evaporation0.029
Annual precipitation (S4)Direct access0.046
Water area ratio (S5)Water area/land area0.034
State conditionForest coverage rate (S6)Forest area/land area0.045
Forest stock per unit area (S7)Forest stock volume/forest area0.036
Proportion of natural forest (S8)Natural forest area/forest area0.038
Forest abundance index (S9)(0.6 × arbor forest area + 0.25 × shrub area + 0.15 × other forest area)0.047
Proportion of woodland area (S10)Woodland area/land area0.046
Social and economic pressure index (Pm)General pressureForest fire disaster rate (P1)Forest fires affected area/forest area0.041
Forest pest infestation rate (P2)Forest pest infestation area/forest area0.037
Intensity of soil erosion (P3)Soil erosion area/land area0.038
Behavior pressurePopulation density (P4)Total population at the end of the year/land area0.033
Energy consumption per unit area (P5)Energy consumption/land area0.037
Intensity of forest cutting (P6)Felling of trees/forest stock0.035
Sulfur dioxide emission intensity (P7)Industrial sulfur dioxide emissions/land area0.033
GDP per unit area (P8)GDP/land area0.032
Industrial production per unit area (P9)Industrial production/land area0.032
Forestry production (P10)Direct access0.046
Proportion of construction land area (P11)Construction land area/land area0.033
Maintenance activities index (Rl)Maintenance activities indexProportion of the area under natural forest protection (R1)Natural forests protection area/land area0.047
Annual proportion of afforestation (R2)New afforestation area/land area0.039
Intensity of government investment in forestry (R3)Completed forestry investment amount/forest area0.033
Proportion of nature reserves area (R4)Nature reserve area/land area0.037
Proportion of farmland returned to forest (R5)Area of farmland returned to forest/land area0.039
Table 4. Evaluation results for forest ecological security grade in each province (city).
Province (City)2005201020152017Average
Shanghai0.4780.4720.5010.4890.485
Jiangsu0.5990.6010.6050.6310.609
Zhejiang0.7140.7090.6920.7220.709
Anhui0.7120.7120.7100.7090.711
Jiangxi0.7740.7790.7790.7610.773
Hubei0.5900.6110.6920.6440.634
Hunan0.7050.7280.7380.7290.725
Chongqing0.6990.6880.6910.6990.694
Sichuan0.6950.6990.7070.7100.703
Guizhou0.7100.7200.7190.7290.720
Yunnan0.8220.8140.8240.8150.819
Table 5. Evaluation results of the forest ecological security grade in local analysis.
Province (City)Number of Districts and Counties2005201020152017Average
Wujiang River54 (50)0.63400.66730.69450.72550.6803
Hanjiang River40 (32)0.62560.64460.65600.64790.6435
Yuanjiang River62 (62)0.60720.64650.67940.68870.6555
Xiangjiang River66 (66)0.60080.63190.65700.66410.6384
Yalong River29 (25)0.73820.74380.76830.76100.7528
Jialing River46 (42)0.68420.70110.73420.73260.7130
Ganjiang River43 (43)0.57830.58460.59930.67640.6096
Minjiang River34 (28)0.72750.74280.75210.75950.7449
Publisher’s Note: MDPI stays neutral with regard to jurisdictional claims in published maps and institutional affiliations.

