Article

Planning for Railway Station Network Sustainability Based on Node–Place Analysis of Local Stations

College of Business Administration, Sejong University, Seoul 05006, Korea
*
Author to whom correspondence should be addressed.
Sustainability 2021, 13(9), 4778; https://doi.org/10.3390/su13094778
Submission received: 8 March 2021 / Revised: 22 April 2021 / Accepted: 22 April 2021 / Published: 24 April 2021

Abstract

:
We principally focus on evaluating the local and entire network performance of railway stations for sustainable logistics management in South Korea. Specifically, we aim to address the issue of dealing with vulnerability in logistics dependent on the degree of connectivity. To resolve this issue, we investigate (i) the current level of local railway station sustainability performance from the perspectives of the value of the station (node) and the geographical location (place), and (ii) how railway station network management can prepare for imminent internal and external risks. Integrating node–place analysis and social network analysis approaches, we demonstrate a means of assessing (i) local railway station performance by comparing how one station’s value differs from that of other stations, and (ii) overall railway network performance by measuring the degree of connectivity based on the centrality characteristics. Consequently, we recommend improvement in planning orders considering the degree of local performance and network vulnerability for railway station network sustainability.

1. Introduction

Recently, the COVID-19 pandemic has caused sudden supply chain disruptions in many countries. To prevent the spread of COVID-19 effectively, several countries, such as the UK, France, and China, have placed lockdowns in populated areas. These lockdowns include mass quarantines or stay-at-home orders, which can limit the activities and movements of people in communities. Under the pandemic lockdown, only supplying activities for basic needs and services are allowed. Hence, general supply chain networks might be disrupted around the lockdown area during a certain period [1]. Since disruptions are often observed in global supply chains, supply chain vulnerability or disruption has been attracting increasing attention in recent literature. Most related research focuses on mitigating the detrimental effects of supply chain disruptions [2].
There are many reasons for supply chain disruptions, including natural disasters, accidents, and lean production [3]. Regardless of the causes of these disruptions, chain reactions over the entire supply chain cause shortfalls in materials, parts, products, and services. In particular, in the global pandemic era, these calamities can be more critical to firms that are globally operated. Due to supply chain disruptions, many firms face a critical financial crisis. Mitigation strategies or alternative solutions for supply chain disruption should be developed to reduce catastrophic damage. Before we establish mitigation strategies for supply chain disruption, potential risks in the existing supply chain should be identified and analyzed. The supply chain network’s performance should also be evaluated.
Railway networks are regarded as one of the most reliable and economic logistics means in many countries. They are also vulnerable to supply chain disruptions. For example, the entire railway network for passenger and freight services was locked down for 45 days in 2020 due to COVID-19 in India. As railways are one of the core logistical tools in India, the railway network lockdown caused massive damage to Indian supply chains [4]. Supply chains for global sourcing have also been affected because India has many production facilities for global companies.
In case of disruptive events driven by risks related to supply, demand, logistics, and catastrophe, the status and degree of interconnection becomes even more important in creating a balance between vulnerability and the overall supply chain, such as railway networks’ performances [5,6,7]. Successful risk management strategies and vulnerability controls (i.e., resource limits or lead-time pressure) are considered a part of supply chain capabilities (i.e., flexibility or velocity), ultimately leading to high supply chain resilience, or the ability to cope with and adapt and quickly respond to disruptions, as well as the ability to maintain high situational awareness [8,9,10]. Thus, dual aims in logistics network resilience include the minimization of vulnerability and the maximization of capability, and these are subsequently proven to create sustainable competitive advantage by adapting to and recovering from overall consequences faster than competitors [9,11,12,13,14]. As a part of disruption and risk management approaches, many studies have focused on identifying the means to integrate railway and real estate development (known as transit-oriented development) [15,16]. However, there is a limited understanding of the sustainability of railway station management. Based on the aforementioned research gap and motivation, this study principally focuses on evaluating the local and entire network performance of railway stations in Korea. This study aims to answer the following research questions: (i) What is the current level of local railway station sustainability performance from the perspective of the value of the station (node) and of the geographical location (place)? (ii) How can railway station network management prepare for imminent internal and external risks?
The vulnerability arises from risks that are derived from the internal process and system, internal to the railway network, and external from the environment. To achieve a high level of transportation service excellence, the systematic examination and minimization of exposure to potential risks is a vital step from both individual station and network perspectives.
This study had several implications. First, it contributes to a recent stream of transit-oriented development research by adopting node–place analysis to shed light on the case study of Korea. Second, it provides a network-level analysis of the overall railway station network’s performance based on the system attribute of centrality. Finally, this study proposes station improvement prioritization based on an integrative framework of node place and network analysis.
The remainder of this paper is organized as follows: Section 2 presents a literature review. We present our methodology in Section 3, and Section 4 assesses the railway station’s local and network performance using node–place and network analyses. Finally, Section 5 discusses our findings, addresses theoretical and practical implications, and concludes with Section 6 with the study’s limitations and opportunities for future research.

2. Research Background

Vulnerability, in general, is a complex and multidimensional concept in different research fields, and this study is particularly interested in adopting the conceptual framework of supplier network vulnerability for building resilient railway systems. Supplier network vulnerability is defined as the susceptibility of a network to the probability and potential outcome of disruptions [9]. The nature of disruptions will continuously expose the system to a variety of risks, consequently making the entire network vulnerable regardless of how well the network is managed [11]. Thus, Wagner and Neshat [17] proposed how vulnerability should be measured and analyzed regarding exposure to environmental, network, and organizational risks.
To quantify and measure vulnerability, Christopher and Peck [11] identified that the fundamental issue of supply chain vulnerability is due to treating the chain as a linear structure, rather than a network structure. Consequently, they established three types of risks that can be interpreted in the following way from the railway network perspective: (1) internal risk to the station regarding process and control, (2) external risk to the station and internal risk to the railway network regarding passenger flow, and (3) risk that is external to the railway network, such as environmental risk. Moreover, Erol et al. [18] suggested the following calculation of vulnerability: the level of railway network vulnerability is defined as the likelihood of a disruptive event and the intensity of its consequence. To mitigate the effect of disruption, social network analysis has gained significant attention as a methodology for measuring an individual firm’s role in the structure network. In the railway network context, the methodology could aid in investigating the role of each railway station in the network. The two primary social network analysis metrics are degree centrality and betweenness centrality.
If the node provides a higher number of connections to different nodes, then the node is considered to have a high degree of centrality. A node that has a high level of centrality is often visualized with a larger size, thus becoming more visible in the map of a network [19,20,21]. When the other nodes are dependent on a particular node to connect to the rest of the network, this node is considered to have a high betweenness centrality [19,22]. High betweenness centrality also indicates the level of intermediary or brokerage roles that the node plays within the network. If a node with high betweenness centrality fails to provide a stable connection, the network will be exposed to overall disconnection.

3. Methodology

To consider both local- and network-level analyses of railway stations, we integrate node–place analysis and network analysis, as shown below (Figure 1).
For the local station sustainability analysis, we performed node and place analyses [23] based on the indicators listed in Table 1. The node index is defined as the quantitative measurement of station values, such as the accessibility of stations and the availability of train connections. In this study, the node index value is assigned based on the following six data sets: number of train arrivals and departures, number of train connections departing from a station, number of nearby subway stations, number of available bus stations within approximately 300 m, number of nearby buses, and number of available parking spaces.
Place index is defined as the quantitative measurement of activities in a place, such as the size of a population, labor activities, and tour activities. Place index is measured based on two datasets: the number of households in the district and the approximation of employees in nine sectors in the district. The data collection details are listed below, and the finalized data table is given in Table 2.
  • Frequency of train services (N1): The official Korail site provides a timetable for KTX and other train services. Based on the Gyeongbu line timetable, we extracted the average number of train arrivals and departures at each station per day.
  • Number of connections served (N2): Similarly, the average number of train connections provided by each train station per day was measured using the Gyeongbu line timetable data from the official Korail site.
  • Number of nearby subway stations (N3): Subway stations provide timely transportation services that conveniently complement the train station usage experience. While some train stations benefit from the closeness of one or even three linked subway stations using the same metro card (mostly divided by a single gate), some stations are unfortunately faced with limited accessibility because of the unavailability of subway services.
  • Number of available bus stations within 300 m (N4): The bus also plays a significant role in providing accessibility to railway services. The bus stations within approximately 300 m were measured and counted.
  • Number of buses (N5): Frequent bus services near train stations are often highly valued, as they are key to easy transferability.
  • Number of parking spaces (N6): The number of parking spaces was collected from the official Korail site. Parking spaces represent readiness to assist service users, who are interested in half-day or even longer travel, in using train stations. The availability and reliability of parking spaces are vital for enhancing the overall quality of train stations.
  • Number of residents in the area (P1): The number of residents within the city where train stations are located was measured based on Korean Statistical Information Service data. With the exception of Station 4 (Gwangmyeong), Station 5 (CheonanAsan), Station 8 (Gimcheon), Station 10 (Singyeongju), and Station 12 (Miryang), residents in the cities where train stations are located were measured. For others, due to limited data availability, the number of residents in the provinces is used instead.
  • Number of employees in the corresponding province (P2): Bertolini [24] analyzed four economic clusters: (i) retail, hotel, and catering; (ii) education, health, and culture; (iii) administration and services; and (iv) industry and distribution. In this study, we utilized eight economic clusters: (1) agricultural forestry and fisheries; (2) mining and manufacturing; (3) manufacturing; (4) social overhead capital and other services; (5) construction; (6) wholesale, retail, and accommodation; and (8) electricity, transportation, telecommunication, and finance. The data were obtained from the Korean Statistical Information Service. Our datasets represent provinces or cities, depending on the availability of the data.
  • Degree of multifunctionality (P3): While most stations in Korea primarily serve the purpose of providing train access to consumers, some of the stations also provide impeccable convenience for both consumers and retail stores. For example, Station 2 (Yeongdeungpo) is connected to a large department store and its underground shopping mall. Not only do train stations enhance functional quality from the transportation perspective, but they also demonstrate significant contributions to happiness through their facilitation of other social activities that meet consumers’ needs. Thus, the degree of multifunctionality allows for the integration of both elements in the assessment of place value.

4. Analysis of Local Station Performance Assessment

In this section, we perform two analyses: correlation and node–place analyses. While correlation analysis (Table 3) is expected to provide a quantitative understanding of the relationship between indices, node–place analysis is useful in understanding the level of sustainability of local stations.
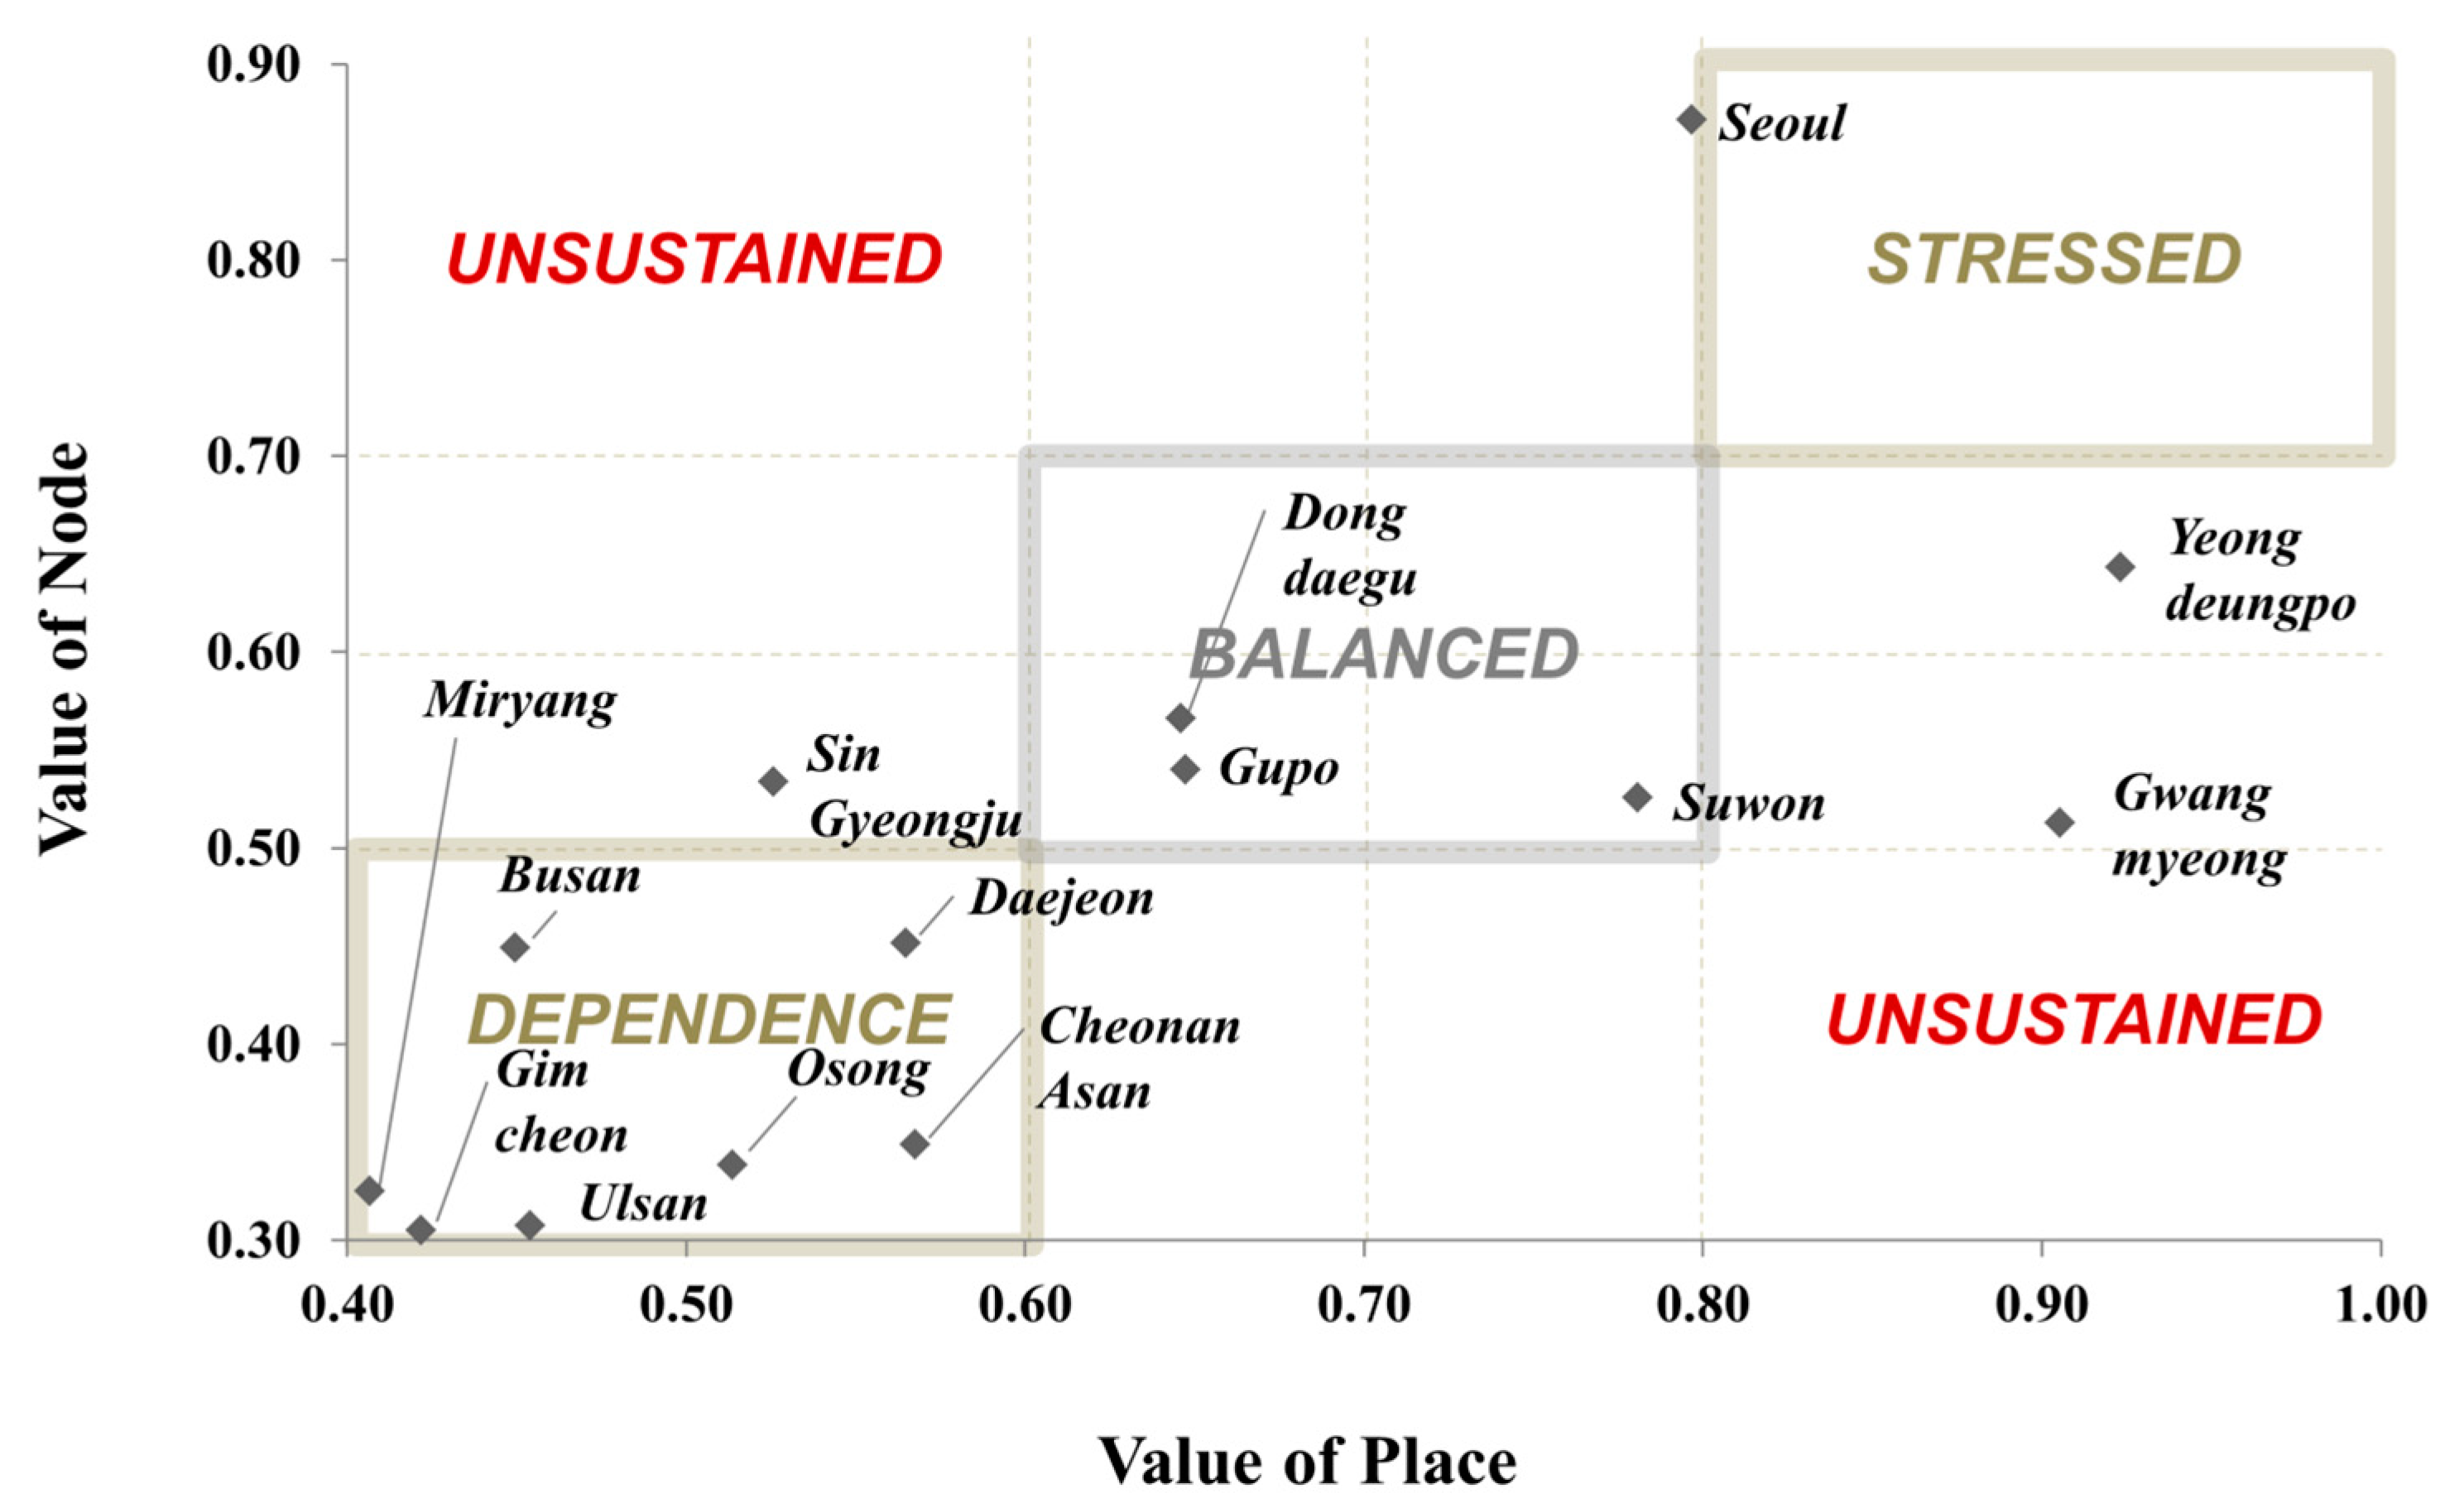
The number of nearby subway stations (N3) and degree of multifunctionality (P3) showed the highest correlation index, with a p-value less than 0.001. This indicates that stations with various functions besides train services are also connected with a higher number of subway stations, enabling access to a variety of consumers via efficient and convenient accessibility. Moreover, the numbers of subway stations (N3), available bus stations (N4), and buses available near the station (N5) are highly correlated with the number of employees in the area. This may be an intuitive finding, as for the higher number of employees, a higher number of transportations may be necessary. Lastly, the number of nearby buses (N5) is also positively correlated with the degree of multifunctionality (P3). This indicates that the common objective of transportation to a station may be expanded beyond train services. Service users often utilize buses to reach train stations for other functions, such as retail and dining activities. In Table 4 and Figure 2, the analysis results of the node–place analysis are shown.
Based on the node–place analysis, the well-balanced stations are Station 9 (Dongdaegu), Station 13 (Gupo), and Station 3 (Suwon), as they fall right on the diagonal line and are in between the dependency and stress regions. Both the sustained node and place functions are well aligned with the overall usage of the train station.
While Station 1 (Seoul) may appear to be the most efficient station for utilizing the potential of both node and place functions, one must be careful as Station 1 (Seoul) is equally exposed to vulnerabilities. For example, Station 1 (Seoul) is exposed to a variety of conflicts that may arise from train services, retail services, and social activities that are offered. Noticeably, dining and retail spaces in Station 1 (Seoul) are extremely small, and many mini food stands can be observed, unlike other stations with comfortable seats. Moreover, service users often lack spaces for waiting at the station and are forced to enter coffee shops to sit down and wait.
However, Station 8 (Gimcheon), Station 12 (Miryang), Station 11 (Ulsan), Station 14 (Busan), Station 6 (Osong), Station 5 (CheonanAsan), and Station 7 (Daejeon) are exposed to dependency issues. These stations show a lack of sustainability that will ultimately cause reliance on either government assistance or larger train stations that provide services. These stations need to improve the overall usage of space through the appropriate allocation of space to commercial businesses, thereby enhancing the overall functionality of the station.
Station 10 (Singyeongju), Station 2 (Yeongdeungpo), and Station 4 (Gwangmyeong) have the most unbalanced node and place values. While Station 10 (Singyeongju) has a high node value, the interactivities at the stations are limited. Despite the high potential for business–consumer or social interactions that are ready to unfold at the station, the station’s functions are not ready to meet the needs of unavailable retail or dining opportunities. On a similar note, Station 2 (Yeongdeungpo) and Station 4 (Gwangmyeong) provide excessive opportunities for human interactions when there is a low availability of trains and train connection services.

5. Analysis of Network Performance Assessment

While connections among train stations may benefit each by bringing one service user from one station to another, it also exposes each connected train station to other’s vulnerabilities. For example, passenger A needs to begin his trip from Station 14 (Busan) to Station 1 (Seoul). On the way, the passenger would like to stop at Station 7 (Daejeon) to buy the famous local bread. The passenger would most likely choose to take KTX rather than buses or planes for travel convenience. Through this decision, Station 14 (Busan), Station 7 (Daejeon), and Station 1 (Seoul) benefit from passenger A’s service usage. However, this also implies that if any of these three stations face technical failures that affect passenger A’s travel plan, all three stations will be exposed to penalties regardless of the source of the problem. Thus, the consideration of each railway station’s performance is vital for overall network management.
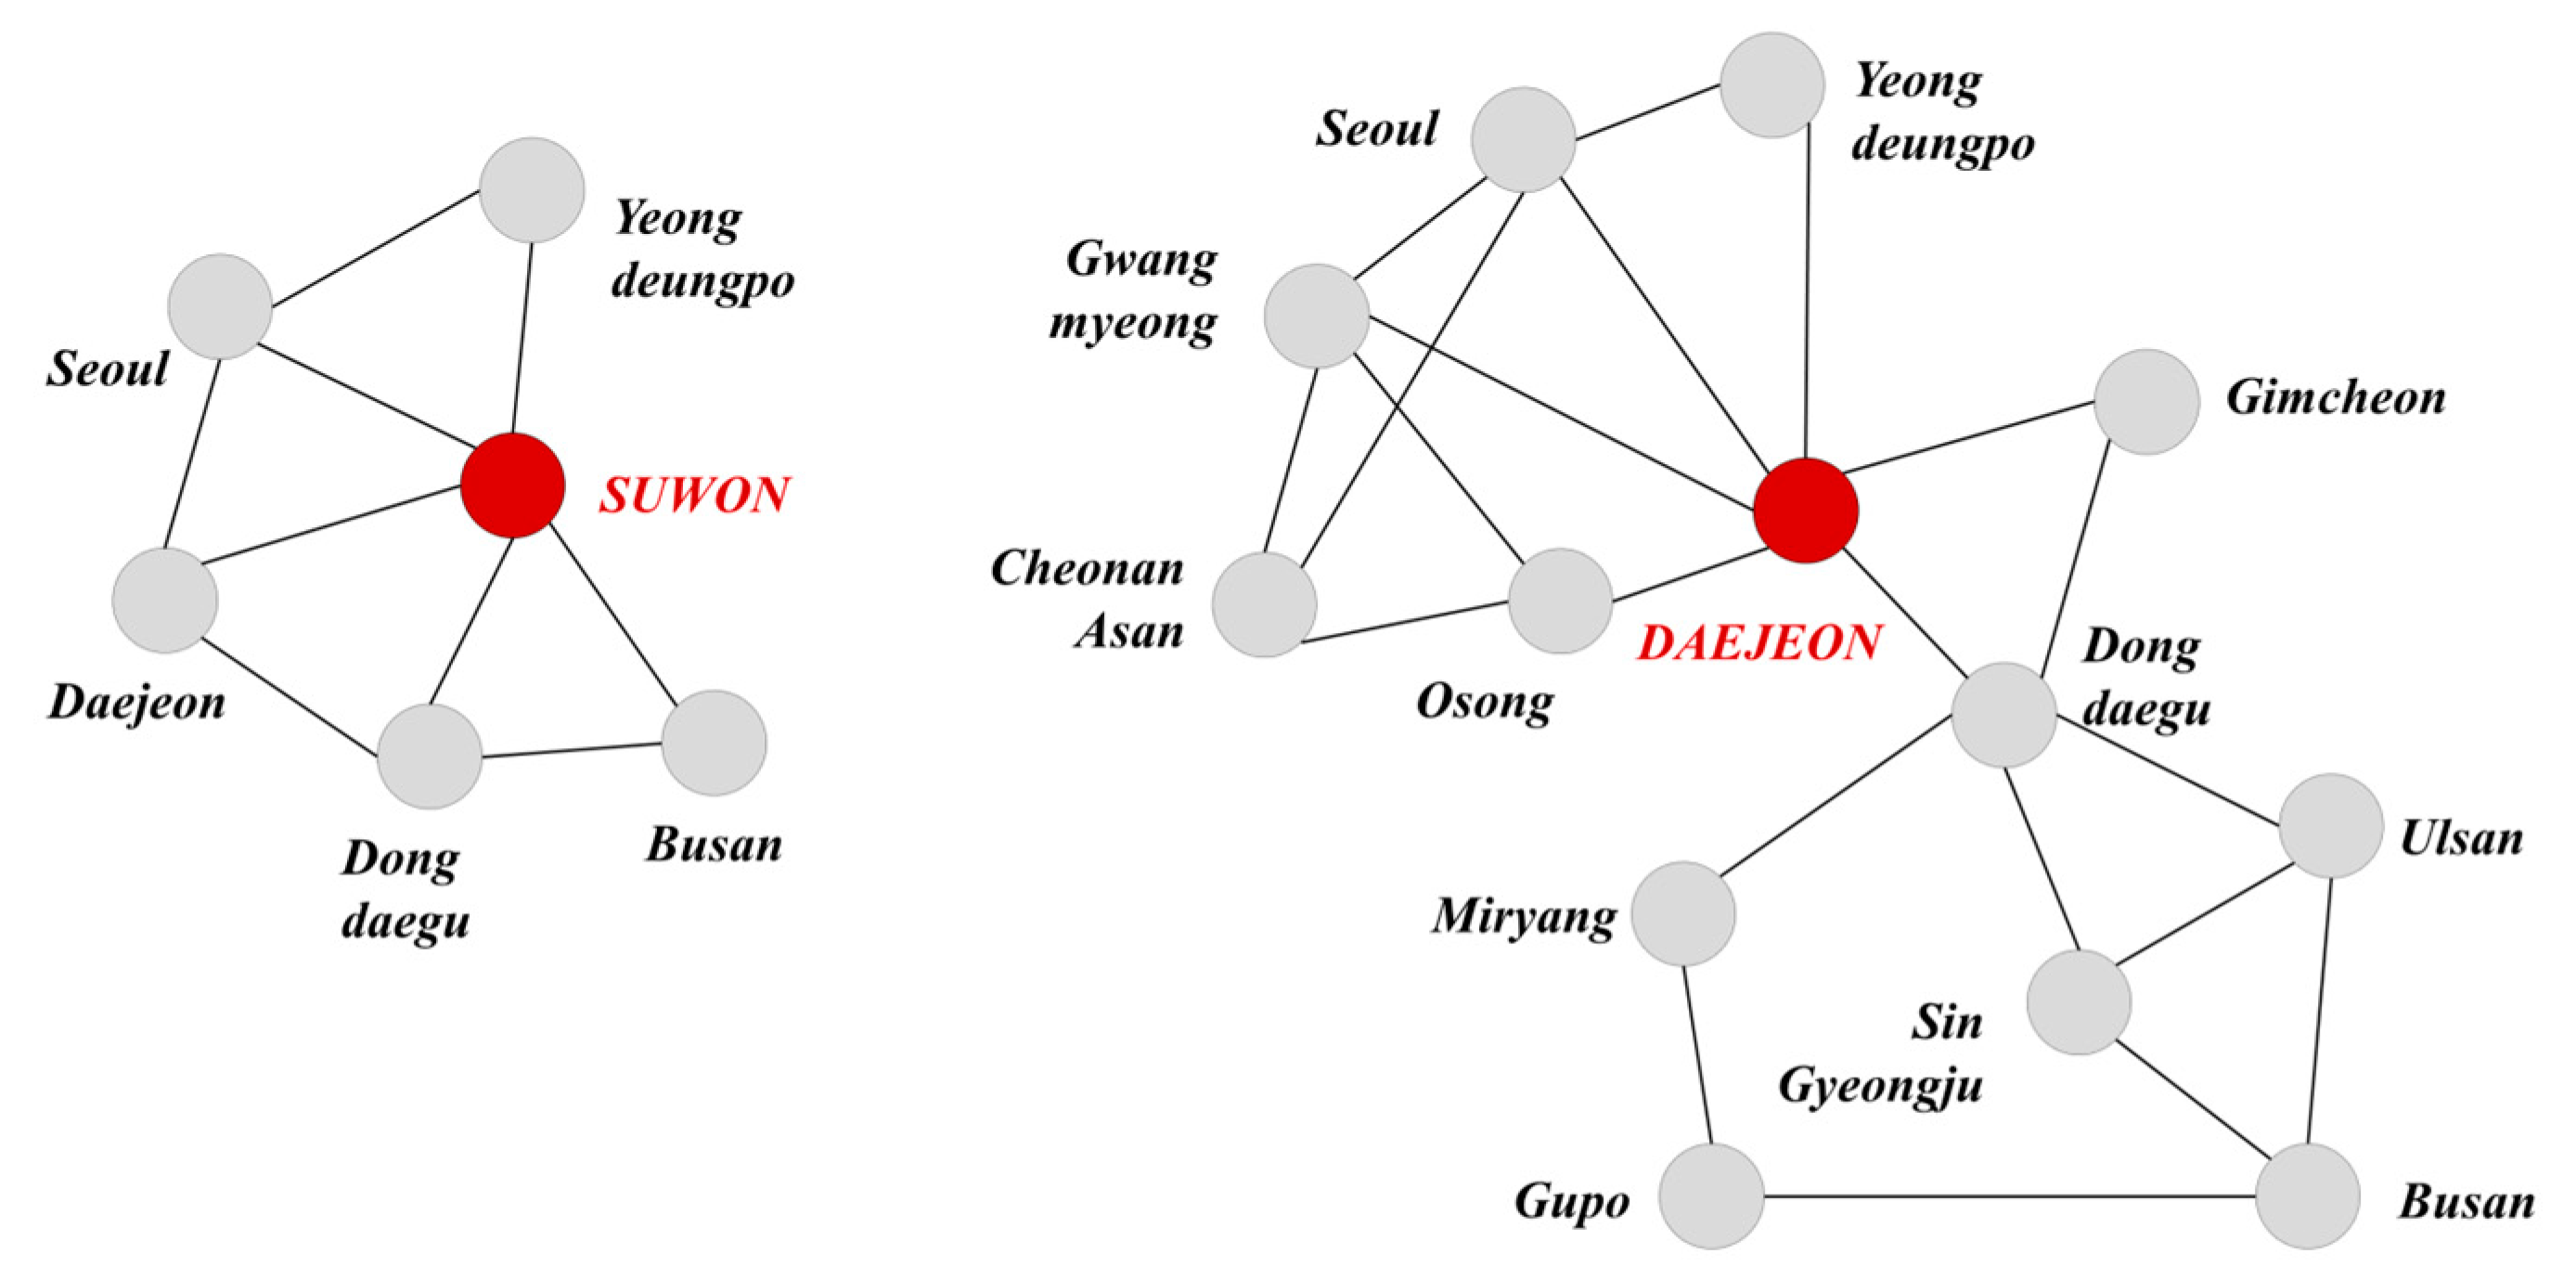
As shown in Figure 3, Station 12 (Miryang) has direct connections with Station 9 (Dongdaegu) and Station 13 (Gupo). Comparatively, Station 1 (Seoul) maintains a high number of direct connections with Station 2 (Yeongdeungpo), Station 4 (Gwangmyeong), etc. Station 12 (Miryang) and Station 1 (Seoul) may be considered as having low and high degrees of connectivity, respectively. The degree of station connectivity is defined by the number of connections made from or to the station [25].
Figure 4 demonstrates two exemplary cases: Station 3 (Suwon) and Station 7 (Daejeon). Station 3 (Suwon) provides connections to Station 7 (Daejeon), Station 9 (Dongdaegu), and Station 14 (Busan) from Seoul and Station 2 (Yeongdeungpo). On the one hand, passengers would be able to reach any destination without having to go through Station 3 (Suwon). We can conclude that Station 3 (Suwon) holds a very low betweenness centrality position in the network. On the other hand, Station 7 (Daejeon) noticeably maintains a highly central position, as do Seoul, Station 2 (Yeongdeungpo), Station 4 (Gwangmyeong), and Station 5 (CheonanAsan). The betweenness centrality of a station is defined as the number of connections made through the station. Simply put, it quantifies the effect of a node in terms of network management [26].
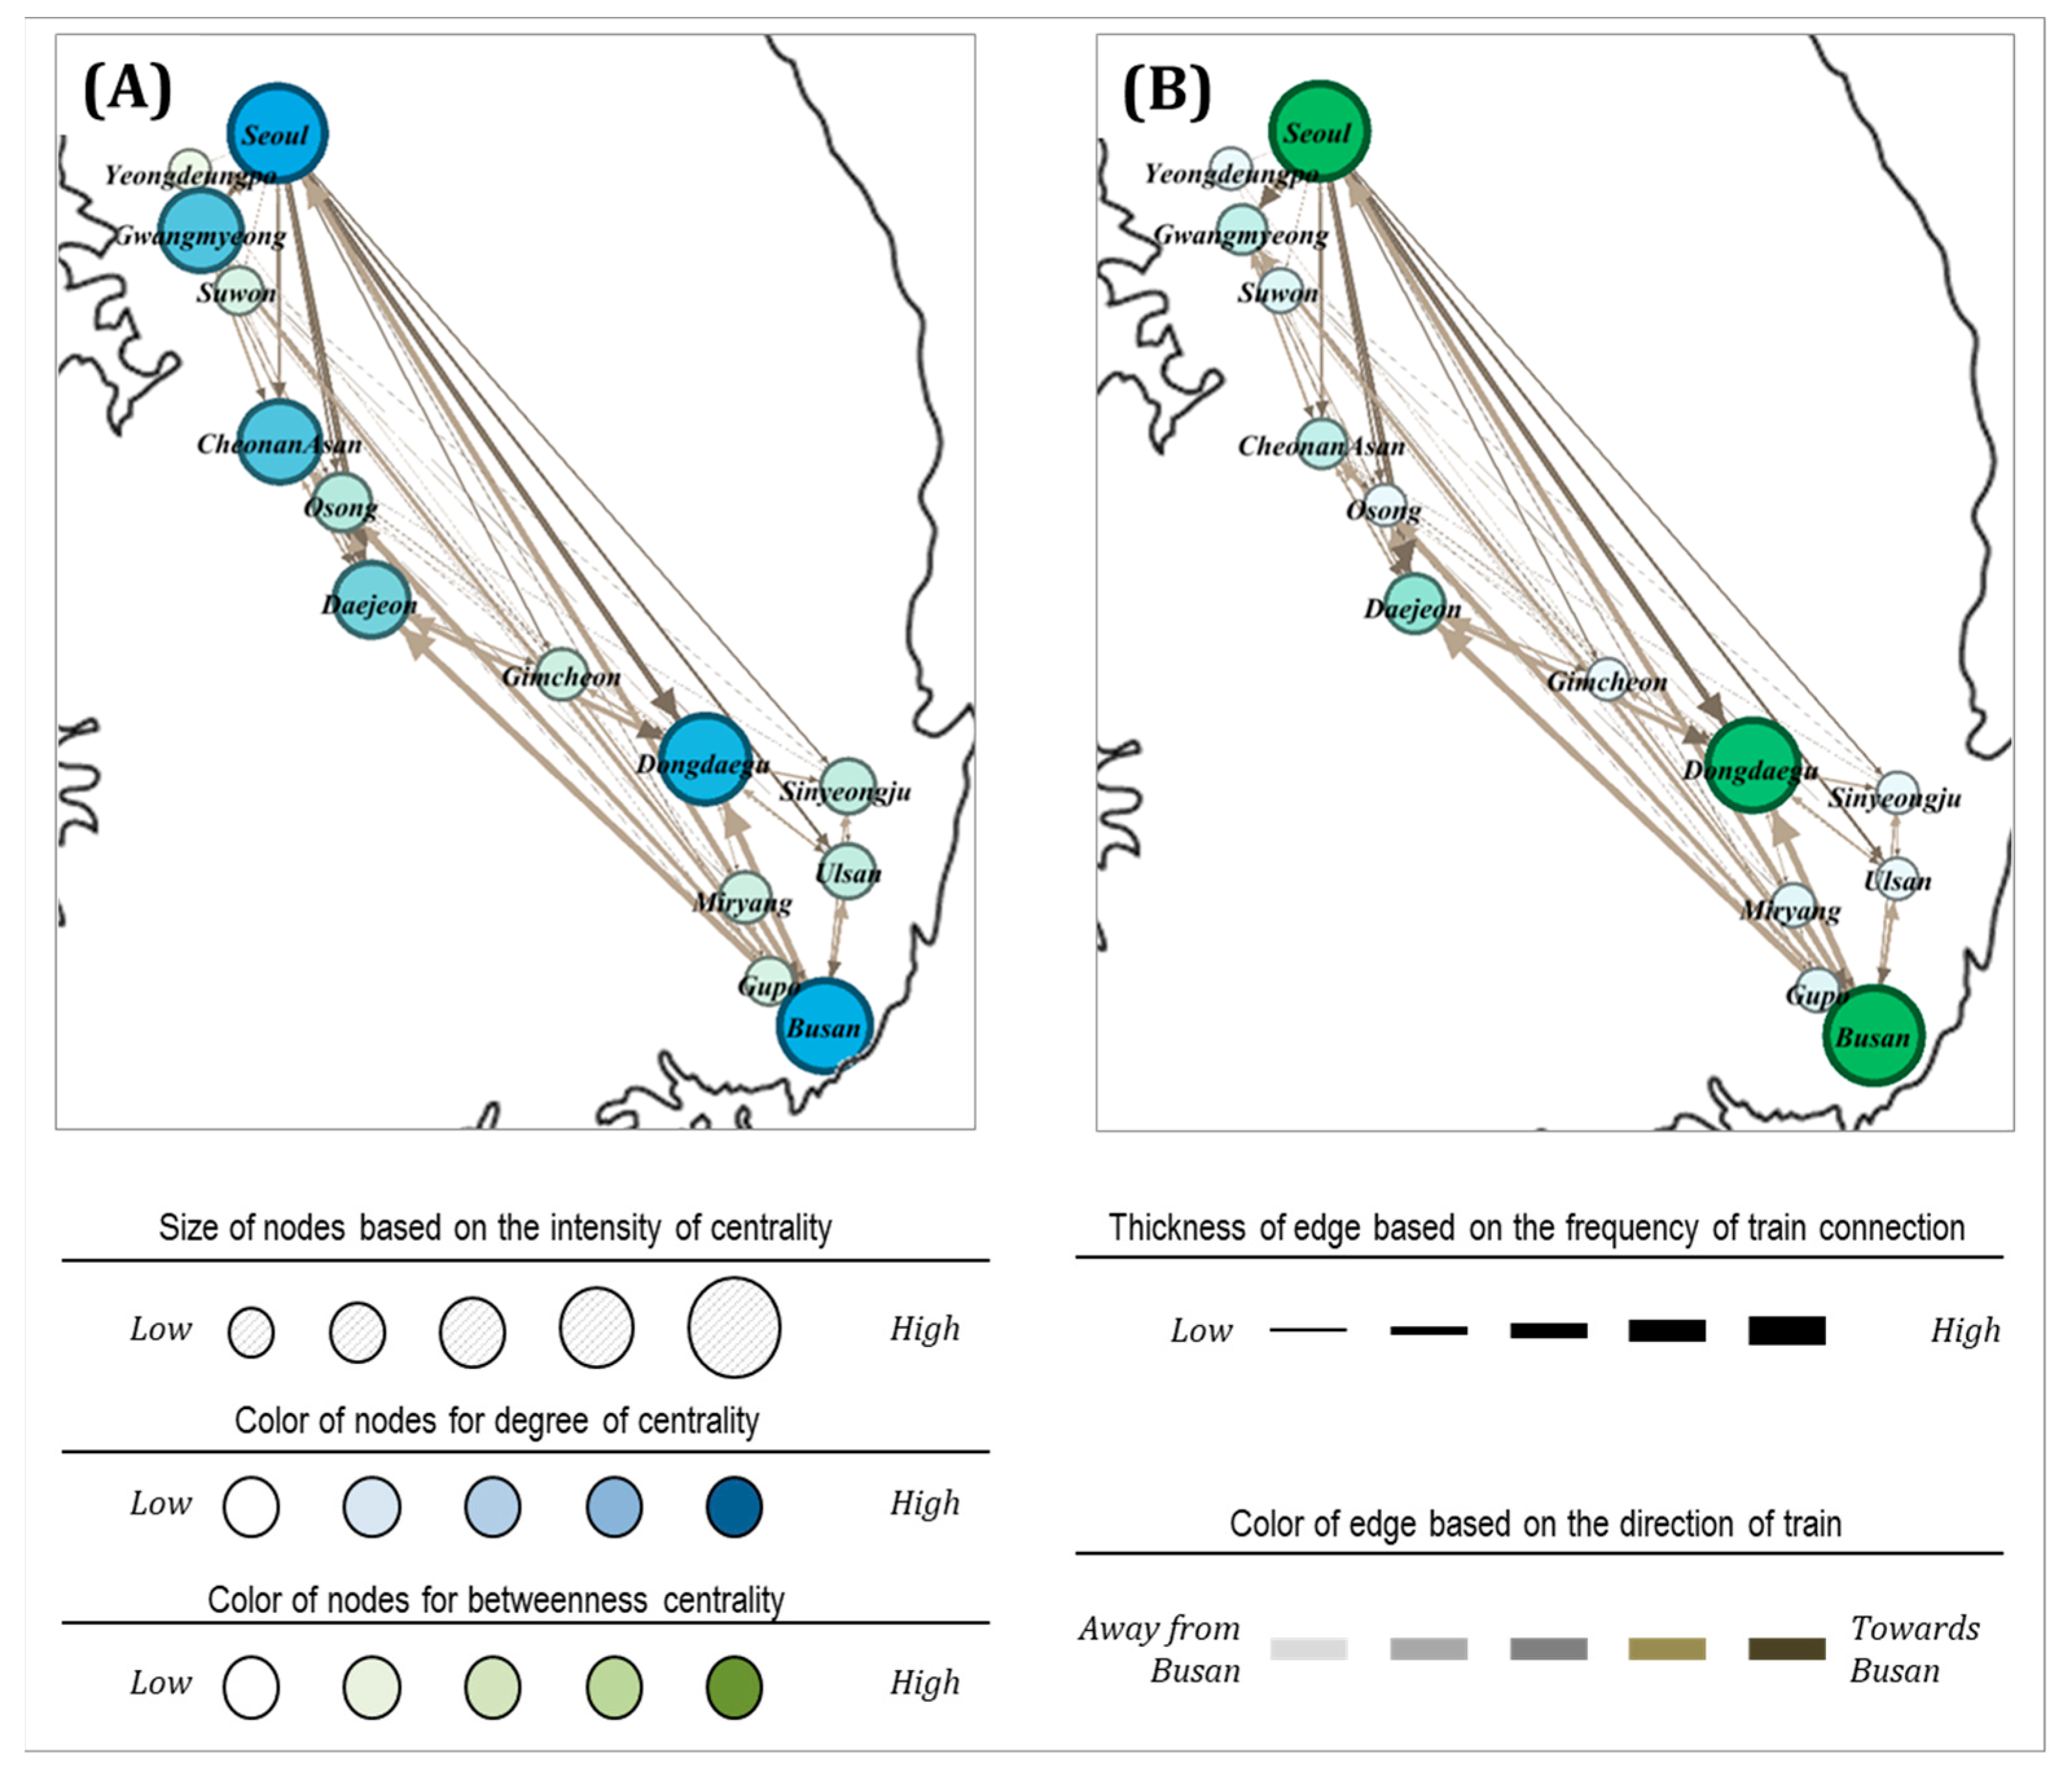
Figure 5 illustrates that the rail network is based on the degree of centrality and betweenness centrality. Station 1 (Seoul), Station 4 (Gwangmyeong), Station 5 (CheonanAsan), Station 9 (Dongdaegu), and Station 14 (Busan) connect to a high number of stations, while Station 8 (Gimcheon), Station 10 (Singyeongju), Station 11 (Ulsan), and Station 12 (Miryang) show a low degree of centrality. Interestingly, only Station 1 (Seoul), Station 9 (Dongdaegu), and Station 14 (Busan) show high betweenness centrality, while others show low betweenness centrality. The results and potential indications are summarized in Table 5.

6. Discussion

For sustainable railway station network management, we proposed integrating two decision perspectives: local and network performance. First, local performance is decided based on the assessment of both the node and place value of the station. The node value assessment determines the functional performance of the station, while place value assessment determines the ultimate value of the station’s service offerings as a place and its location. Such local performance assessment is expected to help railway station network management by comparing how one station’s value differs from that of other stations. Second, network performance is determined based on the intensity of involvement in the network structure, such as the degree and betweenness centrality of the station. The degree of station accessibility helps in understanding the accessibility level of each station, while the betweenness centrality quantitatively represents the intensity of the brokerage role of the station.
The results of the local- and network-level performance are listed in Table 6. Primarily, the sustainability of local stations must be achieved and valued prior to overall network improvement. Thus, we first ranked stations based on the local performance assessment, and then assigned an improvement order based on each station’s exposure level to network vulnerability.
One of the imperative management concerns in terms of resilience management involves distinguishing a specific network station’s (or a firm’s) poor and potentially exponentially worsening performance. For example, Blos et al. [27] identified poor-quality goods as one major problem for the electronics industry, in which defective parts are found later in production, rather than in an earlier sourcing process. Adopting this view of domino effects, the identification of a critical path or a logistics route is useful in highlighting the most threatening fatal path within the network. This approach is typical when specific stations (or suppliers) are represented as a network in which the firms belong to a connected path exposed to a set of uncertain events.
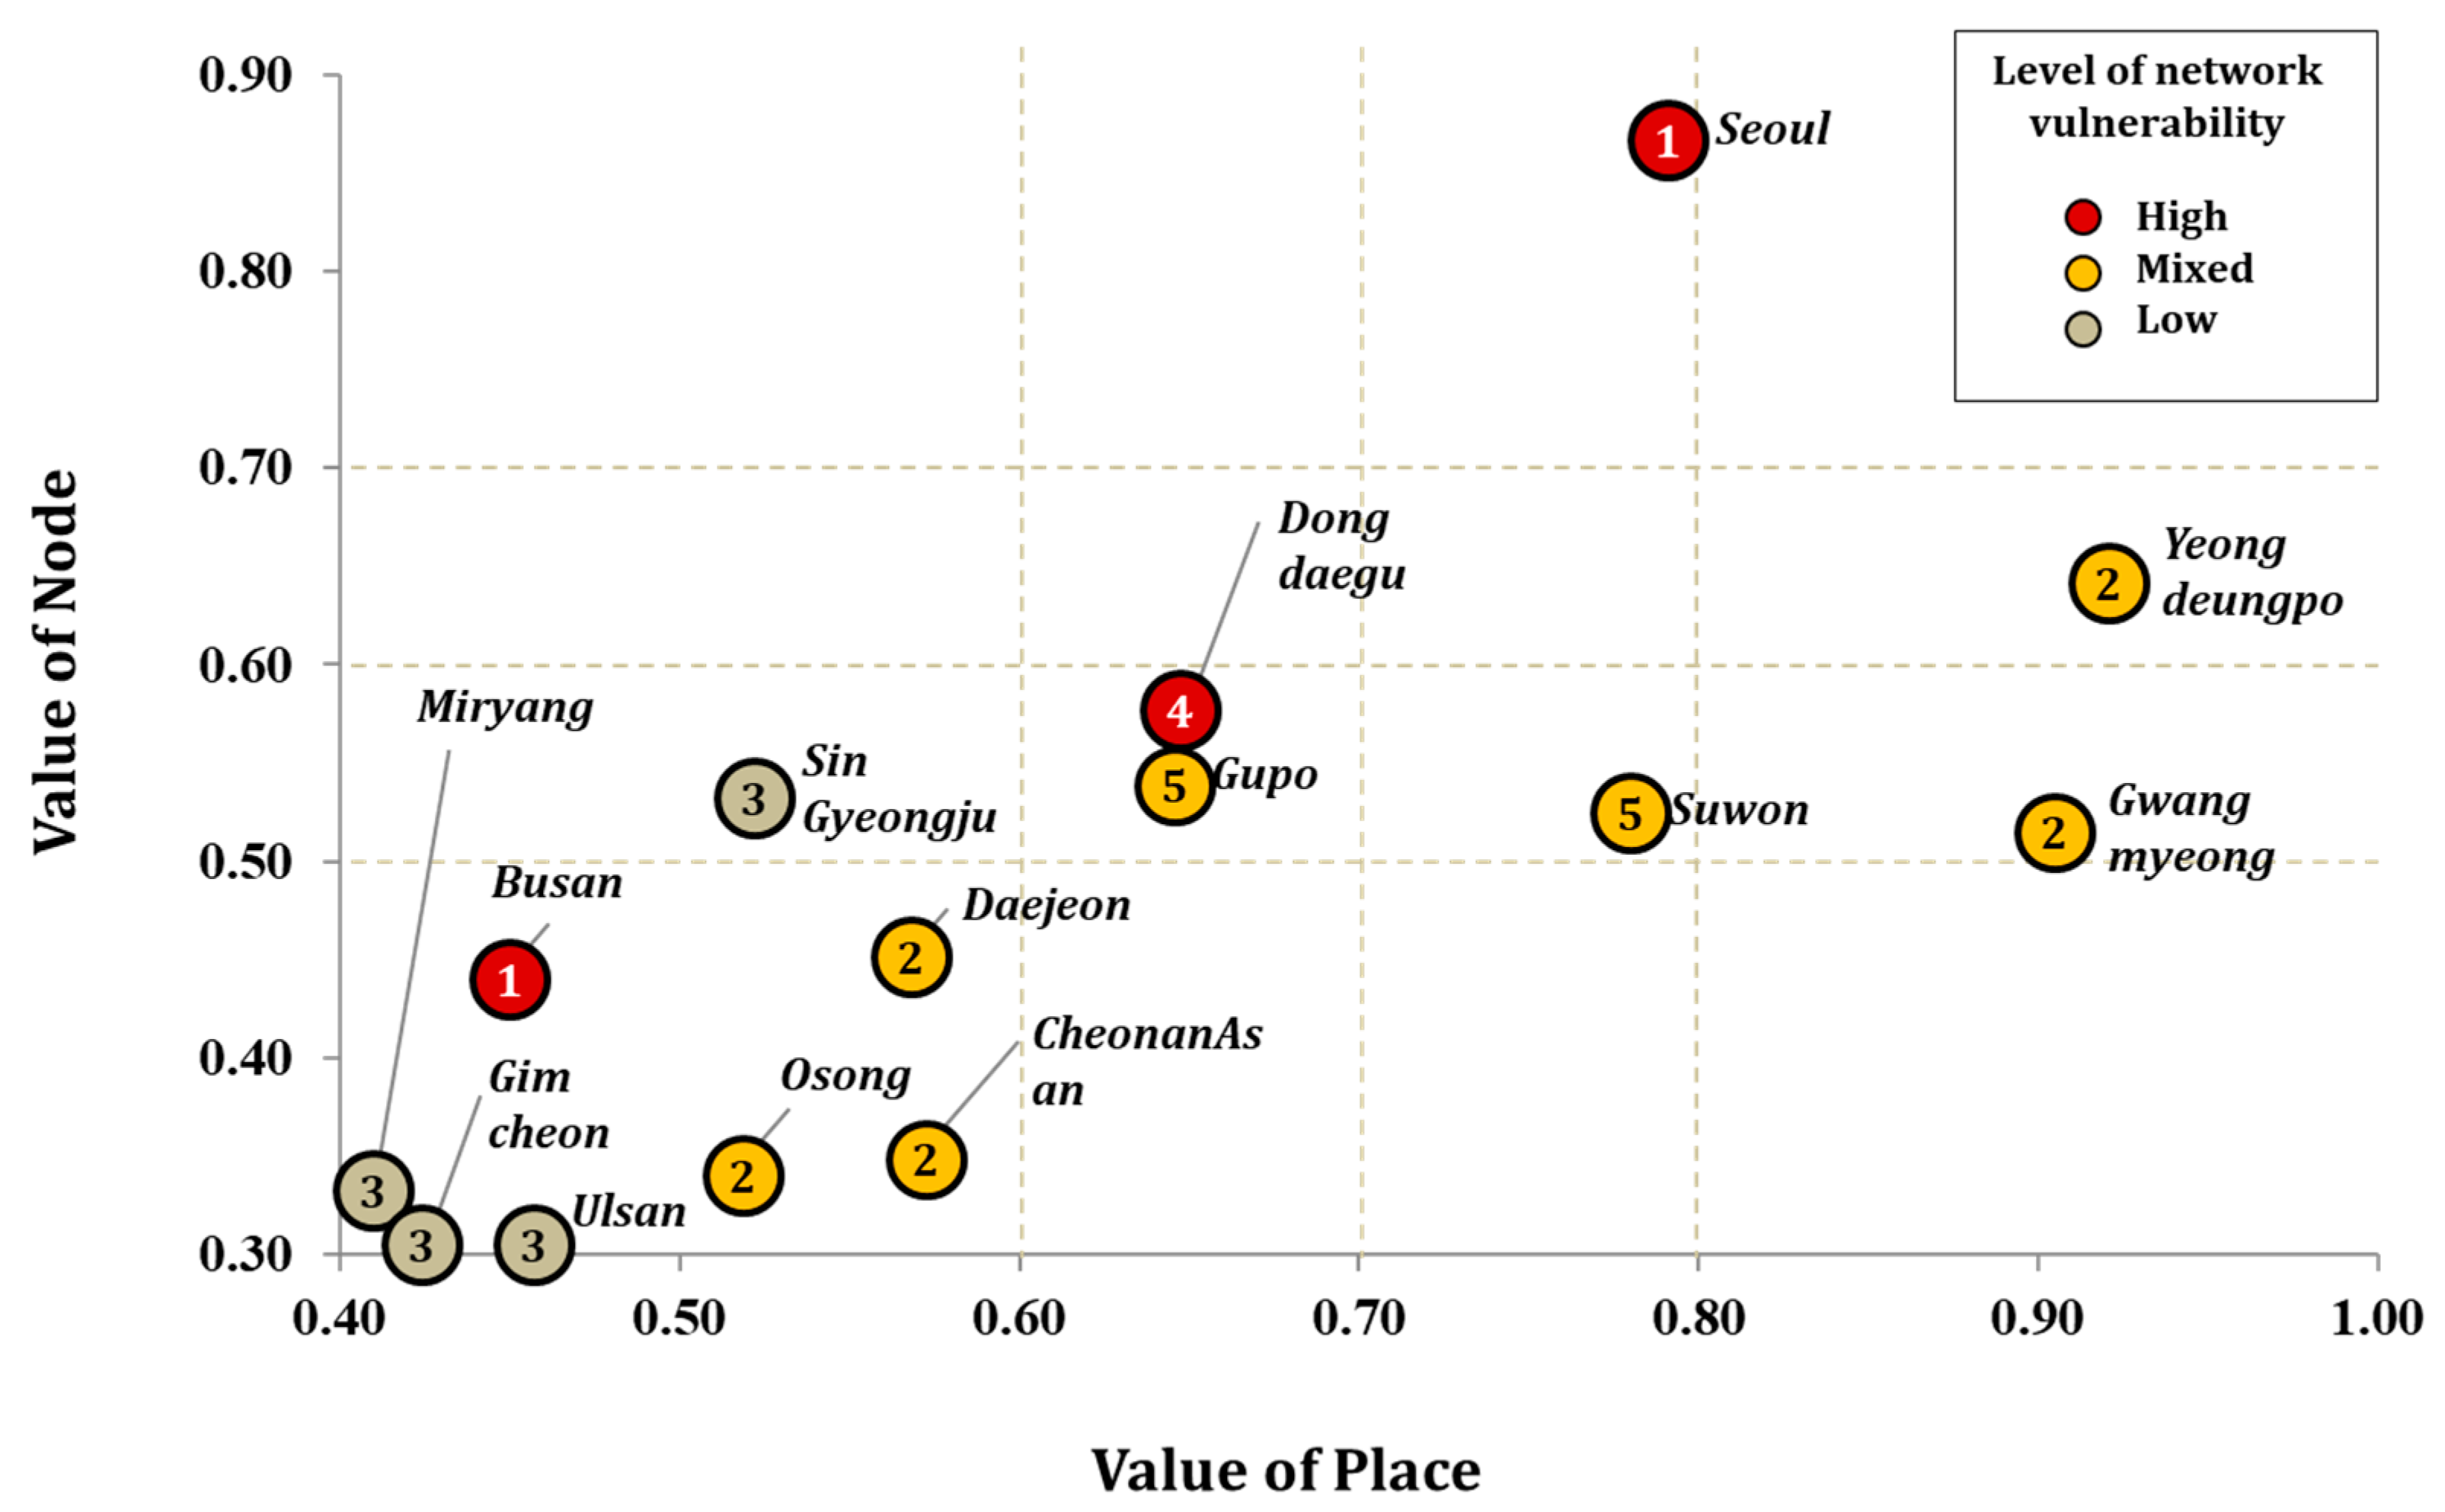
Based on a visual identification of critical railway stations in Figure 6, the recommended pathways for balanced and sustained railway station management are listed in Table 6. Station 1 (Seoul) should consider lowering the value of its node, while Station 2 (Yeongdeungpo) and Station 4 (Gwangmyeong) should reconsider their place value. Most importantly, Station 12 (Miryang), Station 8 (Gimcheon), Station 11 (Ulsan), Station 10 (Singyeongju), Station 7 (Daejeon), Station 6 (Osong), and Station 5 (CheonanAsan) should undergo significant improvements in planning so as to improve both node and place values.

7. Conclusions

Since 2019, global supply chains have suffered because of the COVID-19 pandemic. This has attracted growing interest in supply chain vulnerability and disruption. Worldwide companies simultaneously face catastrophic disasters, and many upstream and downstream supply chains have been stopped or delayed. Various supply chain networks should be prepared via mitigating or alternative solutions to prevent or reduce massive damage from unpredicted disruptions.
This study makes two main contributions to railway station network management as related to supply chain vulnerability. First, as a parallel effort to various attempts at optimizing networks through efficient allocations of the train and financial resources, this study highlights the importance of both local and network sustainability management practices. Based on the resilience practice suggested by Christopher and Peck [11], railway station network management could benefit from the following process: proactive preparation against both internal and external risks. Similarly, we propose the following approach to planning for railway station network sustainability: (i) integrate resilience practice rather than treating it as a separate effort; (ii) coordinate a high level of collaboration among the stations; (iii) collectively understand the value of agility, and finally, create a risk management culture within the network to enhance railway network resilience continuously.
Second, from a managerial perspective, both local station management and entire railway station network management are equally important. While local station managers should continuously observe and utilize local station data to achieve an overall balance of node and place values, network managers should identify the vulnerabilities of the network, and simulate possible size and timing effects on the entire network derived from a single station. This study has several limitations. First, node–place analysis can be improved using more extended attributes and regional data (versus city data), as suggested in other studies [15,16,28,29]. Second, for an additional level of network analysis, the arrival time and travel time may be considered for nodes and edges, respectively. However, we did not include such data, as such an analysis would go beyond the scope of this study. Lastly, structured interviews with rail network management could aid future studies in integrating both network and rail business perspectives.

Author Contributions

All authors contributed to the conceptualization, methodology, validation, resources, and writing of the manuscript. All authors have read and agreed to the published version of the manuscript.

Funding

This work was supported by the Ministry of Education of the Republic of Korea and the National Research Foundation of Korea (NRF-2020S1A5A8045955).

Data Availability Statement

Publicly available datasets were analyzed in this study. This data can be found here: http://www.letskorail.com, accessed on 23 April 2021.

Conflicts of Interest

The authors declare no conflict of interest.

References

  1. De, A.; Mogale, D.G.; Zhang, M.; Pratap, S.; Kumar, S.K.; Huang, G.Q. Multi-period multi-echelon inventory transportation problem considering stakeholders behavioural tendencies. Int. J. Prod. Econ. 2020, 225, 107566. [Google Scholar] [CrossRef]
  2. Tang, C. Robust strategies for mitigating supply chain disruptions. Int. J. Logist. 2006, 9, 33–45. [Google Scholar] [CrossRef]
  3. Snyder, L.V.; Shen, Z.-J.M. Frontiers of Engineering; National Academies Press: Washington, DC, USA, 2007; ISBN 978-0-309-10339-8. [Google Scholar]
  4. Sahoo, P. Ashwani COVID-19 and Indian Economy: Impact on Growth, Manufacturing, Trade and MSME Sector. Glob. Bus. Rev. 2020, 21, 1159–1183. [Google Scholar] [CrossRef]
  5. Goswami, M.; Daultani, Y.; De, A. Decision modeling and analysis in new product development considering supply chain uncertainties: A multi-functional expert based approach. Expert Syst. Appl. 2021, 166, 114016. [Google Scholar] [CrossRef]
  6. Blackhurst, J.; Dunn, K.S.; Craighead, C.W. An empirically derived framework of global supply resiliency. J. Bus. Logist. 2011, 32, 374–391. [Google Scholar] [CrossRef]
  7. Goswami, M.; De, A.; Habibi, M.K.K.; Daultani, Y. Examining freight performance of third-party logistics providers within the automotive industry in India: An environmental sustainability perspective. Int. J. Prod. Res. 2020, 58, 7565–7592. [Google Scholar] [CrossRef]
  8. Ambulkar, S.; Blackhurst, J.; Grawe, S. Firm’s resilience to supply chain disruptions: Scale development and empirical examination. J. Oper. Manag. 2015, 33–34, 111–122. [Google Scholar] [CrossRef]
  9. Jüttner, U.; Maklan, S. Supply chain resilience in the global financial crisis: An empirical study. Supply Chain Manag. Int. J. 2011, 16, 246–259. [Google Scholar] [CrossRef]
  10. Pettit, T.J.; Croxton, K.L.; Fiksel, J. Ensuring supply chain resilience: Development and implementation of an assessment tool. J. Bus. Logist. 2013, 34, 46–76. [Google Scholar] [CrossRef]
  11. Christopher, M.; Peck, H. Building the resilient supply chain. Int. J. Logist. Manag. 2004, 15, 1–14. [Google Scholar] [CrossRef] [Green Version]
  12. Hohenstein, N.-O.; Feisel, E.; Hartmann, E.; Giunipero, L. Research on the phenomenon of supply chain resilience. Int. J. Phys. Distrib. Logist. Manag. 2015, 45, 90–117. [Google Scholar] [CrossRef]
  13. Ponomarov, S.Y.; Holcomb, M.C. Understanding the concept of supply chain resilience. Int. J. Logist. Manag. 2009, 20, 124–143. [Google Scholar] [CrossRef]
  14. Rice, J.B., Jr.; Caniato, F. Building a secure and resilient supply network. Supply Chain Manag. Int. J. 2003, 7, 22–30. [Google Scholar] [CrossRef]
  15. Chorus, P.; Bertolini, L. An application of the node place model to explore the spatial development dynamics. J. Transp. Land Use 2011, 4, 45–58. [Google Scholar] [CrossRef]
  16. Papa, E.; Bertolini, L. Accessibility and Transit-Oriented Development in European metropolitan areas. J. Transp. Geogr. 2015, 47, 70–83. [Google Scholar] [CrossRef] [Green Version]
  17. Wagner, S.M.; Neshat, N. Assessing the vulnerability of supply chains using graph theory. Int. J. Prod. Econ. 2010, 126, 121–129. [Google Scholar] [CrossRef]
  18. Erol, O.; Sauser, B.J.; Mansouri, M. A framework for investigation into extended enterprise resilience. Enterp. Inf. Syst. 2010, 4, 111–136. [Google Scholar] [CrossRef]
  19. Kim, Y.; Choi, T.Y.; Yan, T.; Dooley, K. Structural investigation of supply networks: A social network analysis approach. J. Oper. Manag. 2011, 29, 194–211. [Google Scholar] [CrossRef]
  20. Arya, B.; Lin, Z. Understanding Collaboration Outcomes From an Extended Resource-Based View Perspective: The Roles of Organizational Characteristics, Partner Attributes, and Network Structures. J. Manag. 2007, 33, 697–723. [Google Scholar] [CrossRef] [Green Version]
  21. Hearnshaw, E.J.S.; Wilson, M.M.J. A complex network approach to supply chain network theory. Int. J. Oper. Prod. Manag. 2013, 33, 442–469. [Google Scholar] [CrossRef]
  22. Bellamy, M.A.; Ghosh, S.; Hora, M. The influence of supply network structure on firm innovation. J. Oper. Manag. 2014, 32, 357–373. [Google Scholar] [CrossRef]
  23. Bertolini, L. Station areas as nodes and places in urban networks: An analytical tool and alternative development strategies. In Railway Development: Impacts on Urban Dynamics; Physica Verlag Heidelberg: Heidelberg, Germany, 2008; pp. 35–57. ISBN 9783790819717. [Google Scholar]
  24. Bertolini, L. Spatial Development Patterns and Public Transport: The Application of an Analytical Model in the Netherlands. Plan. Pract. Res. 1999, 14, 199–210. [Google Scholar] [CrossRef]
  25. Kim, Y.; Chen, Y.S.; Linderman, K. Supply network disruption and resilience: A network structural perspective. J. Oper. Manag. 2015, 33–34, 43–59. [Google Scholar] [CrossRef] [Green Version]
  26. Basole, R.C.; Bellamy, M.A. Visual analysis of supply network risks: Insights from the electronics industry. Decis. Support Syst. 2014, 67, 109–120. [Google Scholar] [CrossRef]
  27. Blos, M.F.; Quaddus, M.; Wee, H.M.; Watanabe, K. Supply chain risk management (SCRM): A case study on the automotive and electronic industries in Brazil. Supply Chain Manag. Int. J. 2009, 14, 247–252. [Google Scholar] [CrossRef]
  28. Papa, E.; Pagliara, F.; Bertolini, L. Rail system development and urban transformations: Towards a spatial decision support system. In Railway Development: Impacts on Urban Dynamics; Physica Verlag Heidelberg: Heidelberg, Germany, 2008; pp. 337–357. ISBN 9783790819717. [Google Scholar]
  29. Bruinsma, F.; Pels, E.; Priemus, H.; Rietveld, P.; Van Wee, B. Railway Development: Impacts on Urban Dynamics; Physica Verlag Heidelberg: Heidelberg, Germany, 2008; ISBN 9783790819717. [Google Scholar]
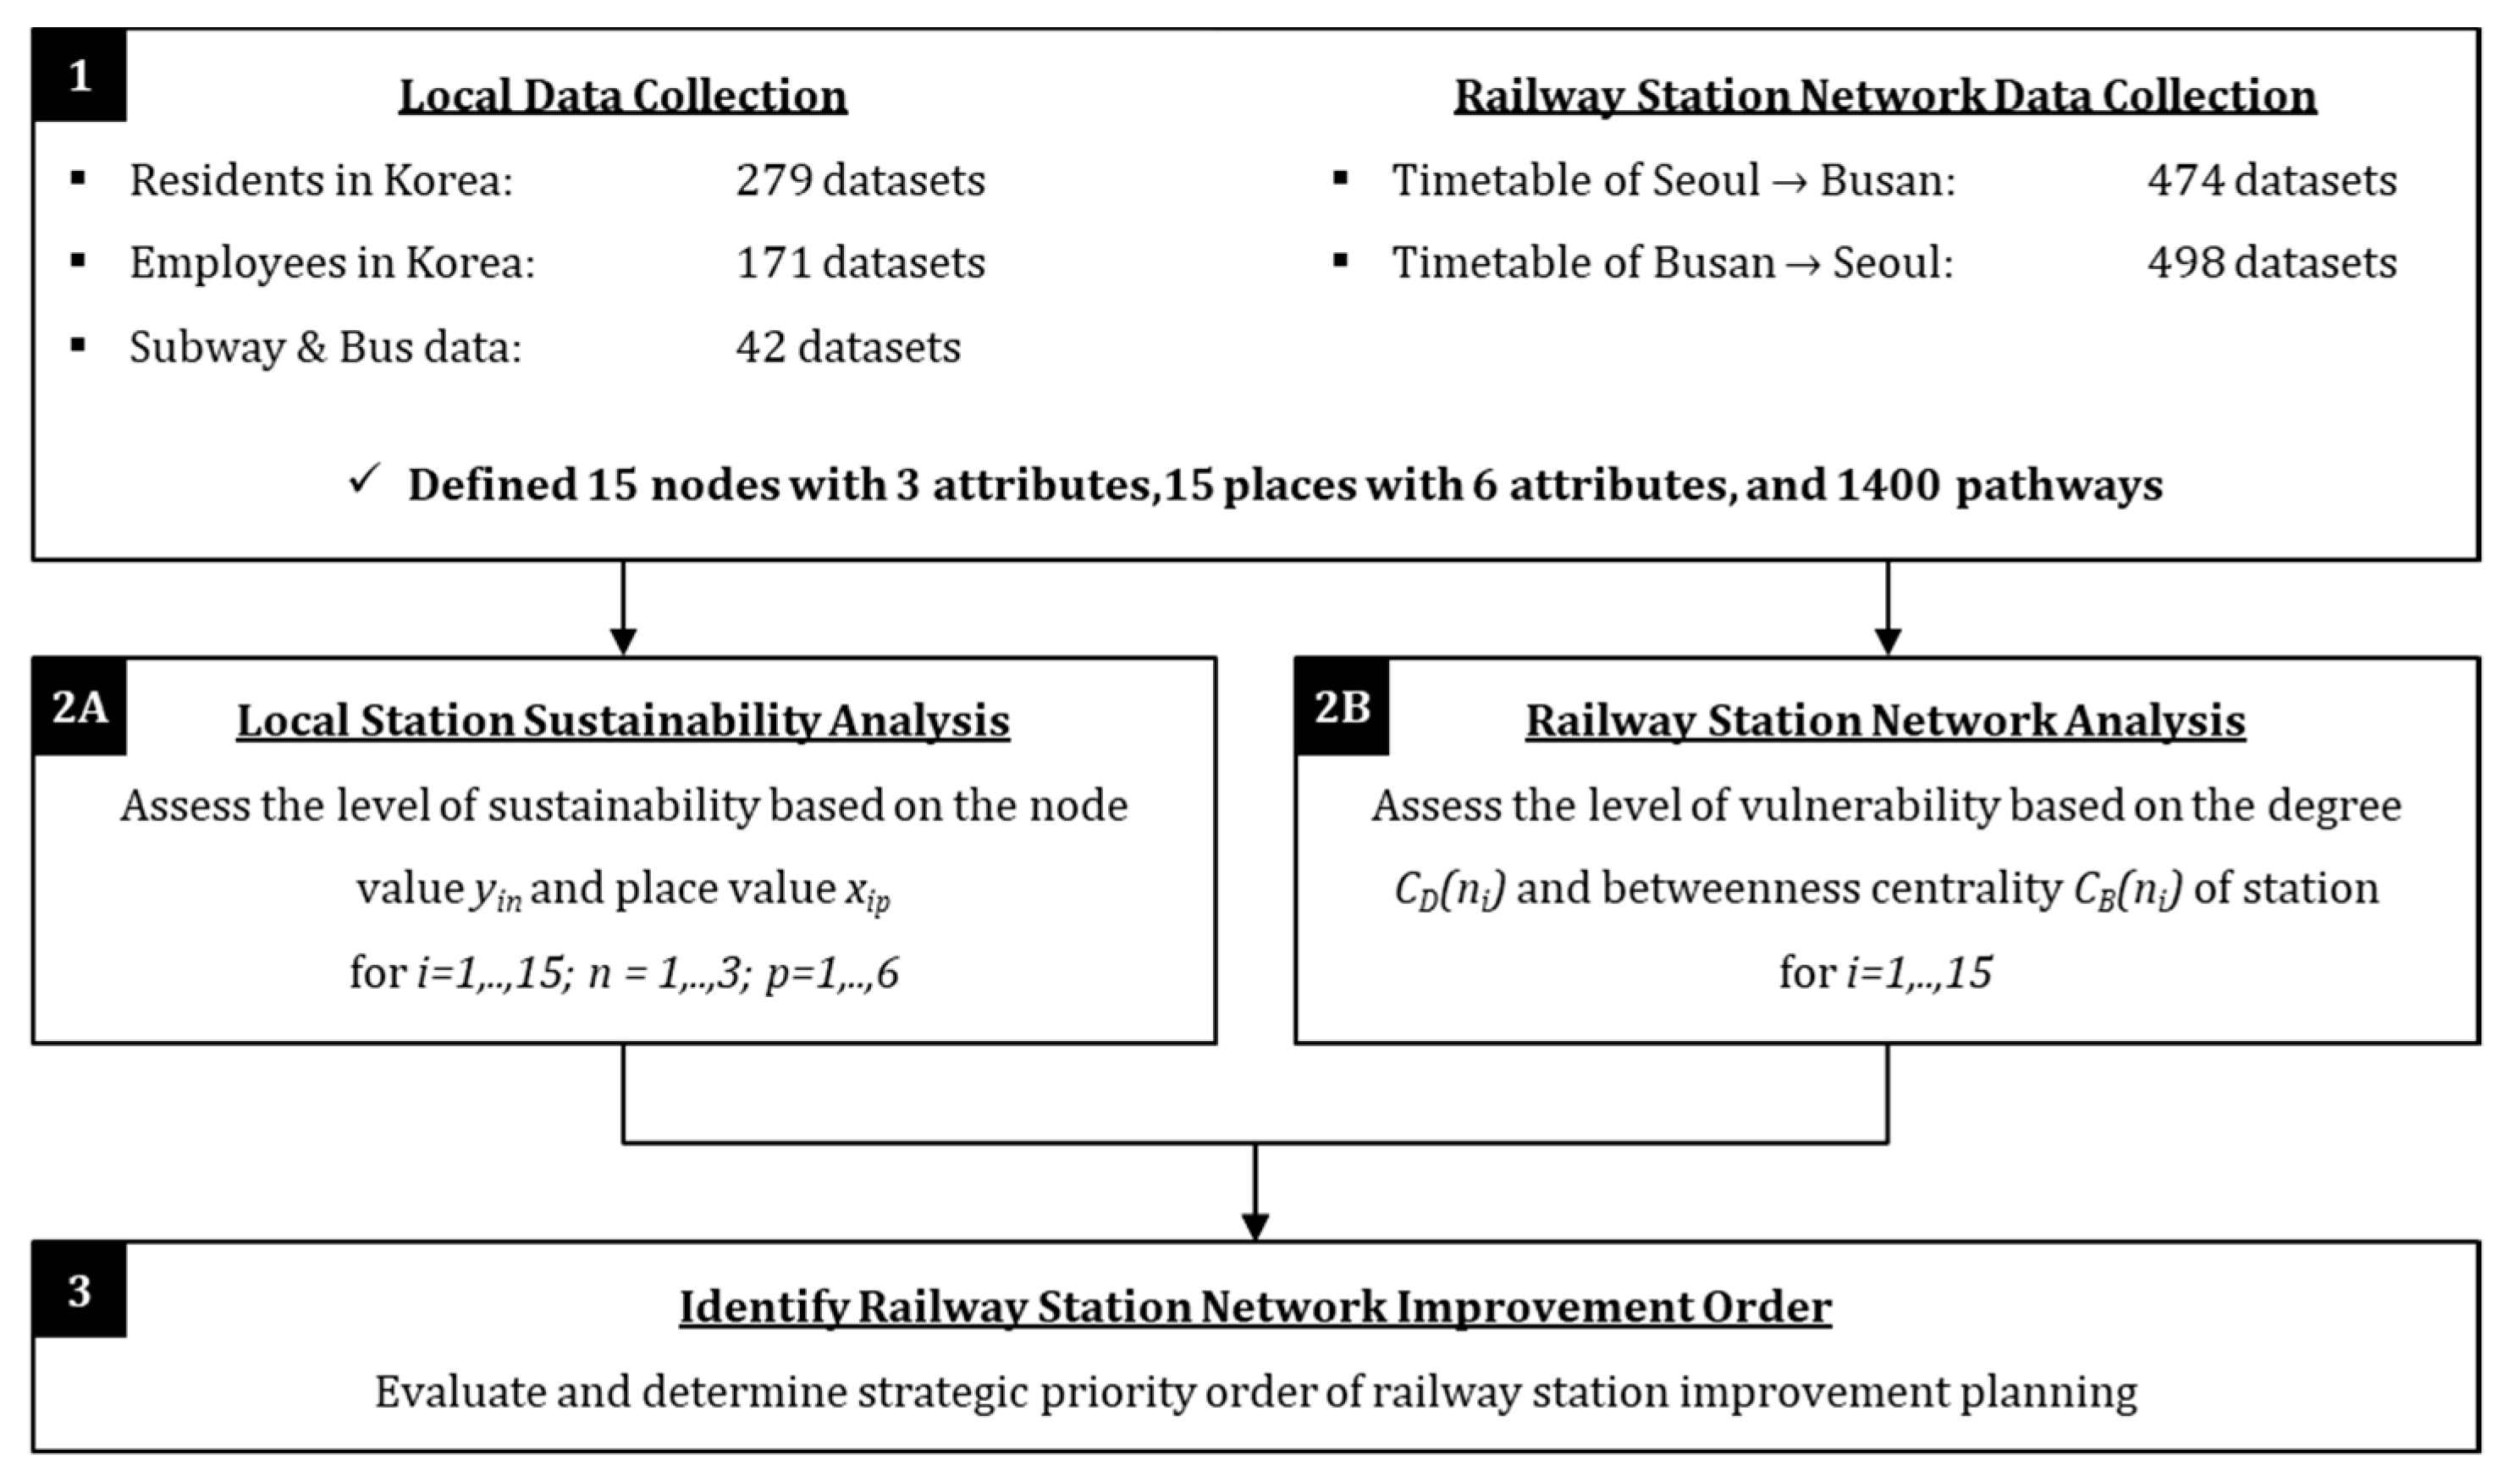
Figure 1. Research framework for an integrative local and network performance analysis.
Sustainability 13 04778 g001
Figure 2. Sustainability level based on place value (x-axis) and node value (y-axis).
Sustainability 13 04778 g002
Figure 3. Example of low degree (left) and high degree (right) of station connectivity.
Sustainability 13 04778 g003
Figure 4. Example of low betweenness centrality (left) and high betweenness centrality (right) of stations.
Sustainability 13 04778 g004
Figure 5. Railway station network model based on (A) the degree of centrality and (B) the betweenness centrality.
Sustainability 13 04778 g005
Figure 6. Improvement guideline for reaching railway station network sustainability.
Sustainability 13 04778 g006
Table 1. Description and measurement of node and place attributes.
DescriptionMeasurements of Indicators
Frequency of train servicesN1Average number of arriving and departing trains at the station
Number of train connections servedN2Average number of train connections that are made at the station
Number of nearby subway stationsN3Number of subway stations that are within 300 m of the train station
Number of nearby bus stations N4Number of bus stations that are within 300 m of the train station
Number of available bus servicesN5Number of busses that stop at train station main bus stop
Number of available parking spacesN6Number of official parking spaces available at the train station
Number of residents P1Number of residents in the province
Number of employees P2Number of employees in the eight economic sectors
Degree of multifunctionalityP3Standard deviation of number of employees for each economic sector for n sectors at station j where n = 1, …, 8 and j = 1, …, 15
Table 2. Collected data of node and place attributes.
NodeP1P2P3N1N2N3N4N5N6
Station 1 (Seoul)228,8655,379,0001.009974141821337
Station 2 (Yeongdeungpo)369,0245,379,0001.00462101261187
Station 3 (Suwon)197,2916,991,0000.81862191451353
Station 4 (Gwangmyeong)335,1126,991,0000.8172618661769
Station 5 (CheonanAsan)306,4521,336,0000.685871775524
Station 6 (Osong)254,022884,0000.73537-4251821
Station 7 (Daejeon)233,240799,0000.95112611350217
Station 8 (Gimcheon)143,0951,491,0000.66347-574448
Station 9 (Dongdaegu)351,2181,284,0000.80109618122322
Station 10 (Singyeongju)258,2801,491,0000.66337-332598
Station 11 (Ulsan)218,853606,0000.6817-5401065
Station 12 (Miryang)108,2191,775,0000.67148-573105
Station 13 (Gupo)308,0671,758,0000.86148174664
Station 14 (Busan)89,0791,758,0000.86107611169529
Table 3. Correlation table of node and place indices.
P1
Number of Residents
P2
Number of Employees
P3
Degree of Multifunctionality
N1
Frequency of train services
0.001
(0.998)
−0.109
(0.711)
0.313
(0.277)
N2
Number of train connections served
−0.226
(0.436)
−0.398
(0.159)
−0.345
(0.227)
N3
Number of nearby subway station
0.214
(0.462)
0.656 *
(0.011)
0.790 **
(0.001)
N4
Number of nearby bus stations
−0.062
(0.832)
0.617 *
(0.019)
0.624 *
(0.017)
N5
Number of available bus services
0.100
(0.734)
0.648 *
(0.012)
0.555 *
(0.039)
N6
Number of available parking spaces
0.249
(0.392)
0.603 *
(0.022)
0.153
(0.602)
** significant at 0.01; * significant at 0.05.
Table 4. Values of place and node for the stations.
StationValue of Place (xip)Value of Node (yin)
Station 1 (Seoul)0.800.87
Station 2 (Yeongdeungpo)0.920.64
Station 3 (Suwon)0.780.53
Station 4 (Gwangmyeong)0.910.51
Station 5 (CheonanAsan)0.570.35
Station 6 (Osong)0.510.34
Station 7 (Daejeon)0.560.45
Station 8 (Gimcheon)0.420.31
Station 9 (Dongdaegu)0.650.57
Station 10 (Singyeongju)0.530.53
Station 11 (Ulsan)0.450.31
Station 12 (Miryang)0.410.33
Station 13 (Gupo)0.650.54
Station 14 (Busan)0.450.45
Table 5. Degree and betweenness centrality comparison matrix.
Low DegreeHigh Degree
Low
betweenness
centrality
Station 8 (Gimcheon)
Station 10 (Singyeongju)
Station 11 (Ulsan)
Station 12 (Miryang)
 
✓ Least exposed to vulnerability
Station 4 (Gwangmyeong)
Station 5 (CheonanAsan)
Station 7 (Daejeon)
 
✓ Connections are redundant, passengers may bypass
High
 
betweenness
centrality
No stations
 
 
✓ Critical stations that enable network flow. Highly exposed to vulnerability
Station 1 (Seoul)
Station 9 (Dongdaegu)
Station 14 (Busan)
 
✓ Most important stations to vulnerability
Table 6. Example of improvement order based on local and network performance assessment.
StationLocal Performance AssessmentRankNetwork Vulnerability ExposureRecommended Improvement Order for Sustainable Railway Station Network Management
Station 8 (Gimcheon)Dependency1Low3
Station 11 (Ulsan)Dependency1Low3
Station 12 (Miryang)Dependency1Low3
Station 1 (Seoul)Stressed1High1
Station 4 (Gwangmyeong)Stressed1Mixed2
Station 2 (Yeongdeungpo)Unbalanced2Mixed2
Station 3 (Suwon)Unbalanced2Mixed5
Station 6 (Osong)Unbalanced2Mixed2
Station 7 (Daejeon)Unbalanced2Mixed2
Station 9 (Dongdaegu)Unbalanced2High4
Station 13 (Gupo)Unbalanced2Mixed5
Station 14 (Busan)Unbalanced2High1
Station 5 (CheonanAsan)Balanced-Mixed2
Station 10 (Singyeongju)Balanced-Low3
Publisher’s Note: MDPI stays neutral with regard to jurisdictional claims in published maps and institutional affiliations.