1. Introduction
At a time when the world continues to use natural resources unsustainably, food recovery and redistribution activities offer the opportunity to build a more sustainable future. Food redistribution initiatives are aimed at addressing both food insecurity and food waste.
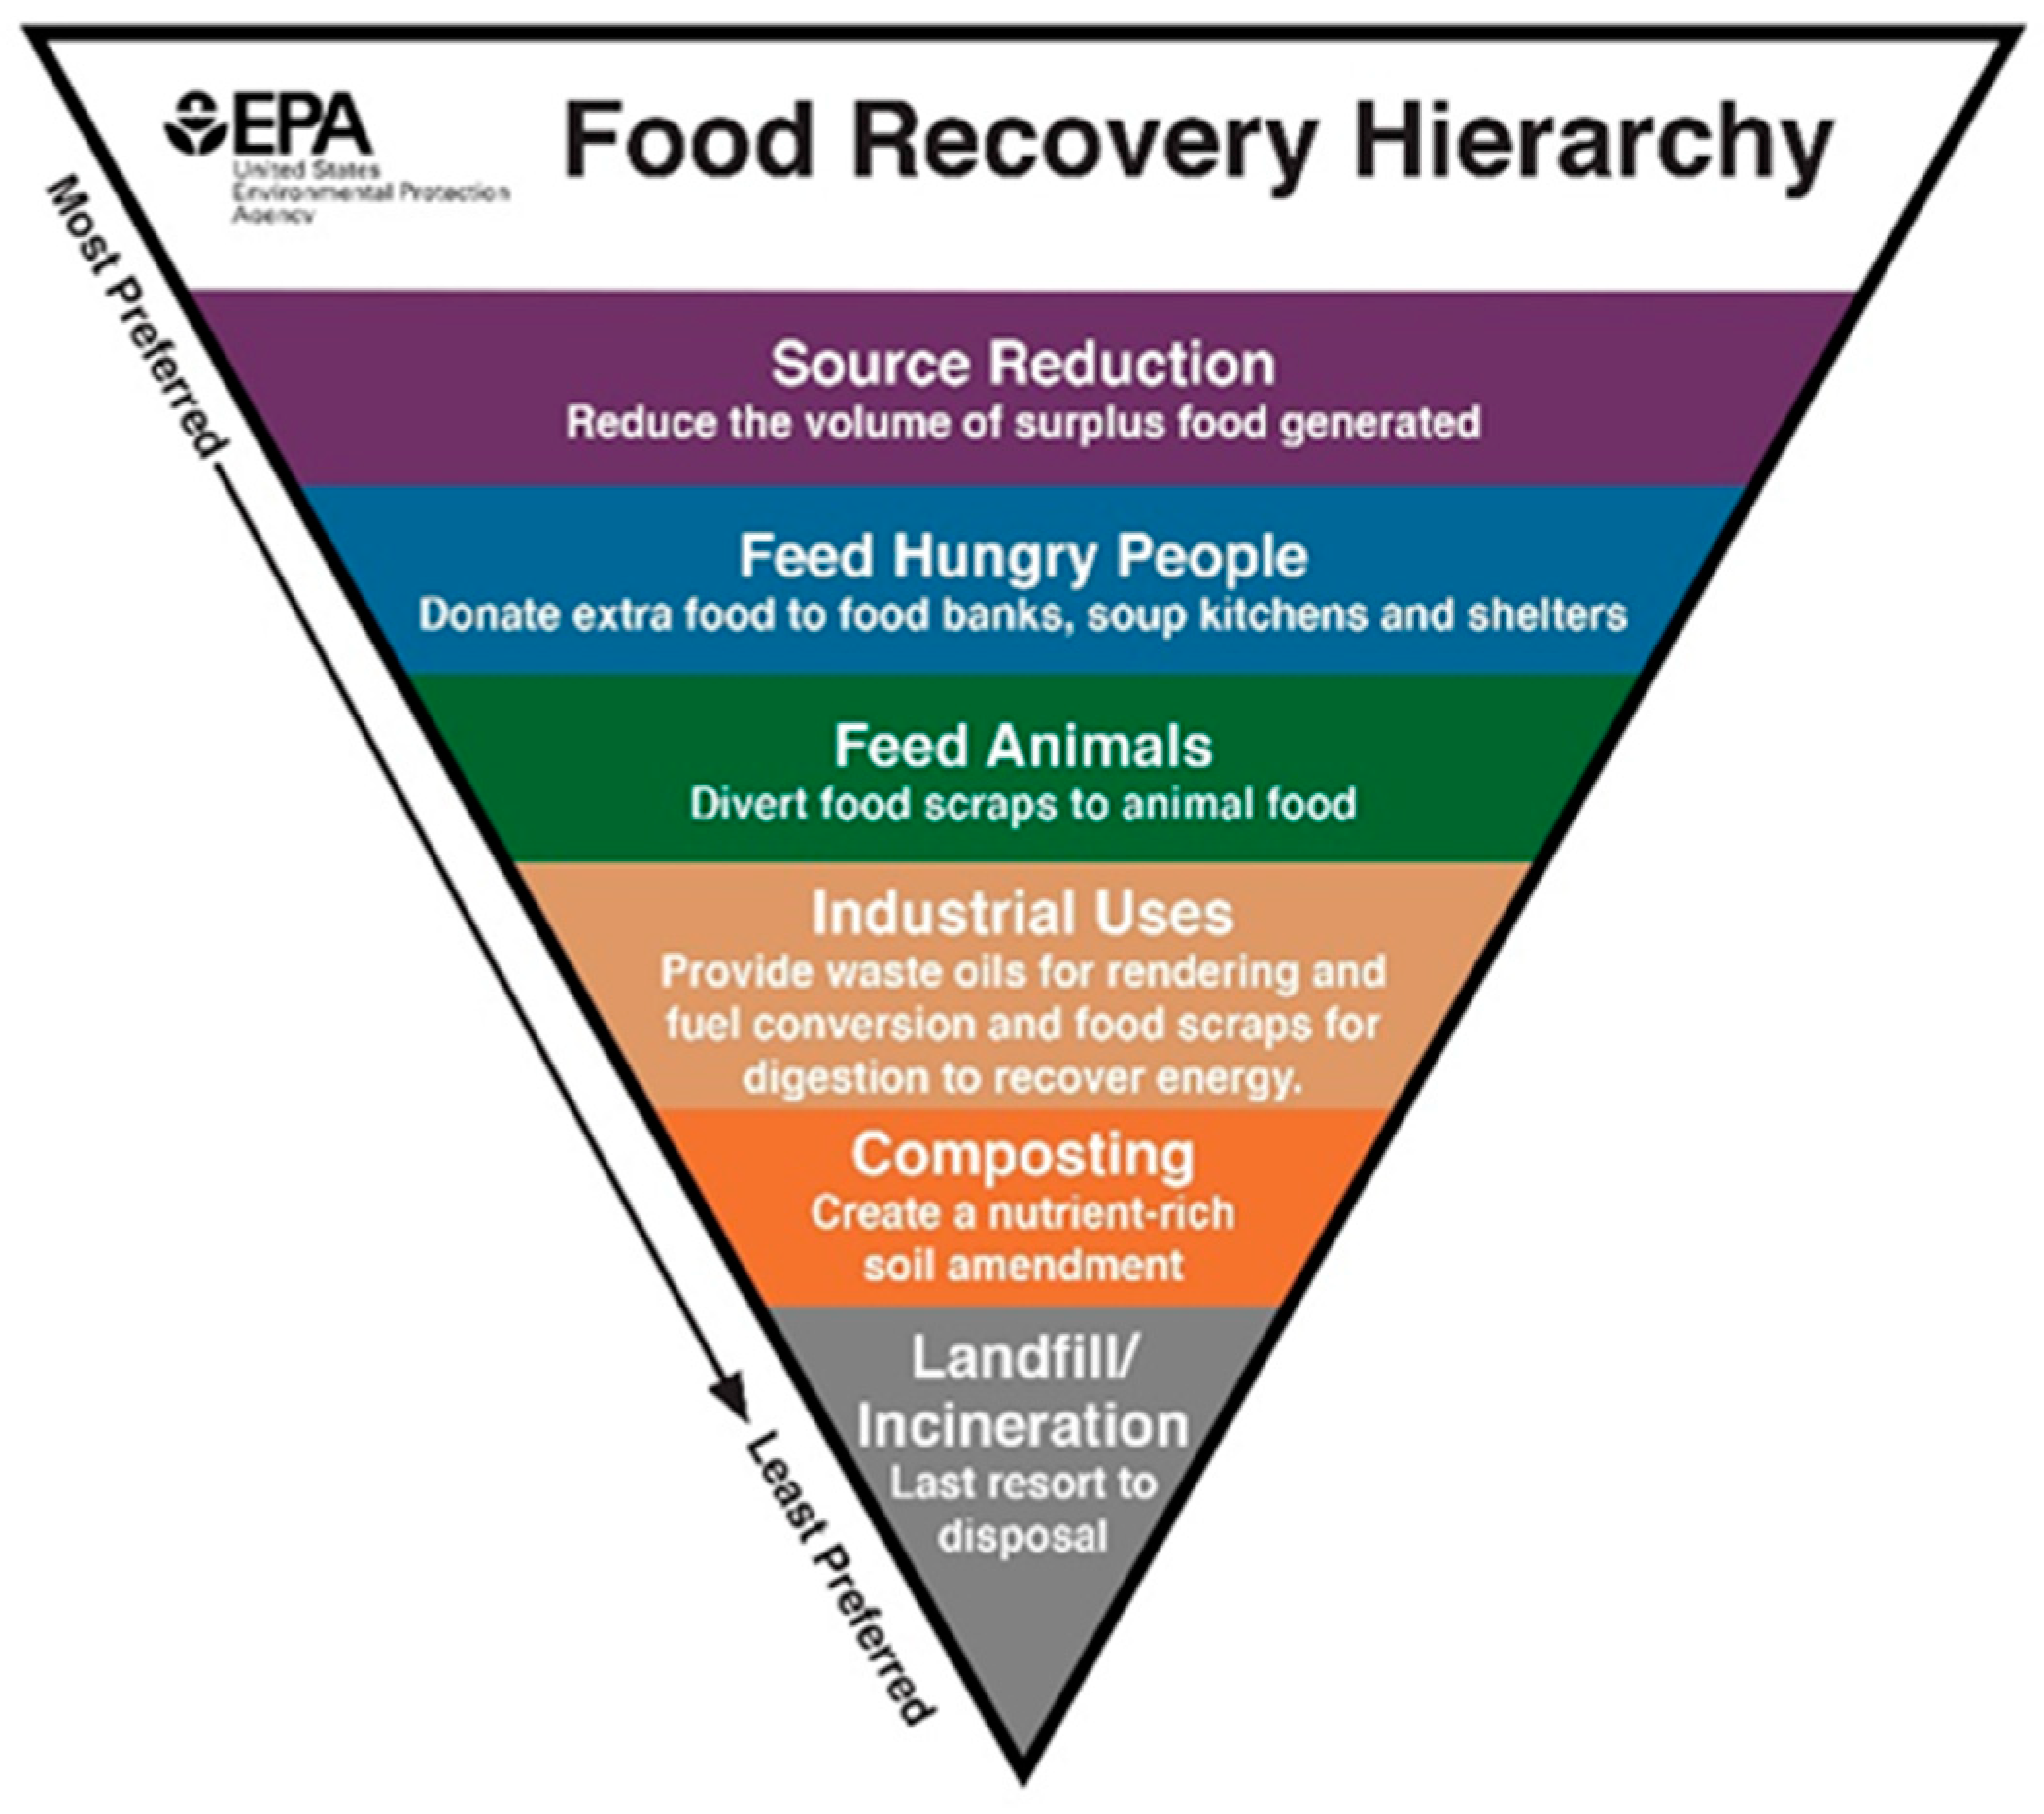
The United States Environmental Protection Agency (EPA) released, on its official website, a food recovery hierarchy (
Figure 1), prioritizing actions to prevent and divert food waste. This scheme is designed in an inverted triangular shape divided in levels, where the top option corresponds to food waste prevention and the second-best option, called “Feed Hungry People”, amounts to donating food surpluses to food banks, kitchens, and shelters. Food waste is a reservoir of carbohydrates, proteins, lipids and other organic and inorganic macro and micronutrients, which can be regarded as a material source in the food industry, animal feed industry or pharmaceutical industry [
1] as flavorings and fragrancies, antioxidants, food additives and nutraceuticals. However, industrial extraction processes require the know-how and are more time, material, energy, and human resources consuming [
2]. Hence, being a less environmentally favorable way of up-cycling food, whether for low-income populations or not [
3,
4,
5], it is referred to in the fourth level of food hierarchy as “Industrial Uses”.
Figure 1.
Food recovery hierarchy [
6].
Figure 1.
Food recovery hierarchy [
6].
Food rescue integrates several of the 17 Sustainable Development Goals (SDG) of the current 2030 Agenda [
7,
8], developed by the UN member countries to mobilize stakeholders’ networks, coming together for a common purpose. Rescuing and redistributing food helps to feed low income populations (SDG 2), and reduces greenhouse gas (GHG) emissions (SDG 13), land use, energy, and water consumption all along the food production chain [
9]. The food upcycling process prevents the need to produce more food to feed the population it is distributed to, while avoiding the environmental and economic costs of managing the recovered food as waste. SDG 12, sustainable consumption, and production is about the use of resources without jeopardizing the needs of futures generations and thus food recovery and redistribution perfectly fits this goal.
Along environmental and economic savings, social benefits can be produced when food redistributions initiatives are put in place, leading to more sustainable cities and communities [
10]. In fact, most food redistribution activities are community-driven innovative solutions created non-governmental organizations to alleviate malnourishment, using food surplus as an upcycled resource (SDG 9). When basic needs like housing and decent balanced nourishment are covered, one can argue that conditions at set to the sustained and inclusive economic growth of the impoverished populations, which would include food redistribution activities as changes in local practices that contribute to the concretion of SDG 8.
Several studies have been conducted to examine the nutritional adequacy of meals, from food bags, soup kitchens, and pantries, provided to low-income populations in the USA [
11,
12,
13], Canada [
14,
15], Australia [
16], Germany [
17], UK [
18,
19,
20], the Netherlands [
21], Italy [
9,
22], and in a cross-national study in Australia, UK, and USA, finding the common conclusion that food donations, albeit nutritionally insufficient, can improve the nutritional status of recipients [
23].
However, none of the mentioned research was focused on the contribution exclusively of recovered, and mainly fresh or freshly cooked, food to a balanced diet of low-income population. Even so, similar research will be used for result comparing purposes, regardless of whether the studies were about soup kitchens [
14,
18,
19,
22], food pantries [
12,
23] or food hampers [
11,
15,
20].
The main aim of this study is to evaluate the contribution of fresh and freshly cooked rescued and redistributed food to supplement low-income household diet, according to the Portuguese guidelines, using the Refood-Leiria organization as a case study. Firstly, we will only consider the data categorized as redistributed foods belonging to the Portuguese Food Wheel. Secondly, we will consider the total data, whether belonging or not to the Portuguese Food Wheel, which will also allow for the third evaluation compared to the dietary pattern of the general Portuguese population.
2. SDG Global Situation, Global and Local Initiatives
Every year the UN collects and summarizes information released by all country members. The 2020 Sustainable Development Goals Report brought together data showing that, before the COVID-19 pandemic, progress remained uneven, and that the world was not on track to meet the Goals by 2030.
Table 1 summarizes the 2020 situation with respect to the SDG 2, 8, 9, 12 and 13, directly involved in this paper, highlighting pre and amid COVID-19 conditions, plus the main related concerns [
24].
Globally, in 2020, there were SDG gains recorded, such as the share of children and youth out of school that had fallen, the decline in the incidence of many communicable diseases, the improvement of access to safely manage drinking water, and the increase in women’s representation in leadership roles. At the same time, the world faced the worst economic recession since the Great Depression with a rising number of people suffering from food insecurity, and the natural environment continued to deteriorate at a dramatic rate. All in all, half way through 2020, the UN considered that the change was not happening at the required speed or scale [
24].
An online overview collection was conducted to identify food waste recovery and redistribution organizations around the world, and their most common types of self-reported aims, activity, management, and redistribution. In some cases, redistribution initiatives were identified as searching for official online sites (e.g., Global Food Banking Network), and in other cases, when there were no organization sites due to the nature of the initiatives, some grey literature was used (e.g., Solidarity Fridge).
Food waste recovery and redistribution initiatives are sustainable, usually local bottom-up [
25], practices in supply food chain that provide consumers with otherwise wasted food [
9]. We found that these local practices, which very often combine the aims of providing food for people in need while reducing the environmental impact of binning perfectly edible food [
26,
27], can be found worldwide in a large range of sizes, types of management and redistribution (
Table S1 available with identification of all organizations found online).
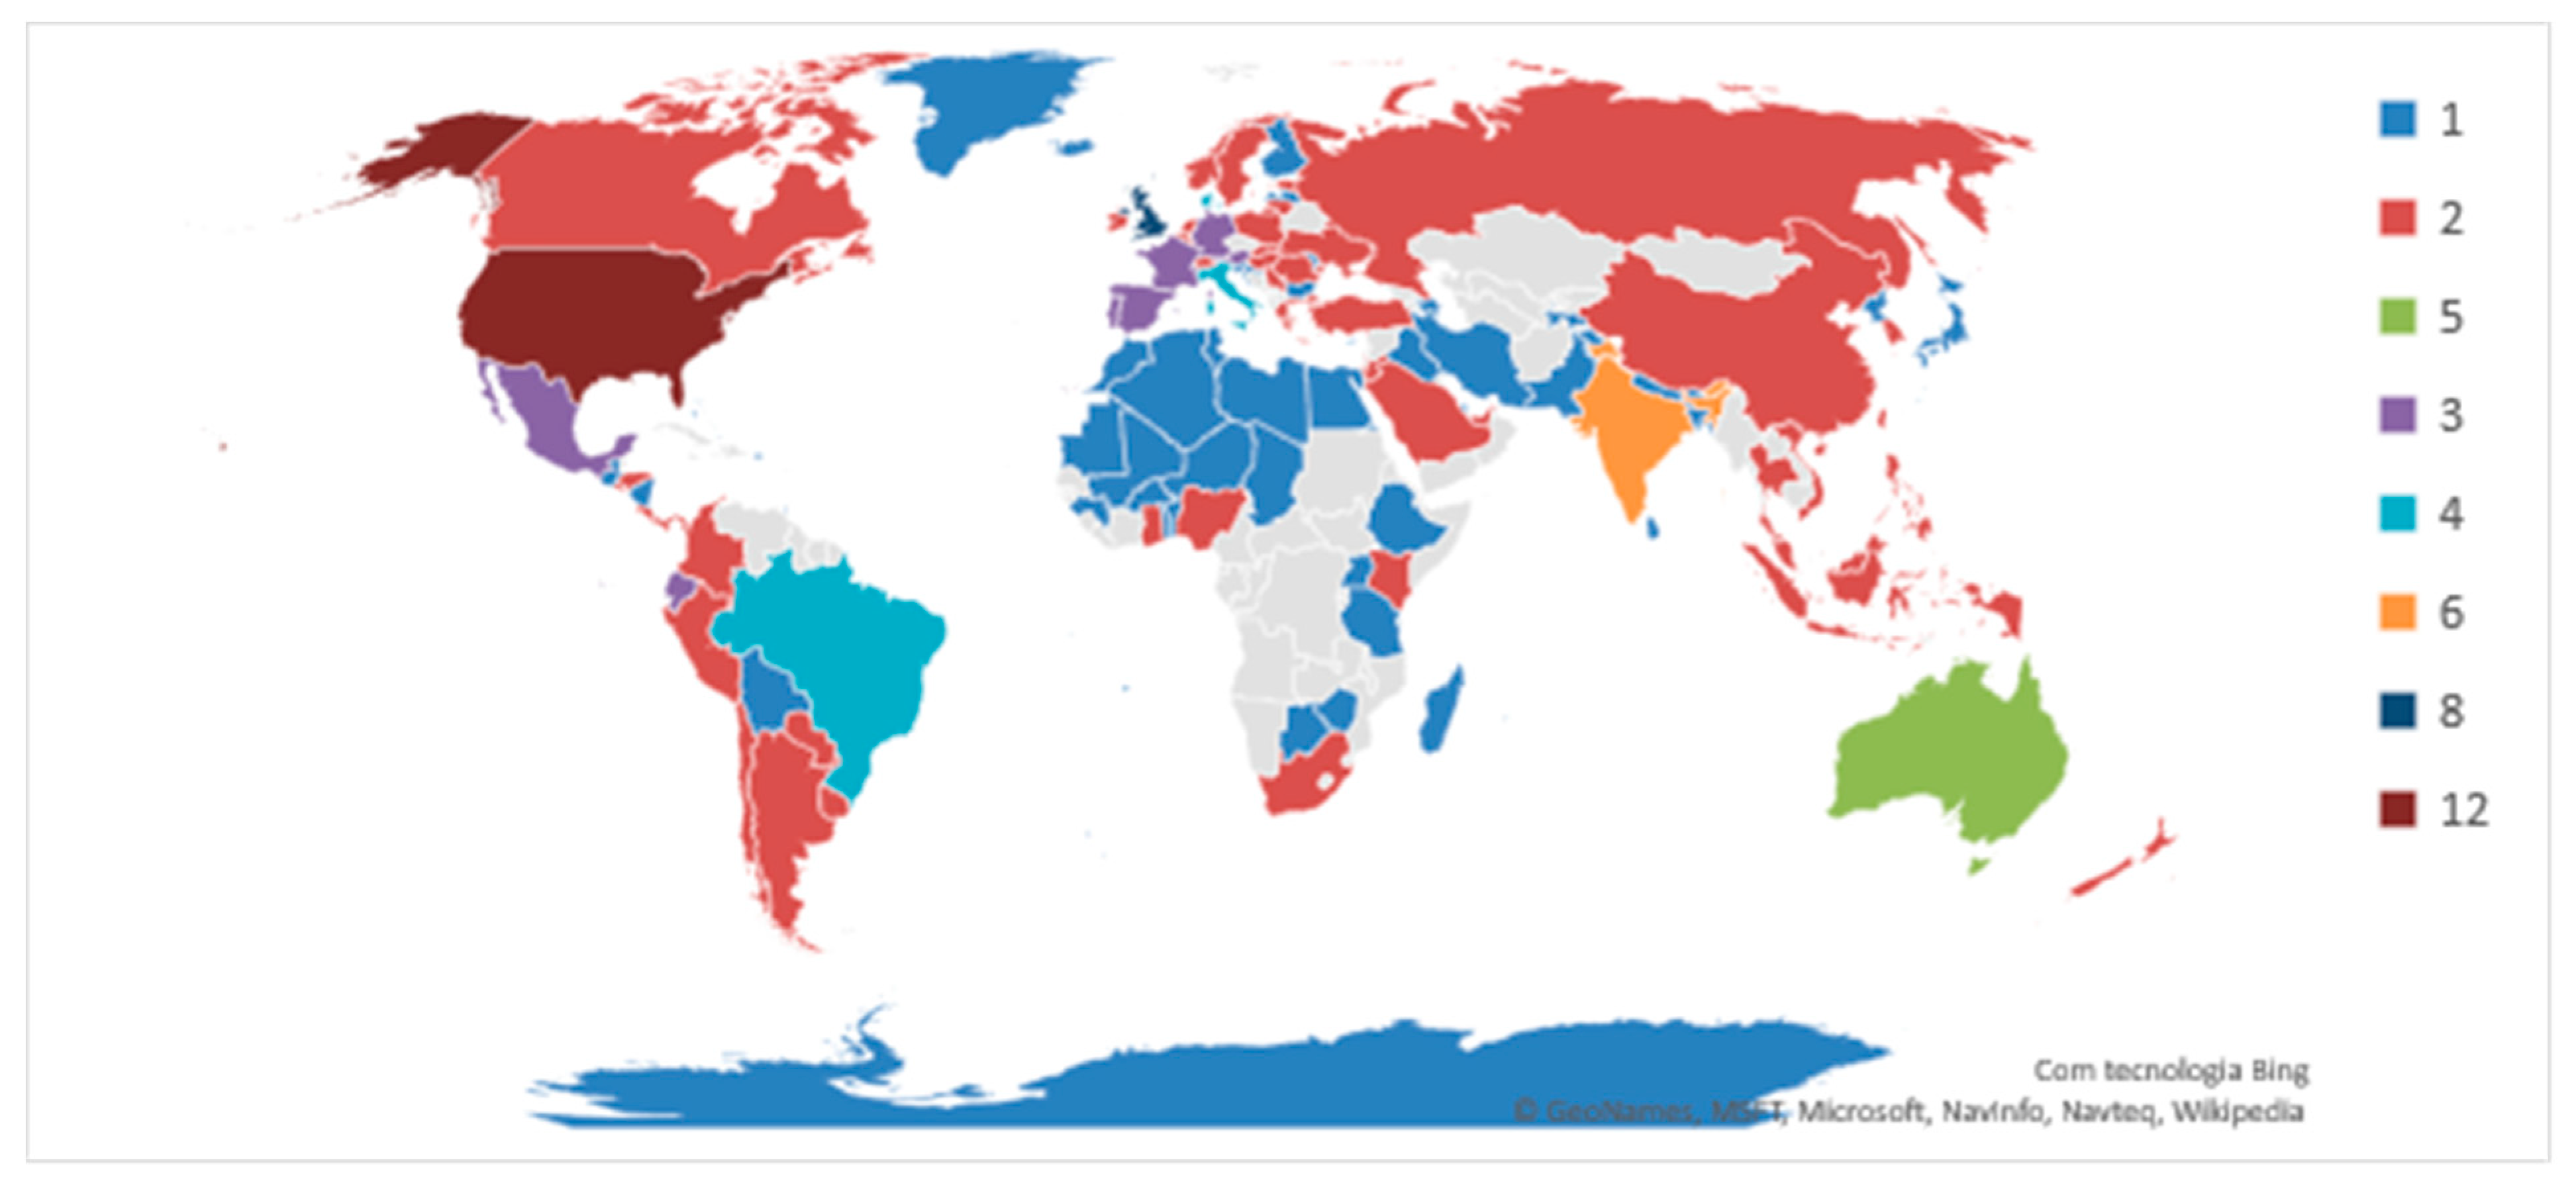
In terms of geographical coverage, we have identified food waste recovery and redistribution initiatives in 126 regions/countries in all five continents, unevenly distributed. In fact, these organizations can be found in larger numbers in America, Europe, and Australia than in Asia and Africa (
Figure 2).
Even though the Global Food Banking Network (GFN) does not rely exclusively on food surpluses it still is, by far, the largest worldwide network of redistribution of donated food, whether surpluses or not, with members and partners of all continents. This organization of 947 foodbanks, each one acting at a local level, alleviates hunger in more than 40 countries where there are food bank partners [
28]. The distribution takes place with the partnership of around 56,000 community-based agencies, which in turn redistribute the food to the population [
29,
30,
31,
32].
Initiatives like the Solidarity Fridge operate on their own through the actions of a group of citizens who replicate a model that works in other countries [
33], while others redistribute food surpluses using a digital App such as Feeding Forward in the USA [
34] or OLIO [
35] in over 118 countries [
36].
In terms of organizations with local or micro local activities of collecting food, along the food supply chain, and redistributing it to low-income households, the most common means of Reference [
37] distribution are: (1) transforming uncooked food in meals distributed in soup kitchens [
38,
39,
40,
41]; (2) solidarity grocery programmes (no-cost, symbolic cost or in exchange of social food vouchers) [
42,
43,
44,
45]; and (3) periodic distribution of food baskets to needy families [
46,
47,
48,
49,
50,
51,
52,
53,
54].
Collecting food surplus and redistribution to low-income families is precisely what is done in our Portuguese case study, the Refood project, a bottom-up organization, developed initially in Lisbon, currently with national coverage even though each operation centre has micro-local recovery and redistribution activity. In other terms, the Refood project can also be categorized as a grassroots initiative, considering that it is a collaborative social initiative organized at the local community level, with a high degree of participatory decision-making processes [
25].
The Refood project started its activity in Lisbon in 2011 [
51]. This organization is a 100% voluntary micro-local project that rescues food from the large or small distribution (groceries, supermarkets, fruit, and vegetable minimarkets), as well as from the HORECA channel (hotels, restaurants, and cafes), barbecue takeaway, and canteens (food sources of the project) and redistributes food surpluses to needy families and social support institutions at a micro local level.
By 2020, Refood grew to involve, at the national level, around 10,000 volunteers at the national level and serve more than 2,000,000 meals a year, at a cost of 10–15 cents each, to around 6500 beneficiaries. In Portugal, it has more than 60 operation centres across the country with plans to open other centres in Portugal, Spain, and Italy [
51]. Each operation centre benefits and replicates the organization’s know-how, operating at micro-local level. The choice of Refood-Leiria as a case study was due to previous experience and contact, resulting from the functions performed in project management since 2013 and the scientific interest in the socio-environmental implications of food rescue, which gives us access to greater knowledge of the processes and resources involved, as well as the ease of access to data and facilities.
The particularity of the Refood-Leiria project is a collection system that takes place in four shifts from 10 a.m. to 10 p.m., allowing the rescue of eve’s dinner cooked and unserved foods, during morning shifts, lunch surplus foods during the afternoon and supermarket fresh fruit, vegetables, dairy, and cold cuts at closing time, around 9.30 p.m. This collection system requires about 220 volunteers, a considerable number for a small town. It allows a constant incoming flow of about five tonnes a month of quality fresh and freshly cooked goods that is redistributed within the following 24 h. This flow of rescued food not only helps feeding around 180 to 200 direct beneficiaries, but also supplies food to five other charitable institutions, which in turn feed hundreds of people.
The rescued food redistribution takes place once a day in the form of hampers containing at least the amount of food required for each family to be provided with one full meal. Traditionally, in Portugal, one full meal involves vegetable soup, a main course with fish or meat plus a starch source like potatoes, pasta or rice, a vegetable side dish like a salad and finally one sweet or fruit dessert. Moreover, all hampers also contain breakfast and mid-afternoon snacks like bread, cakes, dairy products, and fruit.
As the Refood project food source surpluses are unpredictable, every day there is a surplus of rescued food that does not represent a balanced meal. To avoid food waste, by the end of the day, all the foods that have not been served to direct beneficiary families are forwarded to the other five charitable institutions. This is often the case of rescued fresh bread, cakes, fruits and vegetables or large amounts of cooked meals collected from inconstant social events like marriages or corporate dinners. It should be noted that, if bottles of wine, whether already open or not, are collected from social events, they are forwarded to charitable institutions to be used as seasoning.
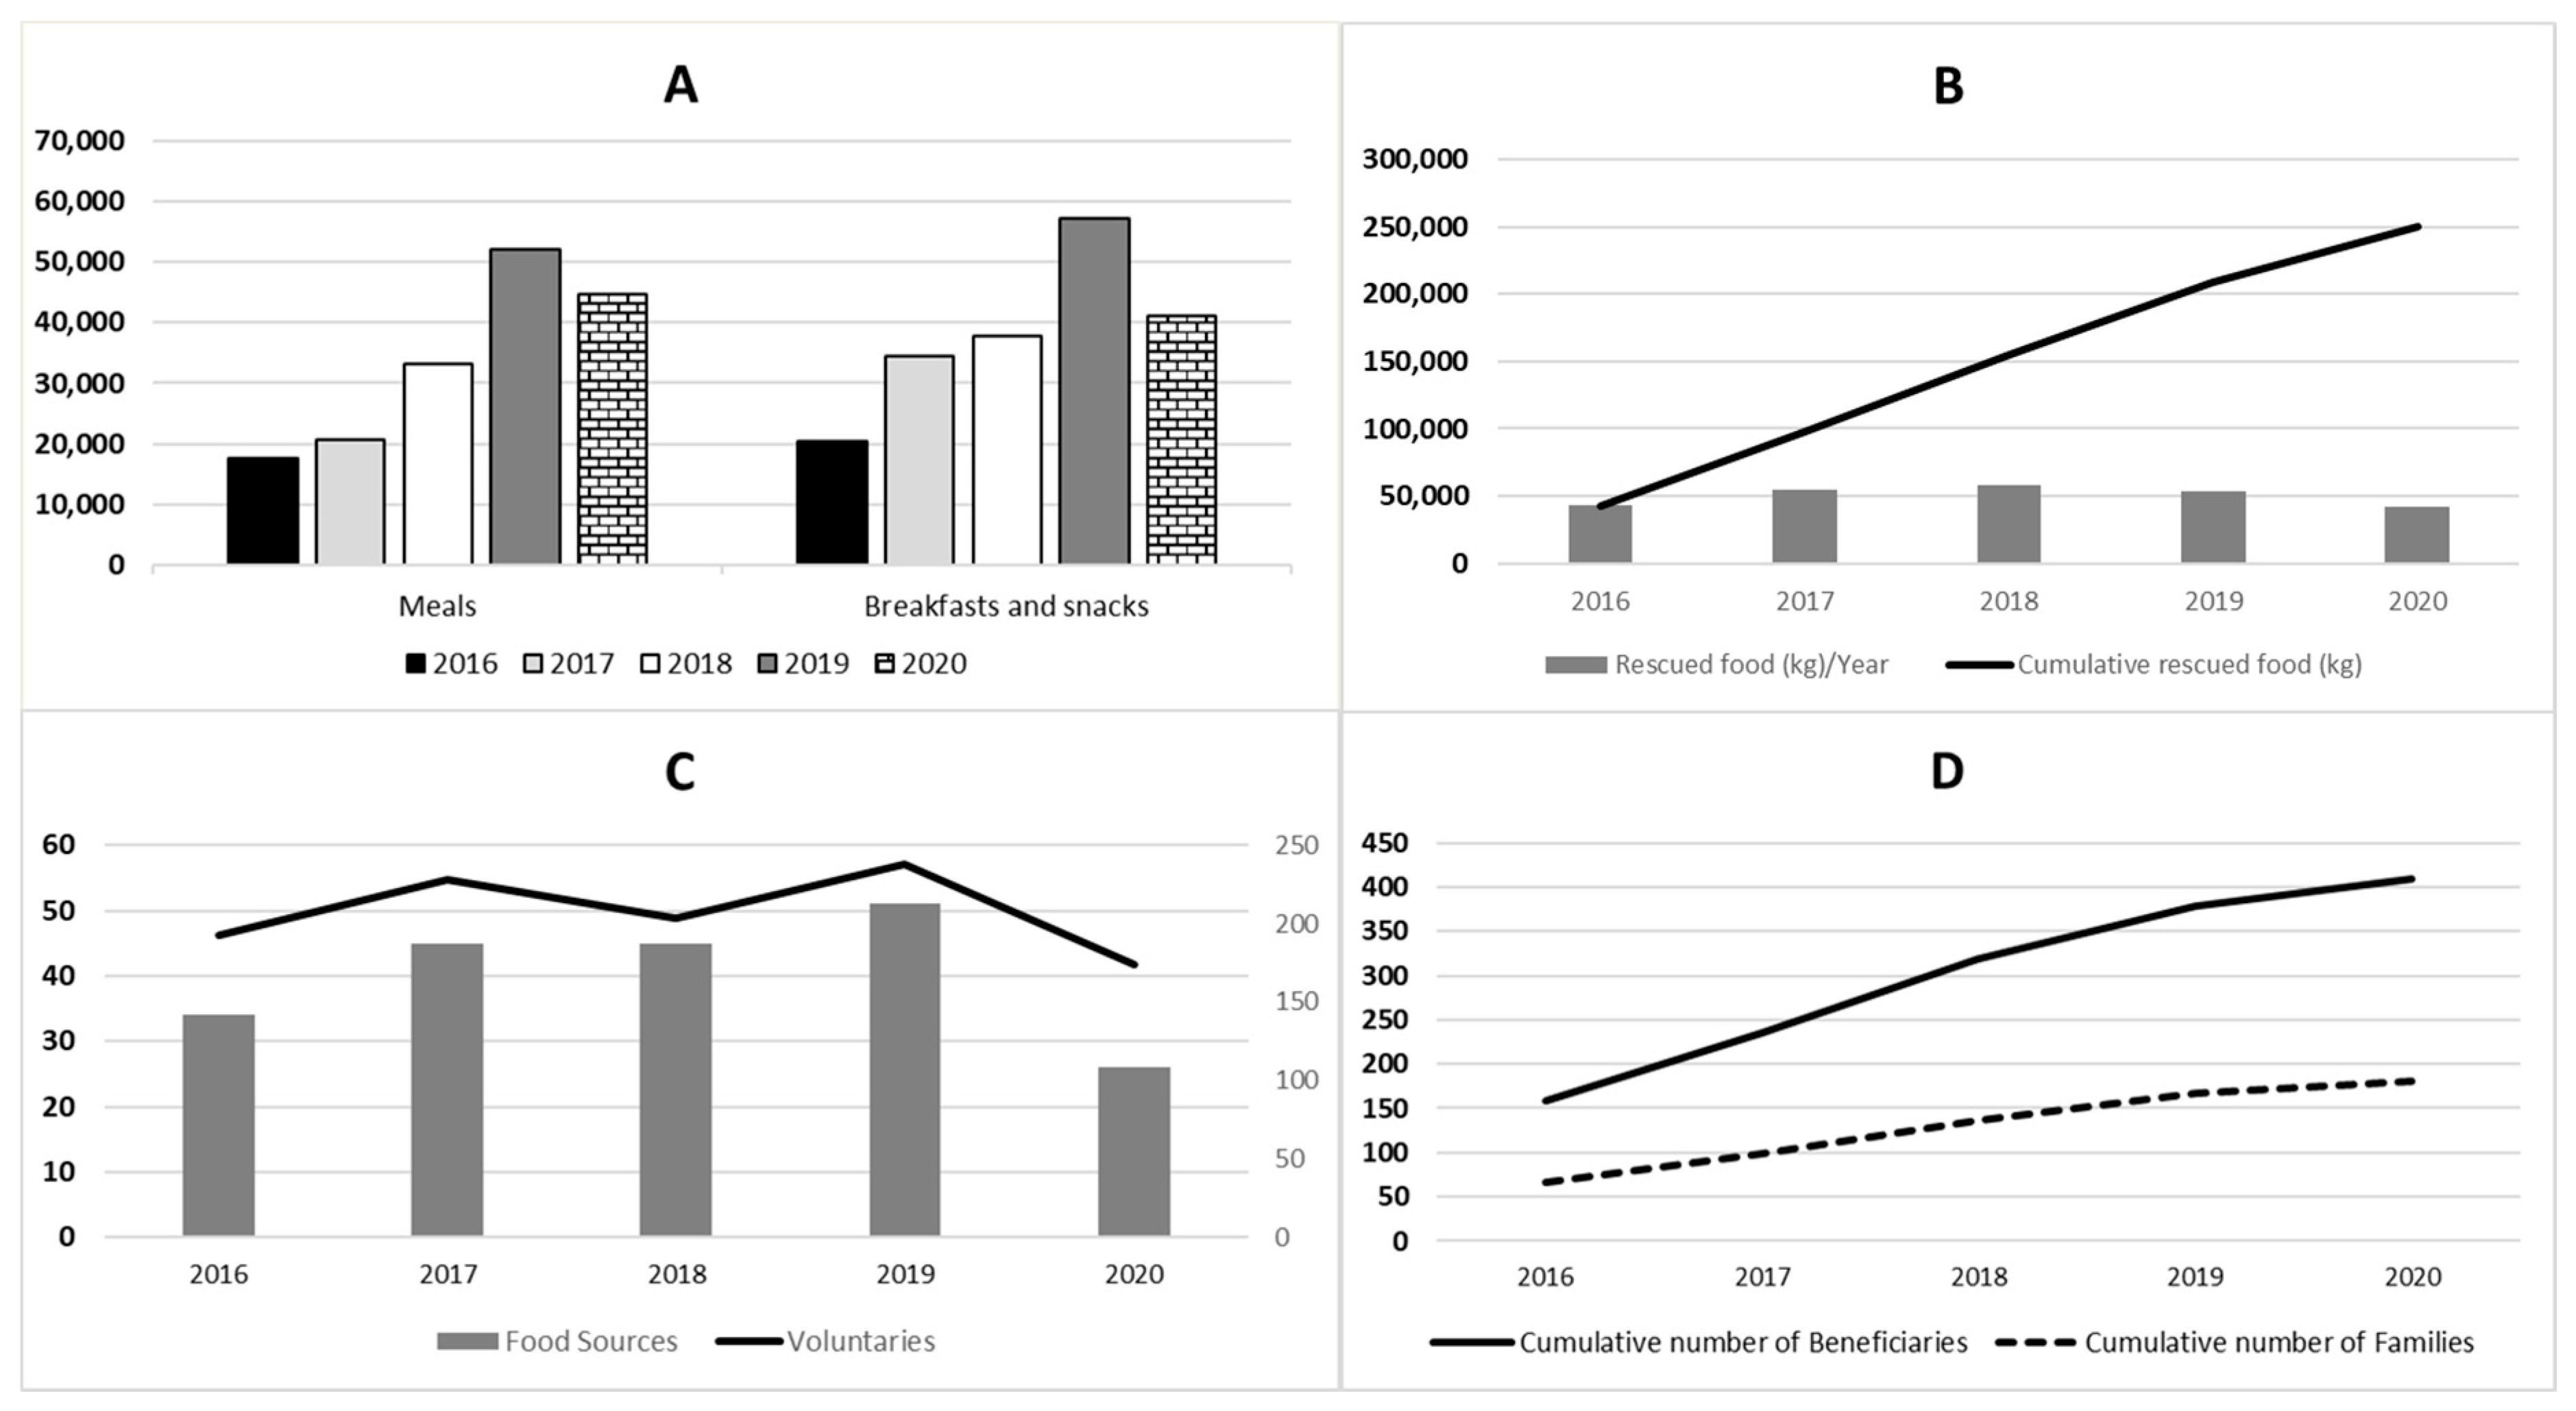
While no formal scientific research was conducted on the subject, the number of rescued food kilos, meals, breakfasts and snacks, beneficiaries, families, voluntaries, food sources, from 2016 to 2020, were kindly provided by Refood-Leiria’s management group and cross-checked with the information available on social media (
Figure 3).
EPA’s Food Recovery Hierarchy (
Figure 1) establishes that the second-best option for food waste, after prevention at the source, is to reuse the food surplus for human consumption, also called “Feed the Hungry”. The impact that a food rescue and redistribution organization have on achieving the SDGs can be assessed by considering the three pillars of sustainability.
When assessing the environmental cost-benefit ratio of food recovery, the balance is heavily skewed towards the benefits side. On the costs side, material and energetic resources consumed to rescue food, and GHG produced in the rescue process, must be taken into consideration. These costs are minimized by the fact that the Refood organization model was projected to operate at a micro local level, to minimize environmental impacts of the food rescue and redistribution process, on air quality and global warming. On the benefits side, from 2016 to 2020, more than 250 tons of fresh or freshly cooked food was diverted from landfills (
Figure 3B), avoiding environmental burdens such as land use, material and energy resources that would be needed to produce the food equivalent to that rescued, resulting, as well, in the production of more pollutants. Furthermore, pollutants, either solids, liquids, gases, or GHG are not produced as an effluent of food as waste treatment.
The economic impact of food recovery and redistribution activity concerns the organization involved in the process, general society, food sources, and beneficiaries. A food aid organization has operation centre expenses (electricity, water, internet, and cleaning product) and fuel cost to provide for. At the national level, the organization calculated that the economic cost of each meal is 10–15 cents. On the benefits side, there are avoided costs of the production, distribution, and transportation of more food that would have replaced the non-rescued food. By donating food surpluses, most of the 51 Refood-Leiria food sources (
Figure 3C) have tax benefits, and avoid waste management costs, which represents a considerable benefit when large amounts are donated. Sert et al. estimated that the net benefit for a food source, from the surplus food redistribution by retailers, was about three times the value of the recovered food [
55]. A cumulative total of 410 beneficiaries from 181 families (
Figure 3D) provided with meals, breakfasts, and snacks (
Figure 3A) save money, allowing them access to other goods or services.
In terms of social outcomes, beneficiary families, volunteers, food sources, and other supported institutions must be considered. Beneficiary families (
Figure 3D) with less or no feeding concerns may benefit in terms of health, opportunities to find or keep a job, school results, and change in nutritional pattern. Since 2015, Refood-Leiria organization has involved more than 500 voluntaries who have benefited from socialization, while supporting community members (
Figure 3C) and contributing to food up-cycling. For the 51 food sources (
Figure 3C), forwarding food surpluses to support low-income households is a sign of corporate social and environmental responsibility, often mentioned in their sustainability report [
56]. As a result, the whole community witnesses the possibility of a circular and solidary economy driving change in their own local neighbourhood.
When evaluating the relative percentage of each food group served by the Refood-Leiria project, one must bear in mind that the content of each hamper does not represent only one meal, but the content of what has been collected during the previous 24 h divided by all the families that are served each day. To avoid wastage or very unbalanced meals on the beneficiary side of the food chain, when large amounts of surpluses of a single species are rescued (very often bakery products), they are sent to other institutions that support populations in need.
Foods redistributed by Refood are entirely the result of up-cycling of food waste, which is diverted from its original end, the landfill. Thus, their quantity and nature are not completely controlled by the project, although their quality is controlled through the application of HACCP (Hazard Analysis and Critical Control Point). All rescued foods are fresh (fruit, vegetables, dairy, bread, and cakes), unserved freshly cooked in restaurants and canteens, or close to the “best by date”, and for these reasons, served within a maximum of 24 h. However, Refood-Leiria reserves the right to refuse the redemption of food, whenever by nature and/or quantity there is no logistic capacity for storage or redistribution.
In Portugal, in 2017, the percentage of the total population at risk of poverty was 18.3% [
37], but still one million ton of food is wasted per year [
57]. During the past decades, the poverty situation in the Portuguese population has been partially tackled by the public welfare system, and more recently also by non-governmental organizations such as the Food Bank and the Refood project.
The Portuguese dietary guidelines, which reflect Portuguese society, have been developed since 1980s by a group of researchers of the Faculty of Food Science and Nutrition of Porto University. These guidelines are usually conveyed in the form of an instrument called the Food Wheel (circular shape), which has been revised and updated over the years to reflect evolutions in both scientific knowledge and society [
58].
The Food Wheel has been designed by transforming nutritional scientific knowledge in a pictorial representation of basic concepts to reach as many people as possible. To ensure a captivating and easy to understand food guide, a circle shape divided into 7 slices was chosen. It also includes an image of drinking water in its centre to highlight the importance of hydration.
The whole wheel was developed, considering common usage in Portuguese food habits and the recommendations for the Portuguese Adult Population of National Council for Food and Nutrition [
59]. To guarantee that all recommendations in terms of macronutrients were met, seven food groups were created, hence the seven Food Wheel slices, and several subgroups and specific items included (
Table 2).
3. Materials and Methods
Due to the lack of human and logistic resources, it was impossible to analyse a total of 4.5 to 5 tons of food per month, which are rescued by Refood-Leiria. Therefore, we decided to restrict the analysis to foods that, after being collected, are redistributed directly to beneficiary families in the project’s operations centre and thus the portion of rescued food daily distributed to institutions was not analysed.
Each beneficiary family receives a basket of food 1, 2 or 3 times a week, depending on the socioeconomic characteristics of the household. The total number of families supported varies over time as the households can leave the project when their socioeconomic situation improves or can be excluded from the project due to non-compliance with established basic rules (e.g., not showing to collect the food basket on agreed days, without prior notice). As some households abandon the project, others join it on their own initiative or by reference to social support institutions. Consequently, the Refood-Leiria project has supported a constant number of families around 45, whose anonymity was guaranteed throughout this investigation.
To measure the contribution of upcycled food to a balanced diet, data was collected during three periods of five consecutive working days with intervals of two months, avoiding data collection during the holiday season, a naturally superabundant period compared to the rest of the year. The established dates were 14–20 November 2018, 14–18 January 2019, and 11–15 March 2019. To carry out this quantification, the food supplied to each beneficiary family was weighed daily using a calibrated Tissot
® scale, with a maximum range of 15 kg ± 0.005. The weighing was always carried out by the same person, differentiating, and identifying the nature of the food: soups, bread, main course, vegetables, fruit, dessert, and others (see
Figure S1—Methodology flow-chart).
The original sample was constituted of around 3,500 items weighing 1.722 Ton, from 40 families. As some of the families had left the organization during the data collection process, only the 27 families (59 individuals: 47 adults and 12 children) covered by all three weighing rounds were selected by reducing the sample to 2597 items weighing 1.277 Ton. All hampers contain a bread vegetable soup, main dish, vegetable side dish, fruit, and suitable breakfast snacks.
Tares were deducted, and edible percentages of foods calculated whenever relevant (e.g., fruit, vegetables, certain meats, and fish) [
60].
The selected data was then organized to fit into the seven food groups (
Table 2) of the Portuguese Food Wheel (
Figure 3), plus three extra categories, usually representing consumed foods that are not recommended by the guidelines: (1) jams, cakes, and savoury; (2) deli meats; and (3) fruit nectars (non-alcoholic drink).
Whenever composed dishes were served (e.g., soups or casseroles), all recipes were broken down into constituent foods from each sector of the Food Wheel.
The evaluation of the totality of the redistributed foods was made in two different ways: firstly, considering only the foods that are part of the Portuguese Food Wheel as an official food guide for the Portuguese population [
58], and secondly considering the totality of the foods provided by the Refood-Leiria project to the beneficiary families to be able to compare our results with the ones of the National Food and Physical Activity Survey (NFPAS), published in 2017 [
61]. The constitution of each food hamper depends on the number of family members but does not vary in the global nature of foods, which are soup, bread, main dish, side dish and fruit, plus other extra foods intended for breakfasts and snacks. After previous evaluation of family hamper distribution, through the calculation of the weight percentages of distributed food per family and per sector, no visible differences were found between hampers. Thus, the option of a global evaluation, of the totality of the served food in all three rounds of weighing, was chosen.
4. Results
A first evaluation was made only with respect to the items belonging to the food groups included in the Portuguese Food Wheel, served to all 27 families, during the three weighing rounds. Global mean values of weight percentage per sector were calculated to be compared with the weight percentage per sector recommended by the guidelines (
Figure 4).
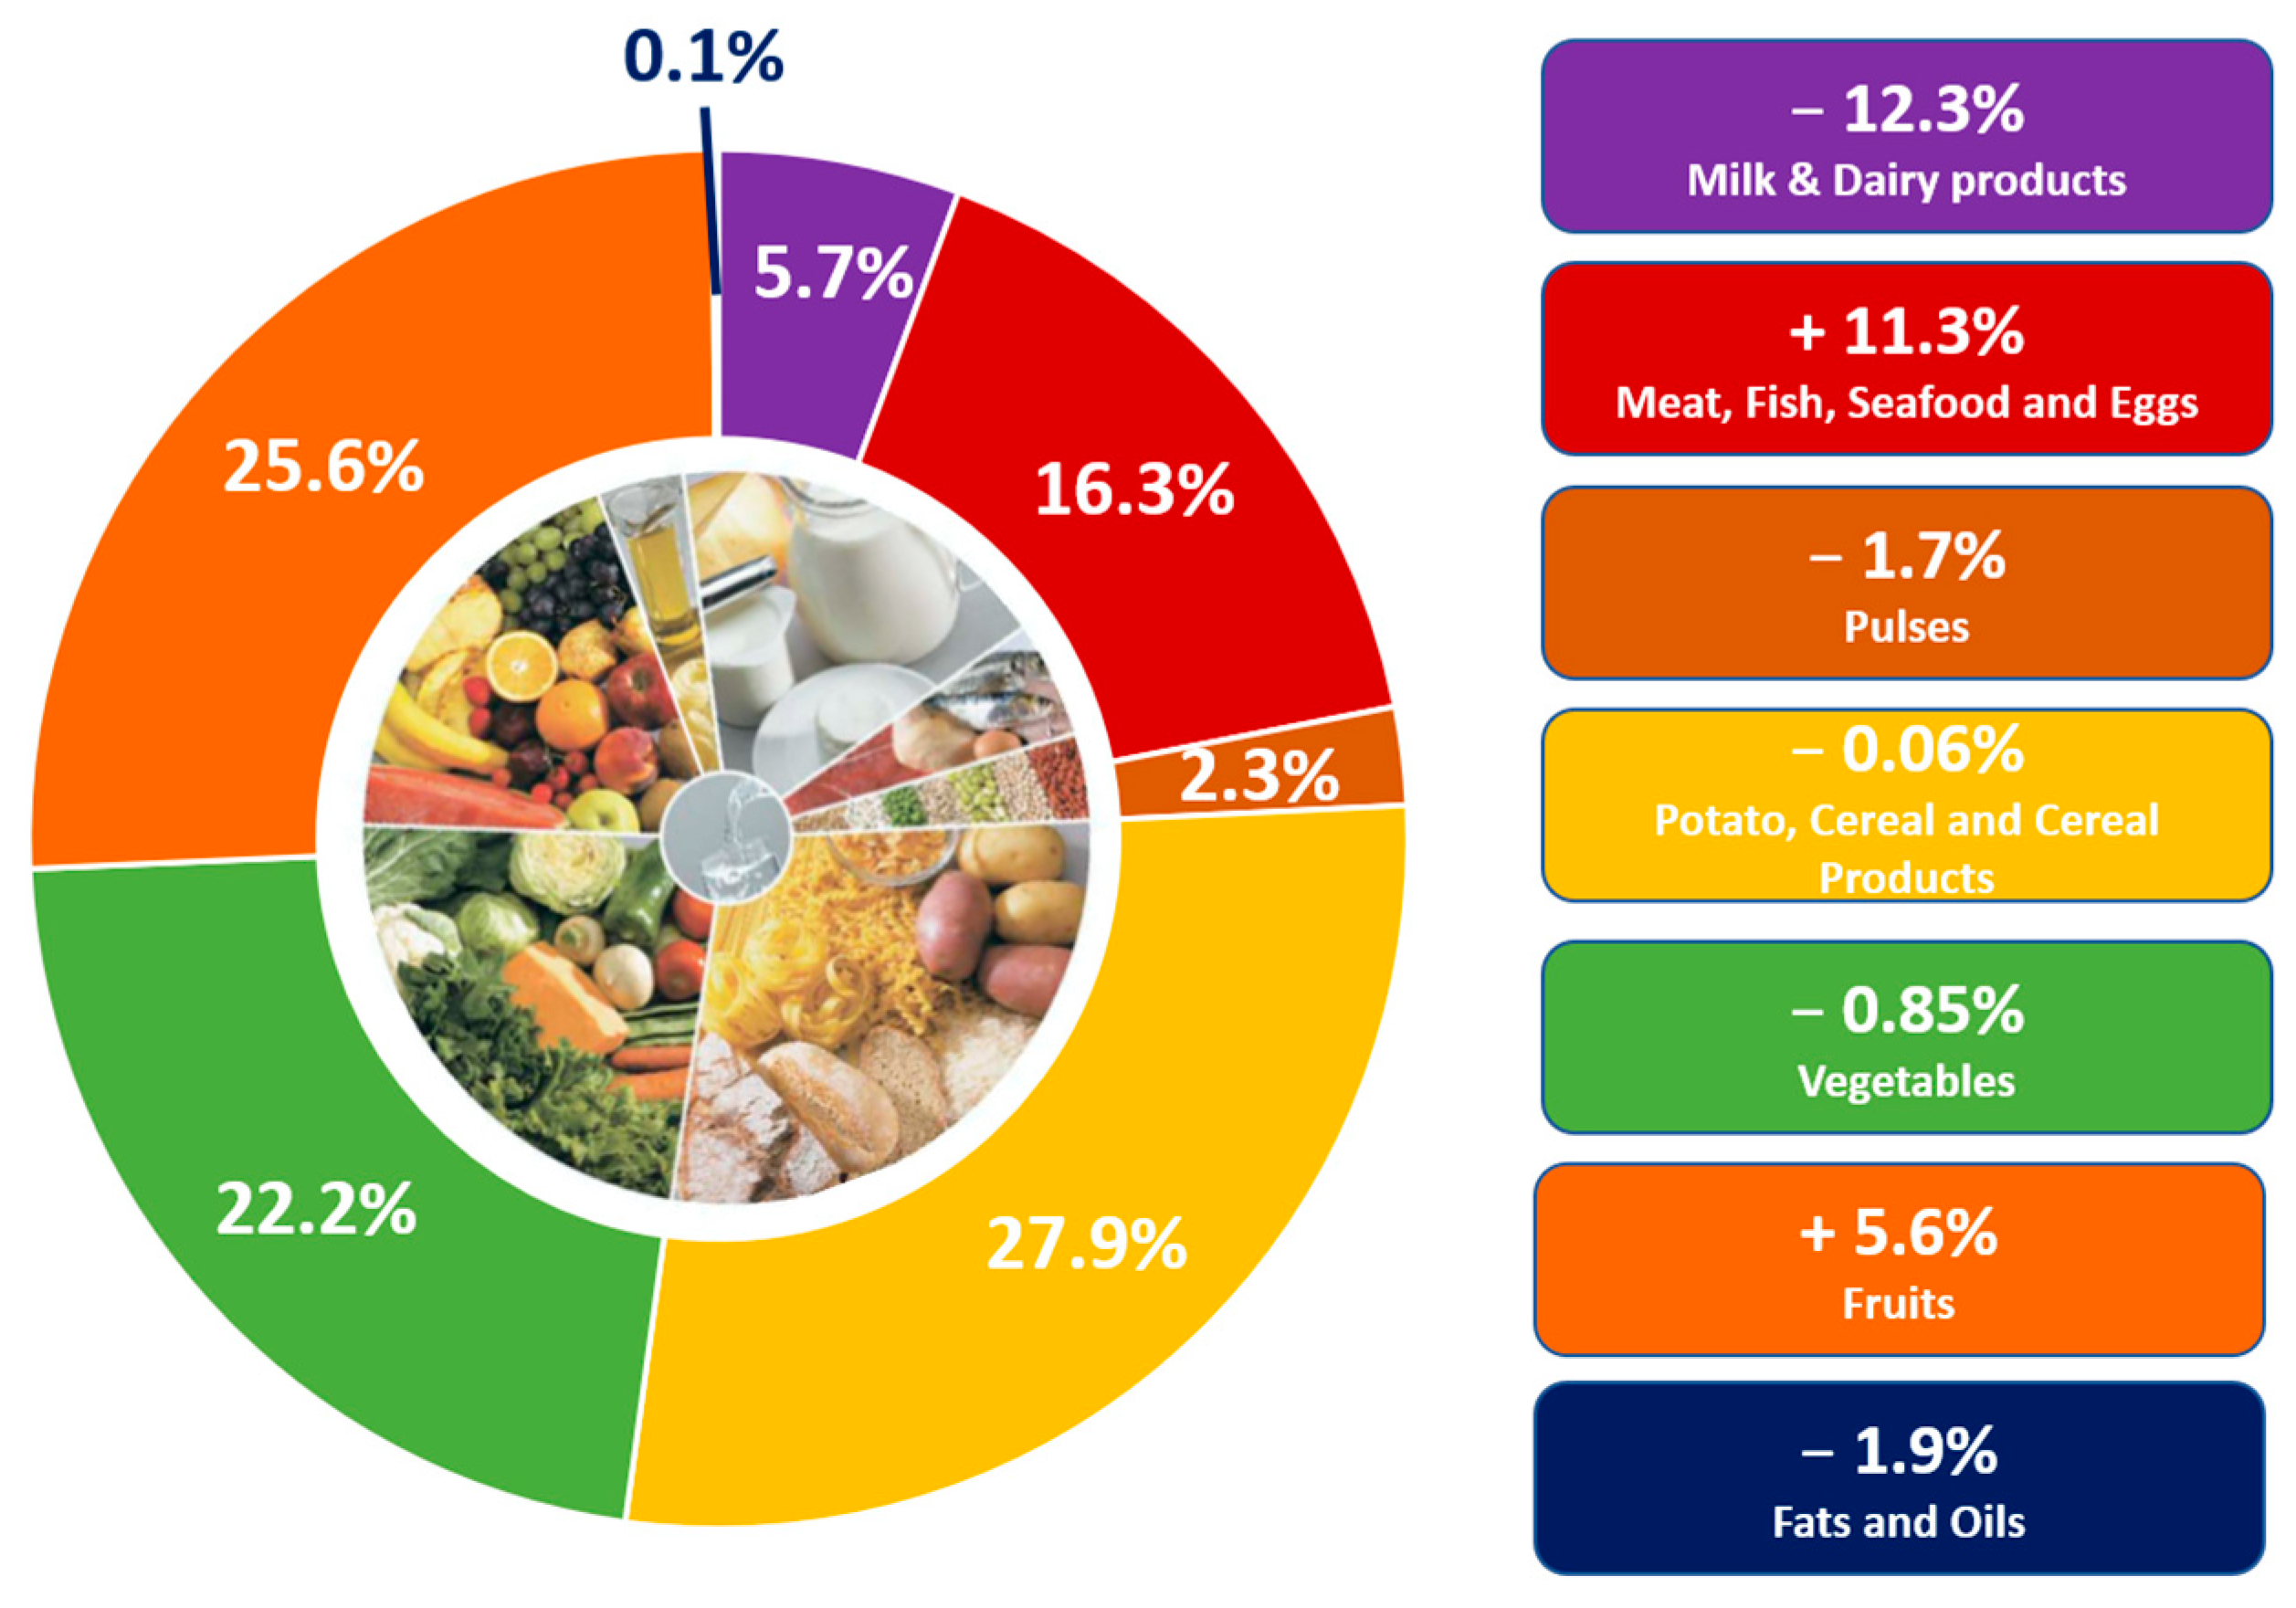
When analyzing
Figure 5, the sectors of “Potato, Cereal and Cereal Products” and of “Vegetables” are the ones in which values are the closest to those recommended by the Portuguese food guide [
58], with a difference of, respectively, −0.06% and −0.85%. In all other food groups, the percentages were inadequate when compared to the recommended.
Two food groups are redistributed in higher amounts than recommended. The mean percentage of contribution of “Meat, Fish, Seafood and Eggs” donations exceed the dietary reference value for this sector in 11.3% and the contribution of the “Fruit” sector is 5.6% larger.
However, comparing with the guideline recommended values, redistributed hampers contain −12.3% of “Milk and Dairy Products”, −1.9% of “Fats and Oils” and −1.7% of “Pulses”.
Secondly, we considered the total amount of food and beverages redistributed whether belonging to the Portuguese Food Wheel or not. In this case, the weight percentage (
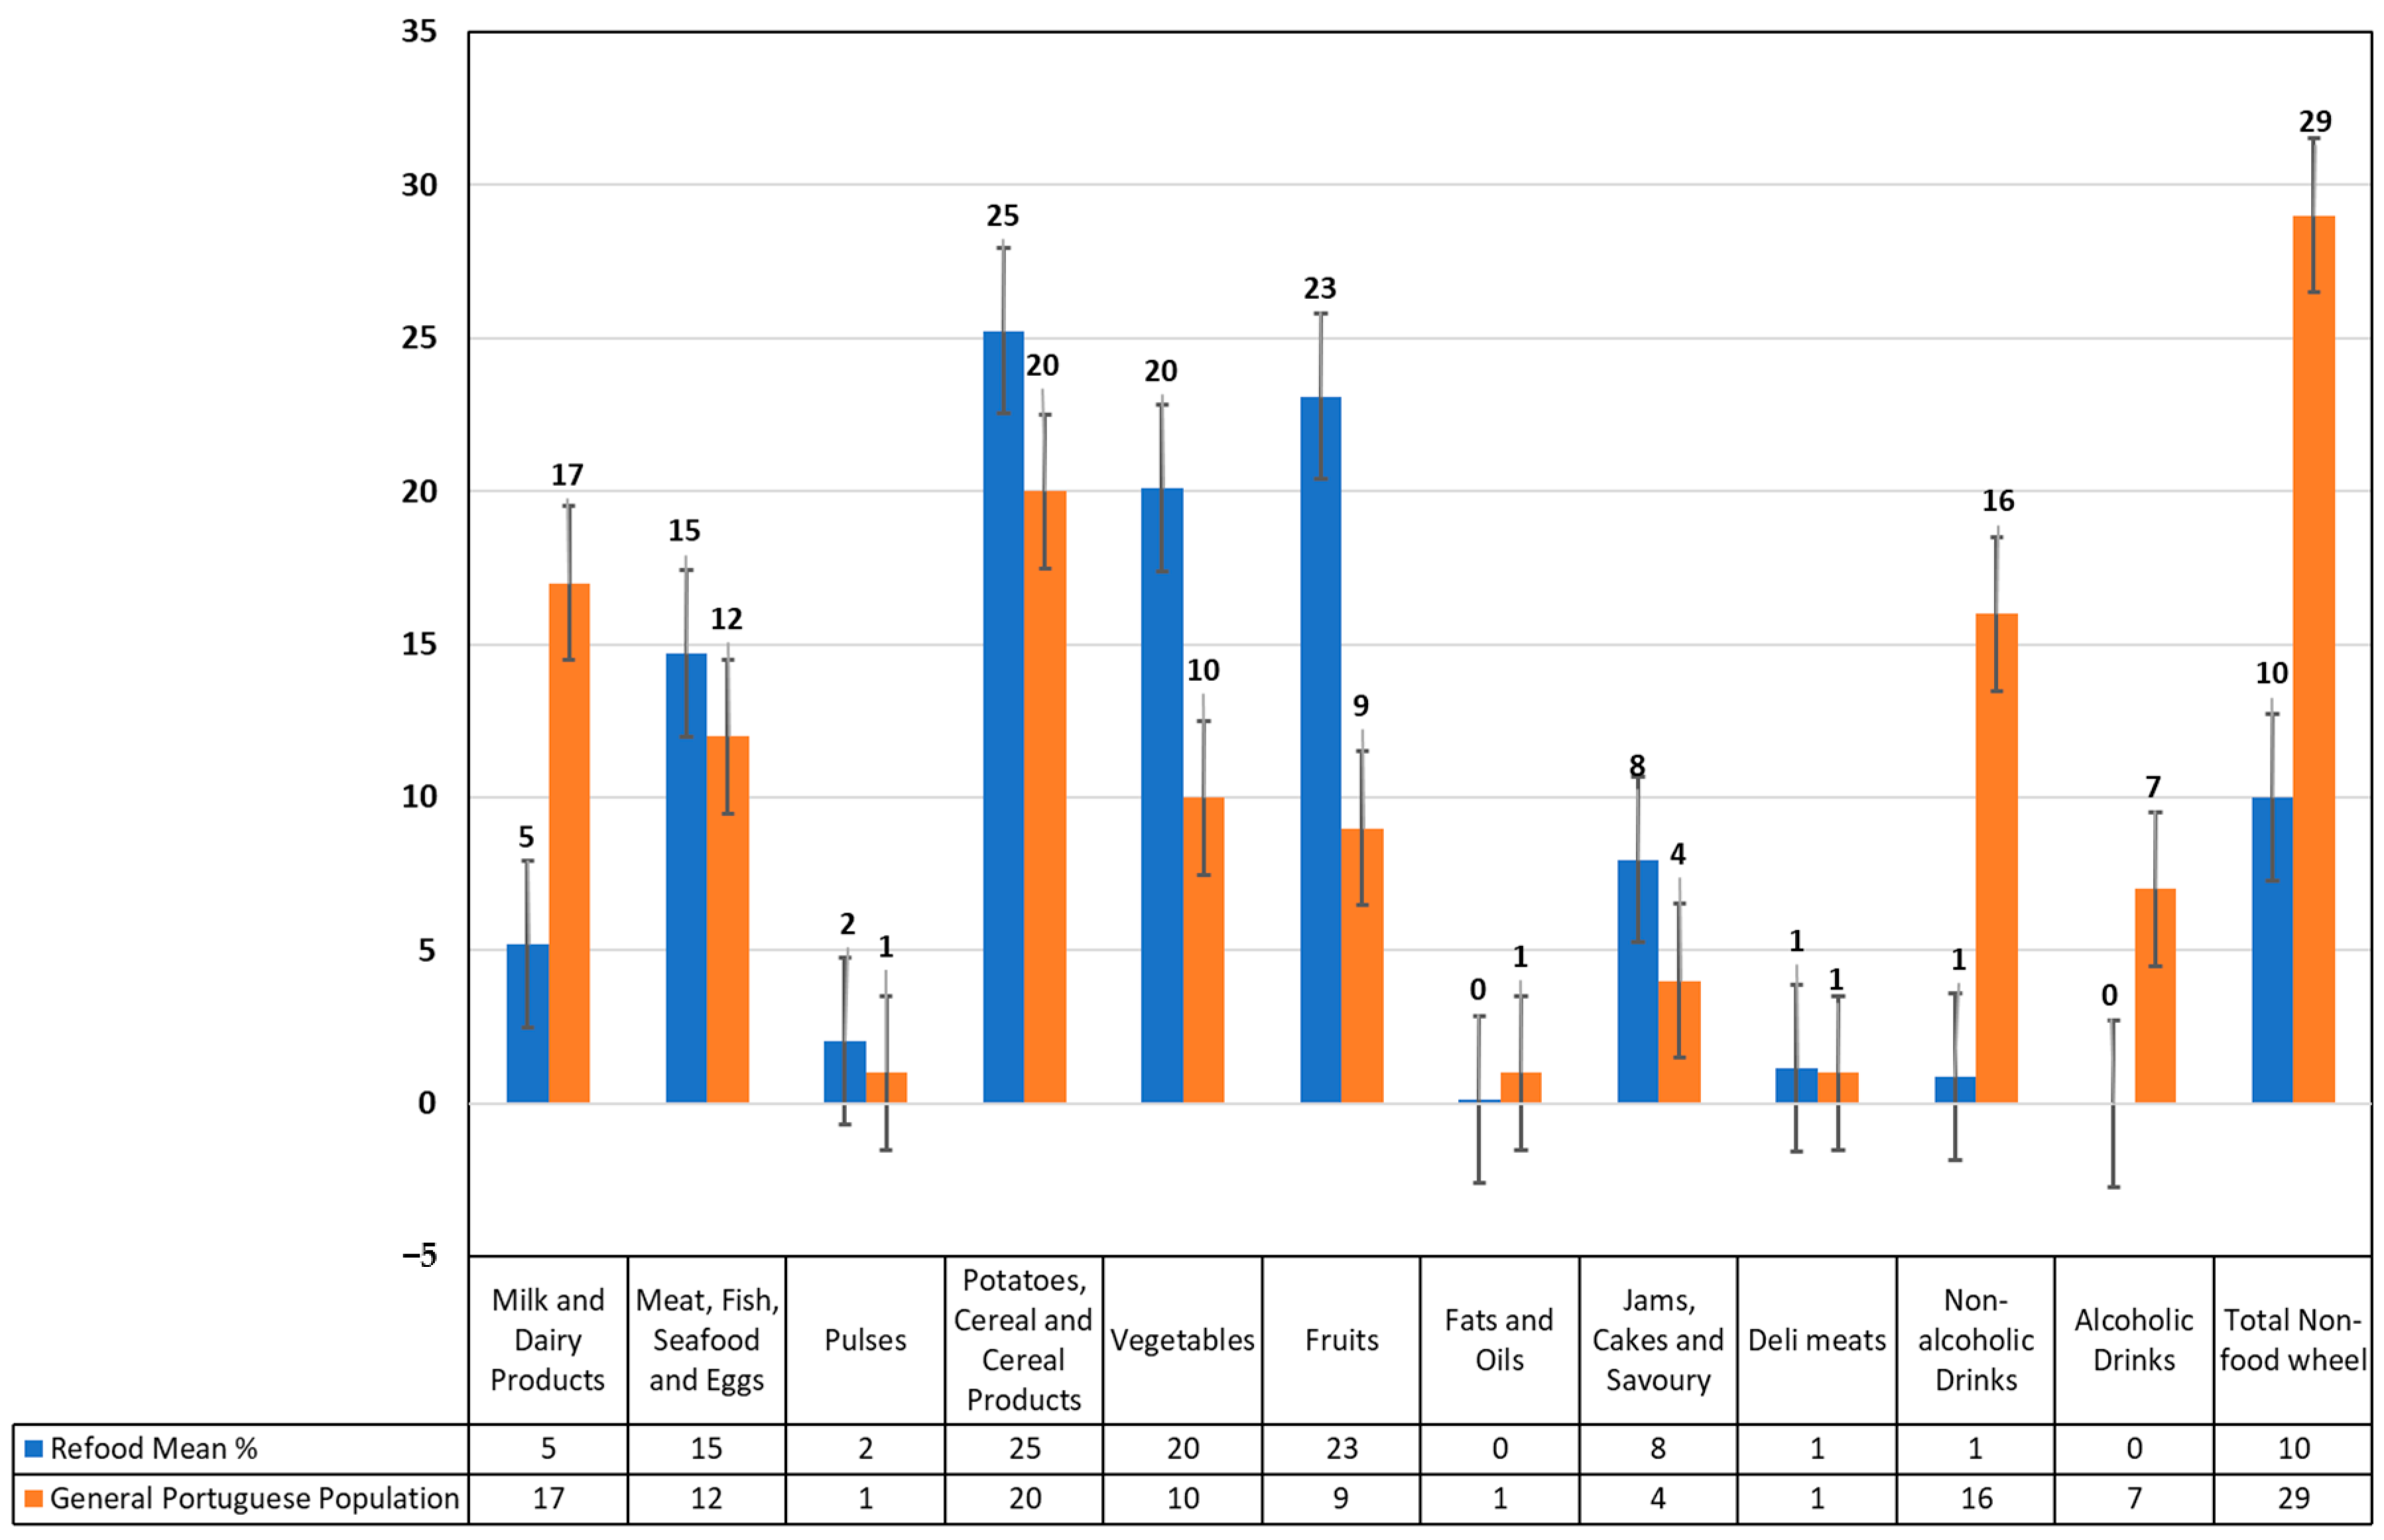
Figure 5) and standard deviation of redistributed food in hampers by food groups are 25% ± 3.8 of “Potato, Cereal and Cereal Products”, 23% ± 4.4 of “Fruits”, 20% ± 4.9 of “Vegetables”, 15% ± 3.2 of “Meat, Fish, Seafood and Eggs, 5% ± 2.9 of “Milk and Dairy Products”, 2% ± 1.7 of “Pulses” and 0.1% ± 0.2 of “Oils and fats”. The set of foods not included in the Food Wheel accounts for a percentage contribution of 10% ± 2.9, to which the “Non-alcoholic drinks” group contributes 1% ± 0.9, “Deli meats” with 1.2% ± 1.07, and “Jams, Cakes and Savoury” with 8% ± 2.5.
Thirdly, we compared the Portuguese population food consumption with the Refood beneficiaries’. This comparison uses has a refence for food consumption habits of the Portuguese Population, the results of the National Food and Physical Activity Survey (NFPAS), published in 2017 [
61].
The most significant differences are related to the consumption of Non-Food wheel products (
Figure 5). In fact, the general Portuguese population consumes a total weight percentage of 29% of foods not recommended by the guidelines including 16% of non-alcoholic drinks and 7% of alcoholic beverages, while food hampers provided by Refood-Leiria only have 10% of Non-Food wheel products, 1% of non-alcoholic drinks, and never include alcoholic beverages, as an organizational policy.
Furthermore, the Refood-Leiria hampers provide a larger weight percentage of various groups of foods than the general Population usually consumed [
61], respectively, “Meat, Fish, Seafood and Eggs” (15% vs. 12%), “Pulses” (2% vs. 1%), “Potato, Cereal and Cereal Products” (25% vs. 20%), “Vegetables” (20% vs. 10%), “Fruits”(23% vs. 9%), “Deli Meats” (1.2% vs. 1%), and “Jams, Cakes and Savoury” (8% vs. 4%). However lower percentages of “Milk and Dairy Products” (5% vs. 17%), and “Fats and Oils” (0.1% vs. 1%) were served.
5. Discussion
The results showed that, taking into account only foods included in the Food Wheel, food donations contributed to supplement the recipient’s total diet, even if foods included in some of the sectors do not meet the guideline recommendations (
Figure 5).
Firstly, the mean percentage of “Meat, Fish, Seafood and Eggs” in the average hamper (16.3%) is more than three times larger than recommended (5%), while the amount of “Fruits” (25.6%) is 28% higher than recommended (20%) (
Figure 5).
The content of the Refood-Leiria hampers is meant to be a food supplement provided, one to three times a week, at least one full meal, plus breakfast and mid-afternoon snacks, according to the nature of the daily rescued food. This means that of the excess of “Meat, Fish, Seafood and Eggs” and “Fruit” can be consumed during other weekdays, reducing, or even cancelling, the negative impact of this excess consumption. It is also the reason why more “Meat, Fish, Seafood and Eggs” and “Fruit” is provided to beneficiary families instead of being forwarded to other organizations. Furthermore, on days beneficiaries do not collect food from Refood-Leiria, they still manage to prepare nutritious meals with ingredients that low-income families cannot usually afford.
Secondly, foods included in the sectors of “Milk and Dairy Products”, “Pulses” and “Fats and Oils” were redistributed in smaller weight percentages than recommended. As Refood-Leiria rescues and redistributes mainly perishable goods (fruits, vegetables, freshly cooked meals, bread, and cakes), “Milk and Dairy Products” and “Fats and Oils” are foods that are seldom collected by the organization, except when, eventually, a “nearly past best-by-date” product is donated by a supermarket. Even though beneficiaries’ purchases need to compensate for the unoffered foods, hampers still supplemented the total diet with 32% of the necessary “Milk and Dairy Products” (5.7%/18%), 58% of “Pulses” (2.3%/4%) and 5% of “Fats and Oils” (0.1%/2%).
Remarkably, the percentages of foods served in the categories of “Potato, Cereal and Cereal Products”, and “Vegetables” matched the required percentages with a difference lower than 1% (
Figure 4).
Considering the totality of redistributed foods, the results showed that the addition of food donations to the diets of this low-income sample improved the balance of their diets, when compared to the general Portuguese population (
Figure 5). The non-compliance to the guidelines of the case study sample vs. general Portuguese population is especially relevant in terms of non-recommended by the Food Wheel food consumption, mainly due to the disparity of drink consumption.
“Deli Meats” and “Jams, Cakes and Savoury” are discretionary foods, and as such, they may be high in saturated fats, sugars, salt, and energy density. Therefore, they should be consumed in small amounts. As the non-recommended by the Food Wheel foods are also traditional constituents of a breakfast or snack, they are collected and redistributed in appropriate portions with the purpose of supplementing families’ daily food requirements (e.g., children morning/afternoon snack at school). The reason why the general Portuguese population’s intake percentage of these foods is lower than the supplied by Refood-Leiria may be related to the fact that these are costly products.
The estimates of “Milk and Dairy Products” provided by the food surplus donation in the present research are lower than recommended by the Portuguese national guidelines. Similar results of insufficient provision of “Milk and Dairy Products” were reported by other researchers with respect to each country’s guidelines, namely in the USA [
11], Canada [
14,
15], the UK [
18], Italy [
22] and in a multiple-country study involving United States, Canada, Australia, and several European countries [
23]. Likewise, insufficient provision of pulses was also reported in two organizations [
11,
15].
Higher values than the recommended for saturated fat, salt and nonmilk extrinsic sugars, provided in the present research by discretionary foods such as “Deli Meats”, and “Jams, Cakes and Savoury”, were also found in kitchens and pantries led by other food collection organisations [
11,
19,
22,
24]. In Oregon, Hoisington (2011) found that up to a third of foods distributed by the foodbank were condiments, noncaloric beverages, convenience meals like soup and boxed casserole mixes, and discretionary foods such as chips and donuts, while key foods were lacking [
11]. Even when bags provide sufficient energy and macronutrients to meet the needs of an average adult, as it is the case at the Bradford Metropolitan Food Bank (UK), they are often a source of high levels of salt and non-milk extrinsic sugars [
20].
The lack of key foods adequate for a balanced diet such as meat [
11,
15], and meat and alternatives [
11], whole grains [
11,
18,
23], fresh fruits [
11,
14,
15,
18,
23] and vegetables [
11,
14,
15,
18,
23] was a constant in the results of the previously cited studies. Comparing the outcomes of this study, our sample consumed balanced amounts of “Potato, Cereal and Cereal Products”, and “Vegetables”, and higher amounts of “Meat, Fish, Seafood and Eggs” and “Fruit”. These differences may be due to most food redistribution organizations relying mainly on dry staple foods while our case-study organization recovers and redistributes almost exclusively fresh or freshly cooked foods.
While Sprakle, in 2014, found that the dietary fibre intake of the individuals accessing two charitable meal services in Sheffield, UK, was significantly lower than population average intake, the present research found balanced amounts of vegetables, according to the Portuguese guidelines [
19]. This fact may be due to the Portuguese culture of vegetable soup consumption, which provides hydration, vegetable fibre vitamins and minerals intake.
6. Conclusions
In 2015, UN country-members have agreed on acting, in accordance with their respective capabilities, to progressively implement the SDGs of the 2030 Agenda [
8], through a diversity of governmental and non-governmental good practices. The process of food upcycling to support low-income households, often implemented by civil society initiatives at the local and micro level such as Refood, transversally integrates several of the SDGs.
While other researchers have found that supplemental foods offered at food pantries are an important resource to improve the quality of food intake to populations in vulnerable situations (SDG 2.1), this is the first study in which there is food quantification of almost exclusively rescued fresh or freshly cooked products. In this study, it was possible to measure the contribution of donated food to a balanced diet of Portuguese low-income families, according to Portuguese guidelines, demonstrating that the process of up-cycling fresh food contributes to improve dietary patterns of low-income households.
The Refood organization distribution process facilitates the promotion of good eating habits, since processed and ultra-processed foods are not distributed, but only meals prepared in traditional restaurants, in addition to unprocessed and fresh foods from surplus distribution chains. The fact that sugary drinks and eventual alcoholic beverages are diverted to other institutions also promotes healthy dietary patterns.
Overall, despite the small beneficiaries’ sample size, for clients who rely on organizations that redistribute perishable food such as our case-study, the results in this study suggest that fresh rescued foods can contribute to a more balanced diet in terms of “Potato, Cereal and Cereal Products”, “Vegetables”, “Meat, Fish, Seafood and Eggs” and “Fruits”. Thus, future research should evaluate the contribution of rescued fresh food to the dietary pattern of low-income families using a larger sample size. Furthermore, future research should also quantify nutritional intake and examine the effect of caloric/nutrient intake from recovered food donations on BMI/health status of food pantries’ clients.
Upcycling food, besides feeding needy populations, contributes to increase resource-use efficiency (SDG 9.4; SDG 12.5) and to substantially reduce waste generation, ensuring sustainable food consumption and production systems (SDG 12; SDG 2.4). In turn, global resource efficiency in consumption and production also helps to maintain ecosystems, lowers greenhouse gas emissions, and fosters climate resilience (SDG 13.2.1). We found that the consumption of rescued and redistributed food contributes to a balanced diet and therefore improves the health (SDG3) of families struggling with poverty (SDG1) and thus reduces inequalities (SDG10). This information is valuable to policymakers to better regulate the quantity and quality of the donations of fresh and freshly cooked foods. This could be done by transforming the donations into mandatory post-harvest stage, reducing food waste to the unavoidable.
Limitations of this research were of different natures. The results show that a balanced amount of food is provided to families, but there is no information about consumption frequency or the diet pattern of the beneficiaries. A family unbalanced redistribution of types and amounts of foods per family member could lead to an unhealthy diet pattern.
The amount of household food wasted or shared with others is unknown, thus the amount of food that is eaten is also unknown. In parallel to discarded or offered food, a family’s purchased food may also motivate unbalanced diets.
Comparing the results of nutritional balance of hampers with the food general population results in comparing samples of different sizes and levels of representativeness, especially in terms of the impact of their different socioeconomic situation. All beneficiaries are low-income families whose diet pattern depend partially on available food surpluses, while the general Portuguese population has differentiated socioeconomic situations whose diet patterns depend on their own choices. The conclusions drawn by comparing the eating patterns of these two populations may be biased.
The strengths of this study are the direct weighing of around 1,277,459 kg of food, representing 3500 items of exclusively food recovered products, in three weekly rounds over a period of four months, to assess how rescued and redistributed food can contribute to a balanced dietary intake of the recipients, according to the Portuguese food guidelines.
To the best of our knowledge, this is the first study focusing on the contribution of exclusively recovered, and mainly fresh or freshly cooked food to a balanced diet of low-income population. However, inadequate financial resources and available time limited the geographic variety (and sample size), for the present research. For future studies, a better design could include a control group of families prior to being supported by the organization. In addition, conducting the research in other similar organizations should lead to more significant results.
Food waste rescue organizations are changes in local practices with the potential to contribute to the food security of low-income populations, increase responsibility for societal change, decouple economic growth from environmental degradation (SDG 8.4), while endeavouring to accelerate the shift towards more sustainable food systems, all along the food value chain, from farm to fork.


