Article

Who Is Willing to Share Their AV? Insights about Gender Differences among Seven Countries

by
Amalia Polydoropoulou
1,
Ioannis Tsouros
1,*,
Nikolas Thomopoulos
2,
Cristina Pronello
3,4,
Arnór Elvarsson
5,
Haraldur Sigþórsson
6,
Nima Dadashzadeh
7,
Kristina Stojmenova
8,
Jaka Sodnik
8,
Stelios Neophytou
9,
Domokos Esztergár-Kiss
10,
Jamil Hamadneh
10,
Graham Parkhurst
11,
Shelly Etzioni
12,
Yoram Shiftan
12 and
Floridea Di Ciommo
13
1
Department of Shipping, Trade and Transport, Business School, University of the Aegean, 82 100 Chios, Greece
2
WISE-ACT Chair and Department of Tourism and Transport, School of Hospitality and Tourism Management, University of Surrey, Guildford GU2 7XH, UK
3
Interuniversity Department of Regional and Urban Studies and Planning, Politecnico di Torino, 10125 Torino, Italy
4
Université de Technologie de Compiègne, Sorbonne Universités, EA 7284 AVENUES, 60200 Compiègne, France
5
Infrastructure Management, ETH Zürich, 8093 Zürich, Switzerland
6
Verkfræðistofa Haralds Sigþórssonar, 105 Reykjavík, Iceland
7
Faculty of Civil and Geodetic Engineering, University of Ljubljana, 1000 Ljubljana, Slovenia
8
Faculty of Electrical Engineering, University of Ljubljana, 1000 Ljubljana, Slovenia
9
Department of Engineering, School of Sciences and Engineering, University of Nicosia (UNIC), Nicosia 1700, Cyprus
10
Department of Transport Technology and Economics, Faculty of Transportation Engineering and Vehicle Engineering, Budapest University of Technology and Economics (BME), 1111 Budapest, Hungary
11
Centre for Transport & Society, University of the West of England, Bristol BS16 1QY, UK
12
Faculty of Civil and Environmental Engineering, Technion, Israel Institute of Technology, Haifa 3200003, Israel
13
CambiaMO|changing Mobility, 28012 Madrid, Spain
*
Author to whom correspondence should be addressed.
Sustainability 2021, 13(9), 4769; https://doi.org/10.3390/su13094769
Submission received: 20 March 2021 / Revised: 13 April 2021 / Accepted: 14 April 2021 / Published: 23 April 2021

Abstract

:
The introduction of shared autonomous vehicles into the transport system is suggested to bring significant impacts on traffic conditions, road safety and emissions, as well as overall reshaping travel behaviour. Compared with a private autonomous vehicle, a shared automated vehicle (SAV) is associated with different willingness-to-adopt and willingness-to-pay characteristics. An important aspect of future SAV adoption is the presence of other passengers in the SAV—often people unknown to the cotravellers. This study presents a cross-country exploration of user preferences and WTP calculations regarding mode choice between a private non-autonomous vehicle, and private and shared autonomous vehicles. To explore user preferences, the study launched a survey in seven European countries, including a stated-preference experiment of user choices. To model and quantify the effect of travel mode attributes and socio-demographic characteristics, the study employs a mixed logit model. The model results were the basis for calculating willingness-to-pay values for all countries and travel modes, and provide insight into the significant heterogeneous, gender-wise effect of cotravellers in the choice to use an SAV. The study results highlight the importance of analysis of the effect of SAV attributes and shared-ride conditions on the future acceptance and adoption rates of such services.

1. Introduction

The deployment of fully automated, driverless vehicles, widely known as autonomous vehicles (AVs), is expected to have a wide range of impacts on mobility behaviour and patterns. Despite the hype about AVs during the past decade [1], advancement and deployment are still taking place at limited locations based on diverse levels of automation. An increasing number of studies have been published regarding AVs targeting a range of vehicle automation levels [2,3,4,5,6,7,8,9,10,11]. The Society of Automotive Engineers (SAE) has defined AV automation levels reflecting different degrees of assistance to, or complete replacement of, human control [12]. These levels of automation change from no automated features represented by Level 0 to fully automated features represented by Level 5. Nonetheless, social scientists have begun disputing the universal adoption of such an automation level scale, due to its unavoidable focus on technological standards without encompassing wider social issues surrounding AV deployment [13,14].
Autonomous vehicles have been projected to introduce a wide range of impacts, such as reduced road accidents, vehicle emissions, cost of travel or increased productivity [2,3,4,5,15], driving under challenging weather conditions [16]. Furthermore, researchers have pointed out the potential AV impact on highway capacity, e.g., via platooning [17,18,19] driving behaviour [20,21], public transport services [22,23], the value of travel time [24,25], private parking infrastructure [26], accessibility and induced demand [27] among others. A lot of the literature has primarily focused on short-term implications of AVs [4,5], but research community attention has also been shifted towards longer-term socio-technical changes [5,9,15,28]. Naturally, these implications show different results among different countries because of differences in urban form and size of cities, transport networks and infrastructure, travel patterns, governance structures, and socio-demographic, cultural and climate factors [11,29].
At the same time, there is an aspiration, and sometimes an expectation, that AVs would contribute to a shift towards shared mobility services using shared autonomous vehicles (SAV), for example, within the Mobility-as-a-Service (MaaS) context [30,31]. Studies conducted from Lisbon to Singapore, have demonstrated that SAVs can reduce the urban fleet required within a city up to 90% if such vehicles are shared, although with only marginally lower VMT (Vehicle Miles Travelled) or with even increased VMT [32,33], since this would depend on the adoption of shared AVs by users. The latter touches upon a fundamental transport planning issue intertwined with the existing differences between mobility cultures and behaviour across countries influenced by mobility innovations. Within such a context, it is important to explore the wider impact of AVs in the offering, for example, increased mobility options to those without a driving licence (e.g., children, elderly) or to those with restricted mobility options. Therefore, it is crucial to test the influence of socio-economic factors, such as gender, age, formal educational background, as well as user perceptions about safety, security, comfort not only on AV use per se, but more precisely on the use of AVs in shared mode.
Sustainability has been becoming a policy priority globally, since the Paris agreement in 2015, but it can only be fully realised if the needs of diverse users are considered by transport planners. Gender has been among the most neglected issues by transport researchers and practitioners when focusing on designing new mobility services. Therefore, adopting a gender-sensitive approach is an ongoing challenge that has been largely overlooked in the academic literature and conventional transport planning. AV deployment and SAVs, in particular, offer an opportunity to reconsider such important issues and bring them to the centre of relevant debates and policy decisions [34] (CIVITAS, 2020). Equivalent gender mobility issues have been observed across different countries (ITF, Di Ciommo and Hoadley, 2021 [35]; Clayton, 2020 [36]), since women have been found to have a lower attachment to car ownership levels and trust in new technologies on average.
Studies to date [36,37] have tended to examine gender differences as a single socio-demographic variable in datasets through hypothetical Willingness-To-Accept/Willingness-To-Pay (WTA/WTP) [36] or actual experience of SAV use [38] rather than gender being the primary variable in framing the study. Other studies which have used existing vehicles (e.g., passenger mini-vans) to test user attitudes towards sharing in the Global South [39] have reported that personal security is a significant factor for female respondents who often feel less comfortable travelling in the same vehicle with strangers, which may be an important factor in SAV usage. In this context, it is pertinent to test gender differences linked with trip-chaining, which is commonly observed in journeys by women. A timely research question is ‘how much longer a journey time?’ AV travellers would be willing to accept, particularly when travelling in an SAV. Since the answer to such a question would depend on respondents’ Value of Travel Time, transport infrastructure available, household car availability, as well as other cultural norms, it is important to explore these issues across different countries.
To this end, this article provides an in depth understanding of users’ preferences among PAVs (private autonomous vehicles) and SAVs investigating the effect of copassenger gender on the SAV choices in seven countries of the COST Action WISE-ACT (https://wise-act.eu), which is a network of experts in 42 countries focusing on the wider impacts of Autonomous and Connected Transport. It should be noted that the selected countries—Cyprus (CY), Greece (EL), Israel (IL), Hungary (HU), Finland (FI), Iceland (IC), United Kingdom (UK)—are very diverse in terms of geographic and socio-economic features, transport infrastructure available, and household car availability, as well as cultural norms.
The remainder of this article is structured as follows. Section 2 presents a brief literature review. Section 3 presents the methodology. Section 4 describes the model estimation results, and Section 5 concludes the paper by discussing the findings.

2. Literature Review

AVs are, for many researchers, a technology that promises benefits but which, combined with other developments in the transport sector, would reshape mobility patterns, with a mixture of positive and negative implications in terms of sustainable mobility objectives [40]. The impact of AVs on travel behaviour has been examined and studied in existing literature from different perspectives. Extensive reviews have emerged about the wider impact of AVs, for example, by the authors of [6,8,15,19,41,42,43]. Most existing studies focus primarily on the individual use of AVs without examining thoroughly the acceptability of vehicle or ride sharing and how this may affect SAV uptake.
Kolarova et al. (2019) [44] and Saeed et al. [45] confirmed the established perception that SAV use is a less attractive option compared to PAV. Time availability, such as vehicle arrival waiting time and residential location, seem to be important factors for SAV users, with commuters more likely to accept SAV use with strangers, as shown by Lavieri and Bhat [46] and Webb et al. [47]. Additionally, commuting distance has been found by Liu et al. [48] to positively influence SAV, which is explained by Krueger, Rashidi and Rose [49], who linked longer AV journeys with multi-tasking and remote working. However, very few studies have focused to date on the actual willingness to work onboard an SAV and on non-commuter preferences for AVs. Thus, these topics require further research, due to the anticipated earlier deployment of Level 4 SAV for leisure travel [43] and the varied Value of Travel Time introduced by PAV and SAV for different journey types [38,44,50]. Nevertheless, limited research contrasted user preferences across several countries [51]. Interestingly, Saeed et al. [45] and Rödel et al. [52] found that AVs may be more valuable for elderly users, which is aligned with the view adopted by Fitt et al. (2019) [53] for New Zealand, although not prone to use SAV according to Gurumurthy and Kockelman [54]. This debate about which user age group may be more inclined to use AVs is ongoing, as highlighted by the findings of Payre et al. [55] and Haboucha et al. [51], who argue that AVs are more likely to be accepted by older or younger users respectively. Nazari et al. [56] found that young males are more likely to switch to AV compared to conventional vehicles, whereas older users are more likely to switch to SAV, although Laidlaw [57] concluded that young adults are more willing to pay for an AV and to use an SAV. Moreover, household car availability is a crucial factor, since Menon et al. [58] found that although single-car households may replace the sole car with an SAV service, multiple-car households may only dispose of one of their cars with an SAV service. However, age and car use are directly linked with each other, since younger and elderly travellers show lower levels of driving licence holding.
Kyriakidis et al., 2015 [59] have been among a handful of scholars who focused on vulnerable users, namely, the elderly and children, finding that age, gender, formal education level and household size have an impact on how users may travel on AVs. However, their focus was on the presence or not of a human operator either within the AV or remotely and not on gender. Hohenberger et al. [60] revealed the importance of gender in the acceptability of self-driving vehicles. They found that women trust the technology more than men based on an autonomous bus study. This is in line with the results of Schoettle and Sivak [61], which stated that men had greater concerns about using SAVs than women. Similarly, Panagiotopoulos and Dimitrakopoulos [42] reported that women are more likely to own and use AVs in the future. On the other hand, Lavieri and Bhat [46] found that women and young adults are less likely to ride-share. Equally, Bansal et al. [62] and Moreno et al. [63] concluded that males and high-income people are more likely to use SAVs, which is aligned with the findings of Haboucha, Ishaq and Shiftan [51], stating that men are more likely than women to favour SAVs in Israel.
Two major issues appear to arise by reviewing relevant literature, i.e., (i) men are more comfortable with using new transport technologies; and (ii) personal security is a key concern for women when travelling with unknown copassengers. The former has been observed by Liu et al. [48], who found that females are less likely to pay for AVs than males and that they showed lower acceptance of new technology than men. The latter has been previously confirmed, for example, through a revealed preference study using shared mini-vans (colectivos) in Mexico City [39]. Both issues have also been highlighted through the TOMNET study in four metropolitan areas in the US [64]. More importantly, essential issues appear to be missing from existing studies regarding a gender-balanced approach to study and deploy PAVs and SAVs. Trip-chaining and mobility care, which are common practices for a large number of women globally, have been underrepresented to date Badstuber, 2019. However, women choose to share their travel 1.5 more times than men, according to Khoeini et al. [64], therefore, it is important to test whether this also applies in the AV context.
As previously mentioned, there are several studies on the impact of PAVs and SAVs on travel behaviour. However, few results of discrete choice models about PAV and SAV acceptance across more than three countries in the literature can be found. Etzioni et al. [65] is one of the very few similar studies, which modelled the public acceptance of AVs and regular cars across six countries in Europe, but without focusing on sharing aspects. The effects of travel time, travel cost, gender, age, income and current travel habits are quantified in a joint model using a logit kernel model with panel effects. Findings demonstrate a substantial difference in acceptance across countries, while people show large reservations about the use of AVs. Our paper advances the study of Etzioni et al. [65], focusing on gender-based travel preferences using AVs across seven different countries and discuss potential cultural influences on AV vs SAV usage and the impact of cotravellers’ gender on ride sharing acceptance.

3. Methodology

In the context of the COST Action WISE-ACT, an international survey, including a Stated Preference (SP) experiment with a particular focus on AV user attitudes towards vehicle and ride sharing with fellow passengers of different genders was designed. Three travel alternatives options were offered to each respondent. This article extends the analysis of Etzioni et al. [65], which focused on choices between a conventional car and an AV, by focusing on the willingness to share either a vehicle or a ride versus a PAV. The three-step method design is outlined here:
(1)
Survey design;
(2)
Sample selection and survey administration;
(3)
Model estimation and analysis.
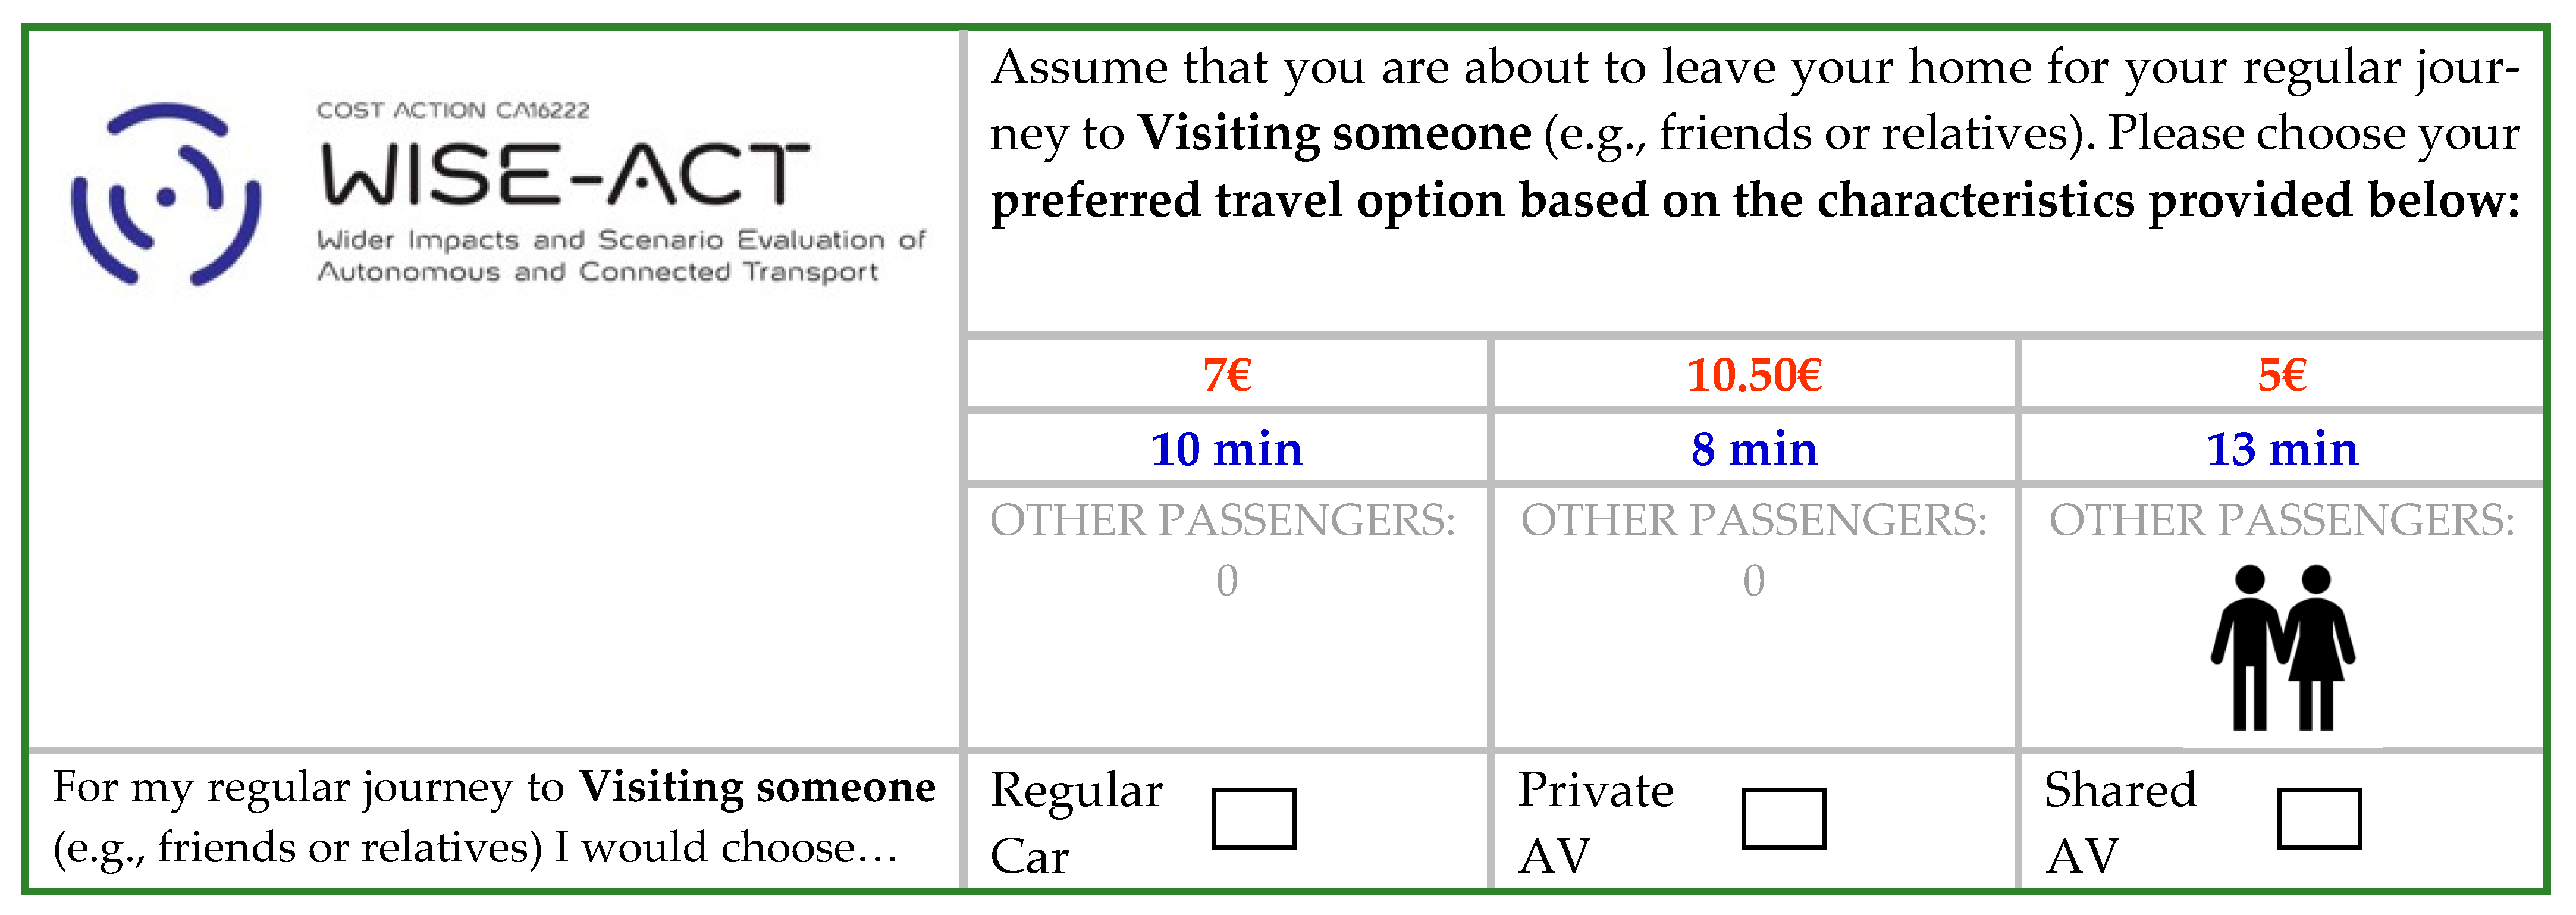
3.1. Survey Design

The survey involved a web-questionnaire consisting of three sections:
  • The first section included 23 questions focusing on travel patterns regarding the respondent’s most important journey and general attitudes towards AVs;
  • The second section included 9 questions focusing on a regular car journey and a series of six stated preferences experiments regarding the choice between regular car, PAV and SAV in various scenarios varied by travel cost, travel time and, in the SAV alternative, the number and gender of fellow passengers;
  • The third section is focused on respondent socio-economic characteristics.
A common definition of AVs was offered to all participants at the beginning of the survey to provide essential background about the survey and to avoid any misunderstandings of the notion, i.e., “An Autonomous Vehicle (AV) is a vehicle which takes over speed and steering control completely and permanently, on all roads and in all situations. The driver-passenger cannot drive manually because the vehicle does not have a steering wheel. The driver-passenger only sets the travel destination”. Respondents were asked to consider a fully automated vehicle, i.e., an autonomous vehicle according to SAE Level 5. The survey was designed following standard research ethics processes, and all data were collected anonymously.
In the second survey section, respondents were asked to think of one of their main trips (journeys starting from home at least once a week) and state their journey purpose and transport mode. Subsequently, respondents were asked to imagine making such a regular trip by car and to state the total journey duration. Based on these responses, each respondent was presented with six individually customised choice scenarios, where they had to choose one of the following three vehicle options in each choice scenario:
  • Privately-owned regular car (CAR) similar to conventional private cars used today;
  • Privately-owned autonomous vehicle (PAV). This option is similar to Privately owned regular cars, but the car is an AV one.
  • Shared autonomous vehicle (SAV), which the passenger does not own. They will be able to travel in it just by themselves (shared vehicle) or to travel with strangers (shared ride). If they chose to share it with others (shared ride), they may save some money. However, on some occasions, they will incur additional journey time picking up and dropping off other passengers. Occasionally, they will be able to travel faster on special high occupancy vehicle (HOV) lanes and save travel time.
The term ‘car’ was used in option (A), due to the fact that all respondents are familiar with cars. The term ‘vehicle’ was used in options (B) and (C) to avoid creating respondent bias regarding the type of vehicle which could represent an AV in different countries or cities.
The stated choice experiment was based on a Bayesian D-efficient design, including 24 scenarios generated by Ngene, allowing sufficient variation. Since the survey design was based on the presentation of six choice scenarios to each respondent, these 24 scenarios were divided in four blocks, and each respondent was randomly assigned to a block by Limesurvey. Similarly to Etzioni et al. [65], the six scenarios presented to each respondent used a national average travel cost value based on an approximately 10 km taxi journey from an international airport to the main city within the country they were living in. This innovative approach enabled this survey to offer a customised survey at a national level, while at the same time allowing a cross-country comparison of SP results across these seven countries. However, Etzioni et al. [65] focus on choices between privately-owned regular cars (CAR) and privately owned AVs (PAV), whereas the analysis in this article contrasts choices between CAR, PAV and SAV.
The attributes included in each scenario were total travel cost, door-to-door travel time, number and gender of fellow passengers (single/pair of either gender or mixed). Only two genders were included in this survey to reduce complexity.
Total travel cost included all vehicle costs (e.g., fuel, insurance, maintenance, parking). Figure 1 illustrates a sample scenario shown in the variant of the survey for Cypriot respondents.

3.2. Sample Selection and Administration

This article focuses on the responses from the seven selected countries: Cyprus, Finland, Greece, Hungary, Iceland, Israel and the UK, representing EU, EEA and non-EU/EEA countries of different population, geographical size, geomorphology, GDP and transport infrastructure levels. A wide range of individuals has been contacted to cover the following sampling criteria: Gender, age, transport mode most frequently used, education level, household size, as well as any known disabilities, reaching a total sample of 1962 valid responses, as shown in Table 1. The sample in the seven European countries was administrated through WISE-ACT stakeholders and professional networks at national and local levels, i.e., interest groups, public transport operators, national road agencies, car clubs, cycling groups, general public. Additionally, in Israel only, a panel survey was used; the panel roughly represented the population according to the main socio-demographic characteristics. The survey was designed in English and then translated into five other languages to be administered in the seven countries selected.

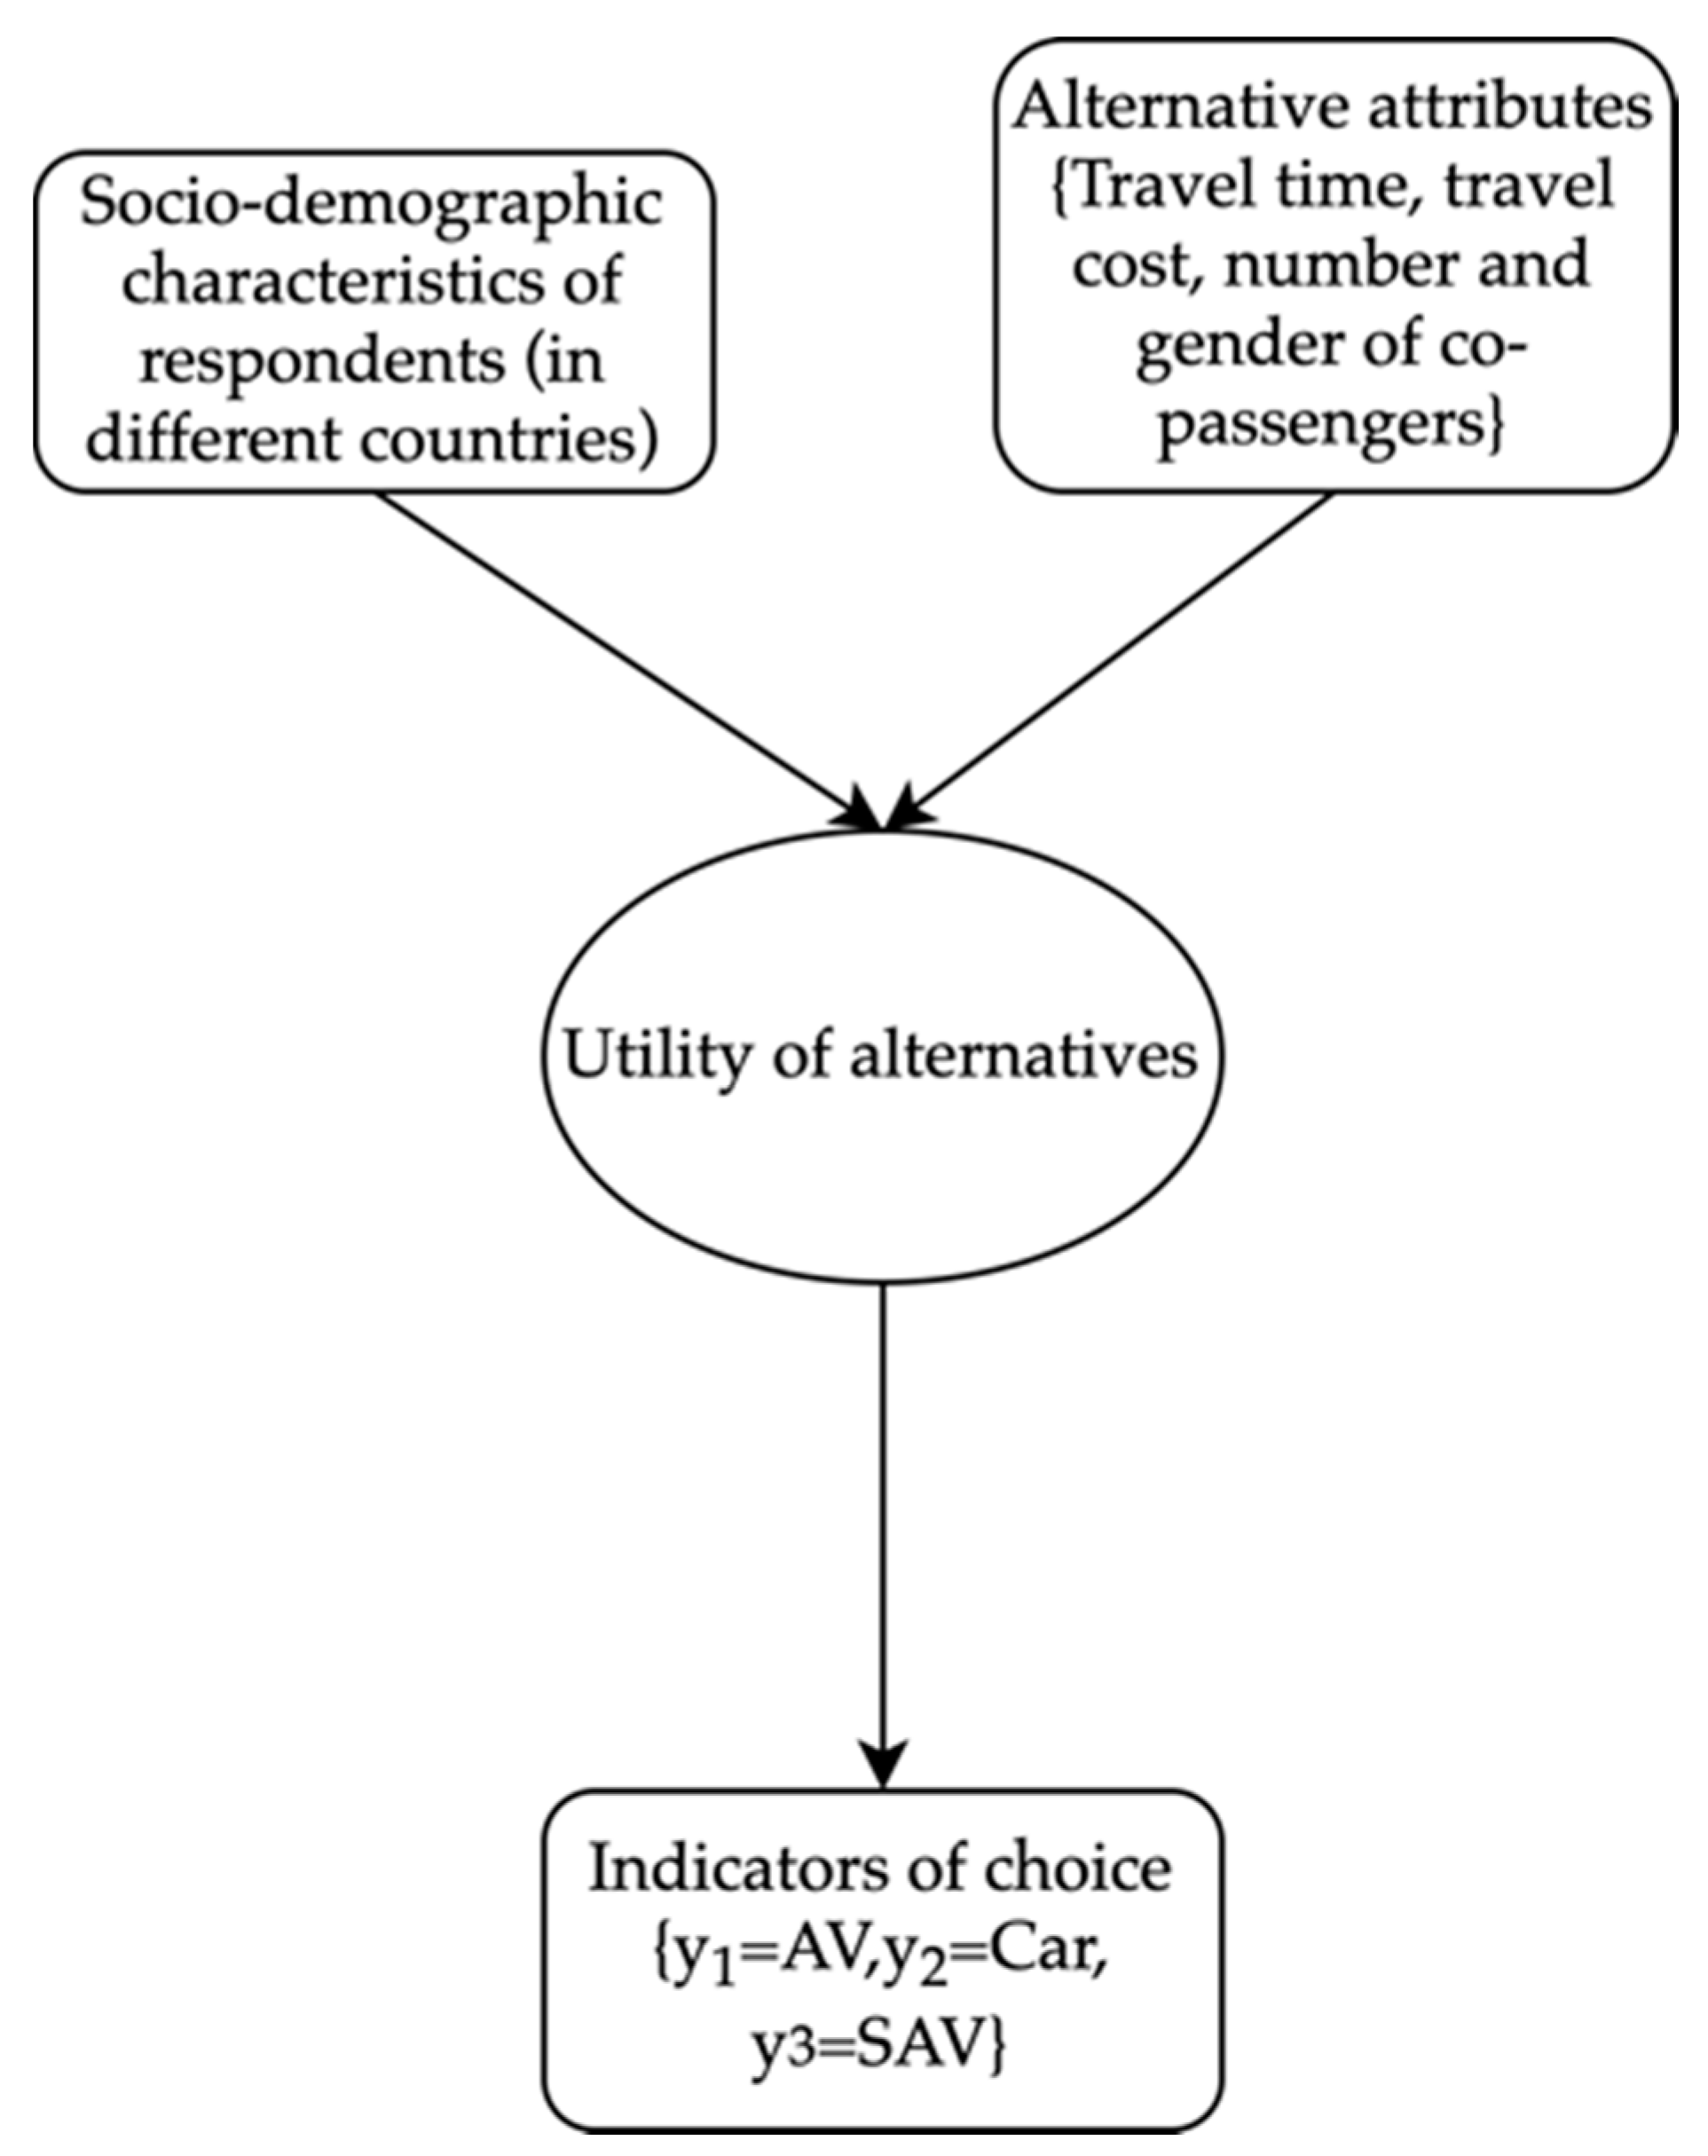
3.3. Modelling Framework

Figure 1 presents the modelling framework of the mode-choice behaviour; in our case, the mode choice between CAR, PAV and SAV is a function of two types of variables:
  • Socioeconomic characteristics, such as age, number of cars in household(H), number of members in HH;
  • Attributes of the alternative modes, such as travel time; travel cost; as well as, in the SAV alternative, number and gender of copassengers.
The utility function is indicated through the choice indicators, as depicted in Figure 2.
A mixed logit (ML) model with a distributed alternative specific coefficient (ASC) for the different travel modes is estimated. The ML model extends the conventional multinomial logit model (MNL) by allowing the researcher to select a subset of the parameters to be treated as random parameters to estimate deviation along with the expected value of the mean of the parameter. Due to this extension, the research is able to explore additional, unobserved heterogeneity in the sample in the form of random effects. The utility function of our ML model is described in Equation (1):
U i t n = β k X i k t n +   γ 11 δ 1 + γ 12 δ 1 W o m a n + γ 21 δ 2 + γ 22 δ 2 W o m a n + γ 31 δ 3 + γ 32 δ 3 W o m a n +   γ 41 δ 4 + γ 42 δ 4 W o m a n + γ 51 δ 5 + γ 52 δ 5 W o m a n + ε i t n
  • i = alternative (1 = AV, 2 = CAR, 3 = SAV)
  • k   = vector of coefficients
  • t = choice situation (repeated observations)
  • n = individual
  • Woman = 1; if the respondent is a female; 0 o/w
  • δ1 = 1; if copassenger = 1 man; 0 o/w
  • δ2 = 1; if copassenger = 1 woman; 0/w
  • δ3 = 1; if copassengers = 2 women; 0 o/w
  • δ4 = 1; if copassengers = 2 men; 0/w
  • δ5 = 1; if copassengers = 1 man and 1 woman; 0/w
The alternative specific constants are assumed to vary between individuals both randomly and systematically [66,67];
-
β k is the vector of the coefficients of the various attributes (alternative or socio-demographic);
-
X i k t n is the vector of the mentioned attributes (Figure 2);
-
γ 11 represents the utility value that one man as a copassenger has on the choices of male respondents;
-
γ 21 represents the utility value that one woman as a copassengers has on the choices of male respondents;
-
γ 31 represents the utility value that two women as copassengers have on the choices of male respondents;
-
γ 41 represents the utility value that two men as copassengers have on the choices of male respondents;
-
γ 51 represents the utility value that a woman and a man as copassengers on the choices of male respondents;
-
γ 12 represents the extra utility value that one man as a copassengers has on the choices of female respondents;
-
γ 22 represents the extra utility value that one woman as a copassengers has on the choices of female respondents;
-
γ 32 represents the extra utility value that two women as copassengers have on the choices of female respondents;
-
γ 42 represents the extra utility value that two men as copassengers have on the choices of female respondents;
-
γ 52 represents the extra utility value that a woman and a man as copassengers have on the choices of female respondent;
-
the total utility of women is additive, for example, it is γ 11 + γ 12 (for the first level of the copassenger dummy variable (1 man as copassenger), etc.;
-
ε i t n is an IID extreme value type I distribution, error term.
The distributed random ASC includes an error term ( η n ) which is normally distributed.
As noted in the relevant literature [66,67], ML models cannot be calculated analytically, so we resort to simulation. For this paper, the Apollo choice modelling software [68] was utilised to estimate the model using 500 Halton draws.

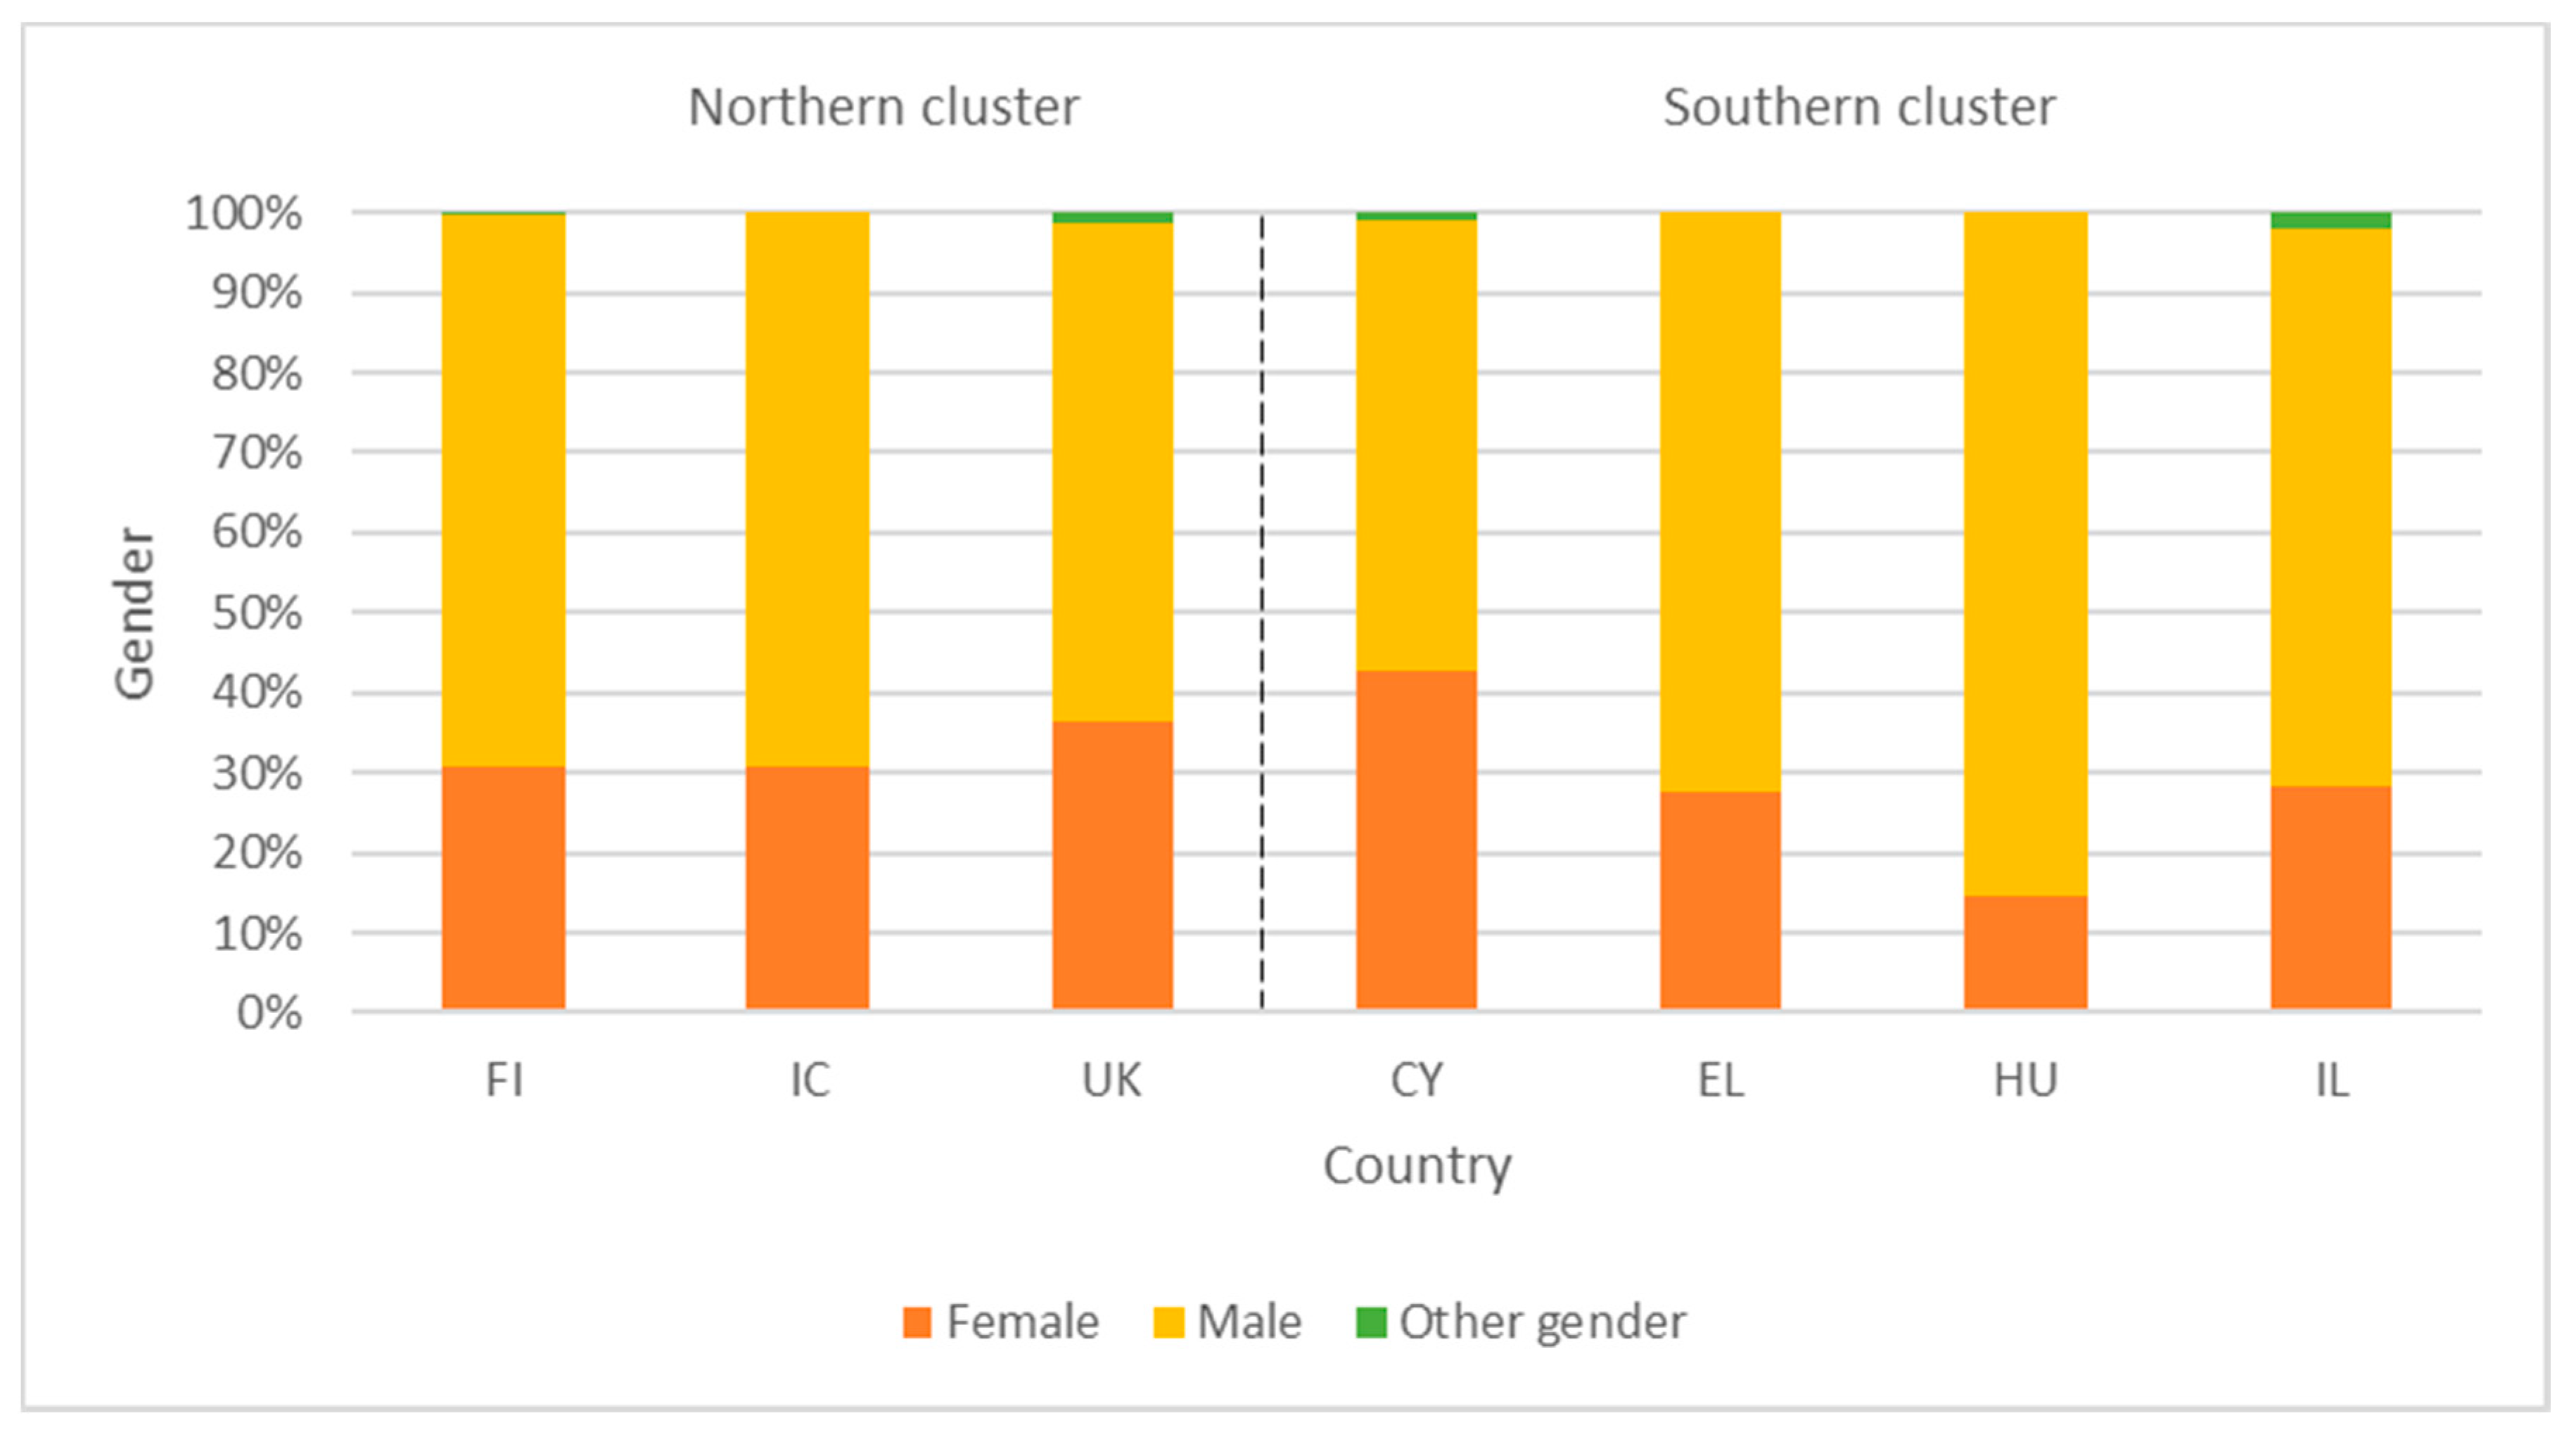
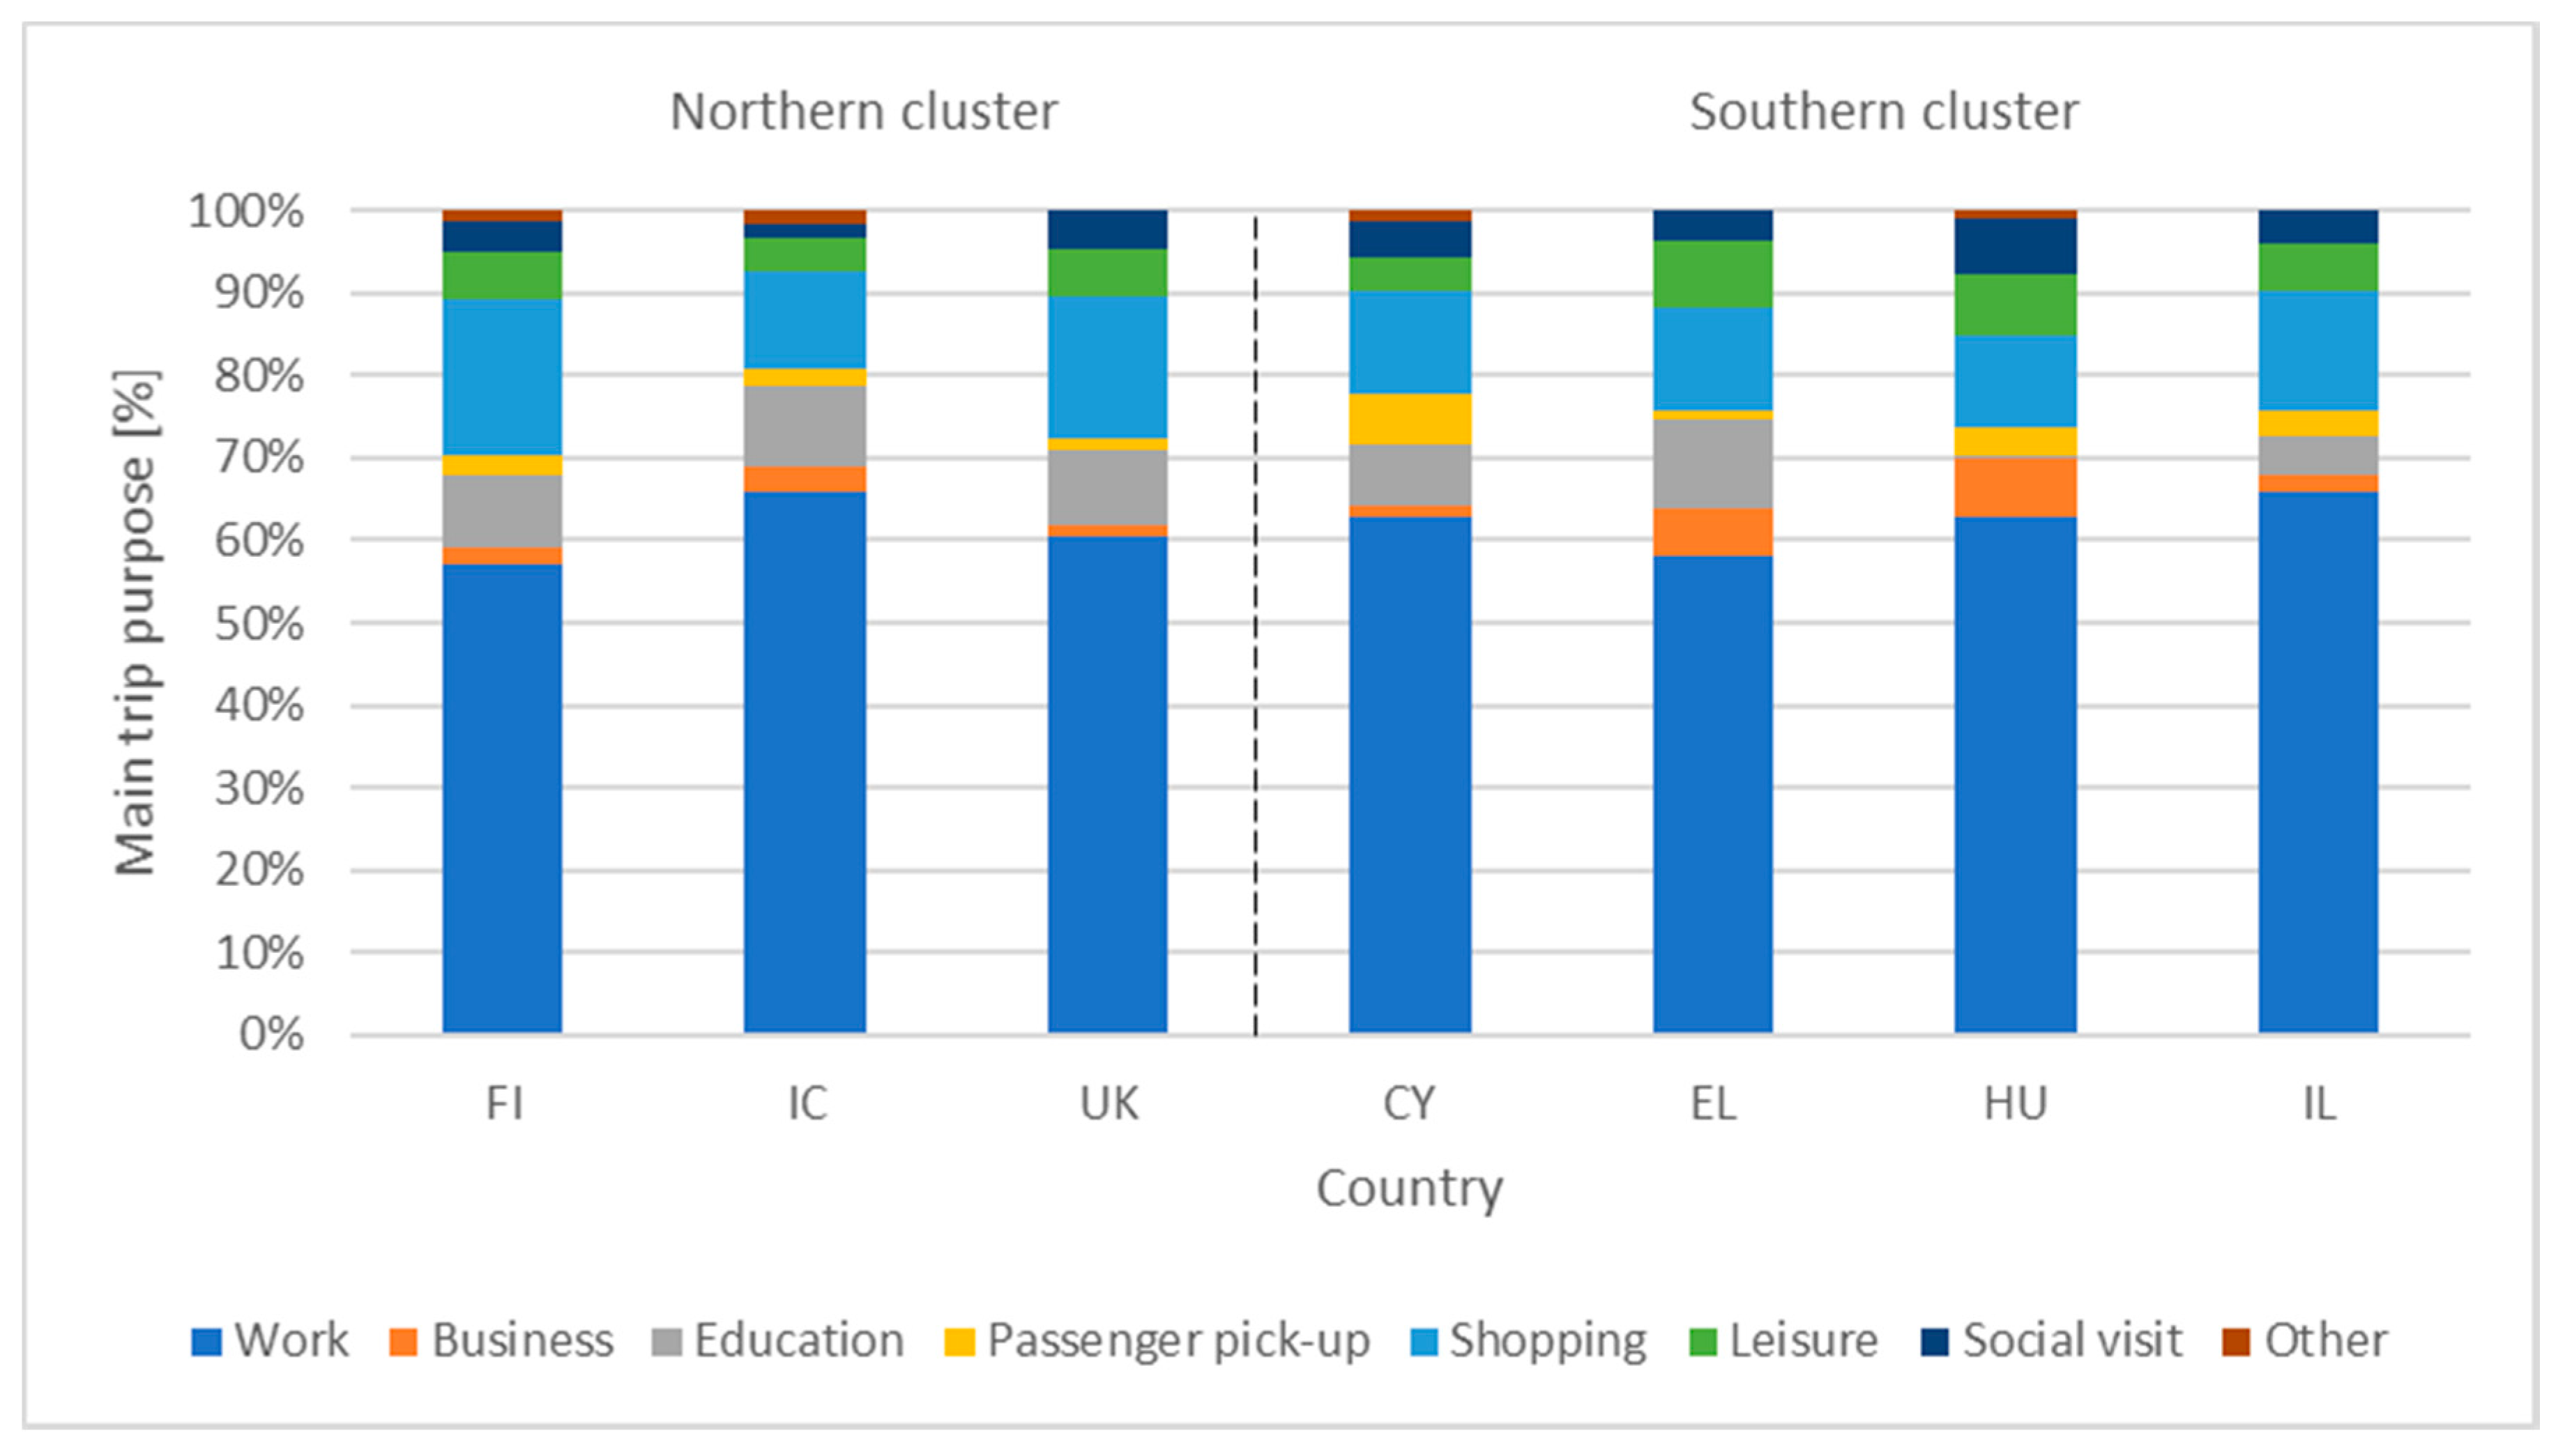
4. Sample Descriptive Statistics

The sample forms a unique dataset regarding geographical and cultural coverage that has not been analysed before. Figure 3, Figure 4, Figure 5 and Figure 6 and Table 2 and Table 3 show the socio-economic characteristics of the sample, in terms of age (Table 2) and gender (Figure 3), household size (Figure 4), car ownership (Table 3), level of education (Figure 5) and employment status (Figure 6). The data is presented alphabetically and divided into northern and southern cluster groups. Concerning age and gender, we can observe a prevalence of men, and mean age above 38 across all the countries. When compared to statistical data about drivers in the countries the study was conducted in, we can find the prevalence of men in the driving population (license holders) (for example, UK [69], IL [70]), however the differences are not too large. There is an obvious negative relationship between the mean age of the sample and the percentage of women – higher the mean age, lower the number of women participants. The lowest percentage of women and the oldest age were found in Hungary while the highest percentage of women and youngest age was in Cyprus. This limits the generalisability of the findings for gender for the older respondents, although in this case, the dataset provides more information about male preferences and attitudes towards AV and SAV usage. The median age in Europe is 43, with Cyprus having the lowest median of only 37.3 in 2018 [71], which is, except for Hungary, similar to the results collected in the survey. In Israel, the median age was 30.5 in 2020, which is lower than the average of the sample, given Israel is the youngest country with the largest number of children per household [72]. The results showed that the largest households were reported in Finland and Iceland, which on the other hand also reported the smallest mean number of cars per household. The lowest number of cars was found for Israel, where there is also the smallest reported number of cars per household in the census.
It can be noticed that the sample has an atypically high level of education, with most respondents holding a university and PhD degree. This sampling bias is likely the result of the chosen sampling method, which partially involved recruitment through authors’ professional networks in the online-based survey. Furthermore, the majority of respondents are employees, except in Greece, which also shows an important percentage of self-employed respondents. However, the wider sample is in line with European statistics, which show that the majority of European citizens are employees [73].
In summary, although with some biases, the sample shows the diversity and provides a fairly good representation of the actual population in Europe and Israel. Despite this, the identified differences in the sample size still require caution when interpreting the results, and there are limitations when generalising the conclusions.
Figure 7 and Figure 8 present, respectively, the mode and purpose of the main trip made by respondents. Cars were the predominant mode, justifying the survey design around a regular respondent car journey, followed by public transport and use of personal bicycles. However, although the car was reported as the most common mode for main trips in all countries, there are significant differences among their share, with 50% or less in Hungary, Israel and UK, and more than 85% in Cyprus. The main trip purpose is to commute and then, much less, to go shopping. These results are comparable among all the countries in the survey and are also in line with the general findings for an average EU citizen [74].
In the next section, the model estimation results are presented.

Model Estimation Results

Table 4 reports the results of the estimation carried out for the seven EU countries where the survey was administered; such countries can be clustered into two groups: (1) The ‘southern’ cluster of Cyprus (CY), Greece (EL), Hungary (HU) and Israel (IL); (2) The ‘northern’ cluster: Iceland (IC), Finland (FI) and the United Kingdom (UK). Overall, the estimation results reveal interesting insights into user preferences. The randomly distributed ASCs (of AV and SAV) have statistically significant SDs in all countries, revealing significant intra-personal correlation among choices in the different tasks of the experiment, i.e., when a person chooses a specific mode for one task, it is likely that she will make the same choice in other tasks. Travel time and travel cost coefficients are negative and statistically significant, as expected, in all cases, and were used to calculate values of time (Table 5).
The value of time (VoT) has a wide variation between countries and between modes. First, it is interesting to compare the VoT of regular car use with AV. In IL, IC, FI and UK it is lower for AV, due to the respondents’ expectations about their ability to use the travel time for other tasks or even just to relax, while in HU and CY it is the opposite, but the differences are small. Comparing the VoT of SAV versus AV, we see that it is always higher in SAV, which is also in line with expectations, due to the lower convenience of SAV compared to a PAV.
Regarding socio-demographic variables, age (as a continuous variable) negatively affects the choice of an AV in HU, IL and IC, while positively affecting the choice of an AV in FI. In the case of SAV, older age positively affects the choice in CY, while negatively affecting the choice in HU, IL, IC and the UK.
The model includes the impact of the household vehicles availability index (number of vehicles per household member). Estimation results show that this index negatively affects the SAV choice in almost all southern cluster countries, except EL, but is statistically insignificant in northern countries. Persons in households that do not have sufficient availability of cars per household member are more likely to choose SAV in most countries, most probably because of the flexibility that a shared vehicle provides to these persons or maybe because of the perceived high costs of purchasing/owning an AV.
When considering the ‘main travel mode’ (i.e., that identified by the respondents), when it is a car, then it positively affects the choice of AV in CY, HU, IL, IC and FI, while it also positively affects the choice of CAR in every country except EL. When some form of public transport mode is the main commute mode, it positively affects the SAV choice in EL, IL and IC and negatively affects SAV choice in the UK (an interesting finding since previous research [36] found that the reverse is true, similar to the other countries in the sample). Additionally, public transport as the main mode positively affects AV choice in IL and FI.
The models reveal a valuable insight into gender preferences when considering copassengers in the shared automated vehicle (SAV). Figure 9 provides an overview of responses in the different countries in favour or not of sharing an AV, according to the number of copassengers and their gender. It is interesting to observe the positive outlook, from the perspectives of both men and women, on sharing an AV with two women in three of the southern countries for men and in the UK for women. In Hungary, there is a low propensity towards SAV for both genders. Women do not like to share an AV with two men, and men do not want to share with another man; the exception for men is when the copassengers are two women. Non-significant effects may be attributed to data limitations or indifference by the respondents as to with whom they share the ride.
In the UK, there is a separation between genders—women prefer sharing with women and not with men. Whereas, in Nordic countries (FI, IC), women are resistant to travelling in the same vehicle with a lone man, and men prefer to avoid mixed groups as well, and in Finland, even with two women as copassengers. In Hungary and Israel, men chose not to share with another man.
Overall, the results show some intricate and interesting findings. In the southern countries, men indicate a preference towards using an SAV when one or two women are the copassengers, while women generally do not reveal any strong preferences compared to the base case as outlined in the literature (i.e., travelling alone in the SAV)—with the exception of women in Hungary who would like to avoid riding with two men or one woman. On the other hand, in the northern cluster, women are more reluctant to share a ride with one or two men, while men do not express the preference of sharing a ride with women. On the contrary, men in Iceland indicate they would prefer to avoid riding with two women. Given the exploratory nature of this survey, these findings need to be further reviewed and discussed to draw valuable conclusions for further research.

5. Discussion and Conclusions

This study explores users’ stated choices and preferences regarding the use and the willingness-to-pay for private (PAV) and shared autonomous vehicles (SAV) using a stated preference experiment survey. User choices are analysed by estimating a mixed logit, discrete choice model to quantify and explore choices across seven countries (Cyprus, Greece, Hungary, Israel, Iceland, Finland and the UK). This study is part of the growing literature exploring and analysing user preferences regarding the use of autonomous vehicles, and one the first to highlight the importance and heterogeneous nature of gender-wise effects of cotravellers and their variation among countries and cultures in the choice of an SAV.
Our results highlight a clear difference in behaviour between the southern and northern countries of our sample. In what appears to be a cultural effect, travelling with women has a positive effect on male respondents in the southern cluster, while both women and men would prefer to avoid riding with one or two men, at least in some countries of the southern cluster. In the northern cluster, women would prefer to avoid riding with one man in an SAV, while men prefer to avoid riding with women or mixed-gendered passengers. Our findings are supported by the limited literature on SAVs and the effect of gender on travel environment choices [63] and can also explain the reluctance of women to use SAVs [51,62,63]
Regarding WTP values, we observe that VoT for SAV is higher than the PAV for all countries. This is an interesting finding, which can be explained by the lower convenience of riding in an SAV and the consideration of all additional costs (including purchase cost, which is expected to be significantly higher than a regular car) of a PAV. In most countries, the VoT of regular car use is higher than PAV, which is expected, given the opportunity to use the time in the AV for other purposes or just to relax. Interestingly comparing the VoT of the regular private car with SAV gives some mixed results; in some countries like the UK, the convenience of automation results in lower VoT than the convenience of privacy in a regular car, while in Iceland, we observe the opposite result.
Regarding the rest of the socio-demographic factors affecting choice, we find that most of the effects we have observed are in accordance with previous literature (Section 2). An interesting finding in our research is that a smaller vehicle availability index (the number of available cars in the household divided by the number of family members) is positively associated with the choice of SAV.
Findings from our models provide useful insights for policymakers along two axes: Initially, they highlight the significant heterogeneity of preferences across countries and across individuals in the same country (identified by the use of random alternative specific coefficients). The presence of this heterogeneity highlights the need for further research, even in the form of real-life experiments (such as in Paddeu et al. [38]) to further explore and quantify the effect of socio-demographic variables, attitudes and perceptions and technological/economic aspects of the vehicles. In that sense, results from our models are also useful for technology providers, the industry and other researchers focusing on the future acceptance of autonomous vehicles.
Our highlights regarding the gender aspect of our models, especially the reluctance of women to choose the SAV option when they share the ride with male cotravellers (mostly in the northern cluster of countries, but similar effects are spotted in the southern cluster), especially when compared to the preference of men to share a ride with women in the southern cluster are useful in determining (and hopefully overcoming) barriers to adopt and securely use an innovative mobility service for all citizens, irrespective of gender, income or characteristic.
Having heterogeneous samples, mostly attributed to different sampling strategies in the countries in the research, is recognised as one of the limitations of the study, even if the total sample size is acceptable. Additionally, collecting and utilising attitudinal data could potentially reinforce the modelling process and enrich the findings. Further research should focus on determining the sharing service’s attributes and operating rules which might make women feel safe, secured and empowered to use shared services with a range of cotravellers. Given our findings, it would be interesting to see similar modelling approaches to quantify the effect of travel mode attributes (such as travel time or cost), personal attitudes and the presence (and gender) of cotravellers on the choice of an SAV.
Based on the foregoing results and in tandem with existing gender-aware ride-hailing apps, our recommendation would be to develop security protocols and targeted campaigns for enhancing women’s experiences with shared and automated transport services. Further research should examine the demand for and feasibility of special services, such as female-only services, to enhance shared/automated mobility adoption among women. Finally, it is noted that post-implementation research on actual services will be critical in untangling stated intentions versus actual behaviours.

Author Contributions

Conceptualization, A.P., N.T., I.T., S.E. and Y.S.; methodology, A.P., I.T., C.P., N.T.; software, I.T., S.E., N.T.; validation, A.E., H.S., S.N., D.E.-K., J.H.; formal analysis, I.T., A.P., C.P.; investigation, N.D., K.S., J.S., J.H., S.E., N.T.; resources, N.T., Y.S.; data curation, J.H., N.T.; writing—original draft preparation, A.P., I.T., G.P., N.D., K.S.; writing—review and editing, A.P., I.T., C.P., G.P., Y.S., F.D.C., N.D., J.S., K.S., J.H., N.T.; visualization, K.S., C.P.; supervision, A.P.; project administration, A.P., N.T.; funding acquisition, N.T., Y.S. All authors have read and agreed to the published version of the manuscript.

Funding

This study forms part of an international survey focusing on AVs conducted by WISE-ACT (COST Action CA16222 Wider Impacts and Scenario Evaluation of Autonomous and Connected Transport).

Institutional Review Board Statement

This survey followed the Self-Assessment and Governance in Ethics guidelines of the University of Surrey, UK. Only anonymous data have been collected through this survey, so no personal data regulation (e.g., GDPR) is applicable as assessed by the University of Udine.

Informed Consent Statement

Informed consent was obtained from all subjects who completed this survey.

Data Availability Statement

Survey data are available upon request according to the WISE-ACT IPR. They will be made available as Open Data after the completion of WISE-ACT via https://www.wise-act.eu.

Acknowledgments

The authors would like to thank all survey respondents and organisations who assisted with distributing the WISE-ACT survey.

Conflicts of Interest

The authors declare no conflict of interest.

References

  1. Nikitas, A.; Michalakopoulou, K.; Njoya, E.T.; Karampatzakis, D. Artificial intelligence, transport and the smart city: Definitions and dimensions of a new mobility era. Sustainability 2020, 12, 2789. [Google Scholar] [CrossRef] [Green Version]
  2. Fagnant, D.J.; Kockelman, K. Preparing a nation for autonomous vehicles: Opportunities, barriers and policy recommendations. Transp. Res. Part A Policy Pract. 2015, 77, 167–181. [Google Scholar] [CrossRef]
  3. Abir, A.; Burris, M.W.; Spiegelman, C. The Value of Travel Time and Reliability: Empirical Evidence from Katy Freeway. Transp. Res. Rec. J. Transp. Res. Board 2017, 2606, 71–78. [Google Scholar] [CrossRef]
  4. Milakis, D.; Van Arem, B.; Van Wee, B. Policy and society related implications of automated driving: A review of literature and directions for future research. J. Intell. Transp. Syst. Technol. Plan. Oper. 2017, 21, 324–348. [Google Scholar] [CrossRef]
  5. Megens, I.C.H.M. Vehicle Users’ Preferences Concerning Automated Driving Implications for Transportation and Market Planning. Master’s Thesis, Eindhoven University of Technology, Eindhoven, The Netherlands, 31 August 2014. [Google Scholar]
  6. Gandia, R.M.; Antonialli, F.; Cavazza, B.H.; Neto, A.M.; Lima, D.A.D.; Sugano, J.Y.; Nicolai, I.; Zambalde, A.L. Autonomous vehicles: Scientometric and bibliometric review. Transp. Rev. 2019, 39, 9–28. [Google Scholar] [CrossRef]
  7. Cavazza, B.H.; Gandia, R.M.; Antonialli, F.; Zambalde, A.L.; Nicolaï, I.; Sugano, J.Y.; Neto, A.D.M. Management and business of autonomous vehicles: A systematic integrative bibliographic review. Int. J. Automot. Technol. Manag. 2019, 19, 31–54. [Google Scholar] [CrossRef]
  8. Harb, M.; Stathopoulos, A.; Shiftan, Y.; Walker, J.L. What do we (Not) know about our future with automated vehicles? Transp. Res. Part C Emerg. Technol. 2021, 123, 102948. [Google Scholar] [CrossRef]
  9. Milakis, D. Long-term implications of automated vehicles: An introduction. Transp. Rev. 2019, 1–8. [Google Scholar] [CrossRef]
  10. Tsouros, I.; Polydoropoulou, A. Who will buy alternative fueled or automated vehicles: A modular, behavioral modeling approach. Transp. Res. Part A Policy Pract. 2020, 132, 214–225. [Google Scholar] [CrossRef]
  11. Potoglou, D.; Whittle, C.; Tsouros, I.; Whitmarsh, L. Consumer intentions for alternative fuelled and autonomous vehicles: A segmentation analysis across six countries. Transp. Res. Part D Transp. Environ. 2020, 79, 102243. [Google Scholar] [CrossRef]
  12. Kyriakidis, M.; Happee, R.; de Winter, J.C. Public opinion on automated driving: Results of an international questionnaire among 5000 respondents. Transp. Res. Part F Traffic Psychol. Behav. 2015, 32, 127–140. [Google Scholar] [CrossRef]
  13. Stayton, E.; Stilgoe, J. It’s time to rethink levels of automation for self-driving vehicles. IEEE Technol. Soc. Mag. 2020, 39, 13–19. [Google Scholar] [CrossRef]
  14. Hopkins, D.; Schwanen, T. Talking about automated vehicles: What do levels of automation do? Technol. Soc. 2021, 64, 101488. [Google Scholar] [CrossRef]
  15. Milakis, D.; Kroesen, M.; van Wee, B. Implications of automated vehicles for accessibility and location choices: Evidence from an expert-based experiment. J. Transp. Geogr. 2018, 68, 142–148. [Google Scholar] [CrossRef]
  16. Wu, J.; Xu, H.; Zheng, J.; Zhao, J. Automatic Vehicle Detection with Roadside LiDAR Data Under Rainy and Snowy Conditions. IEEE Intell. Transp. Syst. Mag. 2021, 13, 197–209. [Google Scholar] [CrossRef]
  17. Lu, W.; Han, L.D. Impacts of vehicular communication networks on traffic dynamics and fuel efficiency. In ICT for Transport; Edward Elgar Publishing: Cheltenham, UK, 2015. [Google Scholar]
  18. Hartmann, M.; Motamedidehkordi, N.; Krause, S.; Hoffmann, S.; Vortisch, P.; Busch, F. Impact of automated vehicles on capacity of the German freeway network. In Proceedings of the ITS World Congress, Montreal, QC, Canada, 29 October–2 November 2017. [Google Scholar]
  19. Narayanan, S.; Chaniotakis, E.; Antoniou, C. Factors affecting traffic flow efficiency implications of connected and autonomous vehicles: A review and policy recommendations. Adv. Transp. Policy Plan. 2020, 5, 1–50. [Google Scholar]
  20. Le Vine, S.; Zolfaghari, A.; Polak, J. Autonomous cars: The tension between occupant experience and intersection capacity. Transp. Res. Part C Emerg. Technol. 2015, 52, 1–14. [Google Scholar] [CrossRef]
  21. Li, W.; Tan, L.; Lin, C. Modeling driver behavior in the dilemma zone based on stochastic model predictive control. PLoS ONE 2021, 16, e0247453. [Google Scholar]
  22. Becker, H. Verkehrsplanung für das Zeitalter des Autonomen Fahrens. In Generalversammlung des Verbandes Öffentlicher Verkehr (GV VöV 2016); Verband öffentlicher Verkehr (VöV): Bern, Switzerland, 2016. [Google Scholar]
  23. Manser, P.; Becker, H.; Hörl, S.; Axhausen, K.W. Designing a large-scale public transport network using agent-based microsimulation. Transp. Res. Part A Policy Pract. 2020, 137, 1–15. [Google Scholar] [CrossRef]
  24. Becker, F.; Bösch, P.M.; Ciari, F.; Axhausen, K.W. Entwicklung konsistenter Szenarien für die Einführung autonomer Fahrzeuge. Arbeitsberichte Verk. Raumplan. 2016, 1168. [Google Scholar] [CrossRef]
  25. Schoettle, B.; Sivak, M. Public Opinion about Self-Driving Vehicles in China, India, Japan, the US, the UK, and Australia; University of Michigan, Transportation Research Institute: Ann Arbor, MI, USA, 2014. [Google Scholar]
  26. Elvarsson, A.B.; Martani, C.; Adey, B.T. Considering automated vehicle deployment uncertainty in the design of optimal parking garages using real options. J. Build. Eng. 2020, 34, 101703. [Google Scholar] [CrossRef]
  27. Meyer, J.; Becker, H.; Bösch, P.M.; Axhausen, K.W. Impact of autonomous vehicles on the accessibility in Switzerland. Res. Transp. Econ. 2017, 62, 80–91. [Google Scholar] [CrossRef] [Green Version]
  28. Acheampong, R.A.; Cugurullo, F. Capturing the behavioural determinants behind the adoption of autonomous vehicles: Conceptual frameworks and measurement models to predict public transport, sharing and ownership trends of self-driving cars. Transp. Res. Part F Traffic Psychol. Behav. 2019, 62, 349–375. [Google Scholar] [CrossRef] [Green Version]
  29. Rode, P.; Floater, G.; Thomopoulos, N.; Docherty, J.; Schwinger, P.; Mahendra, A.; Fang, W. Accessibility in cities: Transport and urban form. In Disrupting Mobility; Springer: Berlin/Heidelberg, Germany, 2017; pp. 239–273. [Google Scholar]
  30. Polydoropoulou, A.; Pagoni, I.; Tsirimpa, A.; Roumboutsos, A.; Kamargianni, M.; Tsouros, I. Prototype business models for Mobility-as-a-Service. Transp. Res. Part A Policy Pract. 2020, 131, 149–162. [Google Scholar] [CrossRef]
  31. Polydoropoulou, A.; Tsouros, I.; Pagoni, I.; Tsirimpa, A. Exploring individual preferences and willingness to pay for mobility as a service. Transp. Res. Rec. 2020, 2674, 152–164. [Google Scholar] [CrossRef]
  32. Boesch, P.M.; Ciari, F.; Axhausen, K.W. Autonomous vehicle fleet sizes required to serve different levels of demand. Transp. Res. Rec. 2016, 2542, 111–119. [Google Scholar] [CrossRef] [Green Version]
  33. CIVITAS WIKI Consortium. Gender Equality and Mobility: Mind the Gap; CIVITAS: Brussels, Belgium, 2020. [Google Scholar]
  34. ITF. Transport Innovation for Sustainable Development: A Gender Perspective; OECD Publishing: Paris, France, 2021.
  35. Clayton, W.; Paddeu, D.; Parkhurst, G.; Parkin, J. Autonomous vehicles: Who will use them, and will they share? Transp. Plan. Technol. 2020, 43, 343–364. [Google Scholar] [CrossRef]
  36. Paddeu, D.; Shergold, I.; Parkhurst, G. The social perspective on policy towards local shared autonomous vehicle services (LSAVS). Transp. Policy 2020, 98, 116–126. [Google Scholar] [CrossRef]
  37. Paddeu, D.; Tsouros, I.; Parkhurst, G.; Polydoropoulou, A.; Shergold, I. A study of users’ preferences after a brief exposure in a Shared Autonomous Vehicle (SAV). Transp. Res. Procedia 2021, 52, 533–540. [Google Scholar] [CrossRef]
  38. Zegras, P.C.; Butts, K.; Cadena, A.; Palencia, D. Spatiotemporal dynamics in public transport personal security perceptions: Digital evidence from Mexico City’s periphery. In ICT for Transport; Edward Elgar Publishing: Cheltenham, UK, 2015. [Google Scholar]
  39. Parkhurst, G.; Seedhouse, A. Will the ‘smart mobility’revolution matter? In Transport Matters: Why Transport Matters and How We Can Make It Better; Policy Press: Bristol, UK, 2019; pp. 349–380. [Google Scholar]
  40. Gkartzonikas, C.; Gkritza, K. What have we learned? A review of stated preference and choice studies on autonomous vehicles. Transp. Res. Part C Emerg. Technol. 2019, 98, 323–337. [Google Scholar] [CrossRef]
  41. Panagiotopoulos, I.; Dimitrakopoulos, G. An empirical investigation on consumers’ intentions towards autonomous driving. Transp. Res. Part C Emerg. Technol. 2018, 95, 773–784. [Google Scholar] [CrossRef]
  42. Thomopoulos, N.; Cohen, S.; Hopkins, D.; Siegel, L.; Kimber, S. All work and no play? Autonomous vehicles and non-commuting journeys. Transp. Rev. 2020, 1–22. [Google Scholar] [CrossRef]
  43. Kolarova, V.; Steck, F.; Bahamonde-Birke, F.J. Assessing the effect of autonomous driving on value of travel time savings: A comparison between current and future preferences. Transp. Res. Part A Policy Pract. 2019, 129, 155–169. [Google Scholar] [CrossRef]
  44. Saeed, T.U.; Burris, M.W.; Labi, S.; Sinha, K.C. An empirical discourse on forecasting the use of autonomous vehicles using consumers’ preferences. Technol. Forecast. Soc. Chang. 2020, 158, 120130. [Google Scholar] [CrossRef]
  45. Lavieri, P.S.; Bhat, C.R. Modeling individuals’ willingness to share trips with strangers in an autonomous vehicle future. Transp. Res. Part A Policy Pract. 2019, 124, 242–261. [Google Scholar] [CrossRef]
  46. Webb, J.; Wilson, C.; Kularatne, T. Will people accept shared autonomous electric vehicles? A survey before and after receipt of the costs and benefits. Econ. Anal. Policy 2019, 61, 118–135. [Google Scholar] [CrossRef]
  47. Liu, J.; Kockelman, K.M.; Boesch, P.M.; Ciari, F. Tracking a system of shared autonomous vehicles across the Austin, Texas network using agent-based simulation. Transportation 2017, 44, 1261–1278. [Google Scholar] [CrossRef]
  48. Krueger, R.; Rashidi, T.H.; Rose, J.M. Preferences for shared autonomous vehicles. Transp. Res. Part C Emerg. Technol. 2016, 69, 343–355. [Google Scholar] [CrossRef]
  49. Steck, F.; Kolarova, V.; Bahamonde-Birke, F.; Trommer, S.; Lenz, B. How autonomous driving may affect the value of travel time savings for commuting. Transp. Res. Rec. 2018, 2672, 11–20. [Google Scholar] [CrossRef] [Green Version]
  50. Haboucha, C.J.; Ishaq, R.; Shiftan, Y. User preferences regarding autonomous vehicles. Transp. Res. Part C Emerg. Technol. 2017, 78, 37–49. [Google Scholar] [CrossRef]
  51. Rödel, C.; Stadler, S.; Meschtscherjakov, A.; Tscheligi, M. Towards autonomous cars: The effect of autonomy levels on acceptance and user experience. In Proceedings of the 6th International Conference on Automotive User Interfaces and Interactive Vehicular Applications, Seattle, WA, USA, 17–19 September 2014; pp. 1–8. [Google Scholar]
  52. Fitt, H.; Curl, A.; Dionisio, M.R.; Ahuriri-Driscoll, A.; Pawson, E. Considering the wellbeing implications for an ageing population of a transition to automated vehicles. Res. Transp. Bus. Manag. 2019, 30, 100382. [Google Scholar] [CrossRef]
  53. Gurumurthy, K.M.; Kockelman, K.M. Modeling Americans’ autonomous vehicle preferences: A focus on dynamic ride-sharing, privacy & long-distance mode choices. Technol. Forecast. Soc. Chang. 2020, 150, 119792. [Google Scholar]
  54. Payre, W.; Cestac, J.; Delhomme, P. Intention to use a fully automated car: Attitudes and a priori acceptability. Transp. Res. Part F Traffic Psychol. Behav. 2014, 27, 252–263. [Google Scholar] [CrossRef] [Green Version]
  55. Nazari, F.; Noruzoliaee, M.; Mohammadian, A. Shared Mobility Versus Private Car Ownership: A Multivariate Analysis of Public Interest in Autonomous Vehicles; Transportation Research Board (TRB): Washington, DC, USA, 2018; p. 7. [Google Scholar]
  56. Laidlaw, K. What’s Steering Consumer Preferences for Autonomous Vehicles in the Greater Toronto and Hamilton Area? Ryerson University: Toronto, ON, Canada, 2017. [Google Scholar]
  57. Menon, N.; Barbour, N.; Zhang, Y.; Pinjari, A.R.; Mannering, F. Shared autonomous vehicles and their potential impacts on household vehicle ownership: An exploratory empirical assessment. Int. J. Sustain. Transp. 2019, 13, 111–122. [Google Scholar] [CrossRef]
  58. Kyriakidis, M.; Sodnik, J.; Stojmenova, K.; Elvarsson, A.B.; Pronello, C.; Thomopoulos, N. The Role of Human Operators in Safety Perception of AV Deployment—Insights from a Large European Survey. Sustainability 2020, 12, 9166. [Google Scholar] [CrossRef]
  59. Hohenberger, C.; Spörrle, M.; Welpe, I.M. How and why do men and women differ in their willingness to use automated cars? The influence of emotions across different age groups. Transp. Res. Part A Policy Pract. 2016, 94, 374–385. [Google Scholar] [CrossRef]
  60. Schoettle, B.; Sivak, M. Motorists’ Preferences for Different Levels of Vehicle Automation; University of Michigan, Transportation Research Institute: Ann Arbor, MI, USA, 2015. [Google Scholar]
  61. Bansal, P.; Kockelman, K.M.; Singh, A. Assessing public opinions of and interest in new vehicle technologies: An Austin perspective. Transp. Res. Part C Emerg. Technol. 2016, 67, 1–14. [Google Scholar] [CrossRef]
  62. Moreno, A.T.; Michalski, A.; Llorca, C.; Moeckel, R. Shared autonomous vehicles effect on vehicle-km traveled and average trip duration. J. Adv. Transp. 2018, 2018, 8969353. [Google Scholar] [CrossRef] [Green Version]
  63. Khoeini, S.; Pendyala, R.M.; da Silva, D.C.; Lee, Y.; Dias, F.; Salon, D.; Circella, G.; Maness, M. Attitudes towards Emerging Mobility Options and Technologies–Phase 1: Survey Design; TOMNET UTC: Tempe, AZ, USA, 2018.
  64. Available online: https://www.londonreconnections.com/2019/mind-the-gender-gap-the-hidden-data-gap-in-transport/ (accessed on 17 April 2021).
  65. Etzioni, S.; Hamadneh, J.; Elvarsson, A.B.; Esztergár-Kiss, D.; Djukanovic, M.; Neophytou, S.N.; Sodnik, J.; Polydoropoulou, A.; Tsouros, I.; Pronello, C.; et al. Modeling cross-national differences in automated vehicle acceptance. Sustainability 2020, 12, 9765. [Google Scholar] [CrossRef]
  66. Train, K.E. Discrete Choice Methods with Simulation; Cambridge University Press: Cambridge, UK, 2009. [Google Scholar]
  67. Hensher, D.A.; Rose, J.M.; Greene, W.H. Applied Choice Analysis: A Primer; Cambridge University Press: Cambridge, UK, 2005. [Google Scholar]
  68. Hess, S.; Palma, D. Apollo: A flexible, powerful and customisable freeware package for choice model estimation and application. J. Choice Model. 2019, 32, 100170. [Google Scholar] [CrossRef]
  69. UK Department for Transport. GB Driving Licence Data. 2021. Available online: https://data.gov.uk/dataset/d0be1ed2-9907-4ec4-b552-c048f6aec16a/gb-driving-licence-data (accessed on 15 March 2021).
  70. Available online: https://www.ynetnews.com/articles/0,7340,L-4353214,00.html (accessed on 15 March 2021).
  71. Eurostat. Median Age over 43 Years in the EU. 2019. Available online: https://ec.europa.eu/eurostat/web/products-eurostat-news/-/DDN-20191105-1 (accessed on 15 March 2021).
  72. Worldometers.info. 2021. Available online: https://www.worldometers.info/world-population/israel-population/#:~:text=The%20median%20age%20in%20Israel%20is%2030.5%20years (accessed on 15 March 2021).
  73. Eurostat. Ageing Europe—Statistics on Working and Moving into Retirement. 2020. Available online: https://ec.europa.eu/eurostat/statistics-explained/index.php?title=Ageing_Europe_-_statistics_on_working_and_moving_into_retirement#Employment_patterns_among_older_people (accessed on 15 March 2021).
  74. The Guardian. European Commuters Still Choose Cars and Congestion over Public Transport. 2020. Available online: https://www.theguardian.com/world/2020/mar/03/european-commuters-still-prefer-cars-to-public-transport (accessed on 15 March 2021).
Figure 1. SP experiment sample scenario.
Sustainability 13 04769 g001
Figure 2. Modelling framework.
Sustainability 13 04769 g002
Figure 3. Sample characteristics—gender.
Sustainability 13 04769 g003
Figure 4. Sample characteristics—mean household size and mean number of cars in it.
Sustainability 13 04769 g004
Figure 5. Sample characteristics—highest level of education.
Sustainability 13 04769 g005
Figure 6. Sample characteristics—employment status.
Sustainability 13 04769 g006
Figure 7. Sample characteristics—travel mode of the main trip.
Sustainability 13 04769 g007
Figure 8. Sample characteristics—main trip purpose.
Sustainability 13 04769 g008
Figure 9. Willingness to share, or not, an AV in the different countries, according to the number of copassengers and their gender.
Sustainability 13 04769 g009
Table 1. Number of responses per country.
ResponsesCyprusGreeceHungaryIsraelIcelandFinlandUKTotal
Total257232658111910681711783683
Utilised in the analysis171130321611535100941772
Table 2. Sample statistics—age.
CYELHUILICFIUK
MEAN AGE3839.8652.4239.947.346.944.51
Table 3. Sample statistics—car ownership.
CYELHUILICFIUK
MEAN CAR OWNERSHIP99.4%90.6%92.7%66.7%95.9%94.5%76.8%
Table 4. Model estimation results. ***: p < 0.001, **: p < 0.01, *: p < 0.05
Northern ClusterSouthern Cluster
FIICUKCYELHUIL
ASC_AV (Mean)−4.174 ***−1.542 **−0.265−0.0510−0.511−0.279−1.678 **
ASC_SAV (Mean)1.7010.6703.831 **−0.3580.2601.8371.833 **
ASC_AV (SD)2.430 ***3.111 ***2.527 ***2.906 ***3.596 ***3.017 ***3.155 ***
ASC_SAV (SD)3.455 ***4.032 ***3.448 ***3.418 ***3.349 ***4.445 ***3.860 ***
Travel Time: SAV−0.202 ***−0.193 ***−0.134 ***−0.115 ***−0.140 ***−0.0522 ***−0.180 ***
Travel Time: AV−0.140 ***−0.0791 ***−0.0994 ***−0.102 ***−0.158 ***−0.0441 ***−0.129 ***
Travel Time: Car−0.196 ***−0.115 ***−0.143 ***−0.0859 ***−0.110 ***−0.0398 ***−0.146 ***
Travel Cost: SAV−0.211 ***−0.167 ***−0.270 ***−0.181 ***−0.216 ***−0.134 ***−0.187 ***
Travel Cost: AV−0.249 ***−0.273 ***−0.276 ***−0.225 ***−0.0930−0.139 ***−0.212 ***
Travel Cost: Car−0.173 ***−0.255 ***−0.240 ***−0.205 ***−0.155 ***−0.134 ***−0.197 ***
Age (Specific to AV)0.0573 **−0.0363 ***−0.03040.0339−0.0513−0.0284 *−0.0361 ***
Age (Specific to SAV)0.000836−0.0308 *−0.0676 **0.0699 ***−0.0575−0.0334 *−0.0276 *
Family Vehicle Availability index)#of cars/#of family members) (Interacted with AV−0.0241−0.185−1.792−0.04150.3780.2110.204
Family Vehicle Availability index) #of cars/#of family members) (Interacted with SAV0.0521−0.527−0.0773−1.804 ***−1.064−1.240 *−1.776 ***
Main commute mode: private car (Specific to AV)4.313 ***2.384 ***2.7512.121 ***−0.3531.767 **2.093 ***
Main commute mode: public transport (Specific to SAV)−1.0961.894 *−3.759 ***−0.3302.054 **0.5931.540 *
Main commute mode: private car (Specific to CAR)3.794 ***1.308 ***3.203 **4.037 ***−1.0231.912 ***1.185 **
Main commute mode: public transport (Specific to AV)2.665 **0.995−0.3342.167−2.0770.6841.146*
Passengers in SAV (just me is base)MFMFMFMFMFMFMF
Passengers in SAV: One man−0.547−2.477 *−0.103−0.714 *−0.8410.142−0.0162−0.6940.2081.123−1.053 ***0.605−1.320 ***−0.227
Passengers in SAV: One woman0.0538−2.838−0.0620−0.4311.615−3.170 *1.450 ***−0.8970.124−1.7080.583−1.585 *0.197−0.119
Passengers in SAV: Two women−0.742−0.280−1.951 ***−1.011−0.1532.171 **0.902 *−0.4051.058 **−0.1250.672 **−0.8150.2620.157
Passengers in SAV: Two men0.111−0.2560.3230.154−0.258−1.901 **0.734−1.0210.2410.209−0.599−2.119 ***−0.319−0.000280
Passengers in SAV: Mixed genders−1.462 **1.396−0.08490.0337−0.04400.4710.632−1.1510.145−0.4250.473 *0.178−1.574 ***−0.323
SP Observations (Respondents)600 (100)3210 (535)564 (94)1026 (171)780 (130)3666 (611)1926 (321)
Final LL−377.6−2122−323.2−698.6−540.2−2273−1352
Table 5. Values of time (€/hour).
CY EL HU IL IC FI UK
VoT SAV 38.12 38.89 23.28 57.75 69.34 57.44 29.78
VoT AV 27.20 ---18.99 36.51 17.38 33.73 21.52
VoT CAR 24.88 42.58 17.46 44.47 27.06 67.98 35.75
Publisher’s Note: MDPI stays neutral with regard to jurisdictional claims in published maps and institutional affiliations.

