Article

Spatial and Temporal Distribution of Elderly Public Transport Mode Preference

1
Civil and Infrastructure Engineering Discipline, RMIT University, Melbourne, VIC 3001, Australia
2
School of Global, Urban and Social Studies, RMIT University, Melbourne, VIC 3001, Australia
*
Author to whom correspondence should be addressed.
Sustainability 2021, 13(9), 4752; https://doi.org/10.3390/su13094752
Submission received: 17 March 2021 / Revised: 19 April 2021 / Accepted: 20 April 2021 / Published: 23 April 2021
(This article belongs to the Collection Sustainable Transport Economics, Behaviour and Policy)

Abstract

:
The elderly population is increasing rapidly. Understanding travel behaviour for this group of commuters (in terms of the trip purpose and travel time) is necessary for future transport planning. Many researchers are working on travel’s spatial and temporal analysis to provide operational decision making and transport network planning. This research study’s primary purpose is to identify the influence of trip duration (using public transport), time of the day (usage of public transport), and public transport (PT) accessibility over public transport mode preference by elderly (over 65 years of age) commuters. The methodology of this study is divided into two parts as spatial analysis and temporal analysis. The research identified the dependency of trip duration, time of the day, geographical areas, and PT access over transport mode preference of elderly. The temporal study shows that transport mode preference can vary depending on trip purposes. However, for specific trip durations and times of the day, the elderly sometimes choose PT as a mobility mode. For instance, on shopping trips between 10:00 and 11:00 a.m., the elderly have a greater possibility of choosing public transport over private vehicles. Moreover, the results show the public transport mode preference based on different times of the day and trip purposes. Urban and transport planner can use the results to modify/plan public transport schedule, which can be easily accessible by the elderly population.

1. Introduction

The elderly population is increasing rapidly. Around 8.5 percent of the total population is aged 65 and over worldwide. The number of the elderly population is expected to double again by 2050 (projected to reach nearly 2.1 billion). [1]. Ageing can face different challenges in mobility and transport. Mobility and transport play an essential role in urban development [2]. In general, the elderly in this generation is more active than the previous generation of the elderly. Public transport (PT) can play a significant role in mobility, while their driving skills are decreased [3]. Proper distribution of various transportation modes increases urban life quality [4]. An accessible, reliable, and affordable public transport maintains urban growth [5]. Easy access to the transport system helps the elderly access goods, services, and other targeted facilities without much hassle. The public transport demand and usage towards different destinations are influenced by travel time and location [6]. Understanding the trip duration and the distance between trip origin and destination is essential to plan for the future transport network [7]. Spatial-temporal analysis of travels provides information for operational decision making and network planning [8]. Spatial analysis is necessary to understand the relation between transport demand and availability. In the last few decades, spatial–temporal data analysis with a geographical information system becomes popular to understand transport access graphically [9,10]. Spatial analysis of travels can identify transport systems’ performance in urban areas [11]. Space–time travel patterns may depend on individual commuters’ travel behaviour, including social, economic, and household specification backgrounds [4,12]. Many researchers are working on other adults’ travel behaviour. Older commuters’ travel behaviour is different from other adults [13]. The reason might be they lead a different life schedule than other working adults. For example, the elderly generally travel off-peak hours (apart from busy travel time), walking speed is slower, need assistance, limited mobility, and avoid travel mode change. For this reason, the elderly travel-related study needs to be separated [14]. Many previous studies on elderly transport focused on urban growth and public transport access [15,16,17,18,19,20,21]. There is a research gap for identifying elderly transport demand and supply. Limited studies have focused on elderly transport mode choice preference based on travel duration and time of travel.
In this research, Melbourne, Australia, is considered a case study. Transport infrastructure is developing rapidly in the Melbourne metropolitan area. The urban growth of Melbourne is increasing with the expansion of the public transport network. This paper aims to present a spatial–temporal analysis of the observed elderly public transport mode preference (private transport vs. public transport) based on travels time (using a PT mode) and PT availability. This study analyses the spatial–temporal relationship between urban public transport (bus/tram and train) availability, travel duration, time of the day, trip purposes, PT coverage, and transport mode preferences for the elderly. According to the Australian Parliamentary document, people aged 65 are considered elderly [22]. The study uses the elderly travel datasets to observe the elderly trip patterns. The study uses a geographic information system software (ArcMap) and statistical software package (SPSS) to analyse travel behaviour. Spatial hotspot analysis and bivariate correlation method are applied to observe the elderly travel behaviour influence. Hence, the objectives of this study are to answer the following questions.
  • Is there any spatial dependency between elderly travel time duration and choice of transport mode?
  • What times during the day are the elderly choosing PT over private transport?
  • Do the trip hotspots vary during the weekdays and weekend?
This paper is structured as follows: The following section summarises previous research related to transport and spatial–temporal analysis. Section 3 describes the study area and the data set used in this study. Section 4 introduces the bivariate correlation and hotspot analysis methodology. Section 5 continues with the results and discussion. Section 6 points out the conclusions with directions for future research.

2. Literature Review

With the increase of the older population, “active ageing” is being discussed by many researchers. Active ageing studies widely address the issues that the elderly face in everyday social life [23,24,25]. Elderly faces loneliness and social isolation. Several studies recommended regular out-of-home travel to engage with friends and the broader community to counteract social isolation for the elderly. One of the significant issues that the elderly face is the transport problem. Elderly mobility decreases with the decrease in their physical strengths and the changes in their driving capability. Thus, public transport becomes one of the critical modes of transportation. The elderly generally travel a short distance with less travel frequency than the younger adults [26,27,28,29]. The elderly mostly travel during a midday peak and daylight hours. Most older people make their trips between 9:30 a.m. and 3 p.m. [15].
Numerous studies have focused on elderly travel behaviour in comparison with younger adults. A study by Pettersson and Schmöcker [15] indicates that the elderly spend more time in recreational activities such as shopping and leisure than other younger adults. This study mentioned that elderly travel is influenced by individual, household, and neighbourhood characteristics. Moreover, several studies discussed index-based accessibility for elderly travel and trip purposes [16,17,18,19,20,21,22,23,24,25,26,27,28,29,30,31,32,33,34]. Researchers explained accessibility indices into different classes and themes [35], such as time based, or distance based. However, Handy and Niemeier [36] mentioned that the best approach in measuring accessibility does not exist. Transport accessibility measures can identify the issues to improve the overall transport system and infrastructure. The different public transport mode access level influence commuters’ travel behaviours.
Several researchers also analysed spatial–temporal patterns of elderly travel and data visualisation techniques [37,38,39,40]. These studies examined elderly trip generation, trip distance, trip length, choice of specific modes, etc. [41]. Several studies analysed elderly trip distance and travel mode choice preferences [26,42,43,44,45]. The relationship between geographic location and the time of travel or travel duration based on elderly travel purposes is not widely discussed. Some studies focused on elderly travel behaviour based on spatial characteristics [45,46]. Sylvia et al. [47] applied spatial analysis for elderly trips for work purposes. In another study, Szeto et al. [29] focused on the spatial and temporal dynamics of older people’s daily travels in Hong Kong. They identified that higher population areas have a higher trip rate. A study by He et al. [48] showed that trip departure time of the elderly is mainly distributed between morning peaks and afternoon peaks. A study by Cui et al. [18] pointed out after analysing elderly travel characteristics and the need for private vehicles in a car-dependent society. In the case of the unaffordability of private vehicles, the elderly prefer walking [49] or public transport (especially those who live nearby the public transport stop/stations) [16]. Böcker and Thorsson [50] examined that complex weather conditions are also a key factor in elderly travel behaviour. A research study by Liu et al. [51] compares the travel mode choice behaviour between young and elderly travellers specifically for train travel. A built-in environment and land-mix use are another key aspect related to elderly travel, and mode choice studies are discussed widely [52,53,54,55,56,57]. Somenahalli and Taylor [58] highlighted several factors related to elderly public transport access, especially buses. Recently, Somenahalli et al. [59] discussed the transport and mode preference of older South Australia commuters. This study examined Japan’s transport policy for the elderly which can be beneficial and applicable in Australia to ensure better mobility for the elderly. Another study by Lin et al. [60] provided a detailed spatial analysis of elderly train access based in Perth, Australia. All these studies provided essential contributions to the field and improved our understanding of the travel characteristics of the elderly. The common findings of these studies with the increase of age and private vehicle dependency increases. These studies offer suggestions for urban planners and policymakers. Most of the existing spatial–temporal studies did not discuss elderly transport mode preferences and evaluate the trip pattern (travel duration, time of travel or trip purpose). Moreover, comparing the elderly mobility on weekdays and weekends [61] is ignored. Most of the literature discussed elderly spatial–temporal travel behaviour for weekdays. This study intends to contribute to fulfilling these limitations.

3. Study Area and Data Description

As mentioned previously, metropolitan Melbourne, Australia, is considered to be the case study in this research. The elderly public transport travel data sets in the Melbourne metro area are reviewed for this study. Melbourne is the capital city of Victoria State, Australia. It is a hub for intercity, intracity, and regional travels. Melbourne is facilitated with the second-largest freeway network in Australia. Moreover, public transport is a vital part of everyday mobility in metropolitan Melbourne. Melbourne public transport system is combined with the bus, train, and tram (the world’s largest tram network). In this study, people aged 65 and over are considered elderly [62]. According to the Australian Bureau of Statistics (2016) [63], 15.8% of the total population is aged 65 and over in Victoria. In the Greater Melbourne region, people aged 65 and over are 14% of the total population. Different sets of data are used to finalise the analysis as follows.

3.1. Household Survey Data

Household survey datasets are considered for this study [64,65]. A detailed survey by the Victorian Integrated Survey of Travel and Activity (VISTA) (2016) [66] provides trajectory datasets to help government make better transport and planning decisions. VISTA data contains the trip purpose, travel duration, trip time of the day, transport mode, and trip information during weekdays/weekends as a temporal database. Geospatial location and statistical area are also mentioned in the spatial database. Randomly selected households are asked to complete the VISTA travel diary for a single specified day. Around 46,563 travel responses for weekdays and weekends are documented in Melbourne and Geelong (Geelong is another major city in Victoria). Among these 46,563 responses, 7029 responses are from the elderly population. The travel mode for most of the elderly is not documented in detail. The reason might be that, sometimes, senior people are more sensitive to sharing information. Datasets are analysed using statistical software SPSS. According to VISTA data (2016), 83% of Melbourne elderly prefer private transport, primarily drivers. The rest (around 14.3%) of Melbourne elderly use public transport mode, including trains, trams, or public buses.

3.2. Trip Characteristics

Many trip influential datasets are analysed for this research study. The datasets examined as follows:
  • Trip Purpose
Trip purposes are generally categorised as shopping, health care centres, recreation, education, work, personal business, etc. For this study, the three mostly travelled trip purposes travelled by the elderly, including shopping, education pick up/drop off, and recreation, are considered. Trip purpose data is separated from VISTA using statistical software SPSS. VISTA datasets contain information regarding the total number of trips towards each destination.
  • Trip time of the day
The day’s trip time (separated from VISTA data) represents whether the travel is on weekdays or weekends. For each day of the week, the trip is distributed according to 24 h. The trip time of the day is analysed for three destinations and transport mode in this research.
  • Trip duration
A detail of trip duration is analysed from the VISTA database. The trip duration mentions the trip time for a specific trip purpose using public/private/walking mode. The trip duration is categorised by min intervals, such as 0–4, 5–9, 10–14, 15–19, etc. For example, a travel duration between 0–4 min, whether the elderly is using PT or private transport towards a shopping centre, is examined.

3.3. Point of Interest (POI) and Public Transport (PT) Coverage
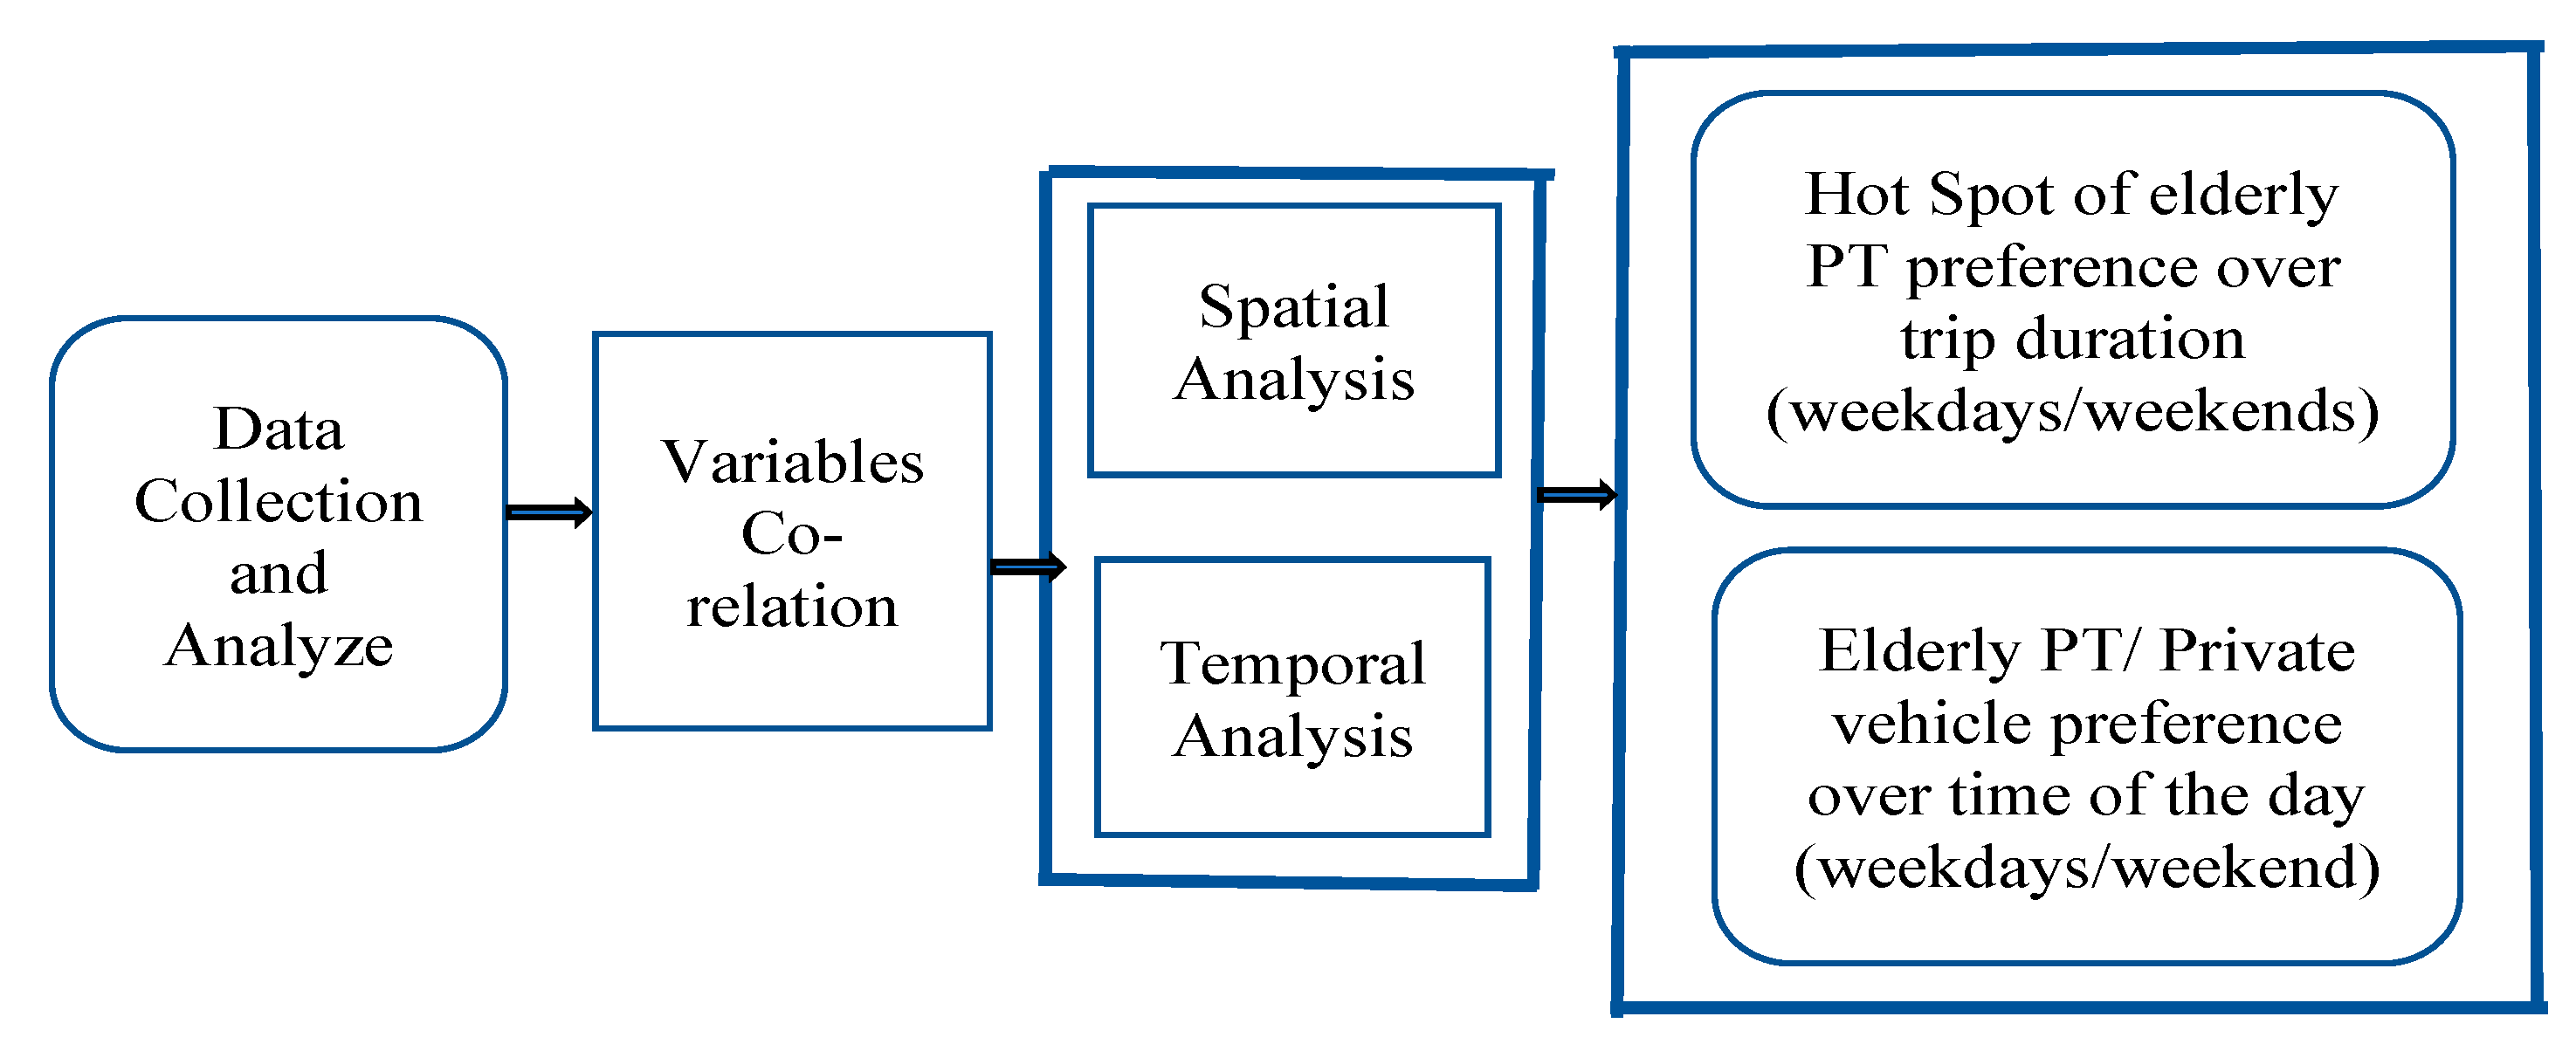
A database of POIs (2017) [67] was collected from the Australian Urban Research Infrastructure Network (AURIN). AURIN is a resource and analytical tool that provides access to different datasets with geographical location information. The geographical location information of three specific POIs, including shopping centres, education centres, and recreation centres, are separated for this study.
The public transport coverage database is collected and analysed using various government data sets and open sources. There are around 300 bus routes, 24 tram routes, and 16 metro train lines operating all through Melbourne. Figure 1 and Figure 2 shows the distribution of public transport stops/stations coverage and three major POIs within the Greater Melbourne area.
Figure 1 and Figure 2 inner Melbourne part is more accessible in terms of PT (train, tram, and bus) availability and POIs number. From Figure 1, public buses cover a large area of greater Melbourne. The tram network is mainly spread through the central business district (CBD). The train network is distributed towards inner to outer suburbs. Similarly, shopping centres are lower in quantity towards the outer Melbourne areas.

4. Methodology

The methodology for this study comprises two parts. The first part is the spatial analysis, and the second part analyses the temporal behaviour of elderly travel. Figure 3 represents the methodology flowchart for this study.
The methodology for this study comprises two parts. The first part is the spatial analysis, and the second part analyses the temporal behaviour of elderly travel. Figure 3 represents the methodology for this study. The bivariate Pearson correlation test is used to observe the linear relationship between the elderly trip duration, trip time of the day, and the number of trips for each trip. If the variables are correlated, there is a high chance they are dependent on each other. The Getis–Ord Gi hotspot analysis method identifies the relation between trip duration and elderly transport mode choice preferences.

4.1. Bivariate Pearson Correlation

The bivariate Pearson correlation presents a correlation coefficient. This coefficient measures linear relationships’ strength and direction (whether increasing or decreasing) between variables. The test expresses the linkage between variables by values between −1 and +1. A positive correlation coefficient value indicates a positive relationship between the two variables (co-related), while a negative value indicates a negative significant (not related) relationship. The bivariate Pearson correlation considers the standard deviation of variables. This method (applying statistical software SPSS) indicates the correlation between trip purpose, trip duration, and trip time of the day. For a pair of variables, the bivariate standard correlation (r) formula is present in Equation (1).
r = n (   x y ) (   x ) (   y ) [ n   x 2 (   x ) 2 ] [ n   y 2 (   y ) 2   ]
where r = bivariate Pearson coefficient, n = the sample size, x = elderly travel time of the day/Trip duration, and y = elderly travel mode preference.

4.2. Hotspot Analysis (Getis–Ord Gi* Statistic Method)

Many researchers analyse data over space and time to understand the transport supply availability and users’ behaviour. Hotspot analysis is a spatial analysis and mapping technique to identify clustering of spatial phenomena. The cluster-based classification method is an accepted method for spatial and temporal travel behaviour analysis [68]. Previous studies conducted different cluster-based methods to analyse travel behaviour and travel mode choice [69,70,71,72,73]. A hotspot can be defined as an area that has a higher cluster level of activity/access. Hotspot analysis identifies significant hotspots (higher value) and cold spots (lower value) in data. The hotspot analysis tool calculates the Getis–Ord Gi* [71,74] statistic for each variable in a dataset. The z-scores and p-values results indicate the high- or low-value clusters spatially and identify the need to accept or reject the null hypothesis. The hotspot analysis tool works by looking at each feature within the context of neighbouring elements. An element with a higher value may be a statistically significant hot spot. To be a statistically significant hot spot, a feature has a high value and is surrounded by other features with high values. For elderly travel, the day and trip duration are the critical factors for choosing a transport mode. In this research, hotspot analysis for transport mode choice is done using ArcMap statistical analysis tools. Hot Spot analysis using Getis–Ord Gi*, the statistical method, is present in Equation (2).
G i * = j = 1 n w i , j X ¯ j = 1 n w i , j [ n j = 1 n w i , j 2         ( j = 1 n w i , j ) 2 ] n 1 S
where xj is the attribute value (trip duration) for feature j (transport access towards the POIs), wi,j is the spatial weight between origin and destination; and n is the total number of samples.
X = ¯ j = 1 n x j n
S = j = 1 n x j n ( X ¯ ) 2

5. Results and Discussion

5.1. Bivariate Correlation Analysis Result

The correlation test is used for both weekdays and weekends. Table 1 shows bivariate Pearson correlation results for the trip duration, trip time, and three specific trip destinations (shopping centres, education centres, and recreation centres).
From Table 1, the significant value (Sig) is less than 0.005 for all cases, indicating that all variables are statistically significant. This table indicates positive correlations (r-value) between shopping centre trip number and trip duration. The day’s travel time also shows a positive correlation (r-value) with the shopping centre weekday and weekend trip number for the elderly. Nevertheless, for education and recreation centres, the result shows a negative correlation (r-value) for both weekday and weekend. The reason may be because, for education centres, the trip duration and trip time day are particular. Trips to education centres occur either in the morning peak or afternoon peak.
Similarly, for recreation centres, the travel patterns are not fixed. Elderly travel for recreation purposes is not specified for a limited trip duration or time of the day. Moreover, the results indicate that different trip purposes are diversely correlated according to the day’s trip duration/time.

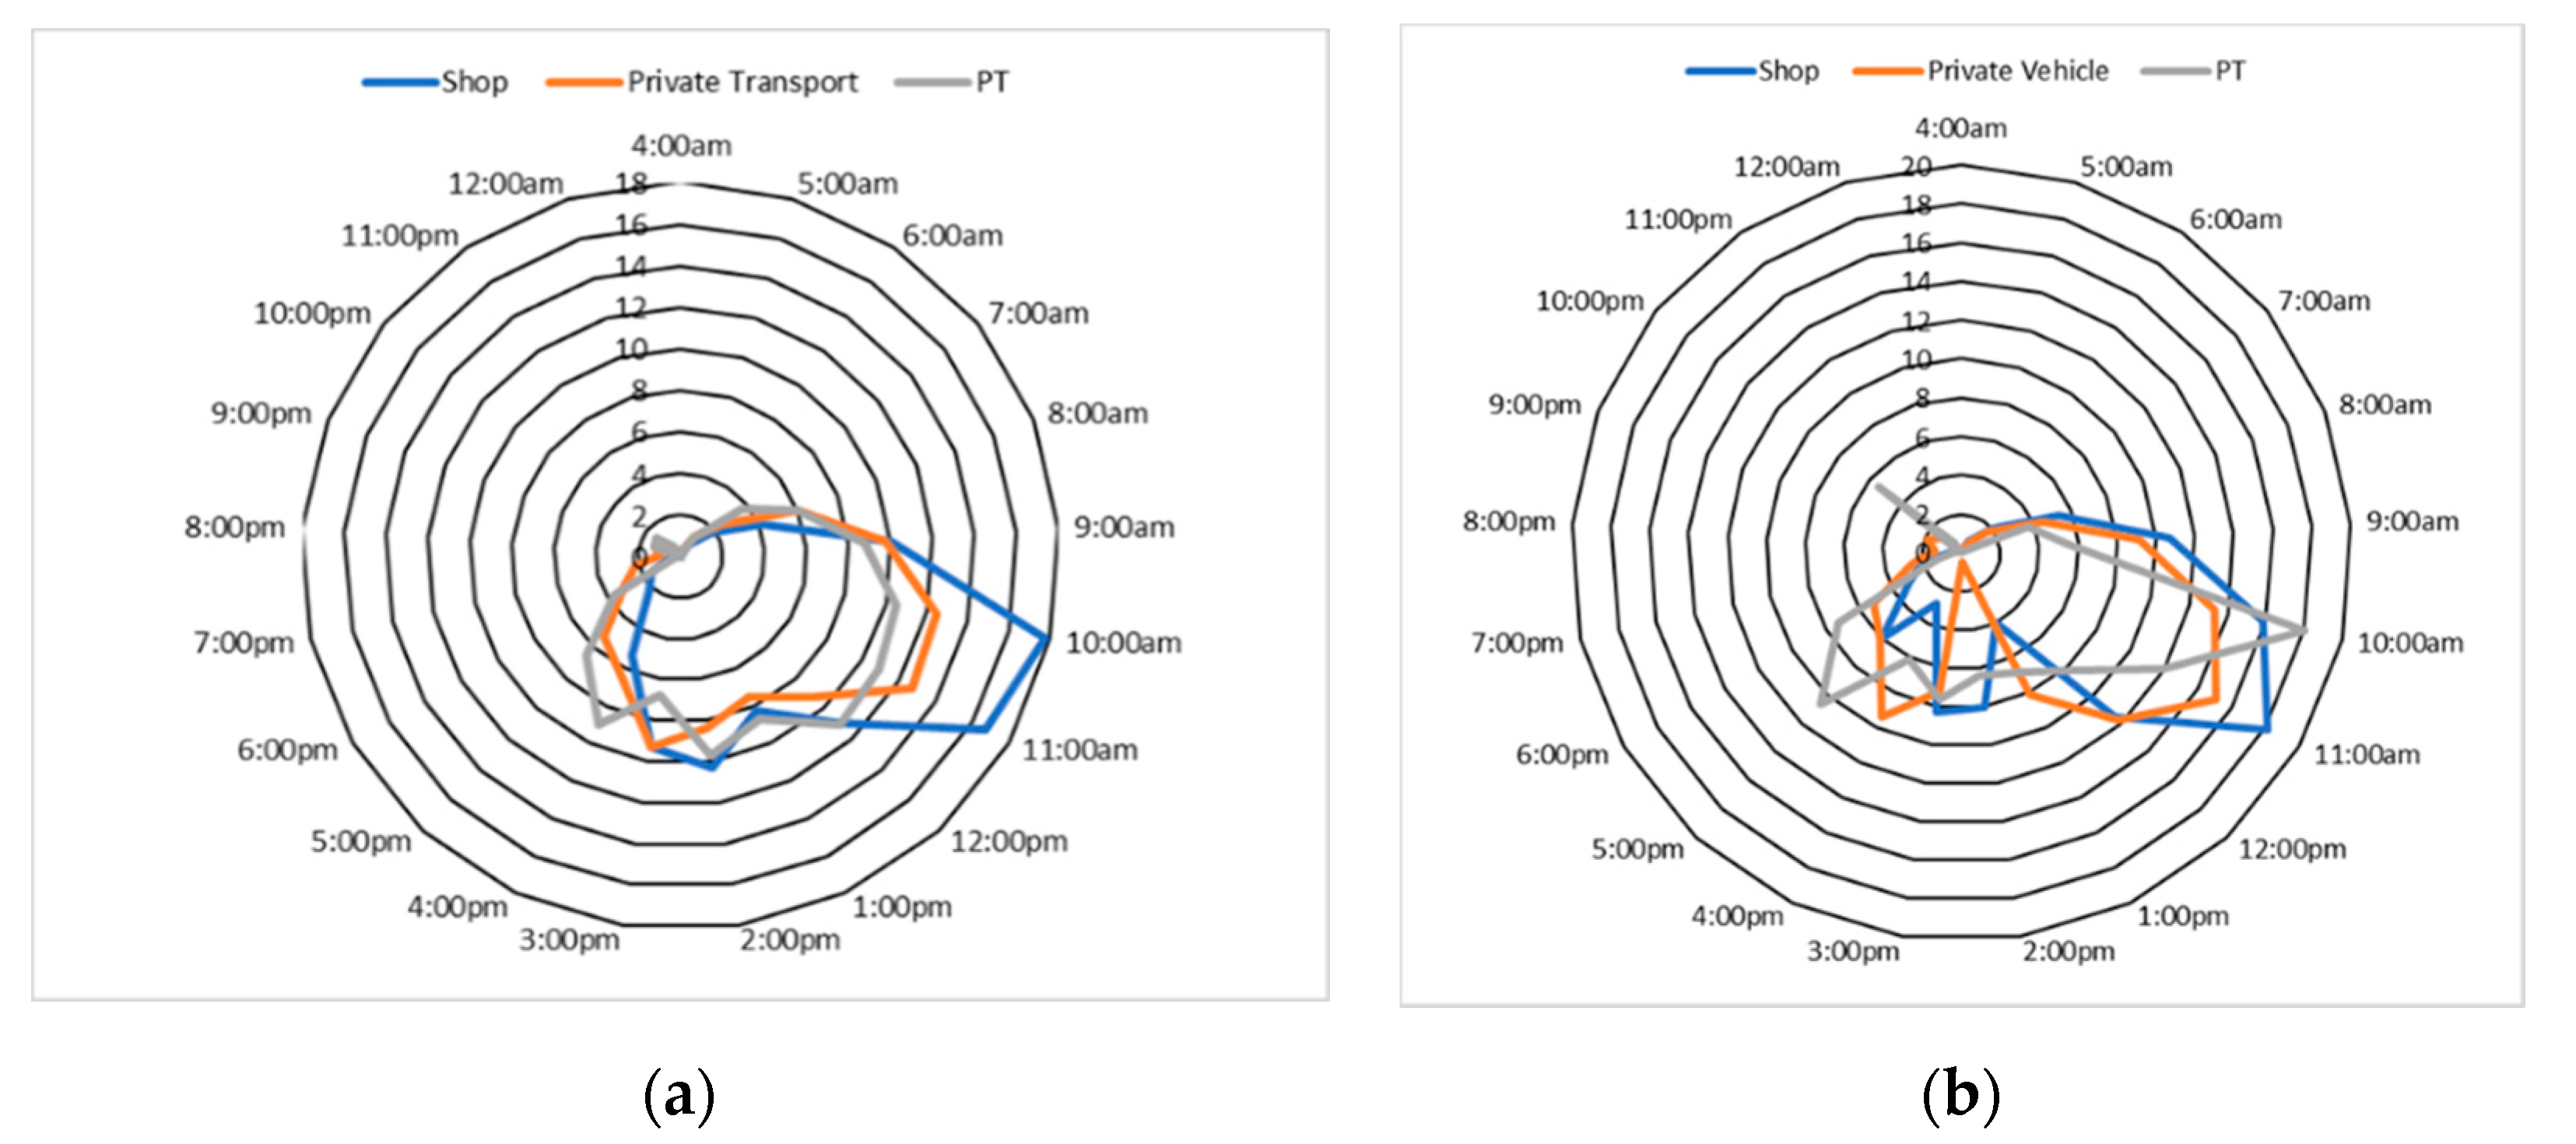
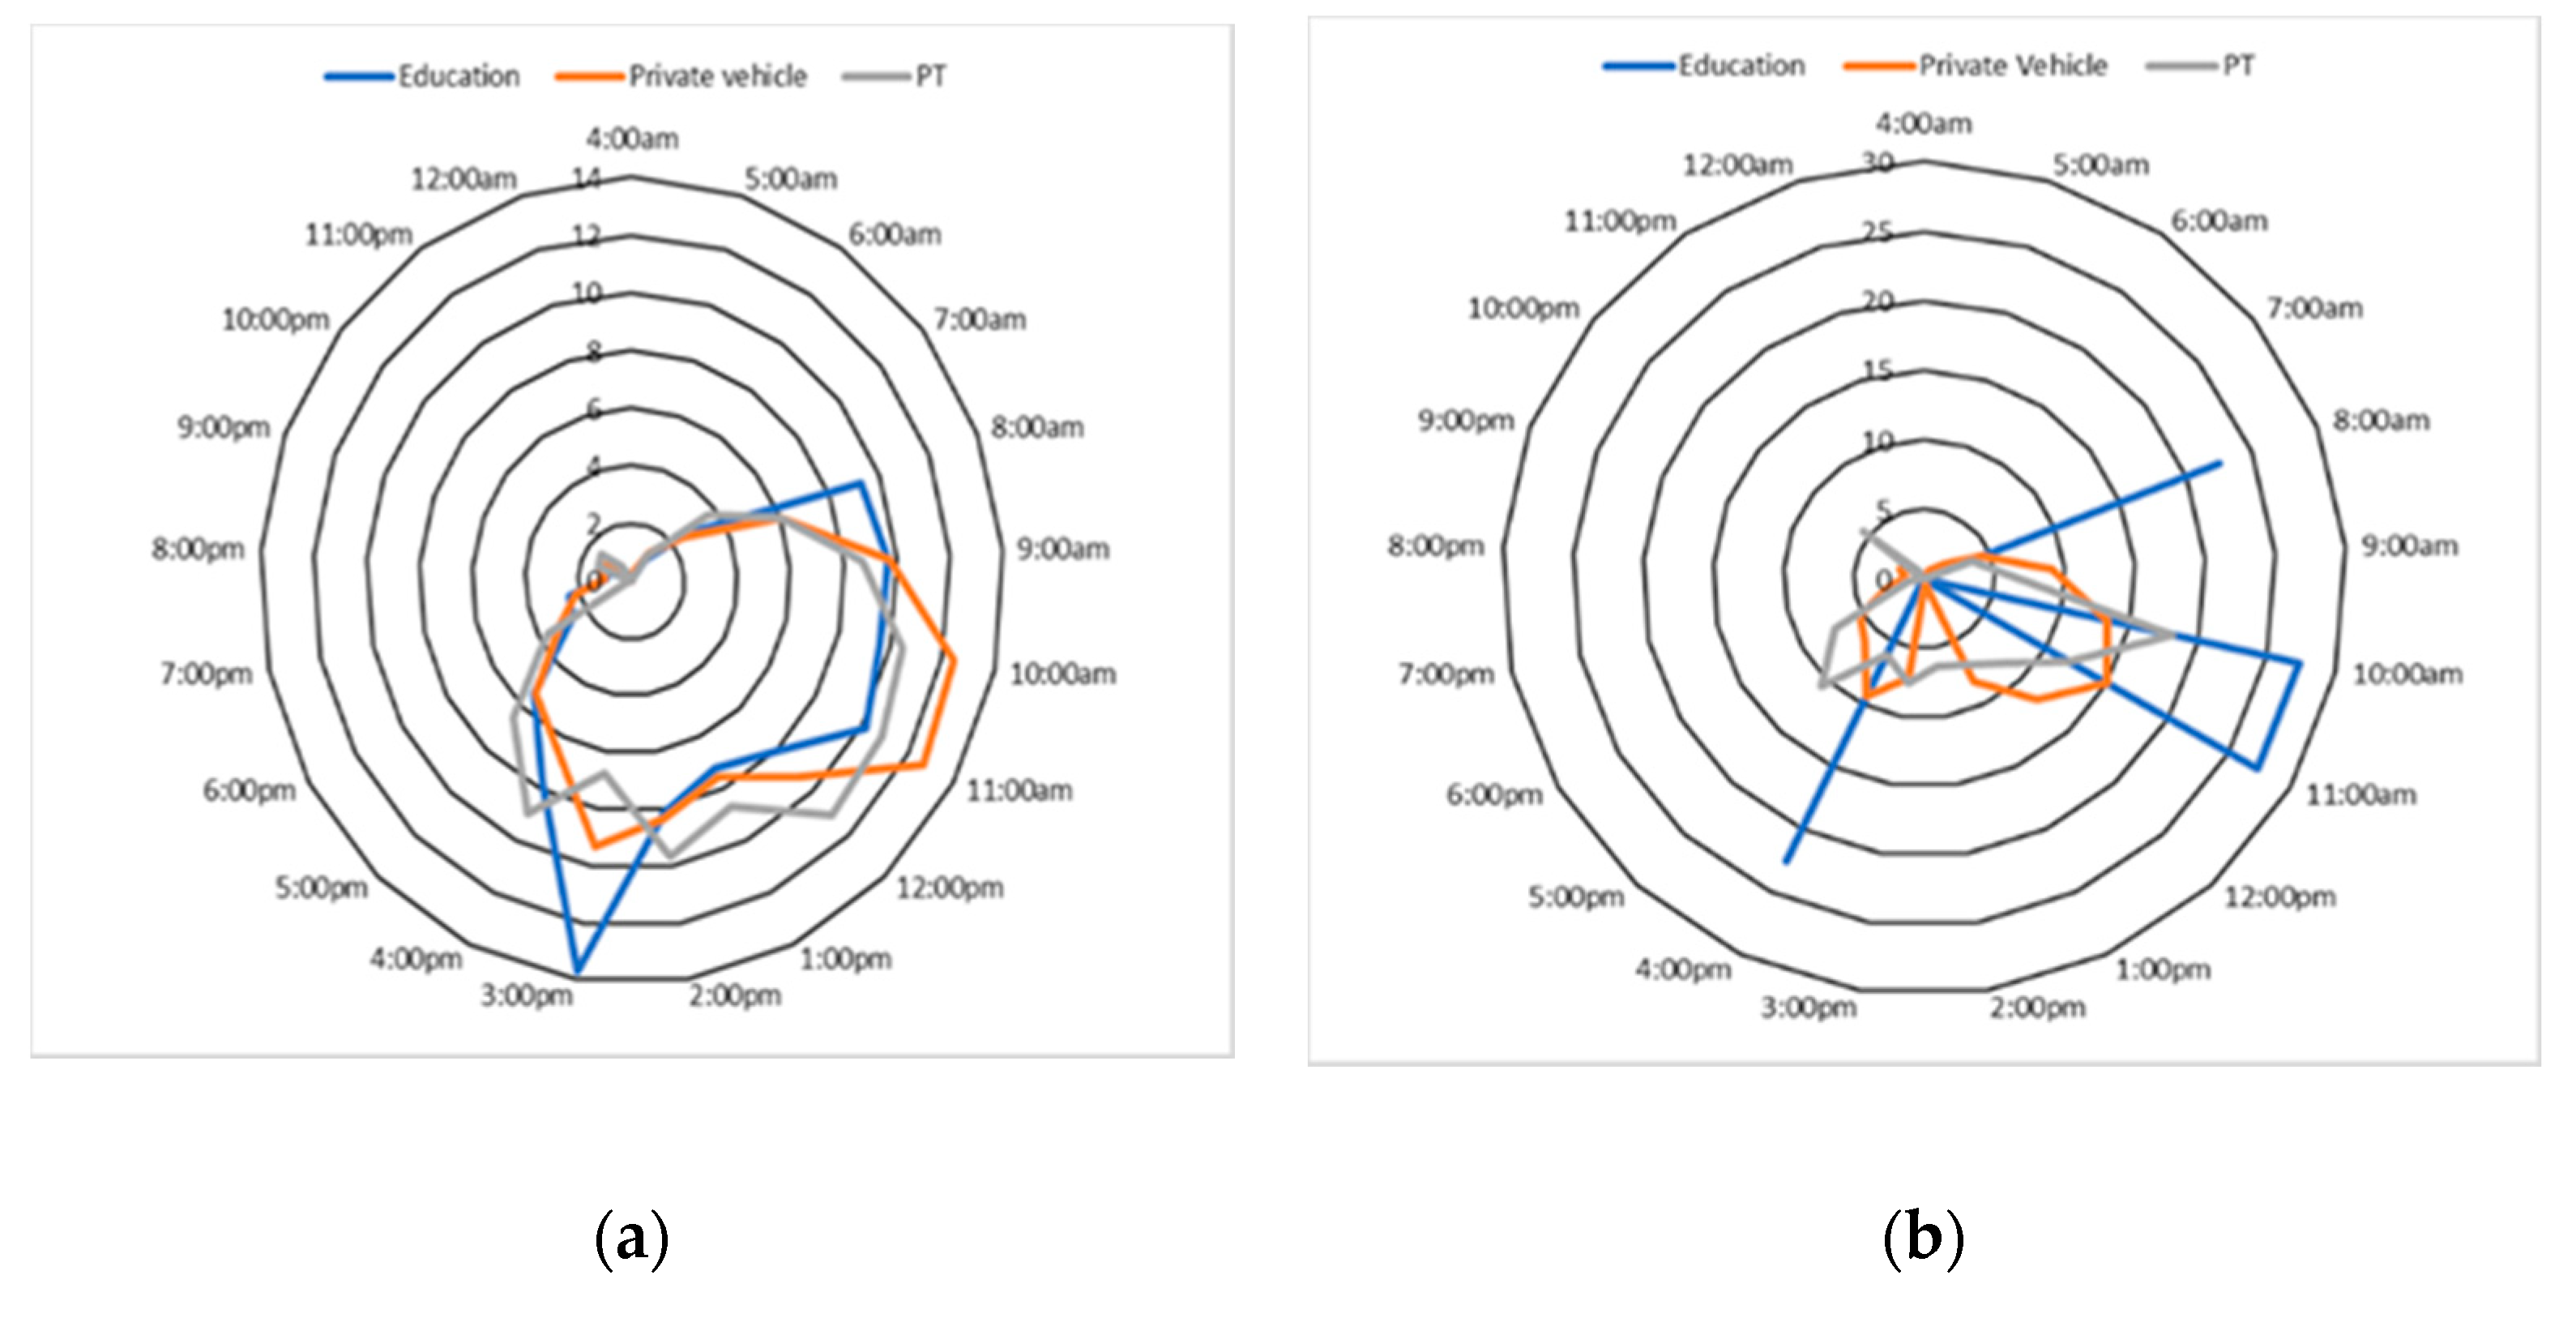
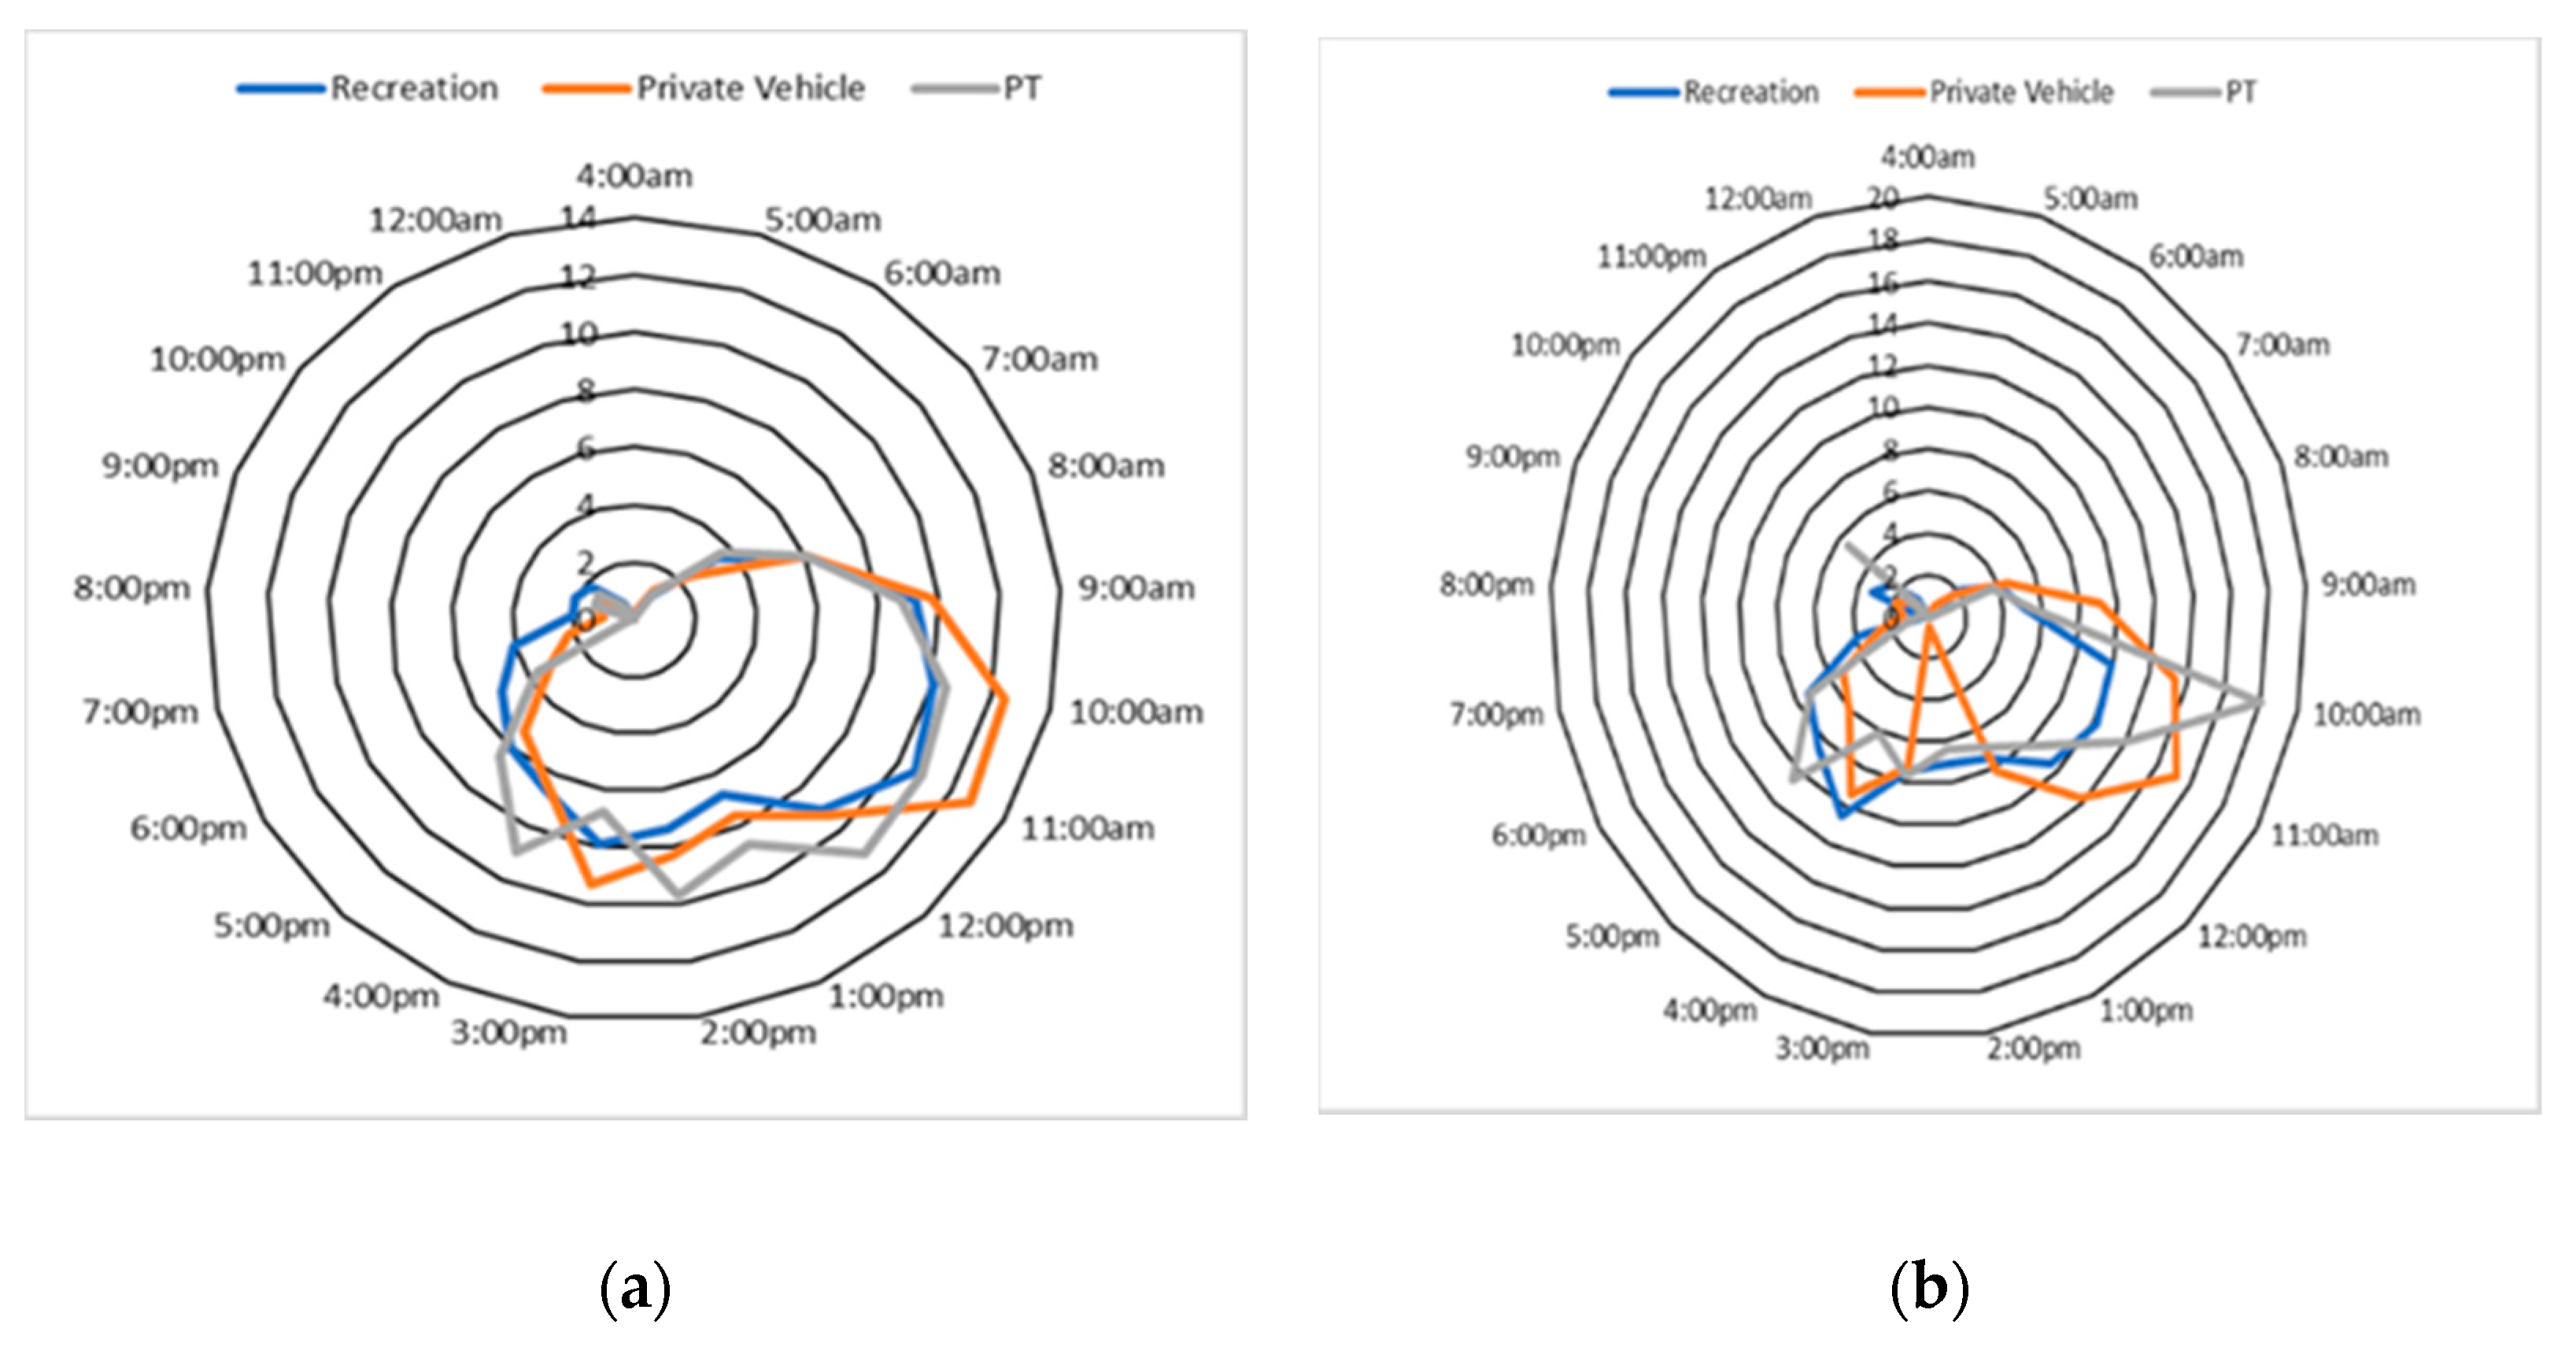
5.2. Temporal Analysis

A time data analysis result is presented in Table 2. Table 2 presents the elderly transport mode preference in percentage and the trip purpose. For both weekdays and weekends, the result shows a similar pattern. The time group indicates the trip duration. The entire time group is divided into four classifications. Time group one is the travel duration between ‘0–9’ min, time group two is ‘10–24’ min, time group three represents ‘25–44’ min of travel, and more than 45 min trip duration is classified as group four. For each POI, the relation between trip duration and transport mode preference is observed considering weekdays and weekends.
From Table 2, the private transport preference rate increases with the increase in trip duration. For a trip destination of shopping centres, the elderly prefer private transport modes if the trip duration is between ‘0–9’or ‘24–44’ min. However, public transport preference for education and recreation centres is very low (in some cases less than 1%) among the elderly. Moreover, the elderly have a lower percentage of private transport usage for both education and recreation centres, specifically for time groups 1 and 2. In these two-time groups, the elderly probably use walking (or other modes of transportation, VISTA 2016) as a mode of transport since the trip duration is comparatively shorter. However, the elderly PT usage decrease for all three POIs for any trip durations at weekends.
Temporal distribution analysis based on time of the days, travel purposes and transport mode preferences are presented in Figure 4, Figure 5 and Figure 6. The analysis results are separated according to weekdays and weekends. From Figure 4 and for the shopping trip purpose, the highest amount of elderly travel occurred between 10:00 a.m. and 11:00 a.m. on both weekdays and weekends. On weekdays, the elderly mostly travel to shopping centres using a private mode of transport over PT. However, over weekends and between 10:00 a.m. and 11:00 a.m., the elderly prefer PT as a transport mode. A similar pattern can be observed for trips to shopping centres from 5:00 p.m. to 6:00 p.m. over weekends. During this time of the day, the elderly choose PT over the private transport mode between 5:00 p.m. and 6:00 p.m.
Figure 5 illustrates the relationship between the time of the day, travel to education centres, and transport mode preference.
The highest amount of elderly travel towards education centres mainly occurs between 2:00 p.m. and 3:00 p.m. during weekdays. Similar to shopping trips, the elderly’s first preference for travels to education centres is private vehicles. However, a significant percentage of elderly choose PT for the trip time range of 12:00 p.m. to 2:00 p.m. During the weekend, education trips mainly occur between 10:00 a.m., and 11:00 a.m. Although, around 10:00 a.m. and 6:00 p.m., the elderly prefer PT over private vehicles.
Figure 6 illustrates the relationship between time of the day, travels to recreation centres, and transport mode preference. From Table 2, the elderly mostly choose private vehicles for travels with recreation purposes during weekday and weekends. However, if the trip time (weekdays) is between 12:00 p.m. and 2:00 p.m., there is a greater possibility to choose PT than the private mode. Similarly, over weekends, if the recreation travels happen around 5:00 p.m., the elderly prefer PT for mobility. Furthermore, during weekends, the elderly like PT for recreation travels between 10:00 a.m. and 11:00 a.m.
Table 3 compares female and male transport mode preferences (in numbers) during weekdays and weekends. According to Table 3, the female elderly has slightly higher PT preference than the male elderly during weekdays.

5.3. Discussion

This research identifies spatial and temporal dependencies between the elderly mode preference (specifically PT), trip time, and neighbourhood areas. According to the results, the reliance is greater mostly during the morning peak time (between 10:00 a.m. and 11:00 a.m.) or afternoon (between 5:00 p.m. and 6:00 p.m.). In addition, lower trip duration has a strong correlation with choosing PT over the private mode of transport. However, these results vary depending on trip purposes. In travel to shopping centres, the elderly mostly prefer private mode over PT for both weekdays and weekends. To reach shopping centres, the elderly might need to change PT mode (such as buses and trams) as the destination might not be directly reachable. This might be one of the reasons the elderly prefer private transport to PT during a shopping centre trip. In addition, the type of shopping trips can influence the elderly’s transport mode preference. For example, if the elderly are planning grocery or heavy items, they might prefer driving or other private vehicles (taxi/Uber). During the weekend, the elderly sometimes choose PT over private vehicles depending on trip time and trip duration. However, this pattern is mainly observed in the inner parts of the Greater Melbourne neighbourhood. There may be a correlation between PT service availability and usage. There is a greater possibility of having a positive correlation between the demand and supply of the PT system/network for this specific travel time.
For the education and recreation centres trips, the elderly mode preference is slightly different from the shopping centre travel behaviour. The private vehicle usage percentage is lower than the shopping centre travel, specifically in short distances. Most of the trips with educational purpose and travels to recreation centres are closer to the origin point (home/start point). These two destination types are sometimes can be covered by walking. This might be a reason for the low percentage of using private vehicles by the elderly. From Figure 5b, the elderly highly use PT around morning and afternoon peak to reach education centres on the weekend.
It should be noted that some extra activities over the weekend are also considered as trips with an educational purpose. The elderly are often involved with these types of activity. The reason to choose PT as a transport mode may be the location of the activity/destination. From the spatial analysis results (Figure 7b), inner Melbourne has higher PT usage and higher PT access/coverage (Figure 1 and Figure 2). There is a higher possibility of having a flexible and comfortable journey with lesser waiting time during weekend educational trips (between 10:00 a.m. and 11:00 a.m.; and 5:00 p.m. to 6:00 p.m.). In addition, from Table 2, weekends’ private transport usage is slightly lower than weekdays for trips to education centres. For trips to recreation centres, a higher percentage of elderly choose PT in the middle of the day on weekdays. Like shopping centre travel, PT timetable and access may match the elderly travel demand to recreation trips. Elderly trip behaviour does not differ in gender. Both female and male elderly have similar travel patterns and transport mode preferences towards various destinations.

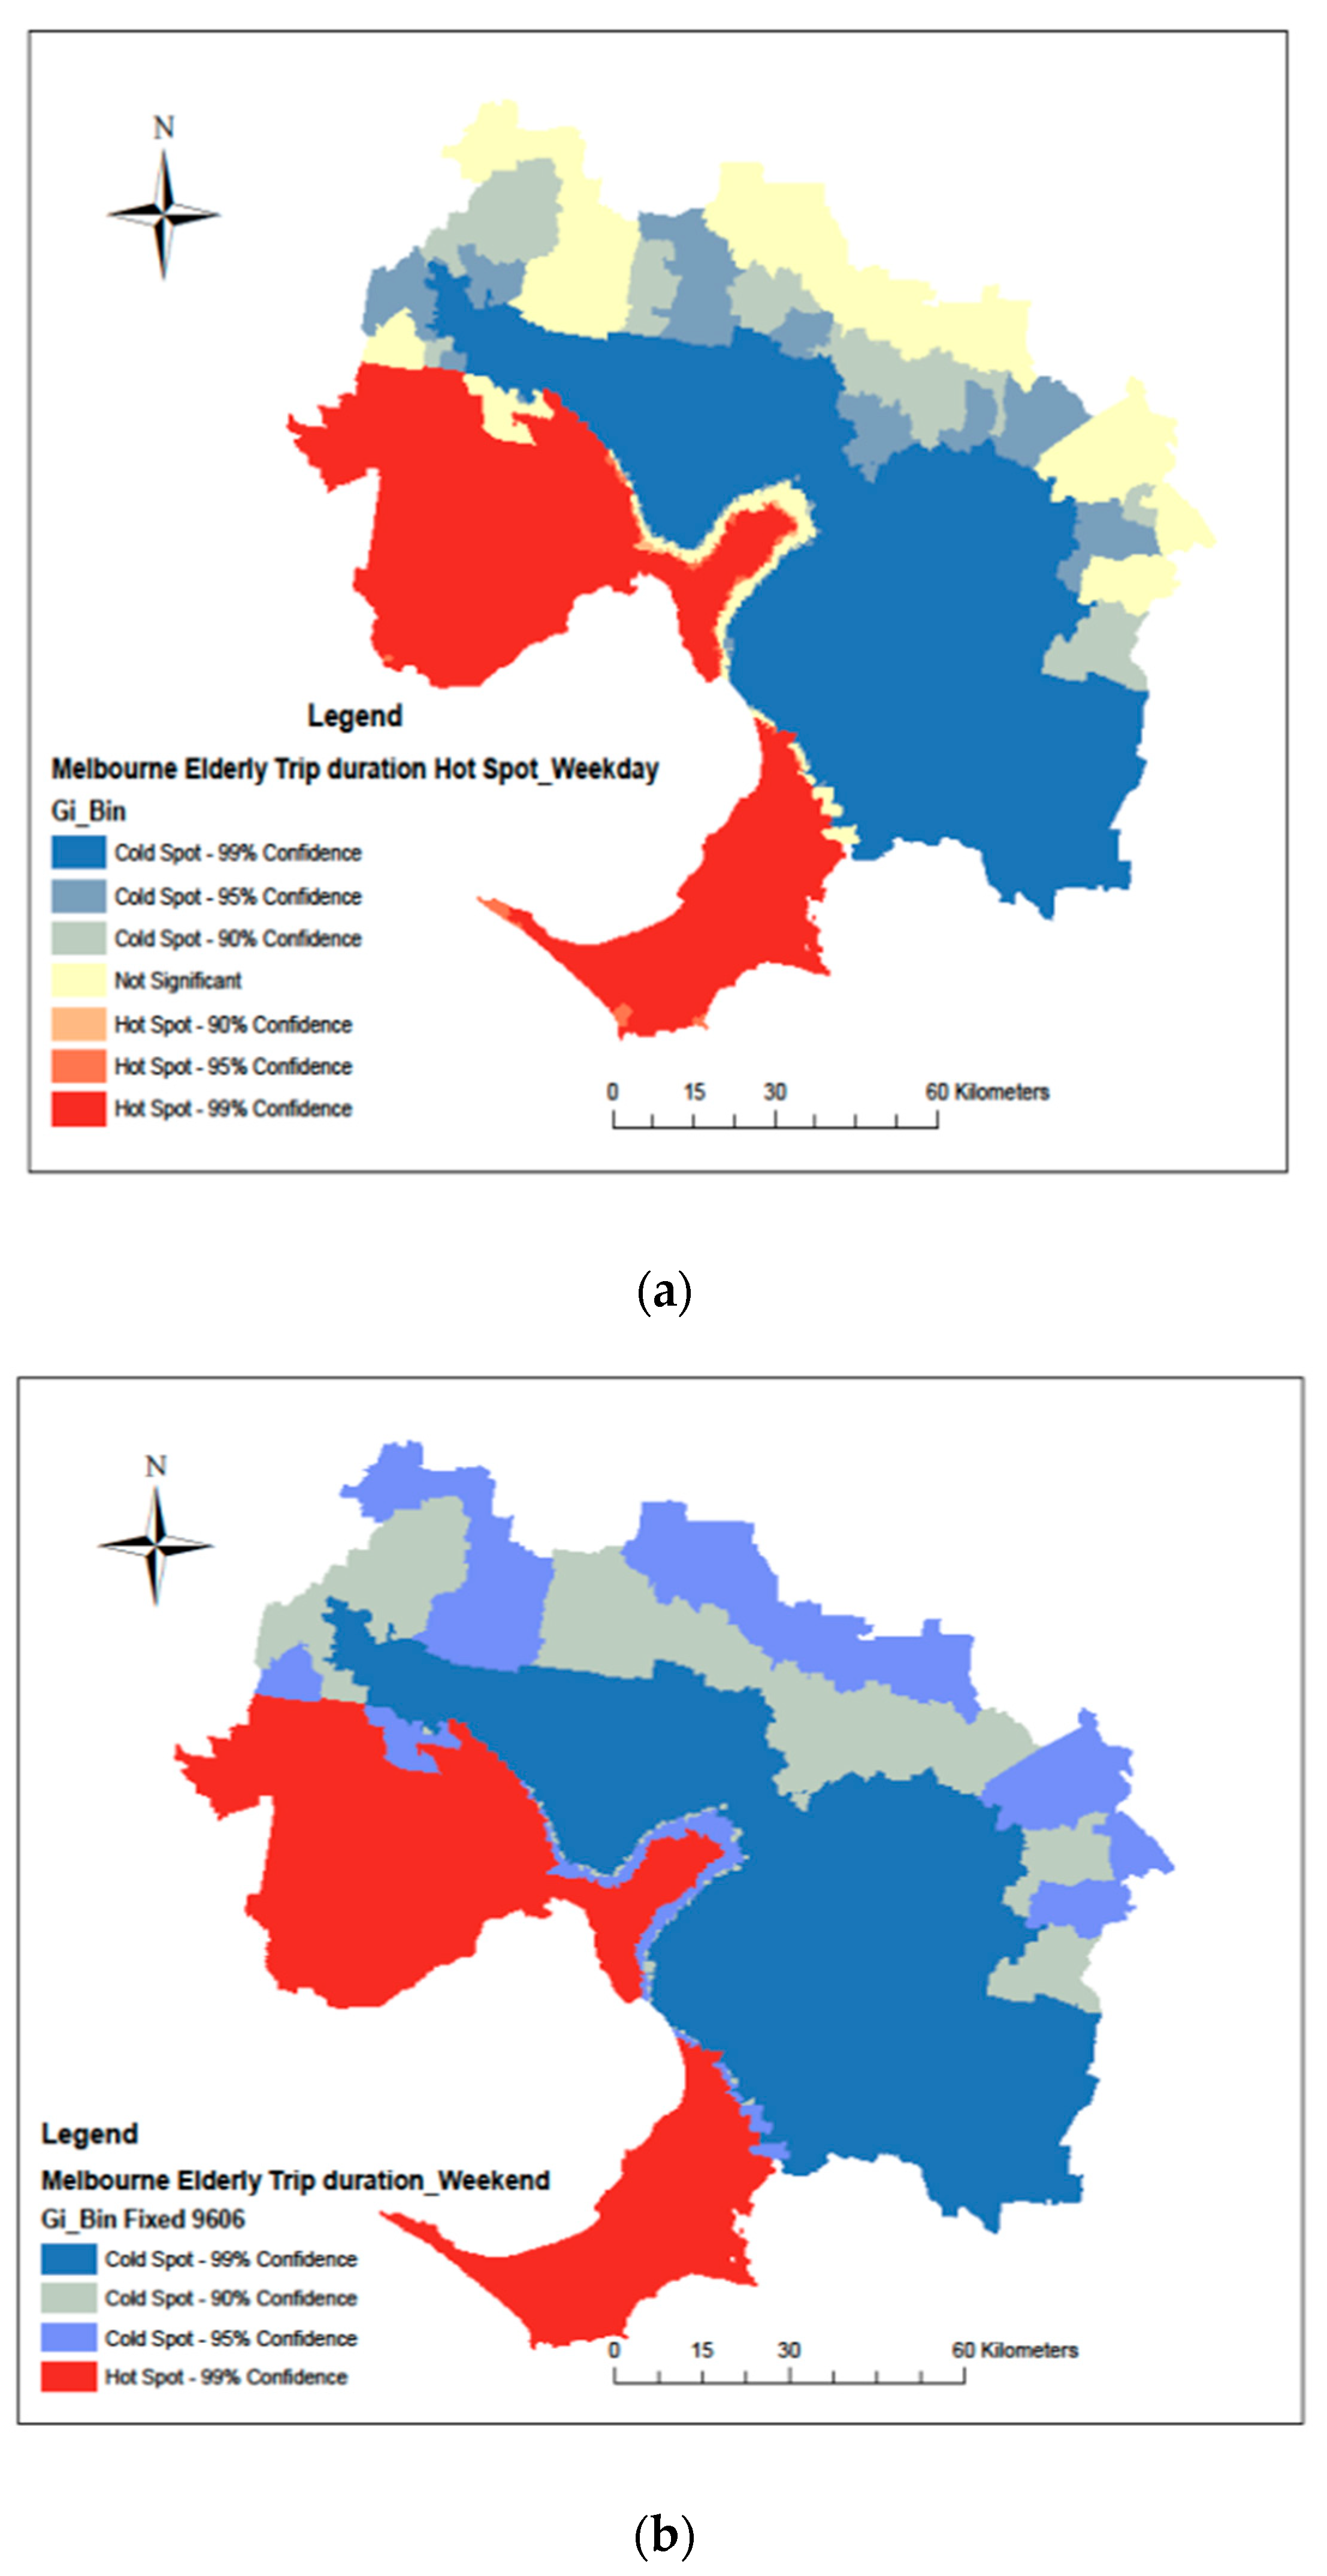
5.4. Spatial Analysis

Cluster mapping techniques often used to identify distribution/coverage patterns of specific variables. Many studies use ArcMap to analyse cluster mapping. In this study, a hotspot analysis using the Getis–Ord Gi* statistic method is applied to identify the relationship between trip duration and transport mode preference for the elderly. A colour gradient indicates a specific Z-score. Figure 7a,b illustrates the hotspot analysis results using ArcMap statistical tool. The figures represents spatial relation between trip duration, transport mode choice, PT coverage, and greater Melbourne neighbourhood over weekdays/weekends. Figure 7 shows a relationship between trip duration, neighbourhood area/location, and elderly transport mode choice. The cold spots presented in blue-coloured shed represent lower density, while red sheds indicate higher density. According to Figure 6a, the Melbourne elderly select PT as their mode of transport, mainly in inner Melbourne (coloured in a red shed) if the trip duration is between 0–9 and 24–44 min, over weekdays. However, the elderly in Melbourne’s outer neighbourhood has almost no preference for PT usage during weekday travels. The elderly in Melbourne’s middle parts have a higher interest in the private vehicle for specific trip durations.
Furthermore, weekend travels show a similar pattern to weekday travel. Figure 6b illustrates elderly weekend travel density, comparing trip duration and transport mode preferences. Similar to weekdays, the elderly in the inner Melbourne neighbourhood prefer public transport for specific trip durations. The density pattern changed in outer Melbourne neighbourhoods, where PT coverage is lower.

6. Conclusions and Future Research

The explanation of travel demand and service analysis is not always straight forward [75,76]. This paper analysed the elderly travel behaviour with time and neighbourhood spatial access to observe the objectives. The household trip survey information is used to analyse the elderly trip patterns and behaviour. The hotspot analysis method is adopted to identify elderly spatial travel and transport mode preferences. Greater Melbourne is considered as a case study to observe the travel. The results show that elderly travel behaviour is not consistent for all trip purposes. If the trip destination is close to the trip origin, the elderly sometimes avoid private vehicles. The preference for transport mode choice pattern is related in both weekdays and weekends for all trip purposes.
Moreover, the trip time of the day and trip duration has a significant influence on the elderly’ preferred transport mode towards POIs, specifically for PT. Based on the temporal analysis results, it can be identified that the elderly show a substantial interest in PT usage towards various destinations. If the PT is available and accessible, the elderly are more likely to use this mode of transport for longer trip durations. The spatial–temporal analysis results can be used for future planning and implementation for transport network design, future PT route design, and timetable distribution. To encourage the elderly with PT usage, transport network and, more specifically, the bus network can be designed and modified according to the travel patterns and travel behaviour. For example, a separate bus service can be scheduled for the elderly based on the travel time (time of the day) or PT usage within a travelled area. Several researchers introduced demand- and response-based transport models all around the world [77,78,79]. However, the influence of gender over spatial and temporal travel behaviour could not be identified from the available datasets. More specific data collection can be done to conduct elderly gender-based cluster travel behaviour in future research. Moreover, this study did not analyse older commuters’ walking and private transport preferences. This study also focused on three trip purposes. The current study can be extended by considering the other trip purposes for the elderly.

Author Contributions

Conceptualization, K.F. and S.M.; methodology, K.F.; software, K.F.; validation, K.F., S.M., and T.S.; formal analysis, K.F.; investigation, K.F. and S.M.; resources, K.F. and T.S.; data curation, K.F.; writing—original draft preparation, K.F.; writing—review and editing, K.F.; S.M. and T.S.; supervision, S.M. and T.S. All authors have read and agreed to the published version of the manuscript.

Funding

No external funding is provided for this research.

Institutional Review Board Statement

Not applicable.

Informed Consent Statement

Not applicable.

Data Availability Statement

Household survey datasets are considered for this study. A detailed survey by the Victorian Integrated Survey of Travel and Activity (VISTA) (2016)is used to analysed and evaluate the results. [https://transport.vic.gov.au/about/data-and-research/vista (2018)].

Acknowledgments

The authors would like to express special thanks to RMIT University, specifically the IT staff. Their continuous support during the pandemic situation is appreciated. The authors are also grateful to the administration staff at RMIT University for their ongoing support.

Conflicts of Interest

The authors declare no conflict of interest.

References

  1. United Nations, Department of Economic and Social Affairs, Population Division. World Population Ageing 2017-Highlights (ST/ESA/SER.A/397); United Nations, Department of Economic and Social Affairs, Population Division: New York, NY, USA, 2017. [Google Scholar]
  2. Meyer, M.D.; Miller, E.J. Urban Transportation Planning, 2nd ed.; McGraw Hill: New York, NY, USA, 2001. [Google Scholar]
  3. Shrestha, B.P.; Millonig, A.; Hounsell, N.B.; McDonald, M. Review of Public Transport Needs of Older People in European Context. J. Popul. Ageing 2017, 10, 343–361. [Google Scholar] [CrossRef] [Green Version]
  4. Acker, V.V.; Goodwin, P.; Witlox, F. Key research themes on travel behavior, lifestyle, and sustainable urban mobility. Int. J. Sustain. Transp. 2016, 10, 25–32. [Google Scholar] [CrossRef]
  5. Metz, D. Transport policy for an ageing population. Transp. Rev. 2003, 23, 375–386. [Google Scholar] [CrossRef]
  6. Lee, S.G.; Hickman, M. Trip purpose inference using automated fare collection data. Public Transp. 2014, 6, 1–20. [Google Scholar] [CrossRef]
  7. Alexander, L.; Jiang, S.; Murga, M.; González, M.C. Origin–destination trips by purpose and time of day inferred from mobile phone data. Transp. Res. Part C Emerg. Technol. 2015, 58, 240–250. [Google Scholar] [CrossRef]
  8. Daraio, C.; Diana, M.; Di Costa, F.; Leporelli, C.; Matteucci, G.; Nastasi, A. Efficiency and effectiveness in the urban public transport sector: A critical review with directions for future research. Eur. J. Oper. Res. 2016, 248, 1–20. [Google Scholar] [CrossRef] [Green Version]
  9. Higgs, G. A Literature Review of the Use of GIS-Based Measures of Access to Health Care Services. Heal. Serv. Outcomes Res. Methodol. 2004, 5, 119–139. [Google Scholar] [CrossRef]
  10. Fisher, R.; Lassa, J. Interactive, open source, travel time scenario modelling: Tools to facilitate participation in health service access analysis. Int. J. Health Geogr. 2017, 16, 13. [Google Scholar] [CrossRef] [Green Version]
  11. UNCHS. Indicators Programme: Monitoring Human Settlements: Urban Indicators Worksheet; Centre for Human Settlements, United Nations: New York, NY, USA, 1995; Volume 2. [Google Scholar]
  12. Scheiner, J. Social inequalities in travel behaviour: Trip distances in the context of residential self-selection and lifestyles. J. Transp. Geogr. 2010, 18, 679–690. [Google Scholar] [CrossRef]
  13. Wong, R.; Szeto, W.; Yang, L.; Li, Y.; Wong, S. Public transport policy measures for improving elderly mobility. Transp. Policy 2018, 63, 73–79. [Google Scholar] [CrossRef] [Green Version]
  14. Borst, H.C.; Vries, S.I.; Graham, J.M.A.; van Dongen, J.E.F.; Bakker, I.; Miedema, H.M.E. Influence of environmental street characteristics on walking route choice of elderly people. J. Environ. Psychol. 2009, 29, 477–484. [Google Scholar] [CrossRef]
  15. Pettersson, P.; Schmöcker, J.-D. Active ageing in developing countries?–trip generation and tour complexity of older people in Metro Manila. J. Transp. Geogr. 2010, 18, 613–623. [Google Scholar] [CrossRef] [Green Version]
  16. Truong, L.T.; Somenahalli, S.V.C. Exploring frequency of public transport use among older adults: A study in Adelaide, Australia. Travel Behav. Soc. 2015, 2, 148–155. [Google Scholar] [CrossRef]
  17. Adorno, G.; Fields, N.; Cronley, C.; Parekh, R.; Magruder, K. Ageing in a low-density urban city: Transportation mobility as a social equity issue. Ageing Soc. 2018, 38, 296–320. [Google Scholar] [CrossRef]
  18. Cui, J.; Loo, B.P.; Lin, N. Travel behaviour and mobility needs of older adults in an ageing and car-dependent society. Int. J. Urban Sci. 2017, 21, 109–128. [Google Scholar] [CrossRef]
  19. Fatima, K.; Moridpour, S.; De Gruyter, C.; Saghapour, T. Elderly Sustainable Mobility: Scientific Paper Review. Sustainability 2020, 12, 7319. [Google Scholar] [CrossRef]
  20. Zhou, Y.; Yuan, Q.; Yang, C. Transport for the Elderly: Activity Patterns, Mode Choices, and Spatiotemporal Constraints. Sustainability 2020, 12, 10024. [Google Scholar] [CrossRef]
  21. Chaisomboon, M.; Jomnonkwao, S.; Ratanavaraha, V. Elderly Users’ Satisfaction with Public Transport in Thailand Using Different Importance Performance Analysis Approaches. Sustainability 2020, 12, 9066. [Google Scholar] [CrossRef]
  22. McIntosh, G.; Phillips, J. Caring for the Elderly’—An Overview of Aged Care Support and Services in Australia. 2003. Available online: https://www.aph.gov.au/About_Parliament/Parliamentary_Departments/Parliamentary_Library/Publications_Archive/archive/agedcare (accessed on 16 March 2021).
  23. Martin, P. Individual and social resources predicting well-being and functioning in the later years: Conceptual models, research and practice. Age Int. 2002, 27, 3–29. [Google Scholar] [CrossRef]
  24. Phelan, E.A.; Anderson, L.A.; Lacroix, A.Z.; Larson, E.B. Older adults’ views of “successful aging”—How do they compare with researchers’ definitions? J. Am. Geriatr. Soc. 2004, 52, 211–216. [Google Scholar] [CrossRef]
  25. Vaillant, G.E. Aging Well: Surprising Guideposts to a Happier Life from the Landmark Study of Adult Development; Little, Brown: Boston, MA, USA, 2008. [Google Scholar]
  26. Collia, D.V.; Sharp, J.; Giesbrecht, L. The 2001 National Household Travel Survey: A look into the travel patterns of older Americans. J. Saf. Res. 2003, 34, 461–470. [Google Scholar] [CrossRef] [PubMed]
  27. Hu, X.; Wang, J.; Wang, L. Understanding the Travel Behavior of Elderly People in the Developing Country: A Case Study of Changchun, China. Procedia-Soc. Behav. Sci. 2013, 96, 873–880. [Google Scholar] [CrossRef] [Green Version]
  28. Hwang, H.L.; Wilson, D.W.; Reuscher, T.; Yang, J.; Taylor, R.D.; Chin, S.M. Travel Patterns and Characteristics of Elderly Subpopulation in New York State; Oak Ridge National Lab, ORNL: Oak Ridge, TN, USA, 2015. [Google Scholar]
  29. Szeto, W.; Yang, L.; Wong, R.; Li, Y.; Wong, S. Spatio-temporal travel characteristics of the elderly in an ageing society. Travel Behav. Soc. 2017, 9, 10–20. [Google Scholar] [CrossRef] [Green Version]
  30. Alsnih, R.; Hensher, D.A. The mobility and accessibility expectations of seniors in an aging population. Transp. Res. Part A Policy Pr. 2003, 37, 903–916. [Google Scholar] [CrossRef]
  31. Banister, D.; Bowling, A. Quality of life for the elderly: The transport dimension. Transp. Policy 2004, 11, 105–115. [Google Scholar] [CrossRef]
  32. Burnett, P.; Lucas, S. Talking, walking, riding and driving: The mobilities of older adults. J. Transp. Geogr. 2010, 18, 596–602. [Google Scholar] [CrossRef]
  33. Hjorthol, R.J.; Levin, L.; Sirén, A. Mobility in different generations of older persons: The development of daily travel in different cohorts in Denmark, Norway and Sweden. J. Transp. Geogr. 2010, 18, 624–633. [Google Scholar] [CrossRef]
  34. Musselwhite, C.; Haddad, H. Mobility, accessibility and quality of later life. Qual. Ageing Older Adults 2010, 11, 25–37. [Google Scholar] [CrossRef] [Green Version]
  35. Merlin, L.A. A portrait of accessibility change for four US metropolitan areas. J. Transp. Land Use 2016, 10, 309–336. [Google Scholar] [CrossRef] [Green Version]
  36. Handy, S.L.; Niemeier, D.A. Measuring Accessibility: An Exploration of Issues and Alternatives. Environ. Plan A Econ. Space 1997, 29, 1175–1194. [Google Scholar] [CrossRef]
  37. Yildirimoglu, M.; Geroliminis, N. Experienced travel time prediction for congested freeways. Transp. Res. Part B Methodol. 2013, 53, 45–63. [Google Scholar] [CrossRef] [Green Version]
  38. Tao, S.; Rohde, D.; Corcoran, J. Examining the spatial–temporal dynamics of bus passenger travel behaviour using smart card data and the flow-map. J. Transp. Geogr. 2014, 41, 21–36. [Google Scholar] [CrossRef]
  39. Fransen, K.; Farber, S.; Deruyter, G.; De Maeyer, P. A spatio-temporal accessibility measure for modelling activity participation in discretionary activities. Travel Behav. Soc. 2018, 10, 10–20. [Google Scholar] [CrossRef]
  40. Kamruzzaman, M.; De Vos, J.; Currie, G.; Giles-Corti, B.; Turrell, G. Spatial biases in residential mobility: Implications for travel behaviour research. Travel Behav. Soc. 2020, 18, 15–28. [Google Scholar] [CrossRef]
  41. Habib, K.N. An investigation on mode choice and travel distance demand of older people in the National Capital Region (NCR) of Canada: Application of a utility theoretic joint econometric model. Transportation 2015, 42, 143–161. [Google Scholar] [CrossRef]
  42. Moniruzzaman, M.; Paez, A.; Habib, K.M.N.; Morency, C. Mode use and trip length of seniors in Montreal. J. Transp. Geogr. 2013, 30, 89–99. [Google Scholar] [CrossRef]
  43. Morency, C.; Paez, A.; Roorda, M.J.; Mercado, R.; Farber, S. Distance traveled in three Canadian cities: Spatial analysis from the perspective of vulnerable population segments. J. Transp. Geogr. 2011, 19, 39–50. [Google Scholar] [CrossRef]
  44. Schmöcker, J.-D.; Quddus, M.A.; Noland, R.B.; Bell, M.G. Mode choice of older and disabled people: A case study of shopping trips in London. J. Transp. Geogr. 2008, 16, 257–267. [Google Scholar] [CrossRef] [Green Version]
  45. Mercado, R.G.; Páez, A.; Scott, D.M.; Newbold, K.B.; Kanaroglou, P. Transportation in aging societies: An international comparison and implications for Canada. Open Transp. J. 2007, 1, 1–13. [Google Scholar] [CrossRef]
  46. Paez, A.; Scott, D.; Potoglou, D.; Kanaroglou, P.; Newbold, K.B. Elderly mobility: Demographic and spatial analysis of trip making in the Hamilton CMA, Canada. Urban Stud. 2007, 44, 123–146. [Google Scholar] [CrossRef]
  47. Sylvia, Y.H.; Yannie, H.Y.; Cheung, S.T. Travel mobility and social participation among older people in a transit metropolis: A socio-spatial-temporal perspective. Transp. Res. Part A 2018, 118, 608–626. [Google Scholar]
  48. He, W.; Goodkind, D.; Kowal, P. An Aging World: 2015, International Population Reports; U.S. Government Publishing Office: Washington, DC, USA, 2016; Volume 16, p. 95. [Google Scholar]
  49. Kim, S. Transportation Alternatives of the Elderly after Driving Cessation. Transp. Res. Rec. J. Transp. Res. Board 2011, 2265, 170–176. [Google Scholar] [CrossRef]
  50. Böcker, L.; Thorsson, S. Integrated Weather Effects on Cycling Shares, Frequencies, and Durations in Rotterdam, the Netherlands. Weather. Clim. Soc. 2014, 6, 468–481. [Google Scholar] [CrossRef]
  51. Liu, C.; Bardaka, E.; Palakurthy, R.; Tung, L.-W. Analysis of travel characteristics and access mode choice of elderly urban rail riders in Denver, Colorado. Travel Behav. Soc. 2020, 19, 194–206. [Google Scholar] [CrossRef]
  52. Cheng, L.; Chen, X.; Yanga, S.; Caob, Z.; Vos, J.D.; Witlox, F. Active travel for active ageing in China: The role of built environment. J. Transp. Geogr. 2019, 76, 142–152. [Google Scholar] [CrossRef]
  53. Yang, S.; Fan, Y.; Deng, W.; Cheng, L. Do built environment effects on travel behavior differ between household members? A case study of Nanjing, China. Transp. Policy 2019, 81, 360–370. [Google Scholar] [CrossRef]
  54. Mifsud, D.; Attard, M.; Ison, S. To drive or to use the bus? An exploratory study of older people in Malta. J. Transp. Geogr. 2017, 64, 23–32. [Google Scholar] [CrossRef] [Green Version]
  55. Ewing, R.; Cervero, R. Travel and the built environment: A meta-analysis. J. Am. Plan. Assoc. 2010, 76, 265–294. [Google Scholar] [CrossRef]
  56. Kim, S.; Ulfarsson, G.F. Travel Mode Choice of the Elderly: Effects of Personal, Household, Neighborhood, and Trip Characteristics. Transp. Res. Rec. J. Transp. Res. Board 2004, 1894, 117–126. [Google Scholar] [CrossRef]
  57. Schwanen, T.; Dijst, M.; Dieleman, F.M. Leisure trips of senior citizens: Determinants of modal choice. J. Econ. Hum. Geogr. 2001, 92, 347–360. [Google Scholar] [CrossRef]
  58. Somenahalli, S.V.C.; Taylor, M.A.P. Ageing and transport: Mobility issues-a case study for Adelaide. In Proceedings of the 3rd State of Australian Cities National Conference, Adelaide, Australia, 28–30 November 2007. [Google Scholar]
  59. Somenahalli, S.; Hayashi, Y.; Taylor, M. Accessible transportation and mobility issues of elderly—How does Australia compare with Japan? J. Sustain. Urban. Plan. Prog. 2016, 1, 31–43. [Google Scholar] [CrossRef]
  60. Lin, T.G.; Xia, J.C.; Robinson, T.P.; Goulias, G.K.; Church, L.R.; Olaru, D.; Tapin, J.; Han, R. Spatial analysis of access to and accessibility surrounding train stations: A case study of accessibility for the elderly in Perth, Western Australia. J. Transp. Geogr. 2014, 39, 111–120. [Google Scholar] [CrossRef] [Green Version]
  61. Shao, F.; Sui, Y.; Yu, X.; Sun, R. Spatio-temporal travel patterns of elderly people–A comparative study based on buses usage in Qingdao, China. J. Transp. Geogr. 2019, 76, 178–190. [Google Scholar] [CrossRef]
  62. Australian Bureau of Statistics (ABS). Australian Historical Population Statistics, 2014; ABS Cat. No. 3105.0.65.001; ABS: Canberra, Australia, 2014. [Google Scholar]
  63. Australian Bureau of Statistics (ABS). ABS Census of Population and Housing. Available online: https://quickstats.censusdata.abs.gov.au/census_services/getproduct/census/2016/quickstat/2?opendocument (accessed on 16 March 2021).
  64. Robert, S.; Schönfelder, S.; Susan, H.; Kay, W.A. Structures of Leisure Travel: Temporal and Spatial Variability. Transp. Rev. 2004, 24, 219–237. [Google Scholar]
  65. Yusak, O.S.; Ryuichi, K. Analysis of Day-to-Day Variability in an Individual’s Action Space: Exploration of 6-Week Mobidrive Travel Diary Data. Transp. Res. Rec. J. 2005, 1902, 124–133. [Google Scholar] [CrossRef]
  66. Victorian Integrated Survey of Travel and Activity (VISTA); Department of Transport: Melbourne, Australia, 2016. Available online: https://transport.vic.gov.au/about/data-and-research/vista (accessed on 16 March 2021).
  67. Australian Urban Research Infrastructure Network (AURIN). Available online: https://aurin.org.au/ (accessed on 16 March 2021).
  68. Chu, K.; Chapleau, R. Augmenting transit trip characterisation and travel behaviour Comprehension. Transp. Res. Board 2010, 2183, 29–40. [Google Scholar] [CrossRef]
  69. Trépanier, M.; Tranchant, N.; Chapleau, R. Individual trip destination estimation in a transit smart card automated fare collection system. J. Intell. Transp. Syst. 2007, 11, 1–14. [Google Scholar] [CrossRef]
  70. Agard, B.; Morency, C.; Trépanier, M. Mining smart card data from an urban transit network. In Encyclopedia of Data Warehouse and Mining (Second edition). Information Science Reference; Information Science, IGI Global: Hershey, PA, USA, 2009; pp. 1292–1302. [Google Scholar]
  71. Ding, L.; Zhang, N. A Travel Mode Choice Model Using Individual Grouping Based on Cluster Analysis. Procedia Eng. 2016, 137, 786–795. [Google Scholar] [CrossRef] [Green Version]
  72. Sánchez-Martín, J.-M.; Rengifo-Gallego, J.-I.; Blas-Morato, R. Hot Spot Analysis versus Cluster and Outlier Analysis: An Enquiry into the Grouping of Rural Accommodation in Extremadura (Spain). ISPRS Int. J. Geo-Inf. 2019, 8, 176. [Google Scholar] [CrossRef] [Green Version]
  73. Zhao, P.; Bucher, D.; Martin, H.; Raubal, M. A Clustering-Based Framework for Understanding Individuals’ Travel Mode Choice Behavior. In Geospatial Technologies for Local and Regional Development, Proceedings of the International Conference on Geographic Information Science AGILE 2019, Limassol, Cyprus, 17–20 June 2019; Lecture Notes in Geoinformation and Cartography; Kyriakidis, P., Hadjimitsis, D., Skarlatos, D., Mansourian, A., Eds.; Springer: Cham, Germany, 2020; pp. 77–94. [Google Scholar]
  74. ArcGISPro. Available online: https://pro.arcgis.com/en/pro-app/tool-reference/spatial-statistics/h-how-hot-spot-analysis-getis-ord-gi-spatial-stati.htm (accessed on 16 March 2021).
  75. Neutens, T.; Delafontain, M.; Scott, D.M.; Maeyer, D.P. An analysis of day-to-day variations in individual space–time accessibility. J. Transp. Geogr. 2012, 23, 81–91. [Google Scholar] [CrossRef] [Green Version]
  76. Neutens, T. Accessibility, equity and health care: Review and research directions for transport geographers. J. Transp. Geogr. 2015, 43, 14–27. [Google Scholar] [CrossRef]
  77. A Policy Brief from the Policy Learning Platform on Low-Carbon Economy. June 2018. Available online: https://www.interregeurope.eu/fileadmin/user_upload/plp_uploads/policy_briefs/2018-06-27_Policy_Brief_Demand_Responsive_Transport.pdf (accessed on 16 March 2021).
  78. Jittrapirom, P.; van Neerven, W.; Martens, K.; Trampe, D.; Meurs, H. The Dutch elderly’s preferences toward a smart demand-responsive transport service. Res. Transp. Bus. Manag. 2019, 30, 100383. [Google Scholar] [CrossRef]
  79. Lakatos, A.; Tóth, J.; Mándoki, P. Demand Responsive Transport Service of ‘Dead-End Villages’ in Interurban Traffic. Sustainability 2020, 12, 3820. [Google Scholar] [CrossRef]
Figure 1. Public transport coverage in Greater Melbourne.
Sustainability 13 04752 g001
Figure 2. POIs coverage in Greater Melbourne.
Sustainability 13 04752 g002
Figure 3. Methodology for spatial–temporal analysis.
Sustainability 13 04752 g003
Figure 4. Travel time of the day and transport mode preference for shopping centres. (a) Shopping centre travel (weekdays); (b) shopping centre travel (weekends).
Sustainability 13 04752 g004
Figure 5. Travel time of the day and transport mode preference for education centres. (a) Education travel (weekdays); (b) education travel (weekends).
Sustainability 13 04752 g005
Figure 6. Travel time of the day and transport mode preference for recreation centres. (a) Recreation centre travel (weekdays); (b) recreation centre travel (weekends).
Sustainability 13 04752 g006
Figure 7. Spatial distribution of trip time and elderly transport mode preference. (a) Hotspot analysis for mode preference, weekdays. (b) Hotspot analysis for mode preference, weekends.
Sustainability 13 04752 g007
Table 1. Bivariate correlation results.
POIsStatistic DescriptionTrip DurationTime of the DayTrip DurationTime of the Day
WeekdaysWeekends
Shopping CentresPearson correlation (r)0.6310.5310.6610.544
Sig (2-tailed)0.0000.0000.0000.000
Education CentresPearson correlation (r)−0.120−0.231−0.129−0.131
Sig (2-tailed)0.0000.0020.0000.002
Recreation CentresPearson correlation (r)−0.120−0.128−0.114−0.128
Sig (2-tailed)0.0000.0000.0000.000
Total sample size, n = 7029.
Table 2. Summary results of elderly time group and transport mode preferences.
DayPOIsTime Group *Public Transport (%)Private Transport (%)
WeekdayShopping16.085.0
22.090.0
35.091.0
42.097.0
Education11.085.0
21.087.0
32.095.0
42.097.0
Recreation1<1.030.0
21.050.0
31.090.0
41.093.0
WeekendShopping14.094.0
21.098.0
32.095.0
4<1.093.0
Education1<1.092.0
2<1.093.0
3<1.096.0
4<1.096.0
Recreation1<1.087.0
2<1.094.0
3<1.093.0
4<1.096.0
* Time group, 1 = 0−9 min, trip group 2 = 10–24 min, trip group 3 = 25–44 min, and trip group 4 = 44+ min. Total sample size, n = 7029.
Table 3. Transport mode preference based on gender.
DaysGenderPrivate ModePublic Mode
WeekdaysFemale1845166
Male1863120
WeekendFemale56338
Male61943
Total sample, n = 7029.
Publisher’s Note: MDPI stays neutral with regard to jurisdictional claims in published maps and institutional affiliations.

